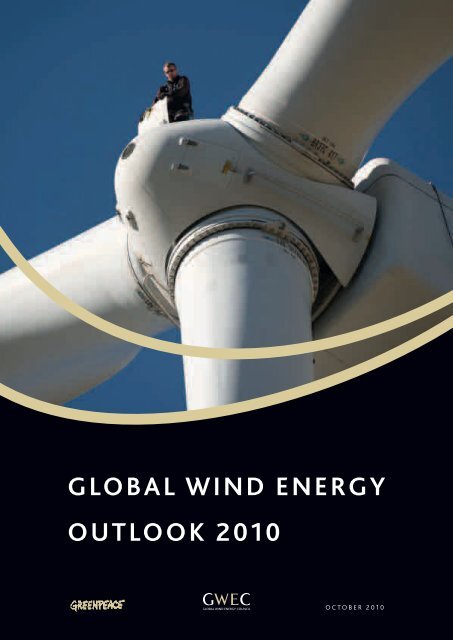
glOBal Wind energy OuTlOOk 2010 - Global Wind Energy Council
glOBal Wind energy OuTlOOk 2010 - Global Wind Energy Council
glOBal Wind energy OuTlOOk 2010 - Global Wind Energy Council

You also want an ePaper? Increase the reach of your titles
YUMPU automatically turns print PDFs into web optimized ePapers that Google loves.
T h e W i n d E n e r g y O u t l O O k S c e n a r i O S<br />
GLOBal <strong>Wind</strong> <strong>Energy</strong><br />
OutlOOk <strong>2010</strong><br />
O c t o b e r 2 0 1 0<br />
1
C o n t e n T S<br />
The <strong>Global</strong> <strong>Wind</strong> <strong>Energy</strong> Outlook<br />
Scenarios 4<br />
reference scenario 5<br />
Moderate scenario 5<br />
Advanced scenario 5<br />
<strong>Global</strong> scenario results 5<br />
Capacity growth 6<br />
Assumptions on growth rates 6<br />
Scenario results 6<br />
Production and share of global electricity supply 8<br />
Assumptions on turbine capacity… 8<br />
…and capacity factors 8<br />
Regional scenario results 20<br />
Africa 21<br />
China 23<br />
Eastern Europe/Eurasia 27<br />
India 30<br />
Latin America 32<br />
Middle East 35<br />
Non-OECD Asia 37<br />
OECD Europe 40<br />
OECD North America 44<br />
OECD Pacific 47<br />
Projections for electricity<br />
demand developments 8<br />
The world’s wind resources 50<br />
Scenario results 9<br />
Investment 11<br />
Integrating wind power into<br />
electricity systems 54<br />
Employment 13<br />
Carbon dioxide savings 13<br />
Research Background 16<br />
the German Aerospace Centre 16<br />
Scenario background 16<br />
<strong>energy</strong> efficiency study 16<br />
World map 18<br />
2
F o r e W O r d<br />
The <strong>Global</strong> <strong>Wind</strong> <strong>Energy</strong> <strong>Council</strong> and Greenpeace International are pleased to present this 3rd edition of the <strong>Global</strong><br />
<strong>Wind</strong> <strong>Energy</strong> Outlook for <strong>2010</strong>, the successor to the <strong>Wind</strong> Force 10 and <strong>Wind</strong> Force 12 series which began in 1999.<br />
What were once considered wild-eyed prognoses for a new technology have come to be recognised as an important<br />
planning tool for the future of the power sector.<br />
<strong>Global</strong> wind power markets have been for the past several years dominated by three major markets: Europe, North<br />
America (US), and Asia (China and India). While these three markets still accounted for 86% of total installed capacity<br />
at the end of 2009, there are signs that this may be changing. Emerging markets in Latin America, Asia and<br />
Africa are reaching critical mass and we may be surprised to see one or more of them rise to challenge the three<br />
main markets in the coming years.<br />
Commercial wind farms now operate in close to 80 countries, and present many benefits for both developed and<br />
developing countries: increased <strong>energy</strong> security; stable power prices; economic development which both attracts<br />
investment and creates jobs; reduced dependence on imported fuels; improved air quality; and, of course, CO2<br />
emissions reductions. Each of these factors is a driver in different measure in different locations, but in an increasing<br />
number of countries they combine to make wind power the generation technology of choice.<br />
What role will wind power play in the coming two decades and beyond How much of the global electricity<br />
demand will it cover How much CO2 will be saved by wind power in 2020 and in 2030 And what will it do for<br />
<strong>energy</strong> independence and economic growth These are the questions that the GWEO seeks to answer. We present<br />
three scenarios for the development of the sector here, and play them off against two scenarios for electricity<br />
demand development to come up with a range of possible futures for the sector.<br />
Our answers to these questions haven’t changed dramatically since the 2008 edition, although the performance of<br />
the industry in the last two years tracked ahead of our Advanced scenario. What has changed is the IEA’s reference<br />
Scenario. In 2006, the Reference scenario projected 231 GW for 2020 – now that’s up to 415 GW; and for 2030,<br />
the Reference scenario projected 415 GW – now that’s up to 573GW. Of course, we still think those numbers<br />
are very low, but we were very pleased to see that the <strong>2010</strong> edition of the IEA’s publication Projected Costs of<br />
Generating Electricity has onshore wind power replacing oil to join coal, gas and nuclear as the main technologies<br />
which will compete for market share in the power sector of the future.<br />
But that future remains uncertain. The global climate negotiations have at least temporarily ground to a halt after<br />
the world’s governments failed to come up with a successor treaty to the Kyoto Protocol in Copenhagen last year.<br />
In the absence of a clear international framework and without a clear prospect of a global price on carbon emissions,<br />
our focus has to be on the national and regional <strong>energy</strong> policies which drive local development. To quote the<br />
US President, ‘The nation that leads the world in creating new sources of clean <strong>energy</strong> will be the nation that leads<br />
the 21st-century global economy.’ An increasing number of governments around the world seem to have taken<br />
that message to heart.<br />
Klaus Rave<br />
Chairman –<br />
<strong>Global</strong> <strong>Wind</strong> <strong>Energy</strong> <strong>Council</strong><br />
Sven Teske<br />
Director, Renewable <strong>Energy</strong><br />
Greenpeace International<br />
Steve Sawyer<br />
Secretary General –<br />
<strong>Global</strong> <strong>Wind</strong> <strong>Energy</strong> <strong>Council</strong><br />
3
© EDP Renovavies<br />
The GlOBal <strong>Wind</strong> <strong>Energy</strong> OutlOOk<br />
ScenariOS<br />
4
T h e G l O B a l W i n d E n e r g y O u t l O O k S c e n a r i O S<br />
The <strong>Global</strong> <strong>Wind</strong> <strong>Energy</strong> Outlook scenarios examine the<br />
future potential of wind power up to 2020, 2030 and 2050.<br />
Development of these scenarios was carried out as collaboration<br />
between the <strong>Global</strong> <strong>Wind</strong> <strong>Energy</strong> <strong>Council</strong> (GWEC),<br />
Greenpeace International and the German Aerospace Centre<br />
(DLR). Projections on the future of wind <strong>energy</strong> development<br />
have contributed to a larger study of global sustainable <strong>energy</strong><br />
pathways up to 2050 conducted by DLR for Greenpeace<br />
and the European Renewable <strong>Energy</strong> <strong>Council</strong> (EREC) 1 .<br />
Up to 2014 the figures for installed capacity are closer to being<br />
forecasts than scenarios. This is because the data available<br />
from the wind <strong>energy</strong> industry shows the expected growth of<br />
worldwide markets over the next five years based on orders<br />
for wind turbines already committed, existing legislative<br />
programmes and targets, as well as known manufacturing<br />
capacity expansion plans. After 2014 the pattern of development<br />
is more difficult to anticipate.<br />
Advanced scenario<br />
What will the growth of wind power look like There are<br />
many variables that will determine its path, and we are<br />
presenting three different scenarios for each region, and<br />
for the world as a whole, looking first towards 2020, and<br />
then onwards to 2030 (see annex table for more long-term<br />
projections up to 2050). Each scenario starts with a range of<br />
assumptions which will influence expectations for the wind<br />
<strong>energy</strong> industry’s development.<br />
Reference scenario<br />
The most conservative ‘Reference’ scenario is based on the<br />
projections in the 2009 World <strong>Energy</strong> Outlook from the<br />
International <strong>Energy</strong> Agency (IEA). This takes into account<br />
only existing policies and measures, but includes assumptions<br />
such as continuing electricity and gas market reform, the<br />
liberalisation of cross-border <strong>energy</strong> trade and recent policies<br />
aimed at combating pollution. The IEA’s figures only go out<br />
to the year 2030, but based on these assumptions, DLR has<br />
extrapolated both the overall Reference scenario and the<br />
growth of wind power up to 2050.<br />
The most ambitious scenario, the ‘Advanced’ version examines<br />
the extent to which this industry could grow in a best<br />
case ‘wind <strong>energy</strong> vision’. The assumption here is a clear and<br />
unambiguous commitment to renewable <strong>energy</strong> as per the<br />
industry’s recommendations, along with the political will necessary<br />
to carry it forward.<br />
While again, the development after 2014 is more difficult<br />
to predict, this scenario is designed to show what the wind<br />
<strong>energy</strong> sector could achieve if it were given the political commitment<br />
and encouragement it deserves in light of the twin<br />
crises of <strong>energy</strong> security and global climate change.<br />
GlOBal scenario resulTS<br />
The GWEO scenarios show that even with the continuation<br />
of current policy measures to encourage wind power development<br />
and serious government efforts to meet existing<br />
targets, the resulting ‘Moderate scenario’ growth will put<br />
the development of wind power on a dramatically different<br />
trajectory from the IEA-based ‘Reference’ scenario.<br />
Moderate scenario<br />
The ‘Moderate’ scenario takes into account all policy measures<br />
to support renewable <strong>energy</strong> either already enacted or in the<br />
planning stages around the world. It also assumes that the<br />
targets set by many countries for either renewables, emissions<br />
reductions and/or wind <strong>energy</strong> are successfully implemented,<br />
as well as the modest implementation of new policies aimed at<br />
pollution and carbon emission reduction, and increased <strong>energy</strong><br />
security. It also takes into account environmental and <strong>energy</strong><br />
policy measures that were part of many government economic<br />
stimulus packages implemented since late 2008.<br />
With the political will to fully exploit each country’s wind<br />
resource and reap the accompanying economic, environmental<br />
and <strong>energy</strong> security benefits, the ‘Advanced scenario’<br />
could be reached, which would see substantial wind power<br />
growth in many regions of the world. <strong>Wind</strong> power would then<br />
be instrumental in achieving a genuine <strong>energy</strong> revolution,<br />
putting the world on the path to a sustainable <strong>energy</strong> future.<br />
We are now at a crossroads for making these decisions, which<br />
will determine the future of our <strong>energy</strong> systems as well as, to<br />
a great extent, the future of our planet.<br />
1 See http://www.<strong>energy</strong>blueprint.info<br />
5
T h e G l o b a l W i n d E n e r g y O u t l o o k S c e n a r i o s<br />
Capacity growth<br />
Assumptions on grOWTh rates<br />
Market growth rates used in these scenarios are based on a<br />
mixture of historical figures, current policies and trends, new<br />
market development, discussions of future <strong>energy</strong> policy and<br />
other factors. While cumulative annual growth rates of more<br />
than 25% per year, as envisaged in the ‘Advanced’ scenario,<br />
are unusually high in most industries that manufacture heavy<br />
equipment, the wind industry has consistently experienced<br />
much higher growth. In fact, the global wind markets have<br />
grown by an average 28% per year in terms of total installed<br />
capacity during the last decade.<br />
In the GWEO Advanced scenario, the average annual growth<br />
for cumulative installed capacity is assumed to start off at<br />
27% in <strong>2010</strong>, and then gradually decline to 9% by 2020.<br />
By 2030, they will have dropped to 4%. Growth rates as<br />
anticipated by the IEA in the Reference scenario start at 17%<br />
in <strong>2010</strong>, drop to 3% by 2015, stabilising at that level. The<br />
growth rates for the Moderate scenario range from 26% in<br />
<strong>2010</strong> to 9% in 2020 and to 5% in 2030.<br />
It should also be borne in mind that while growth rates eventually<br />
decline to single figures across the range of scenarios,<br />
the level of wind power capacity envisaged in 20-40 years’<br />
time means that even small percentage growth rates will by<br />
then translate into large figures in terms of annually installed<br />
megawatts, especially in the advanced and Moderate scenarios.<br />
Scenario results<br />
The IEA’s Reference scenario suggests – contrary to the clear<br />
upwards trend we have witnessed in the past – that growth<br />
rates for wind power would decrease substantially in the<br />
coming years, and that <strong>2010</strong> would see an addition of only<br />
26.8 GW, which would represent a decrease of the annual<br />
market by 30% in <strong>2010</strong> (compared to an increase of 41%<br />
in 2009). The annual market would then continue to shrink<br />
until 2015 and only recover to reach its 2009 levels again just<br />
before 2030. The cumulative wind power capacity accord-<br />
<strong>Global</strong> Cumulative <strong>Wind</strong> pOWer Capacity<br />
2,500 [GW]<br />
Reference Moderate Advanced<br />
2,000<br />
1,500<br />
1,000<br />
500<br />
0<br />
2007 2008 2009 <strong>2010</strong> 2015 2020 2030<br />
2007 2008 2009 <strong>2010</strong> 2015 2020 2030<br />
Reference [MW] 93,864 120,297 158,505 185,258 295,783 415,433 572,733<br />
[TWh] 206 263 347 406 725 1,019 1,405<br />
Moderate [MW] 93,864 120,297 158,505 198,717 460,364 832,251 1,777,550<br />
[TWh] 206 263 347 435 1,129 2,041 4,360<br />
Advanced [MW] 93,864 120,297 158,505 201,657 533,233 1,071,415 2,341,984<br />
[TWh] 206 263 347 442 1,308 2,628 5,429<br />
6
T h e G l O B a l W i n d E n e r g y O u t l O O k S c e n a r i O S<br />
Regional BreakdOWn: Reference scenario<br />
700<br />
600<br />
500<br />
400<br />
2009<br />
<strong>2010</strong><br />
2020<br />
2030<br />
300<br />
200<br />
100<br />
0<br />
[GW]<br />
OECD<br />
Europe<br />
OECD<br />
North<br />
America<br />
Regional BreakdOWn: Moderate scenario<br />
China India OECD<br />
Pacific<br />
Non-<br />
OECD<br />
Asia<br />
Eastern<br />
Europe/<br />
Eurasia<br />
Latin<br />
America<br />
2009 76 39 26 11 5 0,5 0,4 1 0,8 0,1<br />
<strong>2010</strong> 86 45 33 12 5 0,6 0,9 2 1 0,1<br />
2020 184 106 70 24 11 4 6 5 3 2<br />
2030 234 141 95 31 19 16 13 11 8 6<br />
Africa<br />
Middle<br />
East<br />
700<br />
600<br />
500<br />
400<br />
2009<br />
<strong>2010</strong><br />
2020<br />
2030<br />
300<br />
200<br />
100<br />
0<br />
[GW]<br />
OECD<br />
Europe<br />
OECD<br />
North<br />
America<br />
China India OECD<br />
Pacific<br />
Non-<br />
OECD<br />
Asia<br />
Eastern<br />
Europe/<br />
Eurasia<br />
Latin<br />
America<br />
2009 76 39 26 11 5 0,5 0,5 1 0,8 0,1<br />
<strong>2010</strong> 87 50 40 13 6 0,7 0,9 2 1 0,1<br />
2020 251 220 200 46 37 24 12 28 12 2<br />
2030 447 407 404 108 81 120 71 72 42 25<br />
Regional BreakdOWn: Advanced scenario<br />
Africa<br />
Middle<br />
East<br />
700<br />
600<br />
500<br />
400<br />
2009<br />
<strong>2010</strong><br />
2020<br />
2030<br />
300<br />
200<br />
100<br />
0<br />
[GW]<br />
OECD<br />
Europe<br />
OECD<br />
North<br />
America<br />
China India OECD<br />
Pacific<br />
Non-<br />
OECD<br />
Asia<br />
Eastern<br />
Europe/<br />
Eurasia<br />
Latin<br />
America<br />
2009 76 39 26 11 5 0,5 0,5 1 0,8 0,1<br />
<strong>2010</strong> 87 50 41 13 6 0,7 0,9 2 1 0,1<br />
2020 279 279 250 65 48 55 16 37 19 11<br />
Africa<br />
Middle<br />
East<br />
2030 515 622 513 161 109 140 87 93 67 34<br />
7
T h e G l O B a l W i n d E n e r g y O u t l O O k S c e n a r i O S<br />
Production and share of global electricity supply<br />
Assumptions on turbine capacity…<br />
Individual wind turbines have been steadily growing in terms<br />
of their nameplate capacity – the maximum electricity<br />
output they achieve when operating at full power. While the<br />
average size of turbines still differs dramatically from country<br />
to country, there has been a market trend towards bigger<br />
turbines across all markets. For the purposes of the GWEO<br />
scenarios, this trend is expected to continue over the next<br />
few decades.<br />
Dhule wind farm, India<br />
© Suzlon<br />
ing to this projection would stand at 415 GW in 2020 and<br />
572 GW in 2030. For this to happen, annual additions would<br />
need to decline substantially, especially in China, although<br />
there is no indication of this happening at present. Overall,<br />
the Reference scenario seems disconnected from current<br />
developments, and curiously pessimistic.<br />
While the Reference scenario suggests that between 20 and<br />
26 GW of new capacity will be added each year between<br />
<strong>2010</strong> and 2020, reaching 41 GW/year only in 2030, the<br />
Moderate scenario envisages the addition of 40.2 GW two<br />
decades earlier (in <strong>2010</strong>), followed by 63 GW/year by 2015,<br />
close to 90 GW/year by 2020, and almost 150 GW/year by<br />
2030. This translates into 100 GW more installations per year<br />
than the Reference scenario by 2030, even though the annual<br />
market growth rate would by then have dropped off to a<br />
modest 4% per year. In terms of total installed wind power<br />
capacity, 830 GW would be reached in 2020 (twice as much<br />
as under the Reference scenario), and close to 1,800 GW by<br />
2030 (more than three times as much).<br />
In the Advanced scenario, the difference would be even<br />
more striking. Annual market growth rates here start at 27%<br />
for <strong>2010</strong>, and then decrease to 17% by 2015, 9% by 2020<br />
and finally 5% by 2030 – compared to an average cumulative<br />
market growth of 28% per year over the past decade. These<br />
growth rates would translate into annual markets of 120 GW<br />
by 2020, increasing and stabilising at around 185 GW by<br />
2030. These projections would result in a total installed<br />
capacity of just over 1,000 GW by 2020 and 2,300 GW by<br />
2030.<br />
It is also assumed that each turbine will have an operational<br />
lifetime of 20 years, after which it will need to be replaced.<br />
This ‘repowering’ or replacement of older turbines has been<br />
taken into account in the scenarios.<br />
… and capacity facTOrs<br />
A wind turbine’s ‘capacity factor’ refers to the percentage of<br />
the nameplate capacity that a turbine installed in a particular<br />
location will deliver over the course of a year. This is primarily<br />
an assessment of the wind resource at a given site, but capacity<br />
factors are also affected by the efficiency of the turbine<br />
and its suitability for the particular location. For example, a<br />
1 MW turbine operating at a 25% capacity factor will deliver<br />
2,190 MWh of electricity in one year.<br />
From an estimated average capacity factor today of 25%, the<br />
scenario assumes that improvements in both wind turbine<br />
technology and the siting of wind farms will result in a steady<br />
increase. Capacity factors are also much higher at sea, where<br />
winds are stronger and more constant. The growing size of<br />
the offshore wind market, especially in Europe, will therefore<br />
contribute to an increase in the average. As a result, across all<br />
three scenarios, we assume that the average global capacity<br />
factor will increase to 28% by 2015 and then 30% by 2036.<br />
Although capacity factors will vary from region to region, we<br />
have assumed these same global averages for the regional<br />
scenarios as outlined below.<br />
Projections FOr electricity<br />
demand developmenTS<br />
While it is of interest to calculate how much power would<br />
actually be generated by wind <strong>energy</strong> in the three scenarios,<br />
8
Maranchón wind farm, Guadalajara, Spain<br />
© <strong>Wind</strong> Power Works<br />
putting this into the context of global electricity demand<br />
is even more relevant, as it will give us an idea of the share<br />
that wind power can have in satisfying the world’s increasing<br />
hunger for power. The three GWEO scenarios are therefore<br />
set against two projections for the future growth of electricity<br />
demand: a ‘Reference Demand Projection’; and an ‘<strong>Energy</strong><br />
Efficiency Demand Projection’.<br />
Reference demand projection<br />
The more conservative of the two global electricity demand<br />
projections is again based on data from the IEA’s 2009 World<br />
<strong>Energy</strong> Outlook, including its assumptions on population and<br />
GDP growth, extrapolated forwards to 2050. It takes account<br />
of policies and measures that were enacted or adopted by<br />
mid-2009, but does not include possible or likely future<br />
policy initiatives.<br />
The IEA’s estimation is that in the absence of new government<br />
policies, the world’s electricity demand will rise<br />
inexorably. <strong>Global</strong> demand would therefore almost double<br />
from the baseline 15,000 TWh in 2005 to reach nearly<br />
29,000 TWh by 2030.<br />
<strong>Energy</strong> efficiency demand projection<br />
The IEA’s expectations on rising <strong>energy</strong> demand are then set<br />
against the outcome of a study on the potential effect of<br />
<strong>energy</strong> efficiency savings developed by DLR and the Ecofys<br />
consultancy 2 . This study describes an ambitious development<br />
path for the exploitation of <strong>energy</strong> efficiency measures, based<br />
on current best practice technologies, emerging technologies<br />
that are currently under development and continuous<br />
innovation in the field of <strong>energy</strong> efficiency.<br />
In reality, of course, constraints in terms of costs and other<br />
barriers, such as resistance to replacing existing equipment<br />
and capital stock before the end of its useful life, will prevent<br />
this ‘technical’ <strong>energy</strong> efficiency potential to be fully realised.<br />
In order to reflect these limitations, we have used the more<br />
moderate <strong>Energy</strong> Efficiency demand projection from the<br />
study, which is based on implementing around 80% of the<br />
technical potential.<br />
This scenario results in global demand increasing by much<br />
less than under the Reference projection, i.e., to 25,000 TWh<br />
in 2030, which is 14% (or 4,000 TWh) lower.<br />
Scenario resulTS<br />
On the basis of these <strong>energy</strong> demand projections, the share<br />
of wind power in the global electricity demand can be calculated.<br />
In the Reference scenario, wind power would produce<br />
1,000 TWh of electricity by 2020, a trebling from the estimated<br />
350 TWh produced by the 158.5 GW of wind capacity<br />
in 2009. Depending on the demand projection, this would<br />
cover between 4.5-4.8% of the world’s electricity needs,<br />
about the same share as is currently achieved in Europe. By<br />
2030, 1,400 TWh would account for 4.9% to 5.6%. Overall,<br />
the contribution of wind power to the global electricity supply<br />
would remain small.<br />
2 www.<strong>energy</strong>blueprint.info/1211.0.html<br />
9
Cerro Becerril wind farm, Spain<br />
© EDP Renovavies<br />
<strong>Wind</strong> pOWer share OF <strong>glOBal</strong> electricity demand<br />
25%<br />
20%<br />
15%<br />
10%<br />
Reference scenario<br />
Reference demand projection<br />
<strong>Energy</strong> efficiency demand projection<br />
Moderate scenario<br />
Reference demand projection<br />
<strong>Energy</strong> efficiency demand projection<br />
Advanced scenario<br />
Reference demand projection<br />
<strong>Energy</strong> efficiency demand projection<br />
5%<br />
0%<br />
2007 <strong>2010</strong> 2020 2030<br />
2007 <strong>2010</strong> 2020 2030<br />
Reference scenario<br />
Reference demand projection 1.1% 2.3% 4.5% 4.9%<br />
<strong>Energy</strong> efficiency demand projection 1.1% 2.3% 4.8% 5.6%<br />
Moderate scenario<br />
Reference demand projection 1.1% 2.4% 8.9% 15.1%<br />
<strong>Energy</strong> efficiency demand projection 1.1% 2.5% 9.5% 17.5%<br />
Advanced scenario<br />
Reference demand projection 1.1% 2.5% 11.5% 18.8%<br />
<strong>Energy</strong> efficiency demand projection 1.1% 2.5% 12.3% 21.8%<br />
Under the Moderate scenario, the situation would look<br />
considerably different. In 2020, wind <strong>energy</strong> would produce<br />
2,000 TWh, twice as much as under the Reference<br />
scenario, and this would meet 8.9%-9.5% of the world’s<br />
power demand – already a substantial contribution. By 2030,<br />
4,300 TWh would be produced by wind <strong>energy</strong>, taking the<br />
share up to 15%-17.5%, depending on how demand develops<br />
over the next two decades.<br />
The Advanced scenario paints a picture in which wind power<br />
would become a central player in global power generation.<br />
By 2020, the world’s combined installed wind fleet would<br />
produce 2,600 TWh of clean power, which would account<br />
for 11.5%-12.3% of global electricity supply. This would rise<br />
to 5,400 TWh by 2030 and a share of 18.8%-21.8% – a fifth<br />
of the world’s power needs could thus be satisfied by wind<br />
power alone.<br />
10
T h e G l O B a l W i n d E n e r g y O u t l O O k S c e n a r i O S<br />
COSTS and capaciTieS<br />
1,600<br />
1,400<br />
Cost € / kW<br />
Reference<br />
Moderate<br />
Advanced<br />
Annual Installation [ GW ]<br />
Reference<br />
Moderate<br />
Advanced<br />
250<br />
200<br />
1,200<br />
1,000<br />
150<br />
800<br />
600<br />
100<br />
400<br />
50<br />
200<br />
0<br />
2007 2008 2009 <strong>2010</strong> 2015 2020<br />
2030<br />
0<br />
InveSTMent and eMployment<br />
2007 2008 2009 <strong>2010</strong> 2015 2020 2030<br />
Reference<br />
Annual Installation [MW] 19,865 28,700 38,343 26,735 20,887 25,712 41,219<br />
Cost [€ / kW] 1,300 1,350 1,350 1,327 1,276 1,240 1,216<br />
Investment [€ million /year] 25,824 38,745 51,763 35,507 26,649 31,894 50,136<br />
Employment [job year] 329,232 470,559 627,927 462,982 411,801 524,027 809,006<br />
Moderate<br />
Annual Installation [MW] 19,865 28,700 38,343 40,212 62,887 88,133 148,416<br />
Cost [€ / kW] 1,300 1,350 1,350 1,329 1,258 1,208 1,116<br />
Investment [€ million /year] 25,824 38,745 51,763 53,459 79,109 106,504 165,691<br />
Employment [job year] 329,232 470,559 627,927 629,137 1,033,721 1,422,874 2,372,911<br />
Advanced<br />
Annual Installation [MW] 19,865 28,700 38,343 43,263 87,641 120,135 185,350<br />
Cost [€ / kW] 1,300 1,350 1,350 1,328 1,245 1,172 1,093<br />
Investment [€ million /year] 25,824 38,745 51,763 57,450 109,072 140,762 202,600<br />
Employment [job year] 329,232 470,559 627,927 672,827 1,404,546 1,918,530 3,004,081<br />
Investment<br />
Producing increased volumes of wind-generated electricity<br />
will attract considerable levels of investment.<br />
The capital cost of producing wind turbines has fallen steadily<br />
over the past 20 years as turbine design has been largely concentrated<br />
on the three-bladed upwind model with variable<br />
speed and pitch blade regulation. Manufacturing techniques<br />
have been optimised, and mass production and automation<br />
have resulted in economies of scale.<br />
The cost developments in the GWEO scenarios are based<br />
on the assumption of a gradually decreasing capital cost<br />
per kilowatt of installed capacity, due to increased deployment,<br />
which accelerates technological progress and increases<br />
economies of scale in manufacturing, which in turn results<br />
in lower equipment costs. Since this progress will be faster<br />
the more units are produced, the cost of wind turbines is<br />
11
Production Yinchuan, China<br />
© Nordex<br />
projected to decrease most quickly in the Advanced and least<br />
quickly in the Reference scenario.<br />
Capital costs per kilowatt of installed capacity are taken as an<br />
average of €1,350 per kW in 2009. In the Reference scenario,<br />
these costs fall gradually to €1,240 per kW by 2020 and<br />
€1,216 by 2030. In the Advanced scenario, costs will fall more<br />
rapidly to reach €1,093 per kW in 2030. 3<br />
Given the high up-front costs of wind power projects, large<br />
investments of predominantly private but also public funds<br />
are expected to flow into the growing wind power markets.<br />
This investment will directly benefit regional development<br />
by creating jobs in manufacturing, transportation, construction,<br />
project development and operation and maintenance;<br />
providing new revenue sources to local landowners such as<br />
a farmers or communities; and increasing the local tax base.<br />
The investment value in the future wind <strong>energy</strong> market envisaged<br />
in this scenario has been assessed on an annual basis.<br />
In the Reference scenario the annual value of global investment<br />
in wind power equipment drops by nearly half from<br />
€51.8 billion in 2009 to only €26.6 billion by 2015, and then<br />
rises again to reach current levels after 2030.<br />
In the Moderate scenario the annual value of global investment<br />
in the wind power industry rises from €53.5 billion in<br />
<strong>2010</strong> to €79.1 billion in 2015 and €106.5 billion by 2020.<br />
Investment rises rapidly during the next 10 years to reach<br />
€166 billion by 2030.<br />
In the Advanced scenario the annual value of global investment<br />
rises rapidly from €57.5 billion in <strong>2010</strong> to €109.1 billion<br />
by 2015, and peaks at €202 billion in 2030.<br />
Although these figures are large, they should be seen in the<br />
context of the total level of investment in the global power<br />
industry. During the 1990s, for example, annual investment<br />
in the power sector was running at some €158–186 billion<br />
each year.<br />
3 All figures are in 2009 €<br />
12
T h e G l O B a l W i n d E n e r g y O u t l O O k S c e n a r i O S<br />
Employment<br />
The employment effect of this scenario is a crucial factor to<br />
weigh alongside its other costs and benefits. High unemployment<br />
rates continue to be a drain on the social systems of<br />
many countries in the world. Any technology which demands<br />
a substantial level of both skilled and unskilled labour is<br />
therefore of considerable economic importance, and likely to<br />
feature strongly in any political decision-making over different<br />
<strong>energy</strong> options.<br />
A number of assessments of the employment effects of wind<br />
power have been carried out in Germany, Denmark, Spain<br />
and the Netherlands. The assumption made in this scenario is<br />
that for every megawatt of new capacity, the annual market<br />
for wind <strong>energy</strong> will, as of <strong>2010</strong>, create employment at the<br />
rate of 14 jobs (person years) per MW installed in that year<br />
through manufacture, component supply, wind farm development,<br />
installation, transportation, as well as indirect employment.<br />
As production processes are optimised, this level will<br />
decrease, falling to 13 jobs per MW by 2020 and 12 by 2025.<br />
In addition, employment in regular operations and maintenance<br />
work at wind farms will contribute a further 0.33 jobs<br />
for every megawatt of cumulative capacity.<br />
Under these assumptions, more than 600,000 people would<br />
have been employed in the wind <strong>energy</strong> sector in 2009. Under<br />
the Reference scenario, this figure would decrease to just<br />
463,000 jobs in <strong>2010</strong>, then slowly recover to reach 524,000<br />
jobs by 2020 and 809,000 by 2030.<br />
In the Moderate scenario, the wind sector would become a<br />
powerful jobs motor, providing ‘green collar’ employment to<br />
more than a million people by 2015 and 1.3 million five years<br />
later. By 2030 the wind industry would employ 2.6 million<br />
people worldwide.<br />
The Advanced scenario would see the employment level rise<br />
rapidly to 1.4 million as early as 2015, almost reaching close<br />
to 2 million jobs in wind <strong>energy</strong> by 2020 and going beyond<br />
3 million by 2030.<br />
Zafarana wind farm, Egypt<br />
© <strong>Wind</strong> Power Works<br />
benefit from wind power generation. Carbon dioxide is the gas<br />
largely responsible for exacerbating the greenhouse effect, leading<br />
to the disastrous consequences of global climate change.<br />
Modern wind technology has an extremely good <strong>energy</strong><br />
balance. The CO2 emissions related to the manufacture,<br />
installation and servicing over the average 20 year lifecycle of<br />
a wind turbine are generally ‘paid back’ after the first three to<br />
nine months of operation. Beyond this, wind power produces<br />
no CO2 emissions.<br />
The benefit to be obtained from carbon dioxide reductions is<br />
dependent on the fuel, or fuels, that wind power displaces; for<br />
example, emissions from coal for a kilowatt hour of electricity<br />
produced are higher than from natural gas. Calculations<br />
by the World <strong>Energy</strong> <strong>Council</strong> show a range of carbon dioxide<br />
emission levels for different fossil fuels. Working on the assumption<br />
that coal and gas will still account for the majority<br />
of electricity generation in 20 years’ time – with a continued<br />
trend for gas to take over from coal – it makes sense to use<br />
a figure of 600 kg/MWh as an average value for the carbon<br />
dioxide reduction to be obtained from wind generation. Although<br />
this will vary from region to region, we have assumed<br />
these same average global CO2 reduction value for the<br />
regional scenarios as outlined below<br />
Carbon dioxide savings<br />
A reduction in the levels of carbon dioxide being emitted into<br />
the global atmosphere is the most important environmental<br />
This assumption is further justified by the fact that more than<br />
half of the cumulative wind generation capacity expected by<br />
2020 will be installed in the OECD regions (North America,<br />
Europe and the Pacific), where there is a strong trend for a<br />
shift from coal to gas for electricity generation. Outside of<br />
13
T h e G l O B a l W i n d E n e r g y O u t l O O k S c e n a r i O S<br />
the OECD, the CO2 reduction will generally be higher due to<br />
the widespread use of coal-fired power stations.<br />
The expected annual CO2 savings from wind <strong>energy</strong> under<br />
the Reference scenario is 243 million tonnes in <strong>2010</strong>, passing<br />
500 million tonnes per year between 2015 and 2020, gradually<br />
climbing to 843 million tonnes per year of CO2 savings<br />
by 2030. This is small compared with the 18.7 billion tonnes<br />
of CO2 that the IEA expects the global power sector will emit<br />
every year by 2030.<br />
Under the Moderate scenario, wind power would save the<br />
emission of a more significant 1.2 billion tons of CO2 per year<br />
by 2020, rising to 2.6 billion tonnes by 2030.<br />
Annual and cumulative CO2 emiSSions reductions<br />
Reference<br />
Year<br />
CO2 reduction<br />
(with 600gCO2/kWh)<br />
[annual mil tCO2]<br />
Avoided CO2 since 2003<br />
[cumulative mil tCO2]<br />
2009 208 772<br />
<strong>2010</strong> 243 1,016<br />
2015 435 2,834<br />
2020 611 5,539<br />
2025 727 8,944<br />
2030 843 12,928<br />
2035 960 17,495<br />
2040 1,155 23,017<br />
2045 1,272 29,143<br />
2050 1,387 35,854<br />
Under the Advanced scenario, by 2020 1.6 billion tons of CO2<br />
would be saved every year, and this would grow to a considerable<br />
3.3 billion tonnes per year by 2030– thereby saving a<br />
sixth of all CO2 emitted by the electricity sector compared<br />
with the IEA’s projections.<br />
However, it is the cumulative effect of these yearly CO2<br />
savings that really matters to the atmosphere.<br />
The slow growth of wind <strong>energy</strong> as envisaged by the Reference<br />
scenario would mean that by 2020, wind power would<br />
have saved just 5.5 billion tonnes of CO2 globally, and this<br />
would rise to 13 billion tonnes by 2030.<br />
A much faster growth such as the one outlined in the Moderate<br />
scenario would substantially increase the cumulative CO2<br />
savings, by achieving reductions of 8.5 billion tonnes by 2020<br />
and 28 billion tonnes by 2030. Under the Advanced scenario,<br />
these savings would be as high as 10 billion tonnes by 2020<br />
and 34 billion tonnes of CO2 by 2030.<br />
What will make a significant difference to the climate is the<br />
speed at which cuts are made. So it is not only the total emissions<br />
reductions that are of value, but it is the timing of them.<br />
<strong>Wind</strong> power’s scalability and speed of deployment is a critical<br />
part of any plan to get global emissions to peak and begin to<br />
decline by 2020, which is essential to put us on a pathway<br />
where global mean temperature rise can be kept below 2°C,<br />
the most positive part of the agreement in the Copenhagen<br />
Accord.<br />
Moderate<br />
Advanced<br />
Year<br />
CO2 reduction<br />
(with 600gCO2/kWh)<br />
[annual mil tCO2]<br />
Avoided CO2 since 2003<br />
[cumulative mil tCO2]<br />
2009 208 772<br />
<strong>2010</strong> 261 1,033<br />
2015 678 3,550<br />
2020 1,225 8,510<br />
2025 1,875 16,556<br />
2030 2,616 28,104<br />
2035 3,348 43,415<br />
2040 4,322 63,559<br />
2045 5,066 87,394<br />
2050 5,838 115,026<br />
Year<br />
CO2 reduction<br />
(with 600gCO2/kWh)<br />
[annual mil tCO2]<br />
Avoided CO2 since 2003<br />
[cumulative mil tCO2]<br />
2009 208 772<br />
<strong>2010</strong> 265 1,037<br />
2015 785 3,812<br />
2020 1,577 9,953<br />
2025 2,283 19,667<br />
2030 3,257 34,027<br />
2035 4,094 52,926<br />
2040 5,084 77,001<br />
2045 5,686 104,256<br />
2050 6,242 134,363<br />
14
<strong>Wind</strong> farm in Spain<br />
© Alstom<br />
Annual CO2 emiSSions reductions<br />
4,000<br />
[mil tCO2] Reference Moderate Advanced<br />
3,000<br />
2,000<br />
1,000<br />
0<br />
2007<br />
2008<br />
2009<br />
<strong>2010</strong><br />
2015<br />
2020<br />
2025<br />
2030<br />
Cumulative CO2 emiSSions reductions<br />
40,000<br />
[mil tCO2] Reference Moderate Advanced<br />
20,000<br />
0<br />
2007<br />
2008<br />
2009<br />
<strong>2010</strong><br />
2015<br />
2020<br />
2025<br />
2030<br />
15
T h e G l O B a l W i n d E n e r g y O u t l O O k S c e n a r i O S<br />
Research Background<br />
The German AerOSpace Centre<br />
The German Aerospace Centre (DLR) is the largest engineering<br />
research organisation in Germany. Among its specialities<br />
are the development of solar thermal power station<br />
technologies, the utilisation of low and high temperature fuel<br />
cells, particularly for electricity generation, and research into<br />
the development of high efficiency gas and steam turbine<br />
power plants.<br />
The Institute of Technical Thermodynamics at DLR (DLR-<br />
ITT) is active in the field of renewable <strong>energy</strong> research and<br />
technology development for efficient and low emission<br />
<strong>energy</strong> conversion and utilisation. Working in co-operation<br />
with other DLR institutes, industry and universities, research<br />
is focused on solving key problems in electrochemical <strong>energy</strong><br />
technology and solar <strong>energy</strong> conversion. This encompasses<br />
application oriented research, development of laboratory and<br />
prototype models as well as design and operation of demonstration<br />
plants. System analysis and technology assessment<br />
supports the preparation of strategic decisions in the field of<br />
research and <strong>energy</strong> policy.<br />
Within DLR-ITT, the System Analysis and Technology Assessment<br />
Division has long term experience in the assessment of<br />
renewable <strong>energy</strong> technologies. Its main research activities<br />
are in the field of techno-economic utilisation and system<br />
analysis, leading to the development of strategies for the<br />
market introduction and dissemination of new technologies,<br />
mainly in the <strong>energy</strong> and transport sectors.<br />
Scenario background<br />
DLR was commissioned by the European Renewable <strong>Energy</strong><br />
<strong>Council</strong> and Greenpeace International to conduct the study<br />
‘<strong>Energy</strong> [R]evolution: A sustainable global <strong>energy</strong> outlook’,<br />
developing global sustainable <strong>energy</strong> pathways up to 2050 1 .<br />
This study, first published in January 2007 and the 3rd edition<br />
published in June <strong>2010</strong>, lays out <strong>energy</strong> scenarios with emissions<br />
that are significantly lower than current levels.<br />
Part of the study examined the future potential for renewable<br />
<strong>energy</strong> sources; together with input from the wind <strong>energy</strong><br />
industry and analysis of regional projections for wind power<br />
around the world, this forms the basis of the <strong>Global</strong> <strong>Wind</strong><br />
<strong>Energy</strong> Outlook scenario.<br />
The <strong>energy</strong> supply scenarios adopted in this report, which<br />
both extend beyond and enhance projections by the International<br />
<strong>Energy</strong> Agency, have been calculated using the MESAP/<br />
PlaNet simulation model by DLR covering all 10 world<br />
regions. This model has then been developed in cooperation<br />
with Ecofys consultancy to take into account the future<br />
potential for <strong>energy</strong> efficiency measures.<br />
<strong>Energy</strong> eFFiciency STudy 2<br />
The aim of the Ecofys study was to develop low <strong>energy</strong><br />
demand scenarios for the period 2007 to 2050 on a sectoral<br />
level for the IEA regions as defined in the World <strong>Energy</strong> Outlook<br />
report series. <strong>Energy</strong> demand was split up into electricity<br />
and fuels. The sectors which were taken into account were<br />
industry, transport and other consumers, including households<br />
and services.<br />
The Ecofys study envisages an ambitious overall development<br />
path for the exploitation of <strong>energy</strong> efficiency potential,<br />
focused on current best practice as well as technologies<br />
available in the future, and assuming continuous innovation<br />
in the field. The result is that worldwide final <strong>energy</strong> demand<br />
is reduced by 35% in 2050 in comparison to the Reference<br />
scenario. <strong>Energy</strong> savings are fairly equally distributed over the<br />
three sectors. The most important <strong>energy</strong> saving options are<br />
the implementation of more efficient passenger and freight<br />
transport, improved heat insulation and building design, and<br />
technical efficiency standards for consumer applications,<br />
stand-by modes and IT equipment.<br />
While the Ecofys study develops two <strong>energy</strong> efficiency<br />
scenarios, only the more moderate of these has been used in<br />
this report.<br />
1 Krewitt W, Simon S, Graus W, Teske S, Zervos A, Schaefer O, ‘The 2 degrees C scenario<br />
- A sustainable world <strong>energy</strong> perspective’; <strong>Energy</strong> Policy, Vol.35, No.10, 4969-4980, 2007;<br />
and www.<strong>energy</strong>blueprint.info<br />
16<br />
2 www.<strong>energy</strong>blueprint.info/1211.0.html
T h e G W E O s c e n a r i O S – w i n d p O W e r d e v e l o p m e n t u p T O 2 0 5 0<br />
Xioa Yan Kou wind farm, Rudong, China<br />
© <strong>Wind</strong> Power Works<br />
17
T h e G W E O s c e n a r i O S – w i n d p O W e r d e v e l o p m e n t u p T O 2 0 5 0<br />
Oecd nOrth aMerica<br />
Total capacity in MW<br />
2009 <strong>2010</strong> 2020 2030<br />
Reference scenario 38,585 45,085 106,085 141,085<br />
Moderate scenario 38,585 49,869 220,002 407,445<br />
Advanced scenario 38,585 49,925 278,570 621,680<br />
Oecd Europe<br />
Total capacity in MW<br />
2009 <strong>2010</strong> 2020 2030<br />
Reference scenario 75,565 85,696 183,996 233,796<br />
Moderate scenario 75,565 86,175 250,824 447,432<br />
Advanced scenario 75,565 87,140 293,963 514,806<br />
Latin aMerica<br />
Total capacity in MW<br />
2009 <strong>2010</strong> 2020 2030<br />
Reference scenario 1,072 1,522 4,772 10,522<br />
Moderate scenario 1,072 1,956 28,004 72,044<br />
Advanced scenario 1,072 2,082 36,635 93,374<br />
Africa<br />
Total capacity in MW<br />
2009 <strong>2010</strong> 2020 2030<br />
Reference scenario 763 1,000 3,000 8,000<br />
Moderate scenario 763 1,002 11,718 41,536<br />
Advanced scenario 763 1,008 19,325 67,368<br />
Definitions OF regions in accordance with iea claSSification<br />
OECD Europe: Austria, Belgium, Czech Republic, Denmark, Finland, France,<br />
Germany, Greece, Hungary, Iceland, Ireland, Italy, Luxembourg, the Netherlands,<br />
Norway, Poland, Portugal, Slovak Republic, Spain, Sweden, Switzerland, Turkey,<br />
United Kingdom<br />
OECD North America: Canada, Mexico, United States<br />
OECD Pacific: Australia, Japan, Korea (South), New Zealand<br />
Eastern Europe/Eurasia: Albania, Armenia, Azerbaijan, Belarus, Bosnia-Herzegovina,<br />
Bulgaria, Croatia, Estonia, Serbia and Montenegro, the former Republic of<br />
Macedonia, Georgia, Kazakhstan, Kyrgyzstan, Latvia, Lithuania, Moldova, Romania,<br />
Russia, Slovenia, Tajikistan, Turkmenistan, Ukraine, Uzbekistan, Cyprus 1 , Malta 1<br />
India<br />
Non-OECD Asia: Afghanistan, Bangladesh, Bhutan, Brunei, Cambodia, Chinese<br />
Taipei, Cook Islands, East Timor, Fiji, French Polynesia, Indonesia, Kiribati,<br />
Democratic People’s Republic of Korea, Laos, Macao, Malaysia, Maldives, Mongolia,<br />
Myanmar, Nepal, New Caledonia, Pakistan, Papua New Guinea, Philippines, Samoa,<br />
Singapore, Solomon Islands, Sri Lanka, Thailand, Tonga, Vietnam, Vanuatu<br />
1 Cyprus and Malta are allocated to Eastern Europe/Eurasia for statistical reasons<br />
Latin America: Antigua and Barbuda, Aruba, Argentina, Bahamas, Barbados, Belize,<br />
Bermuda, Bolivia, Brazil, the British Virgin Islands, the Cayman Islands, Chile,<br />
Colombia, Costa Rica, Cuba, Dominica, the Dominican Republic, Ecuador, El<br />
Salvador, the Falkland Islands, French Guyana, Grenada, Guadeloupe, Guatemala,<br />
Guyana, Haiti, Honduras, Jamaica, Martinique, Montserrat, Netherlands Antilles,<br />
Nicaragua, Panama, Paraguay, Peru, St. Kitts and Nevis, Saint Lucia, Saint Pierre et<br />
Miquelon, St. Vincent and the Grenadines, Suriname, Trinidad and Tobago, the Turks<br />
and Caicos Islands, Uruguay and Venezuela<br />
Africa: Algeria, Angola, Benin, Botswana, Burkina Faso, Burundi, Cameroon, Cape<br />
Verde, Central African Republic, Chad, Comoros, Congo, Democratic Republic of<br />
Congo, Cote d’Ivoire, Djibouti, Egypt, Equatorial Guinea, Eritrea, Ethiopia, Gabon,<br />
Gambia, Ghana, Guinea, Guinea-Bissau, Kenya, Lesotho, Liberia, Libya, Madagascar,<br />
Malawi, Mali, Mauritania, Mauritius, Morocco, Mozambique, Namibia, Niger,<br />
Nigeria, Reunion, Rwanda, Sao Tome and Principe, Senegal, Seychelles, Sierra Leone,<br />
Somalia, South Africa, Sudan, Swaziland, United Republic of Tanzania, Togo, Tunisia,<br />
Uganda, Zambia, Zimbabwe<br />
Middle East: Bahrain, Iran, Iraq, Israel, Jordan, Kuwait, Lebanon, Oman, Qatar, Saudi<br />
Arabia, Syria, United Arab Emirates, Yemen<br />
China: People’s Republic of China including Hong Kong<br />
18
T h e G W E O s c e n a r i O S – w i n d p O W e r d e v e l o p m e n t u p T O 2 0 5 0<br />
EaSTern Europe/EurasiA<br />
Total capacity in MW<br />
2009 <strong>2010</strong> 2020 2030<br />
Reference scenario 484 869 5,869 13,369<br />
Moderate scenario 484 910 12,083 71,011<br />
Advanced scenario 484 938 15,784 86,815<br />
CHina<br />
Total capacity in MW<br />
2009 <strong>2010</strong> 2020 2030<br />
Reference scenario 25,805 32,805 70,305 95,305<br />
Moderate scenario 25,805 39,608 200,026 403,741<br />
Advanced scenario 25,805 41,030 250,397 513,246<br />
NON-Oecd aSia<br />
Total capacity in MW<br />
2009 <strong>2010</strong> 2020 2030<br />
Reference scenario 475 575 4,325 15,575<br />
Moderate scenario 475 709 24,204 120,313<br />
Advanced scenario 475 709 54,813 140,426<br />
Oecd Pacific<br />
Total capacity in MW<br />
2009 <strong>2010</strong> 2020 2030<br />
Reference scenario 4,613 5,318 10,568 18,568<br />
Moderate scenario 4,613 5,740 37,259 81,159<br />
Advanced scenario 4,613 5,870 47,876 109,367<br />
Middle EaST<br />
Total capacity in MW<br />
2009 <strong>2010</strong> 2020 2030<br />
Reference scenario 102 112 2,027 5,987<br />
Moderate scenario 102 119 2,487 24,791<br />
Advanced scenario 102 123 10,523 34,159<br />
INDIA<br />
Total capacity in MW<br />
2009 <strong>2010</strong> 2020 2030<br />
Reference scenario 10,926 12,276 24,026 30,526<br />
Moderate scenario 10,926 12,629 46,104 108,079<br />
Advanced scenario 10,926 12,833 65,181 160,741<br />
19
© EDP Renovavies<br />
Regional scenario resulTS<br />
20
Africa<br />
About a quarter of the world’s population has no access to<br />
electricity, and the problem is especially acute in peri-urban<br />
and rural areas in Sub-Saharan Africa. In many African countries,<br />
the electricity that is available is likely to be generated<br />
by means of diesel generators or other small-scale plant, very<br />
often using expensive imported fuel. More small generators<br />
keep individual businesses, hospitals and households running.<br />
The high cost of relying on imported fuels has a great impact<br />
on some African countries’ economies, and some of them<br />
spend a considerable share of their scarce foreign exchange<br />
reserves on <strong>energy</strong> imports.<br />
Local, national or regional grids – where they do exist – are<br />
challenged by the increasing demand from consumer equipment<br />
such as refrigerators, lighting, mobile phones, TVs and<br />
computers; and outages are often a regular feature. In many<br />
countries, it seems that the provision of a stable supply of<br />
electric power is either not a government priority, or is a<br />
priority that conflicts with other pressing issues such as provision<br />
of clean water, education and health care.<br />
Large-scale power production in Africa, where it exists, is likely<br />
to mean large hydro (as found in Egypt) or the coal-based<br />
generation that characterizes South Africa’s power system.<br />
Given Africa’s vast land mass and relatively low population<br />
density, it seems likely that a broad mix of decentralized<br />
technologies will have the flexibility to meet the needs of<br />
many of its countries. <strong>Wind</strong> power, because of its scalability,<br />
can play a key role in both decentralized and in centralized<br />
systems.<br />
Africa’s wind resource is best around the coasts and in the<br />
eastern highlands, and it is in Mediterranean North Africa<br />
that wind power has been developed at scale. This, too, is<br />
where current national policies are set to grow the sector<br />
further. At the end of 2009, about 96% of the continent’s<br />
total wind installations of 763 MW were to be found in Egypt<br />
(430 MW), Morocco (253 MW) and Tunisia (54 MW).<br />
Egypt<br />
In February 2008, Egypt’s Supreme <strong>Council</strong> of <strong>Energy</strong> approved<br />
a plan to produce 20% of its electric power from<br />
Zafarana wind farm, Egypt<br />
© <strong>Wind</strong> Power Works<br />
renewable sources by 2020. This target includes a 12%<br />
contribution from wind <strong>energy</strong>, which translates into more<br />
than 7,200 MW of grid-connected wind farms. Egypt’s best<br />
developed wind region so far is the Zafarana district, with<br />
some 430 MW that have been put in place during recent<br />
years, and a further 120 MW due to come online by the end<br />
of <strong>2010</strong>. There are also plans to construct four 250 MW<br />
plants on the Red Sea coast at Gabal el-Zeit. Tendering takes<br />
place in September <strong>2010</strong>, open to ten companies shortlisted<br />
from earlier applications, and the project is expected to start<br />
operations in 2014 or 2015. Over 7 GW of wind power could<br />
potentially be developed by 2020 in this area of Egypt alone.<br />
Morocco<br />
Morocco has excellent wind resources along nearly its entire<br />
coastline, as well as inland near the Atlas Mountains. 1<br />
The Moroccan government has set a target of raising the<br />
contribution of renewable <strong>energy</strong> to 18% of the national<br />
electricity consumption (up from 7.9%) by 2012. <strong>Wind</strong> power<br />
is poised to play a key role for reaching this goal with a targeted<br />
1,500 MW of capacity, up from the existing 253 MW at<br />
the end of 2009. This target is likely to be met through both<br />
a 300 MW grid connected wind farm currently planned in<br />
Tarfaya, and plans by industrial companies to install around<br />
1,000 MW of wind <strong>energy</strong> for their own consumption.<br />
1 For wind resource map of Morocco, please see http://www.wind-energie.de/fileadmin/<br />
dokumente/Themen_A-Z/Entwicklungsdialog/GTZ_terna-haddouch-2006.pdf (slide 15)<br />
21
R e g i o n a l s c e n a r i o r e s u l T S<br />
South aFrica<br />
South Africa’s electricity market is at a cross roads, and facing<br />
numerous challenges. The current electricity system, which<br />
is primarily based on coal, suffers from low reserve margins.<br />
Current power generation infrastructure is now barely<br />
adequate to meet demand, and state utility Eskom estimates<br />
that South Africa needs to construct 40 GW of new generating<br />
capacity by 2025, about 12.5 GW of which is already<br />
under construction.<br />
South Africa is ideally suited for wind power development,<br />
given its abundant wind resources, ample suitable sites and<br />
modern high voltage electrical infrastructure.<br />
AFRICA: CUMULATIVE WIND POWER capaciTY 2009-2030<br />
80,000<br />
70,000<br />
60,000<br />
50,000<br />
40,000<br />
30,000<br />
20,000<br />
10,000<br />
0<br />
[MW]<br />
Reference<br />
Moderate<br />
Advanced<br />
2009 <strong>2010</strong> 2015 2020 2030<br />
Year Reference Moderate Advanced<br />
2009 763 763 763<br />
<strong>2010</strong> 1,000 1,002 1,008<br />
2015 2,000 3,807 5,284<br />
2020 3,000 11,718 19,325<br />
2030 8,000 41,536 67,368<br />
While so far, only one commercial-scale wind farm (the<br />
7 MW Darling wind farm) is in operation, the South African<br />
<strong>Wind</strong> <strong>Energy</strong> Association (SAWEA) estimates that with the<br />
right policy framework, wind power could provide as much<br />
as 20% of the country’s <strong>energy</strong> demand by 2025, translating<br />
into 30,000 MW of installed wind capacity. According to<br />
SAWEA, 7,000 MW of this wind capacity are already at various<br />
stages of development, and many projects will be ready<br />
for construction within the next 12-18 months, assuming<br />
that they get confirmation of a grid connection and a Power<br />
Purchase Agreement (PPA).<br />
Unfortunately, however, the current framework conditions<br />
(both in terms of policy and market structure) are not conducive<br />
to such fast wind power development. A feed-in tariff<br />
for wind power was announced in 2009, but it is yet unclear<br />
if there will be a long-term government commitment to wind<br />
power, and several issues remain unsolved. One of these<br />
concerns the fact that the vertically integrated state utility<br />
Eskom controls generation (which is primarily based on coal),<br />
transmission and supply of electricity across the country,<br />
making it difficult for independent power producers to access<br />
the market.<br />
EaST aFrica<br />
Interestingly there have recently been developments in East<br />
Africa – with a 300 MW project under construction in Kenya<br />
and other wind projects well advanced in Ethiopia and Tanzania.<br />
Hopefully these early projects, which will in and of themselves<br />
make a substantial contribution to the total generating<br />
capacity in each of these countries, are a harbinger of a much<br />
broader uptake of wind on the continent in the coming years.<br />
The gWEO scenariOS FOr aFrica<br />
Given Africa’s vast potential for wind power development,<br />
especially in the North, along the coasts, and in South Africa,<br />
the GWEO scenarios differ substantially from those presented<br />
by the IEA.<br />
Under the IEA’s Reference scenario, only 200 MW of new<br />
wind power capacity would be added every year until 2020<br />
(less than in 2009), and this would increase to 500 MW by<br />
2030. This would result in 3,000 MW of wind power installed<br />
on the entire African continent by 2020 and 8,000 by 2030,<br />
producing 7.3 TWh in 2020 and close to 20 TWh in 2030.<br />
This would trigger an annual investment of €250 million and<br />
€600 million respectively, and create between 4,000 and<br />
8,000 jobs.<br />
The GWEO scenarios, however, are considerably more<br />
optimistic, taking into account existing policy measures and<br />
government targets.<br />
Under the Moderate scenario, wind power would deliver<br />
more than four times as much power by 2020 as the IEA<br />
forecasts, with an installed capacity of 11,700 MW generating<br />
28.4 TWh every year. This would then grow by 2,000 -<br />
3,000 MW every year up to 2030, when more than 40 GW<br />
would be installed, producing over 100 TWh of clean electricity<br />
for Africa. This would not only help the continent’s elec-<br />
22
R e g i o n a l s c e n a r i o r e s u l T S<br />
China<br />
The performance of China’s wind sector in 2009 managed to<br />
surprise even many optimists in the industry. China added<br />
a record-breaking 13.8 GW of new wind power capacity<br />
(compared with 6.3 GW the previous year), making it a world<br />
leader in terms of new installations in 2009. Notably, 2009<br />
also saw Chinese turbine manufacturers take a quarter share<br />
of the global market, confirming the solidity of the homegrown<br />
industry.<br />
Tan Jing wind farm, China<br />
© Nordex<br />
China’s expansion in the wind industry is worth viewing<br />
against the background of this growing economy’s broader<br />
electric power sector, where heavy investments are also<br />
being made in new coal, gas, hydro and nuclear generation.<br />
China’s total power generating capacity grew by some 11% in<br />
2008 (2009 figure not yet available), while wind power more<br />
than doubled in that year. In 2009 alone, more wind power<br />
was added to the Chinese power grid than the total amount<br />
of operating nuclear power stations (13.8 vs 9 GW). However,<br />
despite this tremendous growth, wind power still only covers<br />
less than 1% of China’s total electricity demand.<br />
trification and <strong>energy</strong> independence, but also its economies;<br />
more than €2.2 billion would be invested in wind power every<br />
year by 2020, and this would increase to 3.5 billion annually<br />
by 2030; and 30,000-50,000 jobs would be created.<br />
The Advanced scenario assumes that even more effort will<br />
be taken to exploit Africa’s wind resources. It shows how, by<br />
2020, close to 20 GW of wind power capacity could produce<br />
47 TWh of electricity, growing to 165 TWh by 2030. <strong>Wind</strong><br />
power would then be able to play a key role in developing a<br />
sustainable <strong>energy</strong> future, by displacing 28 million tons of<br />
CO2 every year by 2020 and close to a billion tons by 2030,<br />
cleaning the air and increasing <strong>energy</strong> security at the same<br />
time.<br />
Economically, too, this development could have a substantial<br />
impact in Africa’s wind rich nations. With annual investments<br />
in the order of €4.6 billion in 2020 and €5.6 billion in 2030,<br />
wind power could grow to become a considerable industry<br />
in Africa. The development of local manufacturing facilities<br />
would provide jobs for 60,000-80,000 people across the<br />
continent, and the avoided costs of imported fuel would have<br />
a very positive effect on these nations’ foreign exchange.<br />
Policy<br />
The growth experienced by China’s wind industry over the<br />
past five years has been driven mainly by national renewable<br />
<strong>energy</strong> policies, as well as very active participation in the<br />
UNFCCC’s Clean Development Mechanism.<br />
The start of the government’s active engagement in renewable<br />
<strong>energy</strong> development dates back to 2004, when the<br />
nation was drafting its first Renewable <strong>Energy</strong> Law. This law,<br />
which was passed in 2005 and entered into force in 2006,<br />
marked a shift in <strong>energy</strong> policy by requiring grid companies<br />
to purchase all the electricity that is produced from renewable<br />
sources. The wind industry has grown rapidly since its<br />
introduction: the market grew by 60% in the year the law<br />
was passed, followed by four consecutive years of more than<br />
100% growth (2006-2009).<br />
The Chinese government clarified its long-term commitment<br />
to renewable <strong>energy</strong> through its ‘Medium and Long-term<br />
Development Plan for Renewable <strong>Energy</strong> in China’, released<br />
in September 2007. The plan set a target for a mandatory<br />
market share (MMS) of electricity from renewable sources<br />
– by <strong>2010</strong> and 2020, electricity production from non-hydro<br />
23
R e g i o n a l s c e n a r i o r e s u l T S<br />
Turbine manufacturing<br />
Two ways China has addressed the economics of wind power<br />
plants are economy of scale, by developing large-scale projects,<br />
and local manufacture of wind turbines and other equipment.<br />
In the past, turbines manufactured by international<br />
players dominated the market, but this changed rapidly as<br />
the growing market and clear policy direction have encouraged<br />
the establishment of domestic players.<br />
Xioa Yan Kou wind farm, Rudong, China<br />
© <strong>Wind</strong> Power Works<br />
renewable sources should account for 1% and 3% of total<br />
electricity in the grid (indicating a target of about 18-20 GW<br />
of installed capacity by <strong>2010</strong> and 80-100 GW by 2020).<br />
The plan also requires larger power producers to generate 3%<br />
of their electricity from non hydro renewable <strong>energy</strong> sources<br />
by <strong>2010</strong>, and 8% by 2020. In 2008 the government identified<br />
six locations in provinces with the country’s best wind<br />
resources, and set each of them a target – ranging between<br />
10 GW and 23 GW – to reach by 2020.<br />
EconOMics OF wind development<br />
Until the introduction of new feed-in tariffs for wind power in<br />
2009, China had a dual track system for wind projects, with a<br />
concession tendering process on the one hand, and the projectby-project<br />
‘government approval’ process on the other. The<br />
2009 feed-in tariff now replaces both these processes, except<br />
for the ‘wind-base’ projects and the new offshore development.<br />
Now, there are four different categories of tariff depending<br />
on a region’s wind resources, ranging from 0.51 RMB/kWh<br />
to 0.61 rMB/kWh 1 . Not only is the feed-in tariff comparable to<br />
that of the government approved tariffs over the past several<br />
years in most regions; and substantially higher than most tariffs<br />
granted under the old concession system; it is set considerably<br />
higher than the tariff paid for coal-fired electricity, which<br />
helps rebalance the attractiveness of investments in these two<br />
technologies. Further, the feed-in tariff applies for the whole<br />
operational period of a wind farm – providing investors with a<br />
much clearer long-term perspective.<br />
2009 was something of a turning point for the rapidly growing<br />
domestic industry, in the sense that it has completed its<br />
localization and is now gearing up for the international market.<br />
Yet it seems unlikely that all manufacturers can survive in<br />
this toughly competitive market. By the end of 2009, China<br />
had almost 80 wind turbine manufacturing businesses, about<br />
30 of which had already sold their products into the market.<br />
However, in spite of these numbers, three top Chinese<br />
manufacturers currently dominate the wind <strong>energy</strong> sector<br />
in China. Goldwind, Sinovel and Dongfang all earned a place<br />
in the world’s top ten manufacturers in 2009, and United<br />
Power and Mingyang made the top 15. Yet, unless the export<br />
market for Chinese wind equipment increases considerably or<br />
the home market expands further than predicted, there will<br />
be little room for the remaining 60 Chinese manufacturers<br />
alongside the established Chinese players and the international<br />
companies that manufacture in China.<br />
Chinese turbine manufacturers are also readying themselves<br />
to enter the international market, albeit from modest beginnings.<br />
Only 21 Chinese-made wind turbines were exported<br />
in 2009 (to the US, India and Thailand), according to the<br />
Chinese <strong>Wind</strong> <strong>Energy</strong> Association (CWEA).<br />
TranSMiSSion<br />
It is by no means uncommon for a growing wind sector to<br />
run up against the constraints of a limited power transmission<br />
system. In China, which is experiencing rapid economic<br />
growth and an unprecedented expansion of its power sector,<br />
the grid infrastructure is proving to be a serious issue, especially<br />
in areas with high wind speeds, such as the Northwest,<br />
the North and the Northeast of China. This problem has both<br />
institutional and technological aspects.<br />
1 Equivalent to €5.9 - 7.1 cents/kWh in September <strong>2010</strong><br />
24
R e g i o n a l s c e n a r i o r e s u l T S<br />
2 PennWell: <strong>Global</strong> Power Review, <strong>2010</strong>.<br />
Politically, the low official target for wind power development<br />
in China (30 GW by 2020, a figure that should in reality<br />
already have been reached in mid-<strong>2010</strong>) provides a welcome<br />
excuse for delays in infrastructure upgrades. The lack of<br />
suitable power grids in turn discourages grid operators from<br />
accepting more wind power into the grid. While under the<br />
existing legislation, grid companies are obliged to buy power<br />
generated from renewable sources, there are no penalties for<br />
non-compliance with this provision, and no compensation is<br />
paid to wind farm operators for the losses they incur when<br />
failing to sell their power. Although this issue was addressed<br />
by the 2009 amendments to the Renewable <strong>Energy</strong> Support<br />
law, it is not yet clear if it will be effective.<br />
Overall, however, there is no doubt that given the need for<br />
fuelling the country’s growing economy, more power grids<br />
will be built in China. One indication is the priority that the<br />
Chinese government has given to infrastructure projects in its<br />
2008 economic recovery plan.<br />
The current power sector plans require the capacity of each<br />
of the west–east transmission connections to increase from<br />
about 7 GW (2005) to 40 GW by 2020 2 ; and as many of<br />
China’s prime wind sites are far to the west and north of main<br />
centres of population, exploiting them fully will require the<br />
construction of much new dedicated transmission.<br />
OFFShore wind in China<br />
Summer <strong>2010</strong> saw reports that China’s first offshore wind<br />
farm – the 102 MW Donghai Daqiao installation near Shanghai’s<br />
East Sea Bridge – has started feeding power into the<br />
transmission grid following completion of construction in<br />
February. 34 Sinovel 3 MW turbines make up the first phase<br />
of the wind farm. Construction also began this year on what<br />
will eventually be 1,000 MW of offshore wind off Shandong<br />
Province.<br />
In April 2009, the National <strong>Energy</strong> Administration (NEA)<br />
asked each of China’s coastal provinces to compile a provincial<br />
offshore wind development plan, and divided the<br />
potential offshore wind sites into three categories, depending<br />
on the depth of water: an ‘inter-tidal’ zone for water depth of<br />
less than 5 m; an ‘offshore’ zone for water depth of 5-50 m;<br />
and a ‘deep sea’ zone deeper than 50 m. The provincial gov-<br />
China: CUMULATIVE WIND POWER capaciTY 2009-2030<br />
600,000<br />
500,000<br />
400,000<br />
[MW] Reference<br />
Moderate<br />
Advanced<br />
300,000<br />
200,000<br />
100,000<br />
0<br />
2009 <strong>2010</strong> 2015 2020 2030<br />
Year Reference Moderate Advanced<br />
2009 25,805 25,805 25,805<br />
<strong>2010</strong> 32,805 39,608 41,030<br />
2015 45,305 115,088 134,712<br />
2020 70,305 200,026 250,397<br />
2030 95,305 403,741 513,246<br />
ernments are required to draft offshore development plans<br />
for ‘inter-tidal’ and ‘offshore’ wind development up to 2020.<br />
The GWEO scenariOS For China<br />
In our previous Outlook, published in 2008, the 2020 projections<br />
for total installed capacity in China were 27 GW under<br />
the Reference scenario, 101 GW under the Moderate growth<br />
scenario, and 201 GW under the Advanced growth scenario.<br />
Projections for capacity additions in <strong>2010</strong> were 9 GW<br />
(Reference), 17.5 GW (Moderate) and 19.6 GW (Advanced).<br />
However – by the end of 2009 China’s total installed capacity<br />
had already reached 25.8 GW. If <strong>2010</strong> sees the same level<br />
of new build as 2009, with no annual market growth at all,<br />
China will have close to 40 GW of wind power installed by<br />
the end of this year.<br />
With these developments in mind, the scenarios presented in<br />
this report have been updated radically, while the IEA’s Reference<br />
scenario remains rather pessimistic.<br />
According to the IEA, the Chinese wind <strong>energy</strong> market will experience<br />
a considerable decrease in annual installations from<br />
13.8 GW of new capacity added in 2009 to a mere 2.5 GW<br />
in 2015 and 2030. This would translate into a total installed<br />
capacity of 70 GW by 2020, which is significantly lower than<br />
the unofficial Chinese target of 150 GW by this time.<br />
This slump in the annual market would have a dramatic<br />
effect on investment and jobs in China, with investment<br />
figures dropping from the current €18.6 billion per year to a<br />
25
is looking at 135 GW of total installed capacity by 2015 and<br />
250 GW by 2020. This would grow to reach 513 GW by 2030,<br />
with annual markets growing to 25.5 GW over that period.<br />
This kind of very large scale deployment of wind <strong>energy</strong><br />
would have significant economic and environmental benefits<br />
for the world’s most populated country.<br />
By generating 330 TWh of clean electricity in 2015, wind<br />
power would start to make up a considerable share of China’s<br />
overall power demand, and this would grow to 614 TWh by<br />
2020 and as much as 1,258 TWh by 2030. This would represent<br />
around 11% of China’s total electricity consumption in<br />
2020, and 18% by 2030, based on the IEA’s assumptions for<br />
the country’s power consumption growth, and it would help<br />
fuel the country’s growing economy and provide a hedge<br />
against volatile fossil fuel prices.<br />
Helan Shan wind farm, China<br />
© Nordex<br />
mere 3.2 billion by 2015, and employment plummeting from<br />
an estimated 150,000-200,000 jobs to only 50,000 in this<br />
timeframe.<br />
Such development, as foreseen by the IEA, would not help<br />
China’s effort to curb its carbon emissions, as wind power<br />
would then save only 103 million tons of CO2 annually by<br />
2020, and 140 million tons by 2030.<br />
Such development would also result in more than €25 billion<br />
of investment flowing into the Chinese wind sector every<br />
year by 2030, which would go along with a doubling of the<br />
wind sector work force from the current 200,000 to reach<br />
close to 400,000 in this timeframe.<br />
And, last but not least, exploiting the country’s wind<br />
resources to this level would significantly improve China’s<br />
carbon emissions balance. By 2015, wind power would help<br />
save 190 million tons of CO2 every year, and this figure would<br />
grow to 750 million tons by 2030.<br />
Given the Chinese government’s commitment to developing<br />
the countries wind resources, the GWEO Moderate scenario<br />
foresees a more realistic continuation of wind power growth<br />
in China, with annual installations increasing from the current<br />
13.8 GW to 17.7 GW by 2020 and 22.1 GW by 2030. By 2015,<br />
the total installed capacity would increase to reach 115 GW,<br />
and this would grow to 200 GW by 2020 and 400 GW by<br />
2030.<br />
As a result, €21.3 billion would be invested in Chinese wind<br />
development every year by 2020, and 24.6 billion in 2030.<br />
Employment in the sector would grow from the currently<br />
estimated 200,000 jobs to reach close to 300,000 by 2020<br />
and 400,000 by 2030.<br />
But the GWEO shows that the wind development in China<br />
could go even further. The most ambitious Advanced scenario<br />
However, in order for China to fully exploit the economic and<br />
environmental benefits that wind power can offer, certain<br />
remaining obstacles need to be addressed. This concerns<br />
the issue of grid infrastructure to accommodate ever larger<br />
amounts of wind power in the national electricity grid and<br />
transport them from the windy but remote areas to population<br />
and industry centres.<br />
A different, yet related issue concerns the government target<br />
for wind power development. Although the current official<br />
target of 30 GW by 2020 has already been met, the target<br />
has not been increased yet. Ambitious targets, however, are<br />
key to demonstrating political commitment to wind power<br />
development, and to encouraging investment, both in manufacturing<br />
and in grids.<br />
26
R e g i o n a l s c e n a r i o r e s u l T S<br />
Eastern Europe/Eurasia<br />
This group of countries ranges from new EU members such<br />
as the Baltic states (Estonia, Latvia, Lithuania), Bosnia and<br />
Herzegovina, Croatia, Serbia, Slovenia, through Romania and<br />
Bulgaria and then eastwards into Russia and Ukraine, and<br />
finally south-eastwards into Central Asia, across the countries<br />
that used to make up the Soviet Union. The IEA has also<br />
included Cyprus and Malta in this grouping.<br />
The group covers radically different economies and power<br />
systems. Some countries, such as Turkmenistan or Azerbaijan,<br />
have massive reserves of oil and gas; others, such as Tajikistan<br />
and Albania meet their power needs almost entirely from<br />
hydro, while some countries have to import either electricity,<br />
fuel or both. Centre stage is resource-rich Russia, which<br />
is the world’s fourth-largest power generator. Many of these<br />
countries have power stations or pipelines that are now<br />
nearing the end of their life, and which will need replacement<br />
regardless of any increase in demand.<br />
All these areas have been assessed to some extent for their<br />
renewable <strong>energy</strong> potential, and much of this vast Eurasian<br />
landmass has excellent wind resources. 1 But how, when, and<br />
indeed whether this will be tapped is more tricky to answer.<br />
To date, the main wind developments have been in those<br />
eastern European and Baltic states which became members<br />
of the European Union in 2004 2 , such as Romania, Bulgaria<br />
and the Baltic states. These new member states had to apply<br />
the 2001 EU Renewables Directive, and their accession treaty<br />
set national indicative targets for renewable power production<br />
for each state. They are of course now also bound by the<br />
EU’s new legislation for 20% of the bloc’s <strong>energy</strong> consumption<br />
to come from renewable sources, which includes a binding<br />
target for each country.<br />
Another driver for the introduction of wind development<br />
across the Eastern Europe and Eurasia region has been the<br />
Joint Implementation mechanism that forms part of the<br />
Kyoto Protocol. Under this arrangement, any Annex 1 (industrialized)<br />
country can invest in emissions reduction projects<br />
in any other Annex 1 country as an alternative to reducing<br />
its own emissions. This mechanism was targeted at the socalled<br />
‘transition economies’, but as many of these have now<br />
© LM <strong>Wind</strong> Power<br />
become EU members, the main focus for JI is now on Russia<br />
and Ukraine. As of August <strong>2010</strong>, there were 30 wind <strong>energy</strong><br />
projects in the JI pipeline, totalling an installed capacity of<br />
1,280 MW. The largest one of these, at 300 MW, is located in<br />
Ukraine.<br />
<strong>Wind</strong> power development has already started in some of<br />
the countries covered in this section. While Romania, which<br />
according to the EU Directive must meet 24% of its <strong>energy</strong><br />
demand by renewables in 2020, had only 14 MW of wind<br />
power installed at the end of 2009, the country’s project<br />
pipeline is impressive. EWEA’s scenarios indicate that in 2020<br />
the country could have up to 3.5 GW installed, and the Romanian<br />
wind <strong>energy</strong> association believes that 3 GW could be<br />
reached as early as 2013. In April <strong>2010</strong>, Iberdrola Renovables<br />
was granted permission to build 1,500 MW of new wind capacity<br />
between 2011 and 2017, and German RWE is planning<br />
to develop 350 MW.<br />
The situation in Bulgaria is also promising. With a renewable<br />
<strong>energy</strong> target of 16% under the EU Directive, the country<br />
introduced favourable policies to promote renewable <strong>energy</strong><br />
development, and wind power installations have been growing<br />
considerably in recent years, with a total of 177 MW<br />
operating at the end of 2009. According to the EBRD, around<br />
1,000 MW worth of wind projects are currently at various<br />
planning stages, and the overall potential is estimated at<br />
around 2.2-3.4 GW.<br />
1 Much of the information in this chapter, including the resource assessment, is derived from the EBRD’s Renewable Development Initiative (www.ebrdrenewables.com)<br />
2 Note that some of these countries, such as Poland, are covered in the OECD Europe section<br />
27
R e g i o n a l s c e n a r i o r e s u l T S<br />
© GWEC © LM <strong>Wind</strong> Power<br />
The Baltic States have also started to develop wind power,<br />
with 142 MW of installed capacity in Estonia, 91 MW in<br />
Lithuania and 28 MW in Latvia at the end of 2009. Under<br />
the new EU Directive, these countries have binding targets<br />
of meeting 25%, 23% and 40% respectively of their <strong>energy</strong><br />
needs with renewable sources, and they all have significant<br />
wind resources, especially along the coastlines, which can go<br />
a long way towards achieving their goals.<br />
Russia is, due to its sheer size, key when it comes to determining<br />
potential renewable <strong>energy</strong> growth in this region. The<br />
world’s fourth-largest electricity generator of electric power<br />
produces 68% of its power from thermal power generation,<br />
21% from large hydro plants and 10% from nuclear power.<br />
‘New’ renewable <strong>energy</strong> currently only accounts for around<br />
1% of Russia’s electricity supply.<br />
Russia’s massive reserves of gas, coal and oil lead to a low<br />
cost of <strong>energy</strong>, which creates a challenge for the development<br />
of renewable sources. However, the country has a<br />
significant potential for renewable <strong>energy</strong> development, not<br />
least due to its size and geography.<br />
With many current power plants reaching the end of their<br />
lifetime, the Russian government estimates that 186 GW<br />
of new or replacement generation capacity is needed by<br />
2020. Part of Russia’s strategy is to reduce the proportion<br />
of its power generation from gas, partly by addition of more<br />
nuclear power and large hydro. However, in January 2009<br />
the government set a target for renewable power generation<br />
to supply 4.5% of demand by 2020, up from less than 1% at<br />
present. In a system as large as Russia’s, this signifies an additional<br />
22 GW of new renewables generation – the Russian<br />
<strong>Wind</strong> <strong>Energy</strong> Association calculates that this could include<br />
7 GW of new wind power by 2020.<br />
Russia has huge potential for wind power development, according<br />
to the EBRD, with the windiest regions concentrated<br />
along the coastline, in the steppes and in the mountains,<br />
mainly in the North and West of the country. To date, the<br />
development of the wind sector has been slow, with only a<br />
little over 20 MW of wind installed, and no new construction<br />
of commercial wind farms since 2002. More recently, however,<br />
the wind power industry in Russia has started gaining a<br />
little bit of traction, with a demonstration project becoming<br />
operational in Murmansk in 2008. Planning has also begun to<br />
build a large-scale wind farm in the same region. At present<br />
more than 1,700 MW of wind projects are reported to be<br />
under development.<br />
Ukraine, also a country covering a vast land mass, has good<br />
wind resources and a developing economy. According to<br />
EBRD estimates, over 40% of the country’s territory would be<br />
suitable for wind generation. About 5,000 MW of wind power<br />
could be developed in the mid-term, and as much as 20-30%<br />
of the country’s total electricity demand could be met by<br />
wind. In 1996, the Ukrainian government announced a target<br />
of installing 200 MW by <strong>2010</strong>, but by the end of 2009, only<br />
94 MW had been reached.<br />
Further east, several countries including Kazakhstan,<br />
Turkmenistan, Azerbaijan and Uzbekistan have areas with<br />
28
R e g i o n a l s c e n a r i o r e s u l T S<br />
EaSTern Europe/Eurasia: cuMulaTive <strong>Wind</strong> POWer capaciTY 2009-2030<br />
100.000 [MW] Reference<br />
80.000<br />
Moderate<br />
Advanced<br />
60.000<br />
40.000<br />
20.000<br />
0<br />
2009 <strong>2010</strong> 2015 2020 2030<br />
Year Reference Moderate Advanced<br />
2009 484 484 484<br />
<strong>2010</strong> 869 910 938<br />
2015 3,369 4,214 4,073<br />
2020 5,869 12,083 15,784<br />
2030 13,369 71,011 86,815<br />
excellent wind resources, but large oil and gas reserves have<br />
to date been a disincentive to any renewable <strong>energy</strong> development.<br />
Countries with fewer fossil fuel resources, such as Kyrgyzstan,<br />
Georgia and Tajikistan might be more promising<br />
for wind power development in the short and medium term,<br />
but no development has taken place to date.<br />
The GWEO scenariOS For EaSTern Europe/<br />
Eurasia<br />
Apart from the new EU member states in this region, which are<br />
undertaking considerable efforts to catch up in terms of renewable<br />
<strong>energy</strong> deployment, no significant development has taken<br />
place in Eastern Europe. Prognostication of the installed wind<br />
power capacity in the near and mid-term future is particularly<br />
difficult in this region, as this will largely depend on political<br />
decisions in some key countries, especially Russia and Ukraine.<br />
If these governments decide to exploit the tremendous resource<br />
at their doorstep and provide the necessary incentives<br />
for attracting investors, wind power generation could play<br />
a key role in fuelling these growing economies. Without this<br />
political will, however, the wind markets are set to stagnate.<br />
According to the IEA’s Reference scenario, this is exactly what<br />
will happen. This scenario sees annual markets across the<br />
whole region (including the new EU member states) increase<br />
from 275 MW in 2009 to reach 500 MW by 2015, and then<br />
750 MW by 2030. This would result in a total installed capacity<br />
of close to 6 GW by 2020 and 13 GW by 2030, up from<br />
under 500 MW in 2009.<br />
Such a development would not have any substantial impact<br />
on power generation, economic growth or emissions savings<br />
in these countries. In 2020, wind power would only produce<br />
14.3 TWh across the entire region – compared to an estimated<br />
electricity consumption of 880 TWh in Russia alone<br />
at that time and 1,500 TWh in the whole region of Eastern<br />
Europe/Eurasia, according to the IEA.<br />
Investment in wind equipment would also be negligible,<br />
amounting to only around €600 million in 2020, and employment<br />
in the wind sector would stand at around 8,500<br />
jobs by then.<br />
The Moderate scenario is slightly more optimistic, assuming<br />
that both the EU member states and some other countries<br />
with existing renewable <strong>energy</strong> targets will meet these as<br />
planned. This would result in annual markets increasing<br />
nearly tenfold between 2009 and 2020, and reaching more<br />
than 8GW by 2030. The installed capacity would then stand<br />
at 12 GW in 2020 and 71 GW by 2030.<br />
The resulting benefits for power generation and climate<br />
protection would be more sizeable under this scenario. In<br />
2020, wind power would produce close to 30 TWh of clean<br />
electricity, and this would grow to 174 TWh by 2030, saving<br />
17.7 mil tCO2 and 104.5 mil tCO2 respectively. If we consider<br />
that the region’s electricity demand is forecast to reach<br />
1,800 TWh by 2030, though, the overall share of wind power<br />
in the electricity system would still be rather small compared<br />
to other regions in this scenario.<br />
In terms of investment and jobs, the Moderate scenario<br />
figures would translate into investments worth €2.7 billion<br />
in 2020, creating 33,000 jobs, and €9.1 billion in 2030 with<br />
a workforce of 121,500 million people employed in the wind<br />
sector.<br />
The figures in the Advanced scenario are slightly higher. Here,<br />
15.8 GW of wind power would be installed by 2020, producing<br />
38.7 TWh and saving 23 million tons of CO2. Annual markets<br />
running at around 4 GW in 2020 would attract €4.8 billion<br />
in investment every year, and this would increase to close<br />
to 10 GW by 2030, which would translate into €10.6 billion<br />
invested in the sector. More than 145,000 people would by<br />
then be working in the field of wind <strong>energy</strong>.<br />
29
R e g i o n a l s c e n a r i o r e s u l T S<br />
India<br />
India’s rapidly growing economy and expanding population<br />
make it hungry for electric power. In spite of major capacity<br />
additions over recent decades, power supply struggles to<br />
keep up with demand. Electricity shortages are common, and<br />
a significant part of the population has no access to electricity<br />
at all. India’s electricity demand is projected to more<br />
than triple between 2005 and 2030. The IEA predicts that by<br />
2020, 327 GW of power generation capacity will be needed,<br />
which would imply the addition of 16 GW per year.<br />
This urgent need is reflected in the target the Indian government<br />
has set in its 11th Five Year Plan (2007-2012), which<br />
envisages an addition of 78.7 GW in this period, 50.5 GW of<br />
which is coal, and 10.5 GW new wind generation capacity,<br />
plus 3.5 GW other renewables.<br />
The Indian Ministry of New and Renewable <strong>Energy</strong> (MNRE)<br />
estimates that there is a potential of around 90 GW for<br />
power generation from different renewable <strong>energy</strong> sources in<br />
the country, including 48.5 GW of wind power, 14.3 GW of<br />
small hydro power and 26.4 GW of biomass.<br />
The current figures are based on measurements from only<br />
nine states, and which were taken at low hub heights, in line<br />
with old technology. A more recent wind atlas published by<br />
the Center for <strong>Wind</strong> Technology (CWET) in April <strong>2010</strong> estimated<br />
the resource potential at 49,130 MW. This was based<br />
on an assumed land availability of 2% and 9 MW of installable<br />
wind power capacity per square kilometre.<br />
Gujarat wind farm, Kutch, India<br />
© <strong>Wind</strong> Power Works<br />
the southern state of Tamil Nadu, which maintains its position<br />
as the state with the largest wind power installation.<br />
It had 4.6 GW installed on 31 March <strong>2010</strong>, representing<br />
close to 40% of India’s total wind capacity. This is beginning<br />
to change as other states, including Maharashtra, Gujarat,<br />
Rajasthan, Karnataka, West Bengal, Madhya Pradesh and<br />
Andhra Pradesh start to catch up, partly driven by new policy<br />
measures.<br />
India ratified the Kyoto Protocol in August 2002, and the<br />
possibility to register projects under the Clean Development<br />
Mechanism (CDM) provided a further incentive to wind<br />
<strong>energy</strong> development. By 1 September <strong>2010</strong>, 416 Indian wind<br />
projects were in the CDM pipeline, accounting for 6,839 MW,<br />
second only to China.<br />
It seems likely that the wind power potential is considerably<br />
underestimated. The Indian <strong>Wind</strong> Turbine Manufacturers<br />
Association (IWTMA) estimates that at hub heights of 55–<br />
65 metres, potential for wind development in India is around<br />
65–70 GW. The World Institute for Sustainable <strong>Energy</strong>, India<br />
(WISE) considers that with larger turbines, greater land<br />
availability and expanded resource exploration, the potential<br />
could be as great as 100 GW. 1<br />
At the end of 2009, India had 10,926 MW of installed wind<br />
capacity, and 11,807 MW were reached by the end of the<br />
country’s financial year on 31 March <strong>2010</strong>. However, wind<br />
power in India is concentrated in a few regions, especially<br />
1 WISE (G.M. Pillai): <strong>Wind</strong> Power Development in India, 2006.<br />
India’s wind <strong>energy</strong> potential has only been partially realised<br />
due to the lack of a coherent national renewable <strong>energy</strong><br />
policy. Currently, the promotion of renewable <strong>energy</strong> in India<br />
is mainly driven by state governments. While some states<br />
have set high renewable portfolio standards, other states<br />
only have low or no targets, and enforcement is insufficient.<br />
Furthermore, while in theory, RPS and feed-in-tariffs can<br />
coexist, this needs to be well managed to avoid inefficiencies.<br />
The lack of a national policy is hampering genuine progress.<br />
Until very recently, the promotion of renewable power generation<br />
at a national level relied on one clause of the 2003<br />
Electricity Act. This act restructured the Indian electricity<br />
industry by unbundling the vertically integrated electricity<br />
supply utilities in the Indian States and establishing<br />
30
R e g i o n a l s c e n a r i o r e s u l T S<br />
State Regulatory Commissions (SERCs) in charge of setting<br />
electricity tariffs. It also required the SERCs to set Renewable<br />
Portfolio Standards for electricity production in their state,<br />
and the Ministry for New and Renewable <strong>Energy</strong> (MNRE)<br />
issued guidelines to all state governments to create an attractive<br />
environment for the export, purchase, wheeling and<br />
banking of electricity generated by wind power projects.<br />
Some of the government’s broad national policy guidelines<br />
include fiscal and financial incentives, wheeling, banking and<br />
third party sales, buy-back facility by states, land policies<br />
favouring wind farm development, financial assistance, and<br />
wind resource assessment.<br />
In December 2009, India’s Ministry of New and Renewable<br />
<strong>Energy</strong> (MNRE) announced a national generation-based<br />
incentive (GBI) scheme for grid connected wind power<br />
projects, for the cumulative capacity of 4,000 MW to be<br />
commissioned by March 2012. The GBI scheme provides an<br />
incentive of 0.5 Rupees per KWh (0.8 Euro cents) in addition<br />
to the existing state feed-in tariff. Investors who because of<br />
their small size or lack of tax liability cannot benefit from<br />
accelerated depreciation under the Income Tax Act can opt<br />
for this alternative incentive instead, up to 31 March 2012 or<br />
before the introduction of a new Direct Tax Code, whichever<br />
is earlier. After this date, the Accelerated Depreciation may<br />
be phased out. This should facilitate the entry of large Independent<br />
Power Producers (IPPs) into the wind market, attract<br />
foreign direct investment and level the playing field between<br />
different types of investors. In addition, since this incentive is<br />
based on actual electricity production, rather than installation,<br />
it stimulates higher efficiencies.<br />
India has a solid domestic manufacturing base, with current<br />
production capacity of 4,500-5,000 MW/year. <strong>Wind</strong> turbine<br />
manufacturers operating in India include Indian company Suzlon,<br />
which is now a global leader. 17 companies now manufacture<br />
wind turbines in India and another eight are in the<br />
process of entering the Indian wind power market, through<br />
either joint venture under licensed production, as subsidiaries<br />
of foreign companies or as Indian companies with their own<br />
technology. Thanks to new market entrants, it is expected<br />
that the annual production capacity will rise to 10,000+ MW<br />
by 2012-2013, according to WISE.<br />
Some of these foreign companies now source more than 80%<br />
of the components for their Indian-manufactured turbines<br />
India: CUMULATIVE WIND POWER capaciTY 2009-2030<br />
200,000<br />
150,000<br />
[MW] Reference<br />
Moderate<br />
Advanced<br />
100,000<br />
50,000<br />
0<br />
2009 <strong>2010</strong> 2015 2020 2030<br />
Year Reference Moderate Advanced<br />
2009 10,926 10,926 10,926<br />
<strong>2010</strong> 12,276 12,629 12,833<br />
2015 19,026 24,747 29,151<br />
2020 24,026 46,104 65,181<br />
2030 30,526 108,079 160,741<br />
from India. <strong>Wind</strong> turbines and turbine blades have been<br />
exported from India to the USA, Europe, Australia, China and<br />
Brazil.<br />
However, for India to reach its potential and to boost the<br />
necessary investment in renewable <strong>energy</strong>, it will be essential<br />
to introduce clear, stable and long-term support policies,<br />
carefully designed to ensure that they operate in harmony<br />
with existing state level mechanisms and do not reduce their<br />
effectiveness.<br />
The GWEO scenariOS For India<br />
Under the IEA’s Reference scenario, India’s wind power<br />
market would shrink considerably from the current annual<br />
additions of around 1,300 MW to only 600 MW per year by<br />
2030. The result would be a total installed capacity of 24 GW<br />
by 2020 and 30.5 GW by 2030. <strong>Wind</strong> power would then<br />
produce close to 60 TWh every year by 2020 and 75 TWh by<br />
2030, and save 35 million tons of CO2 in 2020 and 45 million<br />
tons in 2030. Investments in wind power in India would also<br />
drop from the current levels of €1.7 billion per year to only<br />
€730 million by 2030.<br />
Under the GWEO scenarios, we expect that by the end of<br />
<strong>2010</strong>, between 12,600 MW and 12,800 MW will be installed<br />
in India. Under the Moderate scenario, the total installed<br />
capacity would reach almost 25 GW by 2015, and this would<br />
go on to grow to 46 GW by 2020 and 108 GW by 2030.<br />
31
R e g i o n a l s c e n a r i o r e s u l T S<br />
Latin America<br />
Latin America, a region of great cultural and economic diversity,<br />
has some of the world’s best wind resources. Home to<br />
many growing economies with increasing electricity demand,<br />
plus a broad commitment to environmental protection, this<br />
part of the world is considered prime territory for the deployment<br />
of wind power. 1<br />
Gujarat wind farm, Kutch, India<br />
© <strong>Wind</strong> Power Works<br />
In this scenario, €3.7 billion would be invested in Indian wind<br />
development every year by 2020, representing a quadrupling<br />
of 2009 investment figures. Employment in the sector<br />
would grow from the currently estimated 21,400 jobs to over<br />
84,000 by 2020 and 113,000 ten years later.<br />
Yet the GWEO Advanced scenario shows that the wind development<br />
in India could go much further: By 2020 India could<br />
have almost 75 GW of wind power in operation, supplying<br />
183 TWh of electricity each year, while employing almost<br />
150,000 people in the sector and saving almost 173.5 million<br />
tonnes of CO2 emissions each year. Investment would by<br />
then have reached a level of €7 billion per year.<br />
As mentioned above, the IEA Reference scenario predicts that<br />
by 2020, a total of 327 GW of power generation capacity will<br />
be needed in India, which would imply an addition of 16 GW<br />
per year. As the Advanced scenario shows, wind power could<br />
be providing a significant proportion of this by 2020.<br />
Beginnings have been modest to date. At the end of 2009,<br />
only 1,072 MW of wind power capacity had been installed<br />
across the entire region. 505 MW of this was installed during<br />
2009, with new wind installations in six countries. There are<br />
signs, however, that wind power is now finally reaching critical<br />
mass in a number of Latin American markets, and that the<br />
region is on the verge of developing a substantial wind power<br />
industry to complement the region’s rich hydro and biomass<br />
(and potentially solar) resources.<br />
However, we have to bear in mind that Latin America is far<br />
from being a homogeneous region. In fact, the continent’s<br />
40+ countries and overseas territories are at vastly different<br />
stages of economic development. There are a number of<br />
emerging economies in the region whose per capita income<br />
is similar to – or greater than – that of some new EU member<br />
states; yet at the same time the region is still plagued with<br />
extreme poverty and underdevelopment in some countries<br />
and sub-national regions.<br />
Brazil<br />
<strong>Wind</strong> power is making the most progress in Brazil, the region’s<br />
largest economy. This country has areas with tremendous<br />
potential for wind <strong>energy</strong>, combined with a growing<br />
electricity demand and solid industrial infrastructure.<br />
With that level of momentum established in India’s wind<br />
sector, the ten years between 2020 and 2030 would then<br />
see spectacular growth, more than doubling the installed<br />
capacity for wind power and taking it to over 160 GW under<br />
the Advanced scenario. This would go even further towards<br />
meeting India’s growing need for electric power. By 2030<br />
wind power would be generating almost 400,000 GWh per<br />
year and be avoiding the emission of 373 million tonnes of<br />
CO2 each year.<br />
Brazil has historically relied heavily on hydro power generation,<br />
which until recently produced 80% of the country’s<br />
electricity needs. As wind and hydro power work well<br />
together within a power system, this combination forms an<br />
ideal basis for large-scale wind power development.<br />
After a few early developments in the first half of this decade,<br />
the Brazilian wind market now seems to be taking off. In<br />
2008, 94 MW were added, and another 264 MW in 2009,<br />
1 Please note that Mexico is part of OECD North America, according to the IEA’s classification<br />
which is used in this report for comparison purposes<br />
32
Rio do Fogo wind farm, Brazil<br />
© <strong>Wind</strong> Power Works<br />
meaning that 606 MW were in operation by the end of 2009.<br />
During the first half of <strong>2010</strong>, another 180 MW had been<br />
added, with nearly 300 MW more under construction. Cumulative<br />
installed capacity should reach more than 900 MW by<br />
the end of the year.<br />
<strong>Wind</strong> projects awarded through the PROINFA programme<br />
account for over 95% of wind power installations to date in<br />
Brazil. This programme was initially passed by the Brazilian<br />
Congress in 2002 in order to stimulate the addition of over<br />
1,100 MW of wind <strong>energy</strong> capacity, which was later expanded<br />
to 1,400 MW. It looks increasingly likely that the 1,100 MW<br />
target will be met, if not necessarily the full 1,400 MW.<br />
In December 2009, the Brazilian <strong>energy</strong> regulator, Agencia<br />
Nacional de Energia Eletrica (ANEEL), hosted the country’s<br />
first wind-only auction. Through that, 71 wind <strong>energy</strong> projects<br />
were contracted for a total capacity of 1,800 MW. Two more<br />
auctions took place at the end of August <strong>2010</strong> with a total<br />
contract volume of about 2,000 MW.<br />
Argentina<br />
Argentina also has massive wind resources. Some analysts<br />
claim that the winds in Argentina are sufficient to supply<br />
Latin America’s entire electrical demand seven times over. 2 A<br />
tentative start at developing this resource was made during<br />
the 1990s; in fact, that is when almost all of Argentina’s currently<br />
operating wind farms were built. Since then, the country’s<br />
market has languished. New hope has now arisen with<br />
the tender of 500 MW of wind power under the GENREN<br />
programme with a target of 8% renewable electricity, and<br />
several new projects are under development.<br />
Other markeTS<br />
Another promising market is Chile, which had nearly 170 MW<br />
in operation at the end of 2009. A number of large wind<br />
power projects are under development, and they are desperately<br />
needed to help alleviate chronic gas shortages.<br />
Other wind power markets in the region include Costa Rica,<br />
which had about 120 MW of wind power at the end of 2009,<br />
and a new 50 MW project is expected to come on line in<br />
<strong>2010</strong>; Peru, which had nearly 150 MW under construction at<br />
the end of 2009; Uruguay, which has a target of 500 MW by<br />
2015; Venezuela with 100 MW currently under construction,<br />
scheduled to come on line in 2011; Jamaica, with 23 MW<br />
installed capacity, and Nicaragua, which added 40 MW of<br />
new wind 2009, thereby joining the list of countries with<br />
commercial-scale wind power development.<br />
2 Alan D. Poole: The Potential of Renewable <strong>Energy</strong> Resources for Electricity Generation in<br />
Latin America, 2009.<br />
Finally, although there is some development of wind power<br />
in the island economies in the Caribbean, which currently<br />
mostly rely on imported fossil fuels, wind power could play a<br />
much more substantial role in helping grow their economies<br />
on a more sustainable basis.<br />
Unfortunately, however, all of these early markets suffer from<br />
the lack of a clear, long-term policy framework for the devel-<br />
33
R e g i o n a l s c e n a r i o r e s u l T S<br />
Latin aMerica: cuMulaTive <strong>Wind</strong> POWer capaciTY 2009-2030<br />
100,000 [MW] Reference<br />
80,000<br />
Moderate<br />
Advanced<br />
60,000<br />
40,000<br />
20,000<br />
0<br />
2009 <strong>2010</strong> 2015 2020 2030<br />
Year Reference Moderate Advanced<br />
2009 1,072 1,072 1,072<br />
<strong>2010</strong> 1,522 1,956 2,082<br />
2015 2,522 11,932 13,329<br />
2020 4,772 28,004 42,224<br />
2030 10,522 72,044 93,347<br />
opment of a wind power industry, which continues to hamper<br />
market development. Signals are needed from governments<br />
indicating to the private sector and the finance community<br />
that there is clear political commitment to develop renewable<br />
<strong>energy</strong> in general and wind power in particular. This<br />
would at the same time foster economic development,<br />
attract investment and create the ‘green’ jobs that have been<br />
the object of government policy in many other parts of the<br />
world – as the scenario figures underline.<br />
The GWEO scenariOS For Latin aMerica<br />
from the 505 MW installed in 2009 to as little as 200 MW<br />
by 2015. Only by 2030 would it again reach its current size,<br />
according to the IEA’s Reference Scenario.<br />
The Moderate scenario, which takes into account current<br />
policies and targets, foresees a much more rapid development,<br />
with annual additions reaching 3,000 MW as early as<br />
2015, and more than 5,000 MW by 2030. This would bring<br />
the total installed wind capacity to 28 GW by 2020 and<br />
72 GW by 2030. The impact on electricity production would<br />
be considerable, with 68.7 TWh of wind power generated in<br />
2020 and 176.7 TWh in 2030.<br />
The Advanced scenario outlines that even more could be<br />
achieved, given the extraordinary wind conditions in many<br />
Latin American countries. If fully exploited, wind power<br />
could boom here, with more than 13.3 GW of wind power<br />
installed across the continent in 2015. This could then go on<br />
to increase to 42.2 GW by 2020 and as much as 93.3 GW by<br />
2030.<br />
With such a development, wind power would start to account<br />
for a significant part of electricity demand, producing<br />
more than 100 TWh by 2020 and 231 TWh by 2030.<br />
<strong>Wind</strong> power developed at such a scale would not only<br />
strengthen Latin America’s <strong>energy</strong> independence, but it<br />
would also have a direct impact on regional economic development<br />
and jobs.<br />
GWEC expects wind <strong>energy</strong> installations in Latin America to<br />
be considerably stronger than previously thought, with encouraging<br />
developments in markets such as Brazil, Argentina<br />
and Chile.<br />
Under the Reference scenario, wind power could provide<br />
Latin America with 26 TWh of electricity every year while<br />
saving 15.6 million tonnes of CO2 emissions by 2030; or it<br />
could, under the Advanced scenario, generate nearly ten<br />
times as much (231.4 TWh) and save 139 million tonnes of<br />
CO2 emissions per year by then. This stark difference underlines<br />
the enormous impact that a positive political framework<br />
can make across this wind-rich continent.<br />
In terms of employment, there were about 7,400 jobs in the<br />
Latin American wind sector in 2009. Under the Reference<br />
scenario, this number would fall to just over 3,600 by 2015<br />
and only reach current levels again in 2020. The Advanced<br />
scenario shows that from 2015 to 2030, the sector could,<br />
each year, have employment figures more than ten times as<br />
high as in the Reference scenario, reaching 100,000 by 2030.<br />
Equally, wind power would attract substantial investment;<br />
the Advanced scenario estimates that Latin America’s wind<br />
sector could be worth as much as €4.3 billion each year as<br />
early as 2015, growing to €6.5 billion by 2030, compared to<br />
just €680 million in 2009.<br />
Under the Reference scenario there would be 10.5 GW of<br />
wind installed across the entire continent by 2030. This<br />
would, in fact, mean that the annual market would shrink<br />
34
R e g i o n a l s c e n a r i o r e s u l T S<br />
Middle East<br />
As a region, the Middle East – classified by the IEA as Bahrain,<br />
Iran, Iraq, Israel, Jordan, Kuwait, Lebanon, Oman, Qatar, Saudi<br />
Arabia, Syria, United Arab Emirates and Yemen – is rich in oil<br />
and gas. Yet the economies of the various countries reflect<br />
the fact that these reserves are unevenly distributed – members<br />
of the Gulf Cooperation <strong>Council</strong> (Abu Dhabi, Bahrain,<br />
Kuwait, Saudi Arabia, Oman and Qatar) are generally most<br />
affluent. While those countries are major exporters of oil,<br />
others are importers, often at a very high cost compared to<br />
their overall GDP. Increased prosperity in much of the region<br />
means that the demand for power has been growing rapidly<br />
for industrial and consumer needs, with extra loads for cooling<br />
and desalination. Some of the wealthiest countries in<br />
the Middle East region are among the world’s most carbon<br />
intense economies.<br />
Given the overall aridity of the region, it may be surprising<br />
that hydro power is well developed in countries such as Iran,<br />
with some 7,500 MW of installed capacity generating just<br />
over 18 TWh per year and Syria with 1,500 MW, producing<br />
4 TWh per year. Iraq has 2,225 MW of installed hydro<br />
capacity but current production is only about 500 GWh/<br />
year 1 . Most other power production in the region is based on<br />
natural gas.<br />
A number of governments in the Middle East have developed<br />
national plans for renewable <strong>energy</strong>. The latest<br />
<strong>Energy</strong> [R]evolution Scenario 2 anticipates that, given political<br />
support and well-designed policy instruments, by 2050, 95%<br />
of the electricity produced in the Middle East could come<br />
from renewable <strong>energy</strong> sources – mainly wind, solar thermal<br />
<strong>energy</strong> and photovoltaics. The installed capacity of these<br />
renewable <strong>energy</strong> technologies will grow from the current<br />
10 GW to 556 GW in 2050, meeting 83% of the region’s<br />
demand for heating and cooling, says the report.<br />
As regards wind power, the region had 101 MW installed at<br />
end of 2009. While less evenly distributed than solar, the<br />
region’s wind resource is excellent in some areas, as several of<br />
the governments are now recognizing. Iran and Oman have<br />
good wind regimes, as do Syria and Jordan.<br />
© <strong>Wind</strong> Power Works<br />
Iran is the only country in the region with any large scale<br />
wind power installations. The country currently has two<br />
wind farms: the Manjil wind farm in Giland province, and the<br />
Binalook wind farm in Khorasan Razavi province, which have<br />
an installed capacity of 91 MW. There are plans for expanding<br />
wind capacity to reach 400 MW in the coming years.<br />
Studies have shown that overall, Iran has a potential for<br />
wind power development of around 15 GW 3 . Iran offers tax<br />
and investment credits to support renewables development.<br />
In addition, Iran is home to the region’s only wind turbine<br />
manufacturer, Saba Niroo.<br />
Jordan currently generates 1.5% of its electric power from<br />
renewable sources. Its policy is to achieve 7% of its primary<br />
<strong>energy</strong> demand from renewables by 2015, and 10% by 2020.<br />
In January <strong>2010</strong> the government passed a new Renewable<br />
<strong>Energy</strong> Law, which requires the National Electric Power<br />
Company (NEPCO) to purchase all electricity produced by<br />
independent and small-scale renewable plants at full retail<br />
price (net metering). The government is reportedly considering<br />
introducing an incentive system to promote investment<br />
in wind power, which could include a feed-in tariff.<br />
Jordan’s best wind resources are in Aqaba and the Jordan<br />
Valley, and the government intends to build 600 MW of wind<br />
by 2015 and a further 600-1,000 MW by 2020. In summer<br />
<strong>2010</strong> negotiations for Jordan’s first wind farm were under way<br />
again (having stalled earlier) – this is to be a 30-40 MW wind<br />
power plant in Kamshah.<br />
1 World <strong>Energy</strong> <strong>Council</strong>: Survey of <strong>Energy</strong> Resources, 2009: see www.world<strong>energy</strong>.org/documents/hydro_7_1_1.pdf<br />
2 www.<strong>energy</strong>blueprint.info<br />
3 University of Tehran: Recent Advances in the Implementation of <strong>Wind</strong> <strong>Energy</strong> in Iran, 2006. www.jgsee.kmutt.ac.th/see1/cd/file/B-002.pdf<br />
35
R e g i o n a l s c e n a r i o r e s u l T S<br />
Middle EaST: cuMulaTive <strong>Wind</strong> POWer capaciTY 2009-2030<br />
40.000<br />
35.000<br />
30.000<br />
25.000<br />
20.000<br />
15.000<br />
10.000<br />
5.000<br />
0<br />
[MW] Reference<br />
Moderate<br />
Advanced<br />
2009 <strong>2010</strong> 2015 2020 2030<br />
© <strong>Wind</strong> Power Works<br />
Year Reference Moderate Advanced<br />
2009 101 102 102<br />
<strong>2010</strong> 112 119 123<br />
2015 465 737 2,706<br />
2020 2,027 2,487 10,523<br />
2030 5,987 24,791 34,159<br />
Syria’s target is for renewable <strong>energy</strong> to make up 4.3% of<br />
primary <strong>energy</strong> demand by 2011, and it has two wind farms<br />
(100 MW and 30 MW) in planning, with two locations being<br />
opened up for investment by Syrian and foreign companies.<br />
the measured wind speeds were highest in summer months,<br />
when electricity demand in Oman is at its peak. 4<br />
The GWEO scenariOS For Middle EaST<br />
A new plan for Syrian <strong>energy</strong>, entitled ‘Masterplan for <strong>Energy</strong><br />
Efficiency and Renewable Energies’ (MEERE), is being drawn<br />
up together with the Germany’s GTZ (Gesellschaft für Technische<br />
Zusammenarbeit – German Technical Cooperation)<br />
and expected to be released later this year.<br />
Meanwhile an interim MEERE report from January <strong>2010</strong><br />
confirmed that Syria has good potential for wind <strong>energy</strong> development,<br />
and indicated that a possible 2030 target could<br />
be 1,000-1,500 MW.<br />
Oman is a small country with only 2.6 million inhabitants,<br />
and considerable reserves of natural gas and crude oil, and a<br />
total installed power generation capacity of around 3.5 GW.<br />
To meet increasing demand, this is forecast to grow by<br />
2.8 GW by 2014.<br />
Natural gas and oil exports account for around half of<br />
Oman’s GDP, and preserving its reserves is the key incentive<br />
for the government to look at developing the country’s<br />
renewable <strong>energy</strong> resources. A recent study commissioned by<br />
the government found an excellent potential for solar <strong>energy</strong><br />
deployment and considerable wind power potential. <strong>Wind</strong><br />
<strong>energy</strong> could be developed mainly in the southern part of<br />
Oman and in the mountains north of Salalah. Interestingly,<br />
Considering the significant potential for wind power in some<br />
Middle Eastern countries, the GWEO scenarios for the region<br />
are by far more optimistic than the IEA’s Reference scenario.<br />
This forecasts that the region’s total installed wind capacity,<br />
which stood at 101 MW by the end of 2009, will grow to<br />
around 2.5 GW by 2020 and 6 GW by 2030.<br />
Under the Moderate scenario, which takes into account current<br />
and anticipated government targets and a growing interest in<br />
reaping the benefits wind power can bring to the region, the Middle<br />
East’s installed wind capacity would grow to 2.5 GW by 2020<br />
and 24.8 GW by 2030. In the Advanced scenario, this would grow<br />
even further, to reach 10.5 GW by 2020 and 34.2 GW by 2030.<br />
The electricity generated through wind power in these<br />
scenarios would enable some of the Middle Eastern countries<br />
to improve their <strong>energy</strong> independence and help those rich in<br />
fossil fuel resources to realise considerable fuel savings.<br />
By 2020, between 6 (Moderate scenario) and 26 tWh (Advanced<br />
scenario) could be produced every year, and this would<br />
increase to 61-84 tWh by 2030. Accordingly, CO2 emission<br />
savings would be between 3.6 and 15.5 million tons per year by<br />
2020, and as much as 36.5 and 50 million tons by 2030.<br />
4 Authority for Electricity Regulation, Oman: Study on Renewable <strong>Energy</strong> Resources, Oman.<br />
May 2008. http://www.aer-oman.org/pdf/studyreport.pdf<br />
36
R e g i o n a l s c e n a r i o r e s u l T S<br />
Non-OECD Asia<br />
This region groups together all Asian countries apart from<br />
China, India, Japan and South Korea, which are covered in<br />
other sections. The ‘region’ ranges thus from Afghanistan<br />
through Mongolia, to Southeast Asia and the islands of the<br />
Pacific (see p. 18 for a full list of countries).<br />
At present, there is little development of wind power in many<br />
of these countries. However, that is not to say that there is<br />
no potential, or no plans. While one might expect a country<br />
such as Mongolia to have an outstanding wind resource,<br />
the potential for development in countries such as Vietnam<br />
or Laos may come as a surprise; for it is often believed that<br />
there is not a viable wind resource in the tropics – where<br />
many of these countries are located.<br />
Factors other than pure wind resource potential are involved<br />
in projecting when (or indeed if) wind power is likely to be<br />
developed and how much: demographic factors, dependence<br />
on fuel imports, economic growth and consequent increase in<br />
electrical demand, state of the transmission and distribution<br />
system, etc. One potential enabler open to many of these<br />
countries is the Clean Development Mechanism of the Kyoto<br />
Protocol (CDM), which can potentially stimulate investment<br />
in renewable <strong>energy</strong> projects by industrialized countries.<br />
While the take-up of this has already been very good in some<br />
sectors (such as in Thailand’s biomass power sector), there<br />
are so far few wind power projects in the CDM pipeline in<br />
the in this region – two in the Philippines, and one each in<br />
Mongolia, Vietnam and Sri Lanka.<br />
Across the region covered here there are at least a dozen<br />
vibrant and rapidly growing markets in which wind <strong>energy</strong><br />
could play a significant role. There is also a noticeable shift<br />
in the attitude of policymakers and utility executives to wind<br />
power. While wind would have been dismissed as ‘too expensive’<br />
by most developing country <strong>energy</strong> planners just a few<br />
years ago, the continuing success of the technology in an ever<br />
widening group of countries has changed that attitude to one<br />
of dramatically increased knowledge about wind generation<br />
and the role that it can play in a country’s power mix.<br />
The markets covered below give some idea of the technical<br />
potential, and also the wide range of background conditions<br />
in this diverse grouping. In some cases, an acute need for<br />
© <strong>Wind</strong> Power Works<br />
additional power capacity comes together with an excellent<br />
resource – and such is the case for countries such as Vietnam<br />
or Pakistan.<br />
Developing a substantial share of renewable power generation<br />
always requires government targets and incentives.<br />
Quite a few of the countries in this region do have targets in<br />
place – though that does not necessarily mean that incentives<br />
are also in place to support the achievement of those<br />
targets.<br />
For instance, Bangladesh wants 5% of its electricity to come<br />
from renewables by 2015; Pakistan has set a target of 10%<br />
by 2012. Mongolia plans to increase its share of renewable<br />
electricity from the current 3% to 20–25% by 2020. The Philippines<br />
is targeting 4.7% by 2013; Sri Lanka wants to go from<br />
the current 5% to reach 10% by 2017 and 14.1% by 2022,<br />
Tonga is targeting 50% by 2012, and Indonesia wants to build<br />
255 MW of wind capacity by 2025 (alongside other renewable<br />
technologies such as 6 GW of geothermal). 1<br />
Some wind power development has already taken place in<br />
this region, including:<br />
The Philippines’ existing power generating capacity is about<br />
15 GW. Electricity generated from renewable sources such as<br />
hydro, biomass and geothermal power comprise 33% of the<br />
Philippines’ current power mix, and the government has said<br />
it hopes to increase that to 40% in a decade, adding wind,<br />
1 All these figures are taken from REN21 <strong>Global</strong> Status Report <strong>2010</strong><br />
37
© <strong>Wind</strong> Power Works<br />
solar and ocean <strong>energy</strong> to the renewable mix. A 41.7 million<br />
USD fund has been set up to help with this process. As far<br />
as wind resource goes, according to SWERA figures 2 , 11,000<br />
km2 – or 3.7% of the land area – have good wind resources,<br />
which could potentially support the development of 55 GW<br />
of wind power – over three times the current total installed<br />
power capacity.<br />
Vietnam’s (purely technical) wind potential could support<br />
642 GW of wind power according to SWERA figures. In addition,<br />
Vietnam has a fast-growing economy and a growing<br />
demand for electric power. The country has been expanding<br />
its generating capacity, including through new large hydro<br />
dams, but still needs to import electricity from China. The<br />
Vietnamese government is aiming for renewable power to<br />
provide about 5% of the nation’s electricity by 2020.<br />
Vietnam’s first wind developments took place in 2009. One<br />
of the country’s first plants at Binh Thuan will soon be connected<br />
to the grid, and two more projects are reported to be<br />
in the pipeline in Lam Dong Province (150 MW and 80 MW).<br />
Investor interest in the Vietnamese wind market is considerable,<br />
and overall, some 20 wind power projects with a combined<br />
capacity of 20 GW are reportedly in the pipeline.<br />
Thailand’s growing affluence has led to a startling rise in per<br />
capita electricity consumption, which has grown by almost<br />
25% in the past five years. An estimated 30.2 GW of new<br />
generation capacity will be needed by 2021. At present, Thailand’s<br />
electricity generation is dominated by fossil fuels, but<br />
the government recently announced a 15-year Alternative<br />
<strong>Energy</strong> Development Plan (AEDP) with a target of increasing<br />
the share of renewable <strong>energy</strong> from 6.4% in 2008 to 20% in<br />
2022, with an 800 MW target of wind capacity. According to<br />
SWERA figures, Thailand’s technical wind resource could support<br />
the development of 190 GW of wind power.<br />
Prosperous Taiwan generated and consumed 230 TWh in<br />
2008, yet it has to import 98% of its fuel requirements.<br />
Taiwan has set a target for renewables to meet 10% of its<br />
electricity needs by <strong>2010</strong>, up from 5.8% currently. <strong>Wind</strong> power<br />
is expected to meet 80% of that, and a feed-in tariff was<br />
introduced in 2009. During 2009, Taiwan installed 78 MW of<br />
new wind power, bringing the total to 436 MW. Taiwan does<br />
have a good wind resource on its western coast as well as<br />
offshore, but it remains to be seen if the guaranteed purchase<br />
price is high enough to encourage investment.<br />
In Pakistan, the far-reaching implications of the flood<br />
disaster of <strong>2010</strong> on infrastructure in general, and the power<br />
infrastructure specifically, cannot yet be assessed at the time<br />
of writing. There was an acute power shortage even before<br />
this disaster, and a strong increase in power demand. Most<br />
of the country’s power needs to date are met by fossil fuels.<br />
To support the addition of renewable capacity, the Asian<br />
Development Bank set up a 510 million USD financing facility<br />
in 2006, and during that same year, a feed-in tariff was<br />
introduced. 3<br />
2 UNEP’s Sun and <strong>Wind</strong> <strong>Energy</strong> Resource Assessment (SWERA) programme, see www.swera.net<br />
38
R e g i o n a l s c e n a r i o r e s u l T S<br />
Non-Oecd aSia: cuMulaTive <strong>Wind</strong> POWer capaciTY 2009-2030<br />
160,000<br />
140,000<br />
120,000<br />
100,000<br />
80,000<br />
60,000<br />
40,000<br />
20,000<br />
0<br />
[MW] Reference<br />
Moderate<br />
Advanced<br />
2009 <strong>2010</strong> 2015 2020 2030<br />
Year Reference Moderate Advanced<br />
2009 475 475 475<br />
<strong>2010</strong> 575 709 709<br />
2015 1,825 11,393 20,228<br />
2020 4,325 24,204 54,813<br />
2030 15,575 120,313 140,462<br />
© EDP Renovavies<br />
According to Pakistan’s Alternative <strong>Energy</strong> Development<br />
Board, wind power offers a technical potential of 360 GW,<br />
and this is supported by figures from SWERA, which estimate<br />
a 349.3 GW potential.<br />
The GWEO scenariOS For nOn-Oecd ASia<br />
Across the whole region, 78 MW of new capacity was installed<br />
in 2009, and the total stood at 475 MW at the end of<br />
the year.<br />
Under the Reference scenario, the speed of wind power<br />
development will not increase substantially in non-OECD<br />
Asia, and the annual market across this vast region will grow<br />
to just 250 MW by 2015 and 500 MW by 2020, bringing the<br />
total installed capacity to 4.3 GW by 2020. Thereafter, the<br />
annual market will increase gradually to 1,150 GW, which<br />
would result in a total capacity of 15.6 GW by 2030.<br />
Given the excellent wind resources in some of the Asian<br />
countries, and recent government initiatives to help exploiting<br />
them, the Moderate scenario describes a more positive<br />
development. More than 2,500 of new wind capacity would<br />
be installed in the region every year by 2015, and this would<br />
gradually increase to a pace of 19.5 GW every year by 2030.<br />
The result would be a total installed capacity of 24.2 GW by<br />
2020, and 120.3 GW by 2030 – nearly 8 times the size of the<br />
Reference scenario.<br />
The difference in terms of power produced and consequently<br />
CO2 savings would be considerable. While under the Reference<br />
scenario, wind <strong>energy</strong> would produce only 10 TWh by<br />
2020 and save 6.3 million tons of CO2, the Moderate scenario<br />
would achieve a production of 59 TWh in this timeframe,<br />
thereby saving the emissions of 35.6 tons of CO2 every year.<br />
This would grow to close to 300 TWh by 2030 and savings of<br />
177 million tons of CO2.<br />
Economically, also, such a development would have a considerable<br />
impact. By 2015, wind <strong>energy</strong> could attract around<br />
€3 billion worth of investment to the region every year, and<br />
create around 40,000 jobs.<br />
The Advanced scenario assumes that current efforts to<br />
promote renewable <strong>energy</strong> are intensified, reflecting governments’<br />
aim of making the most of the natural wind resources<br />
and reaping the related benefits. This would attract annual<br />
investments in the region of €8-10 million over the course of<br />
the scenario period, and create 150,000 jobs.<br />
It is in this scenario that wind power would start to make a<br />
small but noticeable contribution to the region’s electricity<br />
supply. A total installed capacity of 20 GW would produce<br />
around 50 TWh of clean power by 2015, and this would rise<br />
to 55 GW generating 134 TWh only five years later. By 2030,<br />
the installed capacity would increase to 140 GW, with an annual<br />
power production of 345 TWh.<br />
3 http://www.adb.org/Media/Articles/2006/11118-Pakistan-renewable-<strong>energy</strong>-development<br />
39
R e g i o n a l s c e n a r i o r e s u l T S<br />
OECD Europe<br />
While individual markets within this group of countries may<br />
move at different rates from year to year, the overall trend<br />
has been one of steady upward growth. 10.5 GW of new wind<br />
power were added during 2009, bringing the total installed<br />
capacity to 75.5 GW, which, in a normal year, can be expected<br />
to generate about 162.5 TWh of electricity. This would<br />
account for between 4% and 5% of this region’s demand<br />
for electric power. In both 2008 and 2009, more new wind<br />
generating capacity was added than any other type of power<br />
generating plant, including natural gas.<br />
Spain and Germany remain the two largest annual markets<br />
for wind power, competing each year for the top spot<br />
(2,459 MW and 1,917 MW of new installations respectively<br />
in 2009), followed by Italy (1,114 MW), France (1,088 MW),<br />
and the UK (1,077 MW). A further three countries (Portugal,<br />
Sweden, Turkey) each installed about 500 MW in 2009. Both<br />
Turkey and Poland are now starting to develop rapidly.<br />
Eleven of these countries now have more than 1 GW each of<br />
total installed wind <strong>energy</strong> capacity, while one more is just<br />
below the 1 GW mark.<br />
Driving the growth of wind power in Europe (at least for EU<br />
member states) up to <strong>2010</strong> were a Kyoto-led target for 22%<br />
of electricity supply to come from renewables by <strong>2010</strong> and<br />
country by country support measures encouraged by the<br />
2001 EU Renewable <strong>Energy</strong> Directive. This has now been<br />
extended into a new target for 20% of final <strong>energy</strong> consumption<br />
across all EU countries to be generated by renewable<br />
sources by 2020. The new target is binding on all 27 member<br />
states, each of which has a different percentage target depending<br />
on its renewable <strong>energy</strong> resource and on the level of<br />
its existing renewables development. Many countries in Europe<br />
have introduced feed-in tariffs to stimulate the growth<br />
of wind power and other renewable <strong>energy</strong> technologies.<br />
Germany<br />
<strong>Wind</strong> power is the leading renewable <strong>energy</strong> source in<br />
Germany, and provides around 7% of the country’s electricity<br />
consumption. Installed capacity reached 25,777 MW at the<br />
end of 2009, on a par with China as the second largest wind<br />
power market after the US. One of Germany’s federal states<br />
(Lower Saxony) has almost 6.5 GW of wind installations, and<br />
several states now receive over 40% of their electricity from<br />
wind.<br />
OFFShore wind<br />
Europe is pioneering the development of offshore wind,<br />
which is set to become a mainstream <strong>energy</strong> source in its<br />
own right. In 2009, 582 MW of offshore wind was installed in<br />
the EU, up 56% on the previous year. Cumulative capacity increased<br />
to 2 GW. The main markets in 2009 were the United<br />
Kingdom and Denmark, but several others now also have<br />
offshore wind power installations. By July <strong>2010</strong>, Europe was<br />
home to 948 offshore wind turbines in 43 fully operational<br />
offshore wind farms, with a total capacity of 2,396 MW. In<br />
the first half of <strong>2010</strong> alone, 118 new offshore wind turbines<br />
had been fully connected to the grid, according to the European<br />
<strong>Wind</strong> <strong>Energy</strong> Association (EWEA). These new turbines<br />
have a combined capacity of 333 MW, which is testament to<br />
continuing strong growth in offshore wind power despite the<br />
financial crisis. In addition, EWEA reported that a further 151<br />
turbines (440 MW) had been installed though not yet connected<br />
to the grid. At the start of <strong>2010</strong>, it was estimated that<br />
1,000 MW of new offshore wind would be installed in Europe<br />
during the year, representing between 9% and 10% of the<br />
region’s anticipated <strong>2010</strong> wind market.<br />
Germany’s current national target is for 25%–30% of<br />
electricity to come from all renewables, mainly wind, by<br />
2020; but Germany’s wind market has already had strong<br />
government encouragement for two decades. A law first<br />
introduced in 1991 (with a major revision in 2000) includes a<br />
guaranteed feed-in tariff for all renewable power generators.<br />
Consequently the sector has developed steadily, and German<br />
turbine manufacturers are among the market leaders, with<br />
a global market share of 30%. The sector currently employs<br />
more than 100,000 people, according to the German <strong>Wind</strong><br />
<strong>Energy</strong> Association (BWE).<br />
Although Germany’s installation rate has slowed down, it<br />
still holds fourth place globally in terms annual wind power<br />
additions. The market is poised to pick up again as the as the<br />
offshore sector is developed. Germany got off to a slow start<br />
in the field of offshore wind due to strict planning requirements<br />
which stipulate that offshore wind farms need to be<br />
built a long distance from shore. 2009 saw the installation of<br />
Germany’s first offshore wind farm, the 60 MW Alpha Ventus<br />
test field, which consists of twelve 5 MW turbines.<br />
40
R e g i o n a l s c e n a r i o r e s u l T S<br />
A further impetus came in the form of revised feed-in tariffs<br />
in January 2009, which increased the rates for onshore wind<br />
and added a special bonus for ‘repowering’ – the replacement<br />
of turbines aged 10 years or more with ones at least double<br />
the output, either at the same site or a neighbouring one.<br />
Offshore projects were also given improved feed-in tariffs,<br />
with several bonuses available.<br />
Spain<br />
The Spanish wind <strong>energy</strong> market has seen tremendous<br />
growth, and the country led Europe in 2009 with 2.46 GW of<br />
new installations, taking total wind capacity up to 19.1 GW.<br />
This made wind power Spain’s third-largest power generation<br />
technology (behind combined cycle gas and nuclear power):<br />
36.2 TWh were generated by wind in 2009, which met 14.5%<br />
of the country’s electricity demand.<br />
Spain is home to some leading international wind power<br />
companies, including Iberdrola Renovables (the world’s largest<br />
wind farm owner), Acciona and Gamesa. <strong>Wind</strong> <strong>energy</strong> has<br />
proven to be a key driver for economic development, creating<br />
over 41,000 jobs and €3.8 billion in GDP in 2008.<br />
However, due to new legislation adding considerable complexity<br />
and delays to wind farm approval, and a lowering of<br />
the premium granted to wind power, future market developments<br />
are less than certain.<br />
Prior to that development, the Spanish <strong>Wind</strong> <strong>Energy</strong> Association<br />
(AEE) had estimated that 40,000 MW of onshore and<br />
5,000 MW of offshore capacity could be operating by 2020,<br />
providing close to 30% of Spain’s electricity. It is unclear<br />
now if these projections, or even the government target of<br />
21,000 MW in installed wind power capacity by the end of<br />
<strong>2010</strong>, will be met.<br />
Italy<br />
The last few years have seen real growth in Italy’s wind sector<br />
– the 1.1 GW of new capacity installed during 2009 took the<br />
total to 4.85 GW, and the Italian <strong>Wind</strong> <strong>Energy</strong> Association<br />
(ANEV) estimates that 6 TWh of electricity were generated<br />
from wind power during 2009. The country is well on its<br />
way to achieving its 2020 national target of 12 GW of wind<br />
power, and ANEV estimates that as much 16.2 GW of wind<br />
capacity could be installed by then.<br />
Holding back development are issues of regional planning, especially<br />
over landscape issues, and grid connection difficulties<br />
remain unsolved – the sector is waiting for a structural solution<br />
that will make Italy’s grid more suitable for the connection<br />
of wind power. In some areas during 2009, wind farms<br />
have had their output curtailed by 30%, some even 70%, as<br />
the inadequate grid could not cope with the output. Some<br />
operators are calling for compensation for their lost income.<br />
<strong>Wind</strong> power is offering increased employment opportunities.<br />
In 2008, 15,152 people were employed in Italy’s wind sector,<br />
4,430 of them employed directly, the remainder in associated<br />
jobs such as transport or accounting. If Italy reaches<br />
the industry goal of 16.2 GW by 2020, the sector would be<br />
employing 66,000 people, with 19,000 of them in direct<br />
employment.<br />
France<br />
France has good wind resources, and Europe’s second-largest<br />
wind potential. Although the country had a late start, wind<br />
power development has been rapid over the past decade.<br />
While only 30 MW of wind power capacity was installed in<br />
2000, by the end of 2009 the total capacity was up to nearly<br />
4.5 GW, with almost 1.1 GW added in 2009, which accounted<br />
for 41% of all the new power generation plant installed that<br />
year. The 7.8 TWh generated by wind power during 2009<br />
accounted for only 1.6% of the country’s power consumption,<br />
but this is still twenty times more than six years ago.<br />
It remains to be seen if the deployment of wind power will<br />
be rapid enough for France to meet its 2020 objective of<br />
renewable <strong>energy</strong> supplying 23% of its final <strong>energy</strong> demand,<br />
a quarter of which is poised to come from wind power.<br />
The French government has set a target of achieving 25 GW<br />
of wind capacity by 2020, 19 GW of which onshore and 6 GW<br />
offshore. The interim target for 2012 is of 11.5 GW (10.5 GW<br />
onshore and 1 GW offshore). As yet, France has seen no<br />
offshore wind developments, but the government is planning<br />
a process of three calls for tender in <strong>2010</strong>, 2012 and 2014, the<br />
first of which will be for a total capacity of 3 GW. A consultation<br />
process on zoning for offshore wind developments<br />
should be completed by the end of September <strong>2010</strong>.<br />
41
Lake Ostrowo wind farm, Poland<br />
© <strong>Wind</strong> Power Works<br />
United KingdOM<br />
Poland<br />
Very slow to embrace wind developments on a large scale,<br />
the United Kingdom market has finally taken off both on<br />
and offshore. The UK was the world leader in new offshore<br />
capacity in both 2008 and 2009 (with 198 MW and 306 MW,<br />
respectively), and in 2009, for the first time, the UK installed<br />
over a gigawatt of new wind capacity, taking its total to<br />
4.05 GW. With a healthy project pipeline, the wind and<br />
marine power association Renewable UK (formerly the british<br />
<strong>Wind</strong> <strong>Energy</strong> Association) expects about 10 GW of new<br />
projects to be built by the end of 2012.<br />
The UK has a target to source 15% of its final <strong>energy</strong> consumption<br />
from renewables by 2020. This will require about<br />
35% of the UK’s electricity to come from renewables, and<br />
wind power is expected to play a major part in achieving this.<br />
Government targets are for 13–14 GW of new onshore wind<br />
by 2020, while suitable sites for up to 50 GW offshore have<br />
been identified.<br />
Although a feed-in tariff for renewable <strong>energy</strong> installations up<br />
to 5 MW was introduced in April <strong>2010</strong>, the existing ‘Renewable<br />
Obligation’ scheme for large wind was maintained. This<br />
came into effect in April 2002 and requires all power suppliers<br />
to ensure that a certain percentage of the electricity they<br />
supply comes from renewable sources.<br />
With excellent wind speeds in much of the country, Poland is<br />
one of Eastern Europe’s most promising wind markets. Total<br />
installations were 724.6 MW at the end of last year, including<br />
181 MW of new capacity added in 2009.<br />
Heavily dependent on coal power for its electricity, Poland<br />
needs – in order to meet EU targets – 15% of its final <strong>energy</strong><br />
consumption to come from renewable <strong>energy</strong> by 2020, up<br />
from 7.2% in 2005. In 2005, the Polish government introduced<br />
a stronger obligation for all <strong>energy</strong> suppliers to source<br />
a percentage of their supply from renewable <strong>energy</strong> sources.<br />
In practice however, It has not beren rigorously enforced.<br />
Now there are fears that new legislation, which came into<br />
force in March <strong>2010</strong>, might inadvertently put wind farm developers<br />
at a disadvantage and discourage wind investment.<br />
The Polish government is currently working on a new amendment<br />
to the <strong>Energy</strong> Law that will implement the provisions<br />
of the new EU Renewables Directive, with the objective of<br />
adopting it by the end of <strong>2010</strong>.<br />
The Polish <strong>Wind</strong> <strong>Energy</strong> Association is expecting dynamic<br />
growth. It has calculated that 13 GW could be installed in<br />
Poland by 2020, with 11 GW onshore, 1.5 GW offshore and<br />
600 MW of small wind. However, it is not expected that<br />
offshore will take off until late in that period, around 2018.<br />
42
R e g i o n a l s c e n a r i o r e s u l T S<br />
Turkey<br />
Turkey’s power consumption is increasing by 8% to 9% each<br />
year. As it has very limited oil and gas reserves, the country<br />
is looking to renewable <strong>energy</strong> as a means of improving its<br />
<strong>energy</strong> security and independence from imports. And as<br />
the country prepares to join the European Union and meet<br />
carbon reduction targets, it is becoming much more aware of<br />
its wind power potential.<br />
2009 saw the installation of 343 MW of new wind power,<br />
bringing total capacity up to 801 MW. Addition of a further<br />
500 MW is expected in <strong>2010</strong>.<br />
There has been a huge response to government calls for<br />
tender, making evaluation slow. By early <strong>2010</strong> almost 3 GW<br />
of projects had been licensed by the authorities, and it is<br />
expected that the remainder of the tenders received before<br />
November 2007 will be processed soon. Licences for a further<br />
10 GW are scheduled to be granted within the next five<br />
years, 15 GW within ten years, and 20 GW in the long term.<br />
However, experts caution that Turkey’s transmission grid will<br />
need substantial upgrading if wind power on this scale is to<br />
be accommodated.<br />
The GWEO scenariOS For Oecd Europe<br />
Given the level of maturity of some European markets, the<br />
policies already in place, and the potential of others in the<br />
region, it is surprising that the Reference scenario as put<br />
forward by the International <strong>Energy</strong> Agency anticipates that<br />
annual markets already peaked in 2009 at 10.3 GW, and will<br />
from now on see a decline, falling to 9 GW by 2020 and under<br />
5 GW by 2030. This would result in levels of investment<br />
decreasing from €14.2 billion in <strong>2010</strong> to €11.3 billion in 2020<br />
and a mere €5.9 billion in 2030. At that level, wind power<br />
would by 2030 produce 573.5 TWh and save the emission of<br />
344 million tonnes of CO2 each year.<br />
Within the Moderate scenario, the annual market over<br />
the next decade up to 2020 is expected to grow at a more<br />
healthy rate, from 10.3 GW in 2009 to 24.2 GW, with annual<br />
investments in the wind sector increasing from €14 billion<br />
to €29.2 billion. That steady trend would ensure that wind<br />
power would deliver about 615 TWh of electricity to the<br />
region each year by 2020. By 2030, close to 450 GW would<br />
produce more than 1,000 TWh of electric power in this region<br />
Oecd Europe: cuMulaTive <strong>Wind</strong> POWer capaciTY 2009-2030<br />
600,000<br />
500,000<br />
400,000<br />
[MW] Reference<br />
Moderate<br />
Advanced<br />
300,000<br />
200,000<br />
100,000<br />
0<br />
2009 <strong>2010</strong> 2015 2020 2030<br />
Year Reference Moderate Advanced<br />
2009 75,565 75,565 75,565<br />
<strong>2010</strong> 85,696 86,175 87,140<br />
2015 138,596 150,049 163,109<br />
2020 183,996 250,824 293,963<br />
2030 233,796 447,432 514,806<br />
every year, saving the emission of over 650 million tonnes of<br />
CO2 annually.<br />
Interesting here is the contrast between these first two scenarios<br />
when it comes to employment. The Reference scenario<br />
sees employment peak early, in 2015, by when the sector<br />
would be employing just under 200,000 people across Europe,<br />
then dropping off to 136,000 by 2030. In the Moderate<br />
scenario, however, a longer, sustained growth curve shows<br />
an expansion of jobs between <strong>2010</strong> and 2020, by when the<br />
wind sector would employ close to 400,000 people in Europe<br />
alone.<br />
If you focus on the 2020 and 2030 figures, the gap between<br />
the Moderate scenario and the Advanced scenario seems less<br />
pronounced than in the models for some of the other regions.<br />
However, a comparison shows that, in an ideal world, Europe<br />
could go even a step further in exploiting its wind resources.<br />
By 2020, the Advanced scenario forecasts a total capacity of<br />
close to 300 GW, with annual markets running steadily at<br />
around 24 GW between 2020 and 2030. This would trigger<br />
annual investments of around €26 billion by 2030 and a<br />
workforce of 460,000 people would be employed by the<br />
wind sector at that time. In terms of electricity generation<br />
and resulting CO2 savings, the Advanced scenario also shows<br />
what could be achieved: wind power would generate close to<br />
1,300 TWh of electricity every year, while avoiding the emission<br />
of 760 million tons of CO2 every year in 2030.<br />
43
R e g i o n a l s c e n a r i o r e s u l T S<br />
OECD North America<br />
North America as defined by the IEA includes Canada, the<br />
USA and Mexico, and thus includes a variety of geographic<br />
areas. Some of these, especially the plains and coastlines,<br />
have excellent wind resources.<br />
The United States<br />
The past decade has seen enormous growth in the US wind<br />
power. Back in 2000, slightly more than 2.5 GW had been installed.<br />
By the end of 2009, that had risen to a world-leading<br />
installed capacity of more than 35 GW.<br />
Renewable <strong>Energy</strong> Laboratory published in February <strong>2010</strong><br />
showed that onshore US wind resources could generate<br />
nearly 37 million GWh annually, more than nine times current<br />
total US electricity consumption.<br />
Thirty-six US states now have utility-scale wind farms, and 14<br />
of these have over 1 GW in operation. Texas leads, with over<br />
9 GW of wind power, of which 2.3 GW were new installations<br />
in 2009 (including the world’s largest wind farm, the<br />
627-turbine, 781.5 MW Roscoe wind farm). Iowa, California,<br />
Washington state and Minnesota follow in terms of installed<br />
capacity, with Iowa receiving 14% of its 2009 electricity<br />
consumption from wind.<br />
However, that growth has never been steady. For reasons<br />
that often seem to have more to do with Washington politics<br />
than political will, national policy has been short-term and<br />
inconsistent, with the industry (especially in the first five<br />
years of the decade) either speeding to catch the green<br />
light, or braking hard. Although the last few years have<br />
seen more stability, as this report is being written (late July<br />
<strong>2010</strong>) the American <strong>Wind</strong> <strong>Energy</strong> Association (AWEA) has<br />
announced that wind power installations in the first half of<br />
<strong>2010</strong> (1239 MW) have dropped by 71% compared with the<br />
same period in 2009 (in total, 2009 saw the addition of a<br />
massive 10 GW of new wind) and by 57% compared with the<br />
first half of 2008. However, despite a strong pipeline and a<br />
slight increase in turbine orders in the second quarter, <strong>2010</strong><br />
will continue to be affected by the low level of orders in the<br />
immediate aftermath of the economic crisis as well as a drop<br />
in electricity demand.<br />
<strong>Wind</strong> power now generates close to 2% of US electricity<br />
needs, but experts estimate that with the right policies in<br />
place, the potential is much greater. And with the US <strong>Energy</strong><br />
Information Administration calculating that the country<br />
needs the addition of 89 GW of new power generating capacity<br />
by 2030, largely to replace ageing power plants, wind can<br />
make a powerful contribution. 1<br />
In 2008, the US Department of <strong>Energy</strong> released a groundbreaking<br />
report, finding that wind power could provide 20%<br />
of US electricity by 2030. 2 A more recent analysis of wind<br />
integration in the Eastern region of the country drew similar<br />
conclusions, while a new assessment from the National<br />
The US wind market has had two policy stimuli for some<br />
years. At the national level there has been a Production<br />
Tax Credit (with erratic terms/extensions); while a growing<br />
number of states followed the Texan example by introducing<br />
a state Renewable <strong>Energy</strong> Standard (RES), requiring a certain<br />
percentage of power in the state to come from renewable<br />
sources (with wind generally providing the majority of this).<br />
Twenty-eight states currently operate an RES (sometimes<br />
known as an RPS).<br />
In February 2009 a package of measures were introduced as<br />
part of the American Recovery and Reinvestment Act: extension<br />
of the PTC to 2012; an option to receive an investment<br />
credit tax instead of the PTC; tax credits for new wind manufacturing<br />
facilities; a 6 billion USD renewable <strong>energy</strong> loan<br />
guarantee programme. Together these were very beneficial in<br />
maintaining momentum in the sector during the 2008–2009<br />
economic downturn.<br />
However, to sustain the growth over a longer period, increase<br />
wind <strong>energy</strong> manufacturing jobs, and solidify wind’s place in<br />
the US <strong>energy</strong> market, the US wind industry is seeking a national<br />
renewable <strong>energy</strong> standard (RES). This would stimulate<br />
utilities to buy wind power and conclude power purchase<br />
agreements, which are currently difficult to obtain, due to the<br />
drop in overall electricity demand, lower natural gas prices,<br />
and the absence of a clear national renewable <strong>energy</strong> policy.<br />
There is still some chance that such a measure could be<br />
adopted before the end of <strong>2010</strong>.<br />
1 US <strong>Energy</strong> Information Administration, Annual <strong>Energy</strong> Outlook <strong>2010</strong>. May <strong>2010</strong>. http://www.eia.doe.gov/oiaf/aeo/aeoref_tab.html, Table 9.<br />
2 US Department of <strong>Energy</strong>: 20% <strong>Wind</strong> <strong>Energy</strong> by 2030: Increasing <strong>Wind</strong> <strong>Energy</strong>’s Contribution to U.S. Electricity Supply. May 2008.<br />
44
Horse Hollow wind farm, United States<br />
© <strong>Wind</strong> Power Works<br />
Another policy issue that needs to be addressed is the regulatory<br />
structure for transmission. New transmission is needed<br />
to connect the good wind sites with towns and cities – at<br />
present planning, financing and permitting are slow and<br />
difficult processes and according to AWEA, many new wind<br />
power projects are on hold in the United States due to transmission<br />
limitations.<br />
At the end of 2009 the US wind industry employed 85,000<br />
people, and the eight leading suppliers of turbines to the US<br />
market have either established manufacturing facilities or announced<br />
plans to do so. GE <strong>Wind</strong> supplied over 46% of new<br />
turbines installed during 2009, with seven others supplying<br />
between 4% and 12% each. 3<br />
Although the United States has yet to enter the offshore wind<br />
sector, the 420 MW Cape <strong>Wind</strong> project off the Massachusetts<br />
coast won final approval in April <strong>2010</strong>, and there are a number<br />
of projects at different stages of development, including<br />
in the Great Lakes.<br />
Canada<br />
Canada has an immense wind resource, and its wind power<br />
capacity has grown tenfold in between 2004 and end of<br />
3 BTM Consult: World Market Update 2030. March <strong>2010</strong>.<br />
2009, a year during which 950 MW was installed. Canada<br />
was a relatively slow starter so the total installed capacity at<br />
the end of 2009 was 3.3 GW – yet this is sufficient to provide<br />
1.1% of the country’s electricity.<br />
Each of the provinces now has some wind installed, and new<br />
government power purchase agreements for at least six<br />
provinces in <strong>2010</strong> should ensure a record-breaking year. The<br />
Canadian <strong>Wind</strong> <strong>Energy</strong> Association (CanWEA) in its ‘<strong>Wind</strong>Vision<br />
2025’ document sets a goal of producing 20% or more<br />
of the country’s electricity from wind power by 2025.<br />
Canada’s leading province in terms of wind power is Ontario,<br />
with 1,168 MW of wind installed and a further 647 MW under<br />
contract at the end of 2009. Ontario’s Green <strong>Energy</strong> Act, announced<br />
in 2009, introduced a feed-in tariff for wind power,<br />
with enhanced tariffs for community projects and ‘First<br />
Nations’ (i.e. Native American) projects, and a higher rate for<br />
offshore wind.<br />
The Ontario Power Authority has a plan that calls for 4.6 GW<br />
of wind <strong>energy</strong> by 2020, and many other provinces have<br />
signed contracts to expand their wind <strong>energy</strong> capacity during<br />
<strong>2010</strong> and beyond.<br />
At federal level there is disappointment about the government’s<br />
decision not to extend Canada’s ecoENERGY federal<br />
45
R e g i o n a l s c e n a r i o r e s u l T S<br />
Oecd nOrth aMerica: cuMulaTive <strong>Wind</strong> POWer capaciTY 2009-2030<br />
800,000<br />
700,000<br />
600,000<br />
500,000<br />
400,000<br />
300,000<br />
200,000<br />
100,000<br />
0<br />
incentives. It was announced in March <strong>2010</strong> that the ecoEN-<br />
ERGY programme – set up in 2007 to support the construction<br />
of over 4 GW of renewable <strong>energy</strong> projects – had already<br />
allocated all of its funding and would be supporting no wind<br />
<strong>energy</strong> projects built after March 2011. The concern is that<br />
this would make Canada less attractive to investors than its<br />
southern neighbour.<br />
Mexico<br />
[MW]<br />
Reference<br />
Moderate<br />
Advanced<br />
2009 <strong>2010</strong> 2015 2020 2030<br />
Year Reference Moderate Advanced<br />
2009 38,585 38,585 38,585<br />
<strong>2010</strong> 45,085 49,329 49,648<br />
2015 75,585 119,190 140,440<br />
2020 106,085 220,041 303,328<br />
2030 141,085 410,971 693,958<br />
Mexico, too, has an outstanding wind resource, especially in<br />
the Oaxaca region. In 2009, Mexico’s installed wind capacity<br />
more than doubled, adding 117 MW of new capacity to the<br />
85 MW that were operating at the end of 2008, bringing the<br />
total installed wind power capacity to 202 MW. This increase<br />
was the result of two private self-supply projects brought online<br />
in 2009, ‘Parques Ecológicos de México’ (79.9 MW) and<br />
the first phase of the ‘Eurus’ project (37.5 MW). The first half<br />
of <strong>2010</strong> saw the addition of a further 300 MW. At present,<br />
however, hardly any of Mexico’s wind power makes its way<br />
into the national grid. Rather, it is used on-site by self generators,<br />
such as heavy industry. The government is struggling to<br />
come up with a regulatory framework that could really open<br />
up the very substantial resources in the country.<br />
The GWEO scenariOS For Oecd nOrth aMerica<br />
Within this region we are looking at the three distinct<br />
markets of the United States, Canada and Mexico. And with<br />
the various states and provinces having policies of their own,<br />
there is potentially more variability here than in the single<br />
market of China, for instance.<br />
Our three possible projections start with <strong>2010</strong>, and the Reference<br />
scenario predicts relatively modest growth of 6.5 GW<br />
(as compared with the actual figure of 11 GW added during<br />
2009), while the Moderate and Advanced scenarios anticipate<br />
addition of about 11 GW for <strong>2010</strong>.<br />
In fact the Reference scenario anticipates a flat market of<br />
some 6 GW per year, across North America, for the next<br />
couple of decades, slowing to 3.5 GW by 2030. This is considerably<br />
less than the US Department for <strong>Energy</strong> projections<br />
of annual markets reaching 16 GW by 2018 and stabilising<br />
at this rate, in the US alone, not even counting growth in<br />
Canada and Mexico.<br />
The Reference scenario numbers would result in a total wind<br />
power capacity of 141 GW by 2030, which would produce<br />
346 TWh of electricity and save the emission of 207.6 million<br />
tonnes of CO2 every year. Jobs in the sector would peak<br />
ten years from now, when the industry would employ under<br />
90,000 people.<br />
However, the alternative scenarios show wind taking a much<br />
more significant role across this continent. Even the Moderate<br />
scenario shows that by 2020, the annual market for<br />
new wind installations could be more than twice the size of<br />
the record-breaking 2009 market, and by 2030 wind power<br />
would be producing over a thousand terawatt hours of electricity<br />
per year while saving the emission of over 600 million<br />
tonnes of CO2 each year – three times that in the Reference<br />
scenario. Under this scenario, investments in wind power<br />
would peak around 2020, reaching some US$37 billion per<br />
year, but then tailing off.<br />
Though it is the Oaxaca region that has seen most development<br />
so far, the Baja region also has good potential and is<br />
attracting the eye of potential developers from the US.<br />
If the Advanced scenario could be realised, all these figures<br />
would be dwarfed: massive CO2 savings of over 1,000 million<br />
tonnes would be made each year by 2030, the sector would<br />
be employing 700,000 people, and wind power alone would<br />
be providing 1,700 TWh of electricity per year across North<br />
America.<br />
46
R e g i o n a l s c e n a r i o r e s u l T S<br />
OECD Pacific<br />
The geographies and populations of the four countries<br />
covered here – Australia, New Zealand, Japan and Korea – are<br />
very different. Sited in different hemispheres, and separated<br />
by miles of Pacific Ocean (South Korea and New Zealand<br />
are ten thousand kilometres apart) what they have in common<br />
is high per capita <strong>energy</strong> consumption, and all except<br />
Korea have emission reduction obligations under the Kyoto<br />
Protocol.<br />
AuSTralia<br />
Historically, Australia has relied heavily on coal and hydro<br />
for its electric power. Yet it has some of the world’s best<br />
wind (and solar) resources. The total operating wind capacity<br />
at the end of 2009 was 1,712 MW, 406 MW of which was<br />
installed that year. According to the Clean <strong>Energy</strong> <strong>Council</strong>,<br />
in mid-<strong>2010</strong>, the country was host to more than 1,000 wind<br />
turbines spread over 52 wind farms generating around 5 TWh<br />
of electricity per year.<br />
At the end of 2009, nearly half of the country’s wind capacity<br />
(around 740 MW) was located in South Australia, and a<br />
further 428 MW in Victoria. However, there are currently<br />
over 7 GW of large-scale wind farm <strong>energy</strong> projects proposed<br />
around the country, many of them having already received<br />
planning permission.<br />
Driving this growth is Australia’s expanded Renewable <strong>Energy</strong><br />
Target (RET) Scheme. This was passed by the federal parliament<br />
in August 2009 and mandates 20%, of Australia’s<br />
electricity supply (or 45 TWh) to be sourced from renewable<br />
<strong>energy</strong> by 2020. A further revision in March <strong>2010</strong> introduced<br />
a new target for large-scale renewables of 10.4 TWh by<br />
2011, increasing gradually each year to 18 TWh by 2015 and<br />
41 GWh by 2020. Achieving this target will mean the addition<br />
of around 10 GW of new renewable <strong>energy</strong> capacity in the<br />
coming decade, with wind power likely to play a leading role.<br />
New Zealand<br />
New Zealand has abundant renewable <strong>energy</strong> resources, and<br />
renewables supply 73% of the country’s electricity (55%<br />
large hydro, 15% geothermal and 3% wind). Overall, with<br />
a population of only about 4.5 million, the country’s total<br />
installed power generation capacity stands at just less than<br />
Woolnorth wind farm, Tasmania, Australia<br />
© <strong>Wind</strong> Power Works<br />
10 GW, but electricity demand is growing and there are plans<br />
to phase out 500 MW of coal-fired generation.<br />
New Zealand’s wind resource is so rich that, according to<br />
a study completed for the Electricity Commission (New<br />
Zealand’s electricity market regulator), wind power could<br />
potentially meet annual demand several times over.<br />
The New Zealand government has a target for renewable<br />
<strong>energy</strong> to supply 90% of the country’s electricity by 2025,<br />
which is creating good opportunities for wind, especially as<br />
wind power and hydro combine so effectively. Within 20<br />
years, wind power’s share of New Zealand’s electricity supply<br />
could potentially grow from 3% to 20%. During 2009 New<br />
Zealand’s installed wind capacity expanded from 325 MW to<br />
497 MW.<br />
South kOrea<br />
South Korea is the world’s tenth-largest consumer of <strong>energy</strong>,<br />
and its greenhouse gas emissions have doubled since 1990,<br />
partly through the heavy use of coal. Korea’s electricity generating<br />
capacity has increased by 50% over the past decade,<br />
and now stands at 73 GW, most of which is coal, natural gas<br />
and nuclear power, and an additional 32.4 GW are planned<br />
to become operational by 2022, including 12 nuclear, 11 LNG<br />
and seven coal plants.<br />
‘New’ renewables only provide around 0.25% of all electricity<br />
generated, according to Korea’s Electric Power Corporation<br />
(KEPCO). 2009 saw the installation of 112 MW of new wind<br />
47
R e g i o n a l s c e n a r i o r e s u l T S<br />
Oecd pacific: cuMulaTive <strong>Wind</strong> POWer capaciTY 2009-2030<br />
120,000<br />
100,000<br />
80,000<br />
60,000<br />
40,000<br />
20,000<br />
0<br />
[MW] Reference<br />
Moderate<br />
Advanced<br />
2009 <strong>2010</strong> 2015 2020 2030<br />
Woolnorth wind farm, Tasmania, Australia<br />
© <strong>Wind</strong> Power Works<br />
Year Reference Moderate Advanced<br />
2009 4,613 4,613 4,613<br />
<strong>2010</strong> 5,318 5,740 5,870<br />
2015 6,818 17,303 20,255<br />
2020 10,568 37,259 47,876<br />
2030 18,568 81,159 109,367<br />
power, bringing the total capacity to 348 MW. However,<br />
South Korea has a target for renewables to provide 11% of<br />
the country’s primary <strong>energy</strong> (not just electricity) by 2030.<br />
A new bill was passed in March <strong>2010</strong> that requires utilities to<br />
increase the current share of renewable <strong>energy</strong> in their total<br />
power generation (excluding large hydro) from the current<br />
1% to 4% by 2015, growing to 10% by 2022.<br />
regulatory and grid connection problems, it seems unlikely<br />
that this target will be achieved.<br />
Despite a struggling domestic market, Japan’s wind turbine<br />
manufacturer Mitsubishi Heavy Industry has become a<br />
significant exporter and in 2009 had about 1.5% of the global<br />
market.<br />
<strong>Wind</strong> power development in Korea will also be facilitated by<br />
the fact that several major international companies including<br />
Samsung, Daewoo and Hyundai have recently entered the<br />
wind business.<br />
The GWEO scenariOS For Oecd Pacific<br />
Given the diversity of the four countries covered, it is worth<br />
drawing a quick side-by-side comparison:<br />
Japan<br />
Japan’s power sector is divided between nuclear, coal and<br />
(mostly imported) natural gas. While demand is expected to<br />
remain fairly steady in the short to medium term, the share<br />
of different forms of power generation is likely to shift, as<br />
some coal-fired generation is likely to be phased out in the<br />
coming decades as Japan is aiming to cut its CO2 emissions<br />
by 25% in 2020 compared with 1990 levels. However, Japan<br />
is focusing more heavily on expanding its nuclear power<br />
generation than renewables to achieve this, and its target for<br />
electricity from non hydro renewables is 1.63% by 2014.<br />
Japan has a massive power sector market – over three times<br />
the size of Korea’s, five times the size of Australia’s, and 25<br />
times the size of New Zealand’s. So far, Japan has this group’s<br />
highest installed wind capacity, at 2.1 GW, but its development<br />
is slowing down, while Australia is moving forward<br />
rapidly. Both Australia and New Zealand have excellent<br />
wind resources, but given that New Zealand has such good<br />
hydro and limited power demand, the total market likely<br />
to be developed here is likely to remain modest. Korea has<br />
the smallest and youngest wind market of the four, but has<br />
several home-grown turbine manufacturers and a plan to<br />
expand renewable <strong>energy</strong>.<br />
Japan’s official government target for wind power by <strong>2010</strong><br />
was 3,000 MW, and by the end of 2009, 2,056 MW of<br />
these had been installed. With the pace of new installations<br />
slowing down considerably in recent years due to technical,<br />
The Reference scenario for OECD Pacific expects wind market<br />
growth to decline until 2015, with installations dropping<br />
from 867 MW in 2009 to just 300 MW per year by 2015. In<br />
the second half of the decade, the Reference scenario sees<br />
the market creeping back up so that, by 2030, 2009 levels<br />
48
Woolnorth wind farm, Tasmania, Australia<br />
© <strong>Wind</strong> Power Works<br />
have been regained. By 2030 the cumulative capacity of wind<br />
power would be 18.6 GW, up from 4.6 GW in 2009.<br />
The effects on both economy and climate would be marginal,<br />
compared to these countries total economic power. Annual<br />
investments would drop by two-thirds from the current<br />
€1.2 billion to just €400 million in 2015, and will not regain<br />
the 2009 levels until the end of the scenario period.<br />
In terms of climate change, wind power would, in this scenario,<br />
not help these countries achieve their targets – only<br />
15.5 million tons of CO2 would be saved every year across<br />
the whole region by 2020, compared to 500 million tons currently<br />
emitted by the Japanese electricity sector alone.<br />
The Moderate scenario shows that, with a more positive<br />
operating framework, there could be 81 GW of wind power<br />
in operation by 2030 – more than four times the Reference<br />
scenario’s capacity – while the Advanced scenario anticipates<br />
109 GW. This is close to the present total power capacity<br />
(123 GW) of Australia and Korea combined, or close to half of<br />
Japan’s.<br />
With 109 GW of wind power in place, these countries<br />
would produce close to 270 TWh and save the emissions of<br />
161 million tonnes of CO2 per year. Economically, €6.7 billion<br />
worth of investment would flow into these countries wind<br />
markets every year by 2030, and the sector would employ<br />
over 110,000 people, compared with the 13,700 employed in<br />
2009.<br />
49
© <strong>Wind</strong> Power Works<br />
The WOrld’s wind reSOurces<br />
50
T h e W O r l d ’ s w i n d r e S O u r c e s<br />
<strong>Wind</strong> farm in Canada<br />
© Nordex<br />
Horse Hollow wind farm, United States<br />
© <strong>Wind</strong> Power Works<br />
When evaluating different methods of power generation<br />
some of the main questions inevitably concern the fuel<br />
proposed. Is there enough of it Is it in the right places<br />
It is available when you want it What does it cost What<br />
emissions does it have What residue does it leave For wind<br />
power generation, wind is of course the ‘fuel’ and these questions<br />
are as relevant as they are for any other source.<br />
The last of these questions has the simplest answer: unlike<br />
fuels that are burnt, wind is free and clean. Questions about<br />
how much wind there is, where it is to be found, and when it<br />
is available, however, are very pertinent.<br />
On a global scale numerous studies confirm the enormity<br />
of the resource, and how it could theoretically meet global<br />
electricity demand many times over. A recent addition to this<br />
sequence is a collaboration by researchers at Harvard University<br />
in the United States and VTT in Finland that concluded<br />
that ‘a network of land-based, 2.5 MW turbines, restricted to<br />
non-forested, ice-free and nonurban areas, operating at as<br />
little as 20% of their rated capacity could supply more than<br />
40 times current worldwide consumption of electricity’. 1<br />
A slightly earlier comprehensive study by researchers from<br />
Stanford University’s <strong>Global</strong> Climate and <strong>Energy</strong> Project<br />
based its conclusions on five years of data from the US National<br />
Climatic Data Center. Using an extensive set of surface<br />
and balloon measurements, they concluded that 13% of the<br />
sites tested had a good wind resource (Class 3) at 80 metres<br />
off the ground, and using one in five of these sites for power<br />
generation would allow wind <strong>energy</strong> to meet the world’s<br />
electricity demand (using the figure from the year 2000)<br />
seven times over. 2<br />
Similarly, an earlier study in 2003 by the German Advisory<br />
<strong>Council</strong> on <strong>Global</strong> Change calculated that the global<br />
technical potential for <strong>energy</strong> production from both onshore<br />
and offshore wind was 270,000 TWh per year. Assuming<br />
10%–15% of this was realisable in a sustainable fashion, the<br />
resulting 39,000 TWh would meet more than double the current<br />
global electricity demand. A literature search shows up<br />
numerous similar studies with broadly similar conclusions. 3<br />
Each of the studies varies in its outcome, depending on the<br />
assumptions used. One variable concerns the size, capacity<br />
factor and rated power of the turbines used for estimations<br />
of wind power potential. In addition, the higher the turbine<br />
is mounted, the better the wind resource. Further, higher<br />
turbines are less prone to be affected by turbulence caused<br />
by obstructions, topography, surface roughness or thermal<br />
effects. In addition, advances in technology can not only increase<br />
the capacity factor of wind turbines, but also the range<br />
of wind speeds in which they can operate, thus broadening<br />
the range of sites at which they can be used.<br />
Another variable concerns assumptions about the land areas<br />
on which turbines can be deployed. While most studies will<br />
rule out conservation areas, forests and urban sites, some<br />
1 Xi Lu, M.B. McElroy and J. Kiviluoma: <strong>Global</strong> potential for wind-generated electricity. Proceedings of the National Academy of Sciences, 2008. ww.pnas.org/cgi/doi/10.1073/pnas.090410110<br />
2 Archer, C.L. and M.Z. Jacobson: Evaluation of global wind power, 2005. JOURNAL OF GEOPHYSICAL RESEARCH, VOL. 110, D12110, doi:10.1029/2004JD005462, 2005<br />
3 German Advisory <strong>Council</strong> on <strong>Global</strong> Change: World in Transition – Towards Sustainable <strong>Energy</strong> Systems, 2004. http://www.wbgu.de/wbgu_jg2003_engl.pdf<br />
51
T h e W O r l d ’ s w i n d r e S O u r c e s<br />
5km <strong>Global</strong> Wi<br />
types of agricultural land such as pastures are easily compatible<br />
with wind farms without constraining the overall wind<br />
potential of a region.<br />
5 km <strong>Wind</strong> Map at 80m<br />
© <strong>2010</strong> 3Tier Inc. All Rights Reserved.<br />
Methodologies for assessing offshore wind resources also differ<br />
in terms of the underlying assumptions used. An assumption<br />
needs to made concerning the areas in which wind farms<br />
can be built, both for practical reasons (maximum distance<br />
to shore, water depth etc), as well as taking into account environmental<br />
and regulatory limitations (nature reserve areas,<br />
shipping lanes, minimum distance to shore, etc). Some new<br />
configurations that deploy turbines on floating structures and<br />
are thus suitable for use in deep water are at a preliminary<br />
stage of test deployment. These could dramatically increase<br />
the technically usable fraction of the offshore wind potential.<br />
Evidence from a large number of studies into the world’s wind<br />
resources suggests that there is no shortage of suitable sites<br />
for wind power development. However, it is worth noting<br />
that the rate of deployment of wind power in each county<br />
has largely been dependent on political will rather than<br />
resource criteria. Germany has a lower wind potential than<br />
many other European countries, yet its favourable political<br />
climate has led to rapid and large-scale deployment of wind<br />
power. On the other hand, there are numerous parts of the<br />
world with a good wind resource – places such as Argentina,<br />
Russia and South Africa – where development of wind power<br />
has barely started.<br />
Overall, it is clear that the wind’s <strong>energy</strong> offers a practically<br />
unlimited, clean and emissions free power source of which<br />
only a tiny faction is currently being exploited. There may be<br />
concerns about ‘Peak Oil’ but ‘Peak <strong>Wind</strong>’ is not a concept<br />
that need worry us!<br />
52<br />
Copyright © <strong>2010</strong> 3TIER Inc. All Rights Res
T h e W O r l d ’ s w i n d r e S O u r c e s<br />
nd<br />
km <strong>Global</strong> <strong>Wind</strong><br />
5km <strong>Global</strong> <strong>Wind</strong><br />
5km <strong>Wind</strong> Map at 80m<br />
<strong>Wind</strong> speed<br />
Copyright © <strong>2010</strong> 3TIER Inc. All Rights Reserved.<br />
3 6 9 m/s<br />
5km <strong>Wind</strong> Map at 80m<br />
<strong>Wind</strong> speed<br />
pyright © <strong>2010</strong> 3TIER Inc. All Rights Reserved.<br />
3 6 9 m/s<br />
5km <strong>Wind</strong> Map at 80m<br />
<strong>Wind</strong> speed<br />
erved.<br />
3 6 9 m/s<br />
53
© <strong>Wind</strong> Power Works<br />
Integrating wind pOWer inTO<br />
electricity sySTeMS<br />
54
I n t e g r a t i n g w i n d p O W e r i n T O e l e c t r i c i t y s y S T e M S<br />
Inside the power system<br />
The availability of electric power has become a vast enabler<br />
for human beings, yet has also fostered a massive dependency.<br />
While food and clean water have been a fundamental<br />
requirement for millennia, electric power has become a<br />
recent essential in homes, factories, offices, hospitals. When<br />
the power blacks out, countless human activities now halt in<br />
an instant.<br />
It is quite remarkable how far the process of generating<br />
electricity has come in the past 130 years, since the invention<br />
of the electric generator and the incandescent light<br />
bulb enabled Thomas Edison set up the first-ever electric<br />
company. Supplying electric lighting to the offices of New<br />
York’s Wall Street, his business provided local generation for<br />
local customers – a model that was replicated in many other<br />
towns and cities in many parts of the world. There were no<br />
transmission lines in those days, just small, coal-fired steam<br />
generators providing power on a local system.<br />
Since then the system has grown in complexity and scale. An<br />
extra level of complexity was added when, in the 1980s, the<br />
process of liberalizing the electric power industry began in<br />
many industrialised countries. Gradually this has separated<br />
the generators, the transmission system operators (TSOs)<br />
who run the high-voltage grids, the distribution service operators<br />
(DSOs) who manage the delivery of consumer-voltage<br />
power to customers, and the power sellers. Many power<br />
companies are both generators and retailers of electricity.<br />
Electricity is more of a will o’ the wisp than a commodity. It<br />
can’t be ‘held’ somewhere in a storage tank or reservoir. It is<br />
generated, and used, in a second. Transmission system operators<br />
(TSOs) – who have little control over demand – have<br />
the remarkable task of matching supply to meet whatever<br />
demand might be at any moment of the day, or night, during<br />
winter and summer alike.<br />
TSOs are like conductors of the ‘orchestra’ of power supply,<br />
bringing in one section of the orchestra and quietening another;<br />
or are like controllers of traffic at a busy and complex<br />
intersection. What they are doing is matching supply to demand<br />
– without ever being absolutely certain what demand<br />
will be. Of course, consumption patterns have been recorded<br />
and analysed, so the TSOs know broadly what to expect, and<br />
when. Forecasting of demand has become a sophisticated<br />
business, especially as it also underlies the prices at which<br />
electricity is bought and sold.<br />
Large scale coal and nuclear plants are usually 500-<br />
1,000 MW or more, and have little flexibility in their output<br />
– regardless of the demand. Hydro is supremely controllable,<br />
constantly ‘willing’ to release the vast <strong>energy</strong> of water that<br />
wants to obey the law of gravity, but with the supply of water<br />
to its turbines fully adjustable. Gas-fired generation can also<br />
offer a quick response to match demand.<br />
It is the peaks of power demand that are trickiest for TSOs<br />
to handle. In order to maintain voltage within the system<br />
they may have to call on every available resource, especially<br />
if neighbouring operators have no spare power that can be<br />
brought in via the ‘interconnectors’ between different grid<br />
systems. This can mean bringing some plant out of semi-retirement,<br />
or calling on diesel generator sets. This ‘peaking’ or<br />
‘peaker’ power can often be most among the most polluting,<br />
and expensive to run. In open markets it can also command a<br />
high price.<br />
Dealing with wind farms’ variable power output<br />
Power output from an individual wind turbine or wind farm<br />
varies over time, depending on the weather conditions. The<br />
fact that wind output varies is not itself a problem, provided<br />
that good information is available in advance to predict how<br />
much power wind farms will be producing at any given time.<br />
Predictability, by means of accurate forecasting, is an essential<br />
tool to the successful integration of wind power into the<br />
electric power system.<br />
Extensive evaluation and modelling is carried out before a<br />
wind farm is built. That provides a great deal of information<br />
about what these wind plants will deliver on a seasonal<br />
or monthly basis. This is reinforced once wind farms are in<br />
operation.<br />
In countries with ‘priority access’ for renewable <strong>energy</strong><br />
producers, such as Germany and Spain, TSOs manage the<br />
grid as a whole to ensure that the system can always accept<br />
the maximum output from the wind plants in windy periods,<br />
yet maintain the power supply to power consumers during<br />
less windy periods. TSOs can now be supplied not only<br />
with seasonal/monthly expectations, but a combination of<br />
55
I n t e g r a t i n g w i n d p O W e r i n T O e l e c t r i c i t y s y S T e M S<br />
control centres that can monitor and manage efficiently the<br />
entire national fleet of wind turbines. Thanks to a combination<br />
of technology, forecasting and TSO expertise, in some<br />
parts of Europe wind power is routinely providing 30% of<br />
the electricity supply, and at times this goes far higher. In<br />
western Denmark, and in parts of Germany, wind has at times<br />
provided more than 100% of demand, meaning that ‘spare’<br />
electricity generated from wind has been available to export<br />
to neighbouring grid systems.<br />
Woolnorth wind farm, Tasmania, Australia<br />
© <strong>Wind</strong> Power Works<br />
good meteorological forecasting and sophisticated software<br />
enables them also to have reliable hour-by-hour forecasts of<br />
available wind power. These are of particular value for their<br />
complex task.<br />
While there can be variations between forecast and actual,<br />
this is of course also the case on the demand side. Any<br />
power system is influenced by a large number of planned<br />
and unplanned factors, but they have been designed to cope<br />
effectively with these variations through their configuration,<br />
control systems and interconnection.<br />
In addition, large, interconnected grids lessen the overall<br />
impact if the wind stops blowing in one particular place. The<br />
idea of new electric ‘superhighways’, such as the ‘supergrid’<br />
proposed to tap into the vast offshore wind resource in northern<br />
Europe and link these countries’ electricity grids with the<br />
entire continent, would dramatically help to smooth out the<br />
variable output of the individual wind turbines.<br />
A frequent misunderstanding concerning wind power relates<br />
to the amount of ‘back up’ generation capacity required<br />
to balance the variability of wind power in a system. The<br />
additional balancing costs associated with large-scale wind<br />
integration tend to amount to less than 10% of wind power<br />
generation costs, depending on the power system flexibility,<br />
the accuracy of short-term forecasting and functioning of the<br />
individual power market. The effect of this on the consumer<br />
power price is close to zero. 1<br />
On the demand side, changes in weather makes people<br />
switch on or off their heating, cooling and lighting, and<br />
millions of consumers expect instant power for hair dryers,<br />
washing machines and TVs – sometimes all at the same time<br />
such as during a popular TV programme.<br />
On the supply side, also, there are variations, and not only<br />
from renewable <strong>energy</strong> sources. When a large power station<br />
suddenly shuts down, whether by accident or for maintenance,<br />
this causes the immediate loss of many hundreds of<br />
megawatts of capacity. With wind power, which is produced<br />
by hundreds or thousands of individual wind turbines rather<br />
than a few large power stations, such sudden drops should<br />
never occur, and significant variations should be forecast<br />
and planned for. This makes it easier for system operators to<br />
predict and manage the changes in supply.<br />
Grid operators in a number of European countries, including<br />
Spain, Denmark and Portugal, have now introduced central<br />
56<br />
New transmission lines<br />
Unless electricity is generated on-site, from solar, wind,<br />
biogas or small hydro, and is then used on-site, some kind<br />
of transport is needed – either of fuel (coal, gas, LNG, diesel,<br />
biomass, nuclear fuel), or of waste products (fly-ash, spent<br />
nuclear fuel), or of the electricity itself.<br />
Some forms of power generation (large hydro, geothermal)<br />
have little flexibility in their siting because of the nature<br />
of the resource. Coal power is more flexible – industry and<br />
power generation have to some extent grown up around coal<br />
resources, but more often the coal itself is transported by<br />
ship, rail or truck. Natural gas has to be piped – sometimes<br />
vast distances across continents. Increasingly it is pressurized<br />
and then shipped in containers in liquid form as LNG. Nuclear<br />
fuel and waste need especially secure transport. All these<br />
1 European <strong>Wind</strong> <strong>Energy</strong> Association: <strong>Wind</strong> <strong>Energy</strong> – The Facts, 2009
I n t e g r a t i n g w i n d p O W e r i n T O e l e c t r i c i t y s y S T e M S<br />
forms of transport and processing add to the cost of those<br />
fuels, and to the amount of carbon emitted in getting their<br />
<strong>energy</strong> from the ground and to the electric plug.<br />
<strong>Wind</strong> power can be developed in a very wide range of locations,<br />
and at many scales – from one or two turbines to<br />
hundreds. Optimizing the siting can make a big difference<br />
to the power output from a wind turbine, and this is greatly<br />
magnified over a turbine’s operating lifetime of 20+ years.<br />
However, as pointed out earlier in this book, up to now the<br />
rate of deployment of wind power by country has largely<br />
been dependent on political issues rather than resource criteria.<br />
In Germany, for instance, a favourable political climate<br />
has led to the large-scale deployment of wind power, while<br />
its wind resource (especially in the centre and south of the<br />
country) is lower than in some other European countries with<br />
much less installed capacity.<br />
So while wind power can work effectively in many locations,<br />
it is true that some regions have an excellent resource that<br />
is located away from the towns and cities needing power (in<br />
fact, truly windy locations have historically been avoided as<br />
places to live). This might be true on a small scale (western<br />
Texas has excellent wind, but its cities are further east and<br />
south) or a larger one (Xinjiang’s excellent wind is many miles<br />
from China’s eastern seaboard cities). And then there is the<br />
case of connecting large-scale offshore wind with electricity<br />
users. Connecting those resources to the locations where<br />
power is needed does require new lines – just as new lines<br />
would be needed for large hydro, or pipelines for gas.<br />
A further factor to bear in mind is that the power lines built<br />
decades ago in some parts of the world badly need upgrading<br />
to cope with the demands and size of today’s power sector,<br />
so investment in grid upgrades is needed in any case. The<br />
IEA estimates that by 2030, over 1.8 trillion USD will have to<br />
be invested in transmission and distribution networks in the<br />
OECD alone 2 . In some parts of the world – such as Europe –<br />
grid upgrades are also a prerequisite for the operation of the<br />
market without conflicting with legislation allowing competition.<br />
Yet with all this talk of power grids and centralized generation,<br />
it is worth noting that a high-voltage grid is not<br />
always the answer. In many parts of both the developed and<br />
developing world, the cost of building transmission lines to<br />
reach every part of the countries is simply prohibitive. There<br />
are thousands of communities that the grid may never reach.<br />
Occasionally high-voltage lines even pass overhead, busily<br />
on their way from a large hydro plant to a big city – but there<br />
are no substations and distribution networks to deliver usable<br />
power to the people who live beneath. Here wind power,<br />
sometimes in combination with other renewables, can work<br />
on a smaller scale, off-grid, or on so-called mini-grids that<br />
serve a pocket of need.<br />
The right quality of power<br />
Another aspect to bear in mind is that the performance of,<br />
and output from, wind turbines harmonizes with the grid’s<br />
requirements and does not create any disturbances to the<br />
system. This is ensured by means of so-called ‘grid codes’ that<br />
lay down the parameters within which wind turbines must<br />
operate.<br />
Grid codes cover the technical aspects relating to the operation<br />
and use of a country’s electricity transmission system.<br />
They also lay down rules that define the ways in which<br />
generating stations connecting to the system must operate in<br />
order to maintain grid stability.<br />
Technical requirements within grid codes vary from system to<br />
system, but the typical requirements for generators normally<br />
concern tolerance (i.e. minimum and maximum voltage and<br />
frequency limits), control of active and reactive power, protective<br />
devices and power quality. Specific requirements for<br />
wind power generation are changing as penetration increases<br />
and as wind power is starting to function more like other<br />
large power plants.<br />
Earlier generations of wind turbines were unable to respond<br />
if there was a fault on the network, and could even aggravate<br />
the situation. Today, however, modern wind turbines contribute<br />
substantially to the stability of the grid. The majority<br />
of turbines being installed today are capable of meeting the<br />
most severe grid code requirements, with advanced features<br />
including fault-ride-through capability. This enables them to<br />
assist in keeping the power system stable when disruptions<br />
occur. Modern wind farms are wind <strong>energy</strong> power plants that<br />
can be actively controlled and provide grid support services.<br />
2 International <strong>Energy</strong> Agency, World <strong>Energy</strong> Outlook 2008.<br />
57
A n n e x<br />
Reference<br />
Year<br />
Cumulative<br />
[GW]<br />
<strong>Global</strong> Annual Growth<br />
Rate [%]<br />
– excluding<br />
repowering<br />
Annual [MW]<br />
incl. repowering<br />
Capacity<br />
factor<br />
[%]<br />
Production<br />
[TWh]<br />
<strong>Wind</strong> power<br />
penetration of<br />
world’s electricity in %<br />
Reference<br />
2007 94 28 19,865 25 206<br />
2008 120 36 28,700 25 263<br />
2009 159 41 38,343 25 347<br />
<strong>2010</strong> 185 17 26,753 25 406 2,3<br />
2015 296 3 20,887 28 725<br />
2020 415 4 25,712 28 1,019 4,5<br />
2025 494 3 25,841 28 1,212<br />
2030 573 3 41,219 28 1,405 4,9<br />
2035 653 2 41,426 28 1,601<br />
2040 732 2 46,262 30 1,925 5,6<br />
2045 807 2 46,494 30 2,120<br />
2050 880 2 55,538 30 2,312 5,9<br />
Moderate<br />
Year<br />
Cumulative<br />
[GW]<br />
<strong>Global</strong> Annual Growth<br />
Rate [%]<br />
– excluding<br />
repowering<br />
Annual [MW]<br />
incl. repowering<br />
Capacity<br />
factor<br />
[%]<br />
Production<br />
[TWh]<br />
<strong>Wind</strong> power<br />
penetration of<br />
world’s electricity in %<br />
Reference<br />
2007 94 28 19,865 25 206<br />
2008 120 36 28,700 25 263<br />
2009 159 41 38,343 25 347<br />
<strong>2010</strong> 199 26 40,212 25 435 2,4<br />
2015 460 17 62,887 28 1,129<br />
2020 832 9 88,133 28 2,041 8,9<br />
2025 1,274 7 104,391 28 3,125<br />
2030 1,778 5 148,416 28 4,360 15,1<br />
2035 2,275 4 158,122 28 5,580<br />
2040 2,741 3 181,185 30 7,203 20,9<br />
2045 3,213 3 208,433 30 8,444<br />
2050 3,702 3 214,126 30 9,729 24,7<br />
Advanced<br />
Year<br />
Cumulative<br />
[GW]<br />
<strong>Global</strong> Annual Growth<br />
Rate [%]<br />
– excluding<br />
repowering<br />
Annual [MW]<br />
incl. repowering<br />
Capacity<br />
factor<br />
[%]<br />
Production<br />
[TWh]<br />
<strong>Wind</strong> power<br />
penetration of<br />
world’s electricity in %<br />
Reference<br />
2007 94 28 19,865 25 206<br />
2008 120 36 28,700 25 263<br />
2009 159 41 38,343 25 347<br />
<strong>2010</strong> 202 27 43,263 25 442 2,5<br />
2015 533 20 87,641 28 1,308<br />
2020 1,071 9 120,135 28 2,628 11,5<br />
2025 1,687 6 135,747 28 3,805<br />
2030 2,342 4 185,350 28 5,429 18,8<br />
2035 2,877 3 185,350 28 6,823<br />
2040 3,305 2 185,350 30 8,473 24,6<br />
2045 3,678 2 185,350 30 9,477<br />
2050 4,028 2 185,350 30 10,403 26,4<br />
58
A n n e x<br />
Reference<br />
Year<br />
<strong>Wind</strong> power<br />
penetration of<br />
world’s electricity in %<br />
– ER <strong>2010</strong><br />
CO2 reduction<br />
(with 600 g<br />
CO2/kWh)<br />
[annual Mio tCO2]<br />
Avoided CO2<br />
since 2003<br />
[cumulative<br />
Mio tCO2]<br />
Capital<br />
costs<br />
[€/kW]<br />
Investment<br />
[€1000]<br />
Jobs Total<br />
(including<br />
O&E)<br />
2007 123 406 1,300 25,824,500 329,232<br />
2008 158 564 1,350 38,745,000 470,559<br />
2009 208 772 1,350 51,763,050 627,927<br />
<strong>2010</strong> 2,3 243 1,016 1,327 35,506,629 462,982<br />
2015 435 2,834 1,276 26,649,758 411,801<br />
2020 4,8 611 5,539 1,240 31,894,089 524,027<br />
2025 727 8,944 1,227 31,714,995 552,233<br />
2030 5,6 843 12,928 1,216 50,136,247 809,006<br />
2035 960 17,495 1,210 50,121,623 838,677<br />
2040 6,9 1,155 23,017 1,204 55,712,355 937,796<br />
2045 1,272 29,143 1,202 55,881,975 966,089<br />
2050 7,3 1,387 35,854 1,200 56,064,231 1,125,967<br />
Moderate<br />
Year<br />
<strong>Wind</strong> power<br />
penetration of<br />
world’s electricity in %<br />
– ER <strong>2010</strong><br />
CO2 reduction<br />
(with 600 g<br />
CO2/kWh)<br />
[annual Mio tCO2]<br />
Avoided CO2<br />
since 2003<br />
[cumulative<br />
Mio tCO2]<br />
Capital<br />
costs<br />
[€/kW]<br />
Investment<br />
[€1000]<br />
Jobs Total<br />
(including<br />
O&E)<br />
2007 123 362 1,300 25,824,500 329,232<br />
2008 158 521 1,350 38,745,000 470,559<br />
2009 208 729 1,350 51,763,050 627,927<br />
<strong>2010</strong> 2,5 261 990 1,329 53,459,495 629,137<br />
2015 678 3,507 1,258 79,109,203 1,033,721<br />
2020 9,5 1,225 8,466 1,208 106,504,829 1,422,874<br />
2025 1,875 16,512 1,156 120,639,772 1,676,965<br />
2030 17,5 2,616 28,061 1,116 165,691,953 2,372,911<br />
2035 3,348 43,372 1,088 172,107,655 2,496,911<br />
2040 25,7 4,322 63,516 1,068 193,493,633 2,905,770<br />
2045 5,066 87,350 1,051 219,021,620 3,362,692<br />
2050 30,6 5,838 114,982 1,036 221,788,479 3,573,838<br />
Advanced<br />
Year<br />
<strong>Wind</strong> power<br />
penetration of<br />
world’s electricity in %<br />
– ER <strong>2010</strong><br />
CO2 reduction<br />
(with 600 g<br />
CO2/kWh)<br />
[annual Mio tCO2]<br />
Avoided CO2<br />
since 2003<br />
[cumulative<br />
Mio tCO2]<br />
Capital<br />
costs<br />
[€/kW]<br />
Investment<br />
[€ 1000]<br />
Jobs Total<br />
(including<br />
O&E)<br />
2007 123 406 1,300 25,824,500 329,232<br />
2008 158 564 1,350 38,745,000 470,559<br />
2009 208 772 1,350 51,763,050 627,927<br />
<strong>2010</strong> 2,5 265 1,037 1,328 57,450,452 672,827<br />
2015 785 3,812 1,245 109,072,886 1,404,546<br />
2020 12,3 1,577 9,953 1,172 140,762,811 1,918,530<br />
2025 2,283 19,667 1,128 153,100,985 2,190,680<br />
2030 21,8 3,257 34,027 1,093 202,600,198 3,004,081<br />
2035 4,094 52,926 1,059 196,291,917 2,996,955<br />
2040 30,3 5,084 77,001 1,037 192,191,671 3,139,263<br />
2045 5,686 104,256 1,020 189,092,016 3,263,611<br />
2050 32,7 6,242 134,363 1,006 186,507,424 3,380,018<br />
59
ABOUT GWec<br />
<strong>glOBal</strong> repreSenTATION FOR The <strong>Wind</strong> <strong>energy</strong> SecTOR<br />
GWEC is the voice of the global wind <strong>energy</strong> sector. GWEC brings together<br />
the major national, regional and continental associations representing the<br />
wind power sector, and the leading international wind <strong>energy</strong> companies<br />
and institutions. With a combined membership of over 1,500 organisations<br />
involved in hardware manufacture, project development, power generation,<br />
finance and consultancy, as well as researchers, academics and associations,<br />
GWEC’s member associations represent the entire wind <strong>energy</strong><br />
community.<br />
The meMBers OF GWec represent:<br />
• Over 1,500 companies, organisations and institutions<br />
in more than 70 countries<br />
• All the world’s major wind turbine manufacturers<br />
• 99% of the world’s installed wind power capacity<br />
GlOBal <strong>Wind</strong> <strong>Energy</strong> cOuncil (GWec )<br />
80 Rue d’Arlon<br />
1040 Brussels<br />
Belgium<br />
T: 32 2 213 1897<br />
F: 32 2 213 1890<br />
www.gwec.net<br />
info@gwec.net<br />
Greenpeace is a global organisation that uses non-violent direct action to<br />
tackle the most crucial threats to our planet‘s biodiversity and environment.<br />
Greenpeace is a non-profit organisation, present in 40 countries<br />
across Europe, the Americas, Asia and the Pacific. It speaks for 2.8 million<br />
supporters worldwide, and inspires many millions more to take action every<br />
day. To maintain its independence, Greenpeace does not accept donations<br />
from governments or corporations but relies on contributions from<br />
individual supporters and foundation grants.<br />
Greenpeace has been campaigning against environmental degradation<br />
since 1971 when a small boat of volunteers and journalists sailed into<br />
Amchitka, an area north of Alaska, where the US Government was conducting<br />
underground nuclear tests. This tradition of ‘bearing witness’ in a<br />
non-violent manner continues today, and ships are an important part of all<br />
its campaign work.<br />
Greenpeace International<br />
Ottho Heldringstraat 5<br />
1066 AZ Amsterdam<br />
The Netherlands<br />
T: 31 20 7182000<br />
F: 31 20 5148151<br />
www.greenpeace.org<br />
sven.teske@greenpeace.org<br />
Scenario by GWEC, Greenpeace International, DLR and Ecofys<br />
Text edited by Angelika Pullen, Steve Sawyer, Sven Teske,<br />
Jackie Jones<br />
Design by bitter Grafik & Illustration, Hamburg<br />
Cover photo courtesy of <strong>Wind</strong> Power Works<br />
60