Electric Gradient Field Applied to Lipid Monolayers - Membrane
Electric Gradient Field Applied to Lipid Monolayers - Membrane
Electric Gradient Field Applied to Lipid Monolayers - Membrane

You also want an ePaper? Increase the reach of your titles
YUMPU automatically turns print PDFs into web optimized ePapers that Google loves.
<strong>Electric</strong> <strong>Gradient</strong> <strong>Field</strong> <strong>Applied</strong> <strong>to</strong> <strong>Lipid</strong><br />
<strong>Monolayers</strong><br />
A Master thesis by<br />
Asger Tønnesen<br />
Niels Bohr Institute, University of Copenhagen, Denmark<br />
Supervisor<br />
Prof. Thomas Heimburg<br />
Biomembrane Biophysics Group at the<br />
Niels Bohr Institute, University of Copenhagen, Denmark<br />
December 1, 2008<br />
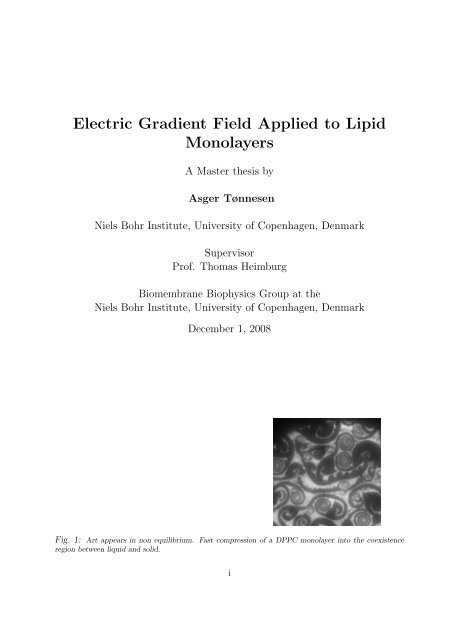
Fig. 1: Art appears in non equilibrium. Fast compression of a DPPC monolayer in<strong>to</strong> the coexistence<br />
region between liquid and solid.<br />
i
ii<br />
Acknowledgement<br />
I wish <strong>to</strong> thank all the members of our Biomembrane Biophysics Group at the Niels Bohr<br />
Institute, especially K. Sigmundson for his encouraging stimulation and comments, A.<br />
Blicher for discussions and optimism. M. Gudman for having designed and build the<br />
combined Langmuir trough and fluorescence microscopy setup at Niels Bohr Institute and<br />
introduced me <strong>to</strong> the technique. Thanks <strong>to</strong> the electronic department and the workshop<br />
Without my supervisor T. Heimburg and his innova<strong>to</strong>ry theory and ideas of propagation<br />
of impulses in nerves I would not have explored this field. His door was ≈ always open.
iii<br />
List of Symbols and Notation<br />
List of general terms and notation for chemicals in the thesis. Materials for the experimental<br />
part are listed in Materials and Methods Chapter 5.<br />
Terms<br />
Symbol Name<br />
d 0 Distance from monolayer <strong>to</strong> <strong>to</strong>p electrode<br />
DSC Differential Scanning Calorimeter<br />
E <strong>Electric</strong> field applied <strong>to</strong> monolayer<br />
e.g. For example (latin: exempli gratia)<br />
G Energy of a dipole in a electric field<br />
i.e. That is (latin: id est)<br />
NA Numerical aperture (of a microscope objective)<br />
MLVs Multi lamellar vesicles<br />
MMA Mean Molecular Area (Å 2 )<br />
Π Lateral pressure (mN/m)<br />
Ψ D Dipole potential of a monolayer (V)<br />
R Optical resolution (of a microscope objective)<br />
R 0 Radius of equilibrium of induced circular area<br />
T m Melting temperature<br />
U Voltage<br />
WFM Wide-field microscopy, wide-field fluorescence microscopy<br />
WD Working distance (of a microscope objective)<br />
Chemicals<br />
Symbol<br />
DMPE<br />
DPPC<br />
DPPG<br />
POM<br />
PTFE<br />
TRITC-DHPE<br />
Name<br />
1,2-Dimyris<strong>to</strong>yl-sn-Glycero-3-Phosphatidylethanolamine<br />
1,2-Dipalmi<strong>to</strong>yl-sn-Glycero-3-Phosphocholine<br />
1,2-Dopalmi<strong>to</strong>yl-sn-Dlycero-3-Phosphatidylglycerol<br />
Polyacetal Engineering Polymers, Delrin<br />
Poly(tetrafluoroethene), Teflon<br />
n-(6-Detramethylrhodaminethiocarbamoyl)-<br />
1,2-Dihexadecanoyl-sn-Glycero-<br />
3-Phosphoethanolamine, Triethylammonium salt
Contents<br />
1 Introduction 1<br />
1.1 Motivation and Outline . . . . . . . . . . . . . . . . . . . . . . . . . . . . . 1<br />
1.2 Questioning Electro-physiology of Neurons . . . . . . . . . . . . . . . . . . 2<br />
1.3 Ordered Phosphorlipid <strong>Monolayers</strong> on aqueous subphase . . . . . . . . . . 3<br />
1.4 Previous Studies with <strong>Electric</strong>al <strong>Field</strong>s <strong>Applied</strong> <strong>to</strong> <strong>Monolayers</strong> . . . . . . . 5<br />
2 Phase Transition of DPPC 10<br />
2.1 Phase Transitions - Biological Relevance . . . . . . . . . . . . . . . . . . . 10<br />
2.2 On the Diacyl-PhosphatidylCholines . . . . . . . . . . . . . . . . . . . . . 12<br />
2.3 Influence of TRITC-DHPE on DPPC - Calorimetric Measurements . . . . 15<br />
2.4 Conclusion on the influence of TRITC-DHPE . . . . . . . . . . . . . . . . 16<br />
3 Isothermal Compression of DPPC <strong>Monolayers</strong> 17<br />
3.1 Introduction . . . . . . . . . . . . . . . . . . . . . . . . . . . . . . . . . . . 17<br />
3.2 Thermodynamics of DPPC <strong>Monolayers</strong> . . . . . . . . . . . . . . . . . . . . 19<br />
3.3 Images of the (LE-LC) coexistence region of DPPC <strong>Monolayers</strong> . . . . . . 22<br />
3.4 Conclusion . . . . . . . . . . . . . . . . . . . . . . . . . . . . . . . . . . . . 23<br />
4 Origin of <strong>Membrane</strong> Surface Potential 24<br />
4.1 The Head Group of DPPC . . . . . . . . . . . . . . . . . . . . . . . . . . . 26<br />
4.2 Influence of Temperature and sodium chloride . . . . . . . . . . . . . . . . 28<br />
4.3 Other Approaches . . . . . . . . . . . . . . . . . . . . . . . . . . . . . . . . 29<br />
5 Materials and Methods 32<br />
5.1 Langmuir Trough for Isothermal Compression . . . . . . . . . . . . . . . . 32<br />
5.2 Fluorescence and Optics . . . . . . . . . . . . . . . . . . . . . . . . . . . . 34<br />
5.3 Langmuir Trough and <strong>Applied</strong> <strong>Electric</strong>al <strong>Gradient</strong> <strong>Field</strong> . . . . . . . . . . . 39<br />
6 Induced Changes in <strong>Monolayers</strong> by <strong>Electric</strong> <strong>Field</strong> 42<br />
6.1 Introduction . . . . . . . . . . . . . . . . . . . . . . . . . . . . . . . . . . . 42<br />
6.2 Preliminary Results and the Experimental Progress . . . . . . . . . . . . . 44<br />
6.3 Final Experiments and Settings . . . . . . . . . . . . . . . . . . . . . . . . 48<br />
6.4 Results . . . . . . . . . . . . . . . . . . . . . . . . . . . . . . . . . . . . . . 49<br />
iv
CONTENTS<br />
v<br />
6.4.1 Creation of a Domain Cluster . . . . . . . . . . . . . . . . . . . . . 49<br />
6.4.2 A Voltage-Radius Relation . . . . . . . . . . . . . . . . . . . . . . . 50<br />
6.5 Theory and Discussion of the <strong>Applied</strong> <strong>Electric</strong> <strong>Field</strong> and Dipoles . . . . . . 52<br />
6.6 Conclusion . . . . . . . . . . . . . . . . . . . . . . . . . . . . . . . . . . . . 57<br />
7 Summary & Outlook 59<br />
7.1 Summary . . . . . . . . . . . . . . . . . . . . . . . . . . . . . . . . . . . . 59<br />
7.2 Outlook . . . . . . . . . . . . . . . . . . . . . . . . . . . . . . . . . . . . . 61<br />
7.2.1 Experimental Extensions . . . . . . . . . . . . . . . . . . . . . . . . 61<br />
7.2.2 Bilayer Systems . . . . . . . . . . . . . . . . . . . . . . . . . . . . . 61<br />
Appendix 63<br />
A 63<br />
A.1 Effect of Homogeneous <strong>Field</strong>. . . . . . . . . . . . . . . . . . . . . . . . . . 63<br />
A.2 Direct Stimulation of DPPC <strong>Monolayers</strong> . . . . . . . . . . . . . . . . . . . 64<br />
A.3 Recipe for Trough Handling . . . . . . . . . . . . . . . . . . . . . . . . . . 65<br />
A.4 Glue a coverglass on<strong>to</strong> the steel ring . . . . . . . . . . . . . . . . . . . . . . 66<br />
A.5 Locating the <strong>to</strong>p electrode . . . . . . . . . . . . . . . . . . . . . . . . . . . 67<br />
Bibliography 67
Chapter 1<br />
Introduction<br />
1.1 Motivation and Outline<br />
The question of inspiration for the experimental work in this thesis was originally ”How<br />
does electrical stimulation of a nerve affect the main membrane components i.e. the lipids”<br />
The complete answer <strong>to</strong> this question is unfortunately not given by this thesis.<br />
In spite of the enormous research on nerves including; nerve signaling, recep<strong>to</strong>r proteins<br />
for neurotransmitters and anaesthesia, selective ion channels (proteins) etc. little attention<br />
has been paid <strong>to</strong> the probable influence of electrical stimulation on the lipids. However<br />
the sparse literature on the subject shows that polar phospholipid monolayers are strongly<br />
affected by the presence of an inhomogeneous electric field [Mohwald1986][Heckl1988].<br />
In this thesis the question is approached by studying the effect of an electric gradient<br />
field applied on<strong>to</strong> a model membrane resembled with an artificial lipid monolayer<br />
in a Langmuir trough. The monolayers consist of the derivative of lipids, which have<br />
the highest mass percentage content of lipids in non-myelinated nerves. These lipids<br />
are the Diacyl-PhosphatidylCholines (PCs) characterised by polar choline head groups<br />
[Sackmann1995]. To simplify the model system as much as possible the (1,2-Dipalmi<strong>to</strong>ylsn-Glycero-3-Phosphocholine)<br />
DPPC was chosen. At room temperature DPPC monolayers<br />
can be compressed in<strong>to</strong> any state and have a broad coexistence region containing both a<br />
liquid and a condensed phase. This region is relevant in the experimental work, since<br />
biological membranes have very broad melting transition profiles and thereby a broad<br />
region of coexistence containing phases of the different lipids present in the membranes<br />
[Heimburg2005].<br />
Outline of the experimental work:<br />
• Melting properties of DPPC with yhe focus on the important polar head group. Differential<br />
scanning calorimetry was used <strong>to</strong> investigate the influence of the fluprescence<br />
marker TRITC-DHPE on multi-lamellar vesicles (MLVs).<br />
1
CHAPTER 1. INTRODUCTION 2<br />
• Observations of morphology and thermodynamics of DPPC monolayers at room temperature,<br />
which was achieved by using a binary technique of a Langmuir trough<br />
combined with wide field fluorescence microscopy (WFM).<br />
• Establishment of a method for stimulation and detection of the effect of an electric<br />
gradient field applied <strong>to</strong> a Langmuir monolayer and conformation of the results from<br />
the 1980’ by Möhwald and co-workers. A reliable setup for the electricl field was build<br />
and designed <strong>to</strong> fit in<strong>to</strong> the existing setup of a Langmuir trough and the (WFM).<br />
• Performance of additional (and non proceeded) experiments with an applied homogeneous<br />
electric field across DPPC monolayers and direct stimulation of DPPC<br />
monolayers which are described in Appendix A.1 and A.2.<br />
1.2 Questioning Electro-physiology of Neurons<br />
This thesis will serve as an eye-opener and a brief introduction <strong>to</strong> what is unexplained about<br />
nerve membranes and applied voltage. It is not a defense of schooled theory describing<br />
aspects and physiology of nerves. It is widely accepted, that the nerve impulse (signal)<br />
propagates along the nerve membrane. The impulses can be measured as electrical analog<br />
signals by putting an electrode on the outer membrane and a reference electrode in the<br />
environment close <strong>to</strong> the membrane.<br />
In the human body a variety of nerves exist which can be<br />
classified in five groups according <strong>to</strong> their functions: 1) Mo<strong>to</strong>r<br />
neurons of spinal cord connected <strong>to</strong> muscles 2) Sensory neurons<br />
widely distributed in the body 3) Pyramidal cells of hippocampus<br />
4) Light sensitive neurons located in the eye retina and 5)<br />
Purkinje cells of cerebellum. A typical multipolar nerve cell<br />
is illustrated in fig. 1.1. It has four morphological regions:<br />
the cell body, dendrites, the axon and the pre-synaptic terminals<br />
[Kandel2000]. Part of the nerves in the human body<br />
are piecewise insulated by Schwann cells, which wrap a layer<br />
of myelin around the axon. On the micrograph the cross section<br />
of a immobilized axon shows the relative dimensions of<br />
the myelin layer, the cy<strong>to</strong>plasm and the impulse conducting<br />
cell membrane of the axon. At the nodes of Ranvier between<br />
the Schwann cells, direct stimulation and recording of nerve<br />
impulses are possible [Tasaki1939]. Conduction of the impulse<br />
was first modeled by Hodgkin and Huxley in 1952 based on<br />
successive influx and efflux of sodium and potassium across<br />
the nerve membrane through ion selective channels [Hodgkin1952].<br />
Fig. 1.1: Schematic of a nerve<br />
with definitions. The membrane<br />
of the axon conducts neuronal<br />
impulses. Insert: Electron<br />
micrograph of nerve cell<br />
axon wrapped in myelin from<br />
a Schwann cell. Adapted from<br />
[Napolitano1967]<br />
With regards <strong>to</strong> this model, however, a consequence of the ion currents across the<br />
membrane has <strong>to</strong> be an irreversible production of heat. Beside the electric impulse nerves<br />
express a local thermal response and thickening of the nerve which both are in phase
CHAPTER 1. INTRODUCTION 3<br />
Fig. 1.2: Left: (Top trace) Thermal responds of the non-myelinated garfish olfac<strong>to</strong>ry nerve in phase<br />
with the (lower trace) recorded electric impulse measured at the same point. Adapted from [Tasaki1989]<br />
Right: The non-myelinated giant squid axon is thickened by 0.5Å and (<strong>to</strong>p trace) at the same point where<br />
the recorded electrical impulse pass. (lower trace). Adapted from [Tasaki1980]<br />
with the electrical signal. The magnitudes of the two signals made it difficult <strong>to</strong> detect<br />
and first in 1958 - 1960 Abbott managed <strong>to</strong> setup a heat sensor of the required accuracy.<br />
This and following experimental results were considerably different from the predicted heat<br />
production by ion fluxes. At the raise of the impulse, heat was released from the nerve<br />
but absorbed again in an equal amount [Abbott1960]. Experiments like these have been<br />
performed mainly by Tasaki and co., who worked on both myelinated nerves and nonmyelinated<br />
nerves, fig. 1.2 [Tasaki1989] [Tasaki1992]. In 1980 a mechanical swelling of a<br />
nerve was detected <strong>to</strong> have a displacement of the nerve cross section in the order of 0.5Å,<br />
and this effect was found in a variety of animals [Tasaki1980] [Tasaki1989] [Tasaki1999].<br />
The results imply an electro-mechanical coupling of the compounds in a nerve membrane,<br />
neither the thermal response nor the swelling can be deduced from the Hodgkin-<br />
Huxley model. If the selective ion channels cannot explain these two detectable effects,<br />
logic claims that, the rest of the membrane i.e. the lipids must be involved and therefor be<br />
examined. However, the questioning of electro-physiology shows the relevance <strong>to</strong> the initial<br />
question How does electrical stimulation of a nerve affect the main membrane components<br />
- the lipids The thermal-mechanical coupling has been approached in [Heimburg2005]<br />
by introducing a mechanical wave (a soli<strong>to</strong>n) in the lipid membrane and include the melting<br />
transition of the membrane. During the melting transition lipid membranes display<br />
changes in volume, heat capacity and area compressibility. The mechanical wave pushes<br />
the liquid membrane about 85% in<strong>to</strong> the transition.<br />
1.3 Ordered Phosphorlipid <strong>Monolayers</strong> on aqueous subphase<br />
The distribution of lipid species in nerve membranes wary from nerve <strong>to</strong> nerve but for nonmyelinated<br />
nerves, the main part is composed of phospholipids with head groups carrying<br />
a charge or has a dipole moment. As an example, the distribution of lipids in a brain nerve<br />
from a rat is given in mass percentage, fig. 1.3 [Sackmann1995].<br />
<strong>Monolayers</strong> composed of oily substances on water have been reported since the ancient
CHAPTER 1. INTRODUCTION 4<br />
Fig. 1.3: Left: Distribution of nerve lipids from the brain of a rat in mass percentage. Green color<br />
for lipid with polar head group. Blue is negative charged and yellow for nonionic lipids. Data from<br />
[Sackmann1995]. Right: Formation of a monolayer after spreading of the lipids and evaporation of the<br />
solvent. Hydrophilic head groups orient in the water and hydrophobic carbon chains point away from the<br />
water. A probe connected <strong>to</strong> a piezo crystal is used <strong>to</strong> convert tension of monolayer-water interface in<strong>to</strong> a<br />
voltage difference.<br />
world by the Pliny the Elder † 79 AD 1 mainly for the reason that a layer of oil damps<br />
disturbances of water. In modern time the phenomena was observed by Benjamin Franklin<br />
1774, who noticed that a teaspoon of oil covered an area of several square yards, but he<br />
did not calculated the thickness of his film. In 1891 a technique was developed by a young<br />
German lady Agnes Pockels. She constructed a ring tensiometer and a trough filled with<br />
water. The trough had movable barriers <strong>to</strong> alter the area and she obtained reproducible<br />
experiments of the extension of films and surface tension [Pockels1891]. She continued the<br />
research in cooperation with Lord Rayleigh, and thus led <strong>to</strong> his conclusion that a film of<br />
amphiphilic acid was only one molecule thick [Rayleigh1889].<br />
Nevertheless, the technique is named after the American scientist Irving Langmuir, who<br />
gave a modern molecular understanding of monolayers and pointed out that the amphiohilic<br />
molecules showed a preferable orientation due <strong>to</strong> the ”active group” head group of the<br />
molecule. Ordering of such molecules are illustrated in fig. 1.3 right. He also stated from<br />
own experiments that spreading follows the 2-dimensional gas law and that palmitic acids<br />
and higher fatty acids exerts lateral pressure in the expanded state of the film. From<br />
this he concluded the existence of a gaseous phase beyond the solid and liquid phases<br />
[Langmuir1917]. He and his assistant Katharin Blodgett developed the techniques for<br />
transferring monolayers <strong>to</strong> solid substrates called the LB method [Blodgett1934]. Nowadays<br />
much attention has been paid <strong>to</strong> the LB technique, because it facilitates visualization and<br />
probing of association phenomena between biological molecules. One should have in mind<br />
that membranes on a substrate are immobilized with lack a of kinetics and do not resembles<br />
in vivo membranes.<br />
Since the improvements and the conceptual development of monolayer troughs by Langmuir<br />
the technique has been intensively used <strong>to</strong> measure surface properties of all kinds of<br />
hydro colloids. Especially, lipid monolayers at the air-water interfaces have been successfully<br />
used as models <strong>to</strong> proximate the behavior of the cellular lipid bilayers, enabling<br />
observation of thermodynamical aspects, such as lateral pressure, surface and dipole poten-<br />
1 1 Roman naturalist, collected all known science in the book Naturalis His<strong>to</strong>ria
CHAPTER 1. INTRODUCTION 5<br />
tials of <strong>Lipid</strong> monolayers [Vogel1988] [Brockman1994]. The ingenious design of an inverted<br />
microscope combined with a Langmuir trough in the early 1980’ enabled direct observations<br />
of monolayers with the use of fluorescence markers in monolayers [VonTscharner1981]<br />
[Losche1983] [Loesche1984]. A wide spread research on the subject has since then acelrated.<br />
This includes diffusion of lipids and proteins [Sax<strong>to</strong>n1987], the influence of large<br />
ions and anaesthesia on lipid monolayers.<br />
1.4 Previous Studies with <strong>Electric</strong>al <strong>Field</strong>s <strong>Applied</strong> <strong>to</strong><br />
<strong>Monolayers</strong><br />
The first scientific results on the subject originates from<br />
1986 published by Möhwald and Miller. Using of a combined<br />
setup of fluorescence microscopy and an electric<br />
gradient field sketched in fig. 1.4, they induced movement<br />
of lipid domains in monolayers in the coexistence<br />
phase. In the monolayer plane, the equipotential of<br />
the field was centered beneath the <strong>to</strong>p electrode. This<br />
enabled a control of attraction for at negative charged<br />
<strong>to</strong>p electrode (U=-100V) and repulsion of lipid domains<br />
for the opposite (U=100V). In the case of attraction, a<br />
nearly circular cluster of domains was formed, while a<br />
domain empty area of same size was induced for a repulsive<br />
field. This was observed for monolayers made of the<br />
polar lipids DLPE 2 , DMPE 3 and DMPA 4 at pH 11 with<br />
the use of fields of strength 5 · 10 6 V/m. With the use of<br />
Fig. 1.4: Schematic of the setup for<br />
generating a radial electric gradient field<br />
at the air-water interface i.e. the monolayer<br />
region [Heckl1988]. This setup was<br />
of great inspiration for the approach in<br />
this thesis.<br />
a steel ring held 10µm above the monolayer instead of the electrode, DMPE domains were<br />
observed <strong>to</strong> melt with a field strength of 1 · 10 7 V/m [Mohwald1986]. They hardly stressed<br />
the sign of the charged electrode (the direction of the field), which is opposite <strong>to</strong> what one<br />
should expect for the direction of the domain movement if the polar head groups accounts<br />
for the dipole moment of the domains. Beside this contradiction they estimated that a<br />
higher density of domains in a cluster was possible relative <strong>to</strong> domain repulsion.<br />
With a similar setup the group extended the research <strong>to</strong> include induced movement of<br />
domains in monolayers made of DPPC. Two main conclusions arived from these experiments:<br />
(1) The direction of the movement depends on the direction of the electric field;<br />
(2) The difference of the dipole components normal <strong>to</strong> the monolayer of the domains and<br />
liquid lipids phases, dominates the effect [Heckl1988]. Thus only the domains are affected<br />
by the field. For quantification they obtained that the growth rate of a cluster with a<br />
constant voltage decreased with time and assumed that the electric gradient force was<br />
2 1,2-Dilauroyl-sn-Glycero-3-Phosphoethanolamine<br />
3 1,2-Dimyris<strong>to</strong>yl-sn-Glycero-3-Phosphoethanolamine<br />
4 1,2-Dimyris<strong>to</strong>yl-sn-Glycero-3-Phosphate (Monosodium Salt)
CHAPTER 1. INTRODUCTION 6<br />
counteracted by a convective force (drift) in the monolayer. At equilibrium between the<br />
forces they defined an radius R 0 . It appeared that the voltage applied <strong>to</strong> the <strong>to</strong>p electrode<br />
was proportional <strong>to</strong> the radius squared, U ∝ R0. 2 They argued that the force produced by<br />
the electric gradient field, for that electrode conformation, was best described with a thin<br />
rod approximation [Heckl1988].<br />
However, as they pointed out in their discussion convective forces cannot balance the<br />
electric gradient force on the whole parameter of the created circular area. Drift in monolayers<br />
has very often a particular direction giving the induced area a convex curve in its<br />
slipstream. For strong drift this convex curve is extended and a ”tail” of the area is formed.<br />
This was actually observed in the first experiments of this thesis and is illustrated in Sec.<br />
6.2. They left an open question about why the domain free and the domains condensed<br />
areas are almost circular<br />
Since the field used has circular equipotentials with the<br />
electrode in the center, the question might be answered if repulsion<br />
between the domains is taken in<strong>to</strong> account. Because<br />
the repulsive dipole forces between the domains in the cluster<br />
will superimpose <strong>to</strong> a resulting dipole force that pointing<br />
radial from the center and perpendicular <strong>to</strong> the equipotentials<br />
in the monolayer plane, a circular shape of the cluster<br />
is favored. A true description the of two components of the<br />
dipoles has not been estimated and is yet not known. It is<br />
known from dipole potential measurements that the normal<br />
component increases during compression i.e. condensation<br />
of the DPPC monolayers [Vogel1988].<br />
In the work from 1989 by Flörsheimer and Möhwald<br />
information about the lipid arrangement was obtained by<br />
studying fusion and fission processes of lipid domains in a<br />
monolayer of DPPC compressed in<strong>to</strong> the coexistence region.<br />
Fig. 1.5: Dipole moments of a domain<br />
parallel <strong>to</strong> the monolayer indicated<br />
by arrows. The normal dipole<br />
components are strongest at the<br />
base and decrease <strong>to</strong>ward the front.<br />
Modified from [Florsheimer1989].<br />
Development of domain shapes was observed, when removing the neighbor domains at the<br />
same time [Florsheimer1989]. Having four electrodes configured in a triangle and one in<br />
its median installed 30µm above the monolayer, manipulation of domains was fairly simple.<br />
For capturing a domain the potential of two electrodes on the triangle was switched<br />
<strong>to</strong> repel domains. Driven by convection, a domain moved <strong>to</strong>ward the area beneath the<br />
median electrode. The potential of the third electrode in the triangle was then switched<br />
<strong>to</strong> keep other domains out of the center area and the central electrode was then charged<br />
<strong>to</strong> keep the domain trapped. Even without increasing the surface pressure and having<br />
the temperature between 17-20 o C, growth of trapped domains was observed. Such growth<br />
could result in fusion of domains or fission, when an arm developing from domains gets<br />
thicker and separates from the mother domain. Controlled rotation of DPPC domains<br />
was carried out which implies a non-uniform distribution of the normal dipole component.<br />
From observations of fusion and fission (repulsion) of trapped DPPC domains Flörsheimer<br />
and Möhwald sketched a possible distribution of dipole moments in a bean shaped domain<br />
fig. 1.5. Fusion between two domains was only observed when contact was made between
CHAPTER 1. INTRODUCTION 7<br />
faces and/or outer long boundaries.<br />
Using the knowledge and the triangle-setup described right above they succeeded in<br />
controlled growth and fusion of lipid domains using DMPE at 20 o C [Florsheimer1990].<br />
These domains differ from DPPC by forming circular domains under normal conditions<br />
without development of arms from the domains. This implies a more uniform distribution<br />
of the dipoles contained and has <strong>to</strong> be explained by the shorter hydrocarbon chains and<br />
the smaller head group of DMPE [Mohwald1999]. Fusion was only possible if the domains<br />
<strong>to</strong>uch each other at special spots on their borderlines.<br />
Their main conclusions from DMPE domains are:<br />
1. Collisions of domains do not lead <strong>to</strong> fusion, normally.<br />
2. When a linkage of two domains at the contact spots<br />
occurs, the linkage grow in size and develops a necklike<br />
connection.<br />
3. A complete fusion of two domains takes 1 hour and<br />
results in a circular domain.<br />
4. Reversibility of fused domains is not observed. Not<br />
even during a little expansion of the monolayer.<br />
Fig. 1.6: Structure of DMPE and<br />
domain fusion which is most probable<br />
at spots of equal indices favoring<br />
maximal contact of hydrocarbon chains<br />
[Florsheimer1990].<br />
They concluded that fusion is most probable when maximal<br />
contact between hydrocarbon chains of two circular<br />
domains is obtained. They sketched such a situation in<br />
fig. 1.6, which is provided for hexagonal packing of the<br />
domain. They purpose that at maximal contact, attracting<br />
Van der Waals forces between the hydrocarbon chains exceeds the repulsion of the<br />
dipole forces.<br />
Following these pioneers the technique has been used <strong>to</strong> measure<br />
the behavior of monolayers composed of lipid mixtures.<br />
McConnell and co-workers 1995 induced phase separation of<br />
the binary mixture DMPC and Dihydrated Cholesterol (now<br />
DChol) [McConnel1995]. This was carried out for constant temperature,<br />
and induced phase separation was measured at lateral<br />
pressures above the critical mixing pressure. The experimental<br />
setup was different by having a glass insulated electrode<br />
sticking through the monolayer, fig. 1.7. This also avoided<br />
problems with accurate measuring of the distance between the<br />
<strong>to</strong>p electrode and monolayer. In previous studies as those described<br />
above two already co-existing phases were manipulated<br />
(i.e. liquid and condensed) but in this study a well mixed phase<br />
Fig. 1.7: An electric potential<br />
is applied <strong>to</strong> an insulated<br />
tungsten wire creating<br />
a electric gradient field<br />
at the air-water interface,<br />
a=6µm. Adapted from<br />
[McConnel1995].
CHAPTER 1. INTRODUCTION 8<br />
containing the non-ionic DChol and the zwitterionic DMPC was<br />
separated. Such induced phase separation with an electric gradient<br />
field is exclusively due <strong>to</strong> the difference in dipole moment density between the DMPC<br />
and DChol. The dipole moment at the end of DChol made up by the OH group is negligible.<br />
Fig. 1.8: Structure of Cholesterol and DMPC.<br />
A similar effect of a gradient field was observed by Wilke et.al. for the lipid mixture<br />
Bovine brain sphingomyelin (Sm) and Ceramide (Cer) in ratios of 9:1 and 8:2. The electrode<br />
setup was similar <strong>to</strong> that of Möhwald 1986-1988 with a single <strong>to</strong>p electrode of diameter<br />
30µm held a distance of 200µm above the monolayer and another in the subphase. With a<br />
mix of 90% (Sm) and 10% (Cer) and 145mM NaCl in the subphase the co-existing phases<br />
was <strong>to</strong>tally repelled from the region beneath the <strong>to</strong>p electrode with a negatve potential<br />
+300V applied <strong>to</strong> the <strong>to</strong>p electrode. By reversing polarity and thereby the field the two<br />
phases clustered in a circular shape, see fig. 1.9 [Wilke2006a].<br />
Fig. 1.9: Repulsion (left:) Structure of Sphingomyelin with a polar ethanolamine head group and<br />
Ceramide. right: In coexistence of 90% Sm and 10 Cer. e) Reported repulsion of both phases with<br />
+300V applied <strong>to</strong> the <strong>to</strong>p electrode, f) -300V causes attraction and increases of lipid density. Image size<br />
650 × 520µm addapted from [Wilke2006a].<br />
In the same year, this group published a model for the system based on the electric<br />
gradient force and the difference between the dipole densities of the used binary mixtures<br />
[Wilke2006]. They were able <strong>to</strong> explain the proportionality of applied voltage and radius<br />
of induced area U ∝ R 2 0. The new model failed at low electric potentials, nevertheless<br />
the model predicted a threshold value for the electrical potential U for inducing a kinetic<br />
movement of the lipids. This value was 100V i.e. 5·10 5 V/m for the used setup. In the<br />
same work it was experimentally showed that mixtures of (DMPC:DSPC), (DLPC:DSPC)<br />
followed the relation U ∝ R 2 0, which within experimental uncertainty have the same coefficient<br />
of proportionality. The size of the induced areas was reported <strong>to</strong> be similar if the<br />
subphase contained 500mM NaCl instead of the usual 145mM NaCl [Wilke2006].
CHAPTER 1. INTRODUCTION 9<br />
Notice:<br />
The experiments from the Möhwald group with DPPC and that only lipid domains are affected<br />
by the electric gradient field. The radius of equilibrium of the two areas is unchanged<br />
for high concentration of sodium chloride.
Chapter 2<br />
Phase transitions of DPPC <strong>Membrane</strong>s and<br />
the Impact of Polar Headgroups<br />
This chapter introduces melting transition of phospholipids with emphasize on DPPC<br />
membranes and the role of polar head group. Calorimetry is used on multi lamellar vesicles<br />
(MLVs) <strong>to</strong> clarify the influence of the fluorophore TRITC-DHPE in incorporated in the<br />
vesicles.<br />
2.1 Phase Transitions - Biological<br />
Relevance<br />
A phospholipid has one or two hydrophobic hydrocarbon<br />
chains mounted on a glycerol backbone at which a hydrophilic<br />
phosphate group is attached. This amphiphilic<br />
structure makes them self organize if they are surrounded<br />
by water in structures that keep the hydrophobic chains<br />
away from contact with water. Possible structures are micelles,<br />
vesicles, bilayers or if deposited on a water surface<br />
a monolayer will form. In general phospholipids constitute<br />
the largest part of biological membranes and thereby<br />
their functions cannot be neglected in any study of such<br />
membranes. Besides the phospholipids hundreds of different<br />
lipids are presented in membranes surrounding biological<br />
cells. To emphasize the role of the lipids it has been<br />
shown that composition of the lipids in biological membranes<br />
depends on the temperature during cell growth<br />
[Hazel1979]. Normally the melting temperature of a cell<br />
membrane is below body temperature of the organism it<br />
self.. This means that at body temperature the lipids are<br />
Fig. 2.1: Heat capacity profile which<br />
peaks indicate phase transitions. Unilamellar<br />
vesicles of DPPC have a melting<br />
temperature at T ≈ 41 0 C. The dotted<br />
line indicates the body temperature<br />
of bovine lung surfactant and growth<br />
temperature of E. coli and B. subtilis.<br />
Addapted from [Heimburg2005].<br />
10
CHAPTER 2. PHASE TRANSITION OF DPPC 11<br />
melted i.e. the liquid phase. As an example of that fig. 2.1 provides profiles for measured<br />
heat uptake during controlled heating of DPPC vesicles, and cell membranes extracted<br />
from bovine lung surfactant, E.coli and B.subtilis [Heimburg2005].<br />
By decreasing the temperature of a phospholipid membrane below melting temperature<br />
of the lipids the membrane undergoes transitions i.e. physical changes in<strong>to</strong> an ordered dense<br />
packed state with energy and entropy lower than the liquid state. When the temperature<br />
is decreased the lipids pass through four different states as illustrated in fig. 2.2.<br />
• L α <strong>Lipid</strong> carbon chains are disordered (fluid) and the lateral order of lipids is random<br />
(liquid). Therefore, this phase is also called the liquid-disordered or fluid phase.<br />
• P β ′ The lipids occupy partially solid and fluid states with a periodic super structure<br />
(ripple-phase).<br />
• L β <strong>Lipid</strong>s are all in the solid state and 2D crystalline molecular order occurs in the<br />
membrane plane. Chains are all-trans (ordered) and tilted. This phase is sometimes<br />
called solid ordered or gel phase.<br />
• L C <strong>Lipid</strong>s are all in a 3D crystalline phase.<br />
Fig. 2.2: States of a phospholipid membrane during condensation from the liquid state <strong>to</strong> crystallization.<br />
A membrane of DPPC decreases its area by 24% and increases its thickness by 16%. Figure adapted from<br />
[Sackmann1995]<br />
For a particular lipid, transitions between these four states take place at well defined<br />
temperatures. Such a transition temperature depends on the intrinsic lipid structure and<br />
environmental fac<strong>to</strong>rs. Longer carbon chains result in higher melting temperature which<br />
increases approximately by 10 o C per carbon a<strong>to</strong>m. On the other hand the melting temperature<br />
decreases with the number of double carbon bonds, C=C. The influence by the<br />
hydrophilic head group is more complicated but increased electrostatic repulsion between<br />
charged head groups lowers the melting temperature.<br />
Environmental fac<strong>to</strong>rs include binding of molecules, ions also H + <strong>to</strong> the head groups.<br />
Mixing the membrane with secondary lipids or molecules, especially anesthetics, such as<br />
chloroform octanol, ethanol or curare changes the phase transition.<br />
The conformation of carbon chains then depends on the state of the lipid and can<br />
change by rotation of the C-C bonds from gauge <strong>to</strong> trans. In the gel, a crystalline state,<br />
they are ”all-trans” for which a carbon chain has reached it full extension and reduced its<br />
lateral cross sectional area. A membrane of DPPC will then decrease its area by 24% and
CHAPTER 2. PHASE TRANSITION OF DPPC 12<br />
increase its thickness by 16% [Heimburg1998]<br />
A change in heat dQ at temperature change dT , defines the heat capacity of the system.<br />
Under the condition of constant pressure one obtains the heat capacity c p from the enthalpy<br />
H = E + pV and the 1 st law E = Q − pdV :<br />
c p =<br />
( dQ<br />
dT<br />
)<br />
p<br />
=<br />
( ) dH<br />
dT<br />
p<br />
(2.1)<br />
Calorimetric measurements on samples like those in fig. 2.1 show the heat uptake at a<br />
given temperature. Then scanning from below T 1 <strong>to</strong> T 2 above the melting temperature<br />
provides the c p curve. The melting enthalpy can then be found by integrating c p from T 1<br />
<strong>to</strong> T 2<br />
∫ T2<br />
∆H = c p dT (2.2)<br />
T 1<br />
The melting temperature T m is defined as the temperature in the melting transition,<br />
where the chemical potential of solid and liquid states are equal. Thus, at this point the<br />
difference in the Gibbs free energy ∆G of the two states is zero. ∆G = G Slid − G Liquid = 0.<br />
The melting entropy is defined as:<br />
∆G = ∆H − T m ∆S = 0 → ∆S = ∆H<br />
T m<br />
(2.3)<br />
For DPPC T m = 41.3 o C, ∆H = 38.1kJ/mole and ∆S = 121.2J/moleK.<br />
2.2 On the Diacyl-PhosphatidylCholines<br />
The lipid group of Diacyl-PhosphatidylCholines has a polar choline head group and two<br />
carbon chains with n carbon a<strong>to</strong>ms. Three repressentative of these are listed with the<br />
number of C-a<strong>to</strong>ms and melting temperature:<br />
DLP C DMP C DP P C DSP C<br />
n(C − a<strong>to</strong>ms) 12 14 16 18<br />
T m ( o C) −3.8 23.6 41.3 54.7<br />
The chain length is the overall dominating fac<strong>to</strong>r on the melting temperature, thus the<br />
melting temperature can be defined statistically from states of the carbon chains i.e. their<br />
conformation. A change in conformation happens if a C-C bond rotates <strong>to</strong>ward one of the<br />
three most likely orientations defined by the three minima of the rotational energy with<br />
dihedral angles of ±120 o . One of them provides a global minimum defining the trans state<br />
while the two gauche states have equal rotational energies. The energy difference is such<br />
that gauche = trans · 2.5kJ/mole.<br />
The melting temperature of a sample between the solid ”ground” state (S) and liquid<br />
”excited” state (L) is statistically defined by assuming that the access of the states are
CHAPTER 2. PHASE TRANSITION OF DPPC 13<br />
equally probable. In the ground state all the C-C bonds are all-trans so only one conformation<br />
is possible. Thus the entropy of that state is defined as S 0 = S0 0 + K b ln(1) = S0.<br />
0<br />
Let γ denote the mean probability of finding one gauche conformation in one C-C bond<br />
so (1 − γ) denotes the probability of finding the rest in trans. During melting the entropy<br />
change due <strong>to</strong> C-C bonds is then defined:<br />
∑<br />
∆S C−C = S 0 − S0 0 γ<br />
( γ<br />
)<br />
= −k b P i ln(P i ) = −2 · k b<br />
2 ln − k b (1 − γ) ln(1 − γ) (2.4)<br />
2<br />
where P gauche+ = P gauche− = γ/2 and P trans = (1 − γ)<br />
For T → ∞, all trans and gauche states<br />
are equally probable so gauche states are<br />
weighted 2/3, γ = 2/3 and the entropy<br />
change is:<br />
( )<br />
1 1<br />
∆S C−C = −3 · k b<br />
3 ln = k b ln(3) (2.5)<br />
3<br />
The entropy scales with the system size since<br />
it is a function of state, meaning that the entropy<br />
of a Diacyl-Phospholipid with 2 carbon<br />
chains of each n C-a<strong>to</strong>ms (n-2 bonds) is given<br />
as:<br />
∆S = ∆S 0 + 2 · (n − 2)∆S C−C (2.6)<br />
Similar relation can be obtained for all functions<br />
of state, so one has the enthalpy:<br />
∆H = ∆H 0 + 2 · (n − 2)∆H C−C (2.7)<br />
i<br />
Fig. 2.3: Top: Energy landscape of the rotation<br />
around a C-C bond. There are three minima one<br />
per each 120 o with the lowest energy for the trans<br />
conformation. bo<strong>to</strong>m: A rotation of the C-C bond<br />
from the trans (center) by 120 o results in one of two<br />
gauche. Nor rotation direction is preferred due <strong>to</strong> the<br />
energy landscape. Adapted from [Gennis1989]<br />
The melting temperature is defined where<br />
the solid and the liquid state are found with equal probability P S (T m ) = P L (T m ) giving a<br />
equilibration constant K(T m ) = 1.<br />
P L (T m )<br />
P S (T m ) = K(T m) = exp(−∆G/RT m ) = 1 (2.8)<br />
→ ∆G = ∆H − T m ∆S = 0 → ∆S = ∆H<br />
T m<br />
(2.9)<br />
There are two contributions <strong>to</strong> the <strong>to</strong>tal melting enthalpy ∆H of Diacyl-PhosphatidylCholines.<br />
One from the melting of the hydrocarbon chains (ch) and one from the polar choline head<br />
groups (hg).<br />
∆H = ∆H ch + ∆H hg (2.10)
CHAPTER 2. PHASE TRANSITION OF DPPC 14<br />
∆H hg includes interactions between head groups, such as dipole interactions, Van der Waals<br />
interactions, interactions between head groups and the water molecules at the hydration<br />
layer and possible hydrogen bonding. ∆H ch is mostly described by the rotational energy<br />
and Van der Waals interaction between carbon chains.<br />
With systematic calorimetric measurements of Diacyl-PhosphatidylCholines of different<br />
chain lengths n = 12, 14, 16, 18 and 20, the contribution <strong>to</strong> the melting enthalpy of the<br />
head group is recovered. It has previous been shown in this lab that both the change in<br />
entropy and enthalpy are linear functions of n. Extrapolating these functions <strong>to</strong> lower<br />
chain lengths than n = 10, the melting displays negative values of enthalpy and entropy,<br />
which is not possible for any melting, see fig. 2.4. These data agree with data found by<br />
others [Mellier1989] [Russel1975].<br />
Fig. 2.4: Melting enthalpy and entropy as functions of chain length n are both linear functions. The<br />
negative contributions for n > 10 stem from change of the head group. Adapted from [Heimburg2007]<br />
Consider the number of C-C bonds the measurements of enthalpy and entropy can be<br />
fitted with respect <strong>to</strong> the number of bonds giving:<br />
∆H n = −51.78 + 2(n − 2) · 3.20 kJ<br />
mol<br />
J<br />
∆S n = −134.38 + 2(n − 2) · 9.05<br />
molK<br />
(2.11)<br />
(2.12)<br />
for which ∆H n and ∆ s n > 0 for n > 10. It would be a mistake <strong>to</strong> conclude that a head<br />
group and lowest part of the hydrocarbon chains don’t undergo changes during the melting<br />
transition. Instead the head groups are able <strong>to</strong> have a more favorable conformation in the<br />
liquid than the initial dense packed solid state. For melting of DPPC eq. (2.11) implies<br />
that all C-C bonds change conformation corresponding <strong>to</strong> a melting enthalpy of 89.6kJ/mol<br />
and the head group has a negative contribution of -51.8kJ/mol. The corresponding changes<br />
of entropy eq. (2.12) are respectively 253.4J/(molK) and -134.38J/(molK). Thus the head<br />
groups change conformation during the melting transition and thus should not be neglected<br />
in hydrated multilayers or in monolayers on aqueous subphases.
CHAPTER 2. PHASE TRANSITION OF DPPC 15<br />
2.3 Influence of TRITC-DHPE on DPPC - Calorimetric<br />
Measurements<br />
The fluorescence marker DHPE-TRITC is later used for visualizing the different phases<br />
of the Langmuir monolayer in amounts of 0.2mol%. It might influence the structure of<br />
the monolayer itself. Deducing the influence of 0.2mol% TRITC-DHPE on the monolayers<br />
itself, i.e. change in MMA and lateral pressure, is hardly done from isotherms of the<br />
monolayers. The role of air-borne particles contaminating the monolayer was observed<br />
<strong>to</strong> exceed eventually deviations caused by TRITC-DHPE. The strictest evidence for an<br />
influence of the fluorophore on a DPPC is if they alter the melting transition of the pure<br />
DPPC. Therefore DSC experiments are carried out with multi lamellar vesicles containing<br />
the same mole ratio used for monolayers. As mentioned above secondary molecules in a<br />
membrane can alter the melting transition.<br />
Materials for DSC scans of MLVs<br />
DPPC was pre-dissolved in ethanol (99% pure) and n-Hexane (5/95 vol%). For the binary<br />
mixtures of DPPC and DHPE-RITC, DHPE-TRITC was first dissolved in ethanol (99%<br />
pure) <strong>to</strong> a concentration of 0.2mM and then mixed with pre-dissolved DPPC in the wanted<br />
ratio <strong>to</strong> a final density of 7.4mg/ml. Solvent was evaporated by heating the sample <strong>to</strong> 35 0 C,<br />
until a thin film of lipids coated the bot<strong>to</strong>m of the sample glass. The sample was then<br />
s<strong>to</strong>red in vacuum over night.<br />
Three scans of the samples were carried out (i) Pure DPPC, (ii) DPPC mixed with<br />
0.2mol% TRITC-DHPE, iii) DPPC mixed with 0.4mol% TRITC-DHPE. Before a scan<br />
the vacuumed sample was hydrated in ultra pure milli-Q water <strong>to</strong> create MLV’s. Four<br />
heat cooling cycles were carried out (23 ↔ 45) o C <strong>to</strong> ensure hydration of the layers in the<br />
vesicles. milli-Q water was used in the reference cell.<br />
Fig. 2.5: Schematic and of the DSC. The reference cell, sample cell and Peltier heaters P, are isolated with<br />
an adiabatic shield. The cells are heated at a constant rate and the temperature difference is kept zero.<br />
During the scan the difference in the heating powers (P s − P r ) is recorded as a function of temperature.<br />
The DSC Method<br />
A DSC is made with a reference cell and a sample cell connected with a thermocouple<br />
each cell has a heater, see fig. 2.5. Starting with the solid lipid sample the essential is <strong>to</strong><br />
keep the temperature difference between the two cells at zero while slowly changing the
CHAPTER 2. PHASE TRANSITION OF DPPC 16<br />
Fig. 2.6: Heat capacity profiles of MLV for pure DPPC and DPPC/TRITC-DHPE mixtures hydrated<br />
with milli-Q water.<br />
temperature at a constant scan rate K/s. By heating both cells at constant rate J/s the<br />
increased heat uptake of the sample relative <strong>to</strong> the reference during the phase transition<br />
is compensated by heating the reference until the temperature difference is zero. This is<br />
recorded as a function of temperature. Dividing the power profile with the scan rate one<br />
obtains the heat uptake of the sample per temperature which defines the heat capacity c p ,<br />
with units of J/K.<br />
2.4 Conclusion on the influence of TRITC-DHPE<br />
Fig. 2.6 provides the measured heat capacity profiles of MLV for pure DPPC and DPPC/TRITC-<br />
DHPE mixtures. For multi lamellar vesicles of DPPC the c p curve is very narrow around<br />
the melting temperature. T m is then easily defined at the maximum of the Cp curve. The<br />
calorimetric scan shows that a pure DPPC (red) has T m = 41.1 which deviates 0.2 o C from<br />
the standard value of 41.3 o C [Heimburg2007] [Bil<strong>to</strong>nen1993]. For the samples containing<br />
0.2mol% and 0.4mol% fluorophore the melting temperatures are respectively 41.14 o C and<br />
41.08 o C. The fluorophore lovers the main transition peak of the c p curve and a negligible<br />
broadening with the amount of fluorophore is indicated. The unusual shoulder of the c p<br />
curve for pure DPPC after the main melting transition should be noted but remains unexplained.<br />
It is then concluded that a use of 0.2mol% TRITC-DHPE has no influence on<br />
a DPPC membrane. This amount will be the upper limit for fluorophore concentrations<br />
used in the monolayer experiments.
Chapter 3<br />
Isothermal Compression of DPPC<br />
<strong>Monolayers</strong> - Phases and Morphology<br />
This chapter gives an introduction <strong>to</strong> monolayers made of DPPC and an understanding<br />
in advance of the experiments reported in Chapter 6 including electrical manipulation<br />
of DPPC monolayers. Relevant thermodynamics of monolayers on aqueous subphases is<br />
mentioned parallel with obtained results of isothermal compression of DPPC monolayers.<br />
This also includes imaging of the monolayers with the use of the fluorescence microscopy<br />
technique.<br />
3.1 Introduction<br />
Ever since the first scientific work with monolayers by Pockels and Rayleigh and the conceptual<br />
development by Langmuir, information of phase transitions and phases of monolayers<br />
have been gained from isotherms. On that basis, a macroscopic understanding<br />
of monolayers based on thermodynamics evolved and is best reviewed by [Gaines1966]<br />
[Langmuir1917]. However a mesoscopic view of monolayers was first accomplished early<br />
in the 80’ using fluorescence dyes only soluble in the liquid phase of the monolayers<br />
[VonTscharner1981] [Losche1983] [Loesche1984]. Improvements of fluorescence microscopy<br />
and fluorescence dyes had demonstrated the power of the technique [Benvegnu1992].<br />
The fluorescence marker TRITC attached <strong>to</strong> DHPE used here is well soluble in the<br />
liquid phase of DPPC and allows visualizing of shapes of non-liquid structures like condensed<br />
domains and gaseous air-pockets if they co-exist with a liquid phase. The influence<br />
of TRITC-DHPE on the lipid-matrix of DPPC is shown in Chapter 2 <strong>to</strong> be negligible.<br />
By compression of a DPPC monolayer from the disordered liquid phase, the lipids condense<br />
in<strong>to</strong> flat structures called domains. For the lipids in the domains the two hydrocarbon<br />
chains are tilted by 30 o from vertical. Only in the solid phase all the hydrocarbon<br />
chains are vertical oriented [Kjaer1987]. Possible domain shapes are reported <strong>to</strong> be bean<br />
shaped or having two or more lobes which overtime transform in<strong>to</strong> the bean shape which<br />
grow during compression until they occupy the whole monolayer and pack in a hexagonal<br />
superlattice [Vanderlick1998]. Phospholipids with smaller head groups like PE’s (phos-<br />
17
CHAPTER 3. ISOTHERMAL COMPRESSION OF DPPC MONOLAYERS 18<br />
Fig. 3.1: . Idealistic isotherm that outlines the different phases of a DPPC monolayer. Drawings represent<br />
the states of the lipids. Inserted images are experimental recordings of the monolayer in that particular<br />
phase with an imitated picture for the pure (G) phase. The liquid expanded phase (LE) appears bright<br />
because it contains fluorescence. Freshly spread DPPC occupies the gaseous phase (G). There are two<br />
regions of coexistence of two phases, (G-LE) and (LE-LC). During compression the monolayer is forced<br />
through following phases: the gaseous phase (G), the gaseous and liquid expanded phases (G-LE), the<br />
liquid expanded phase (LE), liquid expanded and liquid condensed phases (LE-LC), liquid condensed<br />
(LC) and solid phase (S). At a sufficiently critical pressure Π c > 40mN/m the monolayer collapses and<br />
fractures of the layer convolute in<strong>to</strong> secondary three-dimensional structures [Volhardt2006]. Modified from<br />
[Mohwald1999].<br />
phatidyethanolamine) do not show any tilt and the condensed domains formed are all<br />
circular [Mohwald1999].<br />
In equilibrium the shape of a domain is determined by three fac<strong>to</strong>rs. 1) Internal electrostatic<br />
repulsion between the head groups (charged or polar). 2) Molecular chirality of<br />
the lipids. 3) Line tension that minimizes the energy difference between liquid and condensed<br />
phases hence decrease the circumference of the domain [Benvegnu1992]. By using<br />
a Langmuir trough, several intensive and extensive parameters can be varied. The intensive<br />
variables (i.e. independent of the size of the system) usually measured are: Lateral<br />
pressure Π, Temperature T , Surface potential Ψ. The extensive variables (dependent on<br />
size of the system) are for monolayers: No. of the i molecules n i , Area A, Charge or dipole<br />
moment p of the molecules q.<br />
The states of the DPPC monolayers investigated in the thesis are defined by the Π − A<br />
isotherm in which the different phases of a DPPC monolayer are interpreted [Gaines1966].<br />
The widely used names and labels of phases are mentioned for convenience starting at the<br />
highly expanded pure gaseous state. Gaseous phase (G), gaseous and liquid expanded (G-<br />
LE) region, liquid expanded (LE), liquid expanded and liquid condensed (LE-LC) region,
CHAPTER 3. ISOTHERMAL COMPRESSION OF DPPC MONOLAYERS 19<br />
liquid condensed (LC) and solid phase (S). An overview of a isotherm and different phases<br />
and lipid states is sketched in fig. 3.1.<br />
3.2 Thermodynamics of DPPC <strong>Monolayers</strong><br />
Creation of monolayers and the gaseous phase<br />
When spreading a lipid solution on the clean water surface, a wave of expansion is observed.<br />
This is an amazing view because it is not the one of a s<strong>to</strong>ne thrown in<strong>to</strong> water. The wave<br />
of expansion arise because each lipid tends <strong>to</strong> order itself with the hydrophilic head group<br />
<strong>to</strong>ward the water and the hydrophobic carbon chains pointing away. This massive ordering<br />
gives rise <strong>to</strong> a wave with direction of expansion <strong>to</strong>ward the clean water surface. The two<br />
dimensional lateral pressure of the solvent spread then depends on the art of lipid spread<br />
and the area à of the water surface available [Langmuir1917].<br />
To ensure the state of the newly spread monolayer is in the (G-LE) region, the molecule<br />
dimensions and trough dimensions should be considered. Neglecting the bend of the water<br />
surface at the trough edges the surface area available in this case is à = 0.15m × 0.05m<br />
= 0.0075m 2 . By assuming the mean molecular area of DPPC <strong>to</strong> be 50Å 2 , an amount of<br />
8 · 10 −9 mole lipids spread requires a surface area of 0.0024m 2 . This is 1 3Ã and results in a<br />
mean molecular area of spreading point 150Å 2 well defined in the (G-LE) region.<br />
Fig. 3.2: Coexisting of gaseous (G) phase appearing (dark) and liquid expanded (LE) phase (bright)<br />
in a DPPC monolayer. a. and b. are recorded at a MMA of 117Å 2 at different positions. c. During<br />
compression the hexagonal gaseous domains shrinks in size and circular shapes are formed. At a nondefined<br />
MMA a phase boundary between (G) and (LE) can be observed. Conditions: Scale bar =<br />
20µm, Mean temperature 22.7 o C, 0.2mol% TRITC-DHPE, Compression Rate 2Å 2 /molecule/min.<br />
Coexistence of the gaseous and liquid expanded phases in the (G-LE) region is illustrated<br />
in fig. 3.2 at a mean molecular area of 117Å 2 . The gaseous (G) phase appears<br />
dark containing no fluorophore and the liquid expanded (LE) phase is bight because the<br />
solubility of the fluorophore in this phase is high. During compression the gas-pockets<br />
shrink and disappear at the transition <strong>to</strong> the pure (LE) phase. A phase boundary of the<br />
two phases is observed upon further compression. This gaseous phase is not investigated<br />
further in this work.
CHAPTER 3. ISOTHERMAL COMPRESSION OF DPPC MONOLAYERS 20<br />
The solvent itself and the concentration of the lipids in the solvent have individual<br />
influences on the (Π − A) isotherm. A lipid concentration around or smaller than 1mM<br />
is recommended [Gaines1966] [Mohwald1998]. The solvent used for spreading has <strong>to</strong> be<br />
chosen with care <strong>to</strong> ensure the surface tension of water γ 0 is higher than both that of the<br />
solvent γ solvent and the interfacial tension between water and solvent γ solvent,0 . This satisfy<br />
this relation <strong>to</strong> be positive:<br />
γ 0 − (γ solvent + γ solvent,0 ) (3.1)<br />
If this is negative the solvent will not spread and unwanted<br />
lipid structures forms. By this and the importance<br />
of fast evaporation of the solvent and the requirement<br />
of insolubility with the aqueous subphase, chloroform<br />
is often used. Hoverer the use of n-Hexane as solvent<br />
give fine results and it is less health damaging. For<br />
these reasons it is used as the standard solvent for DPPC<br />
monolayer experiments in this work. Physical properties<br />
for different candidates of solvents are listed in fig. 3.3.<br />
Isothermal compression<br />
The lateral pressure Π of the monolayer is defined as<br />
the difference between the surface tensions of water γ 0<br />
and the surface tension of monolayer-water γ.<br />
Fig. 3.3: Solvents his<strong>to</strong>rically used <strong>to</strong><br />
perform monolayers. Low solubility in<br />
water and low boiling point are highly<br />
wanted properties for obvious reasons<br />
Well discussed in [Gaines1966].<br />
Π = γ o − γ (3.2)<br />
Π increase during compression because of the reduction<br />
of γ due <strong>to</strong> increased repulsion between the lipids.<br />
The lateral pressure is detected as the drag on a probe<br />
that hangs from a piezo crystal which responds the lateral<br />
pressure with a voltage difference. This electronically<br />
film balance has an accuracy of 0.1mN/m and<br />
had <strong>to</strong> be calibrated, usually with the known value for<br />
pure water γ 0 = 72.8mN/m at 20 o C or a known difference in weights.<br />
Fig. 3.4: Principle of a Langmuir trough<br />
with a balance made of a probe and a<br />
piezo crystal that detects the surface tension<br />
and convert this in<strong>to</strong> a voltage difference.<br />
Isothermal compression increases the<br />
surface pressure by reducing the available<br />
surface area. (not in scale).<br />
The change in the free energy dF of a DPPC monolayer with an applied electrical field<br />
E having n lipids with an dipole moment p is given as:<br />
dF = −SdT + µdn − P dV − ΠdA + pdE (3.3)<br />
This is quickly reduced for a DPPC monolayer with the use of eq. (3.2) <strong>to</strong>:<br />
( ) dF<br />
Π = −<br />
dA<br />
T,n,V,q,E<br />
(3.4)<br />
which defines the Π-A isotherm. Upon compression, with these conditions, the monolayer<br />
undergoes a first-order phase transition from the (LE) <strong>to</strong> the (LC) phase, corresponding <strong>to</strong>
CHAPTER 3. ISOTHERMAL COMPRESSION OF DPPC MONOLAYERS 21<br />
a chain ordering [Pink1982]. The lateral pressure Π is defined for equilibrated states during<br />
the compression but experimental practice implies that this is impossible. In addition, huge<br />
experimental experience is needed <strong>to</strong> have n nearly constant. Used materials and further<br />
considerations of the trough are referred <strong>to</strong> Chapter 5.<br />
The Π−A isotherm is plotted as mN/m versus the mean area of one molecule Å 2 /molecule.<br />
In fig. 3.5 isotherms are obtained with the setup at different temperatures in the room<br />
temperature regime with a subphase of 150mM NaCl. The plateau defining the (LE-LC)<br />
coexisting region is chiefly observed. The (LE-LC) region shifts <strong>to</strong> higher lateral pressure<br />
and its width decreases with higher temperatures. At a temperature of 20 o C the boundary<br />
coordinates (MMA,Π) of the coexisting phases are approximately (82Å/molecule, 5mN/m)<br />
and (55Å/molecule, 10mN/m). It is reported in the literature that the (LE-LC) region for<br />
Fig. 3.5: Isotherms of individual DPPC monolayers spread on a 150mM sodium chloride subphase are obtained<br />
at different room temperatures. The (LE-LLC) phase of interest is expressed at these temperatures.<br />
At a temperature of 20 o C the boundary coordinates (MMA, Π) of the coexisting phase are approximately<br />
(82Å/molecule, 5mN/m) and (55Å/molecule, 10mN/m). Conditions: Scale bar = 20µm, subphase of<br />
150mM NaCl, 0.2mol% TRITC-DHPE, Compression Rate 1.5Å 2 /molecule/min, temperatures was stabilized<br />
with a heat bath.<br />
DPPC monolayers shrink for increased temperatures and vanish at a critical temperature<br />
of T c ≈ .40 o C [Mouritsen2007].<br />
The lateral compressibility κ T of the monolayer is a function of molecular area A and<br />
lateral pressure Π and is defined as:<br />
κ T = 1 ( ) dA<br />
(3.5)<br />
A dΠ<br />
In the (LE-LC) region a small change in lateral pressure results in a large change in the<br />
area of the monolayer relatively more than for the other phases. Thus, the compressibility
CHAPTER 3. ISOTHERMAL COMPRESSION OF DPPC MONOLAYERS 22<br />
of a DPPC monolayer has a maximum in the (LE-LC) region where both liquid lipids and<br />
condensed domains are presented [Heimburg2007].<br />
3.3 Images of the (LE-LC) coexistence region of DPPC<br />
<strong>Monolayers</strong><br />
In order <strong>to</strong> achieve a well illustrated overview of the formation processes of condensed<br />
DPPC domains several experiments were carried out with the normal experimental conditions<br />
mentioned above and described in Chapter 5. The point of domain formation is<br />
Fig. 3.6: Formation and growth of domains in the (LE-LC) region during an isothermal compression.<br />
Domains appear dark while the fluorophore soluble liquid phase appears bright. a.-h. Represents the<br />
beginning and end of the (LE-LC) region having the first observable domains at the transition about<br />
80Å 2 /molecule. a. The diameter of the hardly observable micro domains are ≈ 1µm. The shape of a<br />
domain mainly develops as a bean like shape. i. is recorded at the transition <strong>to</strong> the (LC) phase where the<br />
picture gets blurred. Conditions: Scalebar = 20µm, Mean temperature 21 o C, 0.2mol% TRITC-DHPE,<br />
Compression Rate 1Å 2 /molecule/min.<br />
found <strong>to</strong> be between the (LE) phase and the (LE-LC) region at mean molecular areas
CHAPTER 3. ISOTHERMAL COMPRESSION OF DPPC MONOLAYERS 23<br />
slightly below the kink of the isotherm. As a result of slow compression the domains develops<br />
nearly equal in size and shape until the end of the (LE-LC) region, see fig. 3.6.<br />
The domain shape mainly develops as a bean like shape but round or domains with lobes<br />
are also observed. Lobed domains hinder a hexagonal packing of the domains in the (LC)<br />
phase but dense packing is always observed. The electrostatic repulsion between domains<br />
actually facilitates such packing. Only at high pressures the lattice structure brakes down<br />
and the monolayer enters the solid phase (S) in which structures are hardly observable<br />
because of the fluorophore do not participate in that phase of the monolayer.<br />
3.4 Conclusion<br />
Isotherms for different temperatures of DPPC monolayers on a subphase of 150mM NaCl<br />
are obtained expressing phases and transitions <strong>to</strong> a fine degree. This includes transitions<br />
from (G) <strong>to</strong> (LE) and from (LE) <strong>to</strong> (LC) but the transition in<strong>to</strong> (S) hardly determined<br />
from the isotherms alone. The dependency of the monolayer on temperature is found <strong>to</strong><br />
be comparable with literature.<br />
The method of fluorescence microscopy used with TRITC-DHPE is well suitable for<br />
obtaining high resolution images of DPPC monolayers except in the (LC) and (S) phases.<br />
Shapes and edges of domains are clarified <strong>to</strong> an accuracy ≈ 1µm similar <strong>to</strong> the Rayleigh<br />
resolution of the optics derived in Chapter 5.<br />
It is found that the rate of compression influences the domain shape, domain size<br />
and distribution of the domains in the monolayer. The best results are achieved with<br />
slow compression rates. A compression rate of 1.5Å 2 /molecule/min. turns out <strong>to</strong> give<br />
reproducible results and is selected as an upper limit for the experiments with applied<br />
electric gradient field presented in Chapter 6. The rest of the thesis concentrates on<br />
electrodynamic properties of DPPC monolayers interrupted by materials and methods in<br />
Chapter 5.
Chapter 4<br />
The Polar Headgroup of DPPC - Origin of<br />
<strong>Membrane</strong> Surface Potential<br />
This chapter treats potentials across membranes with an emphasize on the dipole potential<br />
of DPPC monolayers and connect this <strong>to</strong> the phases of such monolayers.<br />
Biological cell membranes in aqueous environment are<br />
from nature a compound of lipids and proteins with lipids<br />
as the basis assembled in two co-planar leaflets. Most of<br />
the membrane lipids are amphiphilic phospholipids with hydrophilic<br />
head groups, charged or polar, and hydrophobic carbon<br />
chains directed in<strong>to</strong> the interior of the membrane. This<br />
minimizes the contact of the carbon chains with ions, water<br />
and other polar molecules in the aqueous environment. Ion<br />
concentrations on both sides of the biological membrane and<br />
the high densities of charged and polar head groups, separated<br />
by a membrane thickness of commonly 5 nm, produce<br />
high electrostatic potentials across the membrane. In the literature<br />
[Brockman1994] [Clarke2001] the potentials are often<br />
named as:<br />
1) Transmembrane potential Ψ C generated by ion gradients<br />
across the membrane.<br />
2) Surface potential Ψ Q arising from fixed charges at the<br />
lipid head groups and membrane proteins.<br />
3) Dipole potential Ψ D of the dipoles at the lipid-water<br />
interface.<br />
These are sketched for a bilayer between two aqueous media,<br />
fig. 4.1:<br />
Fig. 4.1: Sketch of potential gradients<br />
across a phospholipid bilayer.<br />
The transmembrane potential<br />
Ψ C is caused by different concentrations<br />
of ions on each side<br />
of the membrane. Charged head<br />
groups define the surface potential<br />
Ψ Q and dipole potential Ψ D<br />
arises from dipoles present in the<br />
bilayer.<br />
The transmembrane potential Ψ C is of magnitude 10 - 100 mV in biological membranes<br />
which facilitates accumulation of proteins on the membrane surface [Kroon1989]. It also<br />
causes transmembrane movement of ions down their concentration gradients e.g. ions like<br />
24
CHAPTER 4. ORIGIN OF MEMBRANE SURFACE POTENTIAL 25<br />
Na +1 , K +1 , Cl −1 and Ca +2 . An uncountable number of experiments with ion gradients or<br />
with a controlled external potential applied across biological membranes have suggested<br />
such transport of ions gated through ion selective channels in the membranes. The widely<br />
used Patch-Clamp method and single channel analysis in such experiments was developed<br />
in 1976 by Neher and Sackmann for which they got the Nobel prize [Neher1976]. However<br />
ion transport similar <strong>to</strong> the single channel events is reported <strong>to</strong> occur across artificial<br />
membranes only consisting of the phospholipid DSPC. Maximum of the ion conduction<br />
occurs in the melting regime of DSPC (T m = 50 ◦ C) [An<strong>to</strong>nov1980].<br />
The surface potential Ψ Q of a membrane consisting of 40% negatively charged lipids in<br />
a biological environment of a ionic strength of 150mM NaCl has a magnitude about -50<br />
<strong>to</strong> -100mV [Heimburg2007]. The surface potential decays exponentially with the distance<br />
from the charged surface and can further be reduced by binding of ions [Brockman1994]<br />
[Heimburg2007]. Research on the surface potential of both natural and artificial bilayers<br />
has mainly focused on its ability <strong>to</strong> bind ions, proteins and may regulate enzyme activities<br />
[Kroon1989].<br />
Since DPPC monolayers are used in this work the dipole potential is treated from now.<br />
Dipole potentials Ψ D of membranes or monolayers arise from the polar head groups on<br />
the lipids like the phospholipids PE’s, PC’s, PS’s and Sphingomyelin. For these lipids the<br />
dipole moment p is oriented from the negatively charged phosphate <strong>to</strong> a positive charged<br />
group directed away from the membrane surface. Ψ D can be measured with the black lipid<br />
membrane technique in which two small containers with buffer solution are separated only<br />
with an artificial membrane. The basis in such Ψ D measurement is the rate-constants of<br />
transporting large hydrophobic anions and cations across the membrane. It appears that<br />
hydrophobic anions are transported across membranes, of typical phospholipids, at rate<br />
constants faster than the equivalent cations. Thus, in the center of the membrane Ψ D must<br />
assume positive values relative <strong>to</strong> the aqueous phase which for DPPC bilayers Ψ D varies<br />
between 200mV and 280mV [Flewelling1986].<br />
Regarding monolayers, the terms Ψ D and Ψ Q are<br />
mixed in<strong>to</strong> the collective term ”surface potential” and<br />
what is actually measured depends on the monolayer<br />
composition. Measurements of Ψ D or Ψ Q requires an<br />
electrode in the aqueous subphase and a metal plate in<br />
the air above the monolayer. Without a monolayer the<br />
potential jumps across the clean water-air interface ψ w<br />
and the potential jumps across the air-metal plate interface<br />
ψ met . Connection of the metal plates gives the<br />
interfacial potential ψ met − ψ w = Φ. Thus the reference<br />
point, often the water sheet just below the air-water interface,<br />
determines the sign of the ”surface potential”.<br />
An often used technique is the vibrating plate. A<br />
plate above the monolayer excecutes controlled oscillations<br />
which generates an AC current in a circuit because<br />
of the potential Φ. By applying a potential Φ ′ of oppo-<br />
Fig. 4.2: The change of the surface potential<br />
V by forming a monolayer can<br />
be measured with the condenser method.<br />
Periodic vertical oscillation of the plate<br />
above the monolayer induce a AC current<br />
I(t) which is depressed with a potential<br />
V ′ <strong>to</strong> I(t) = 0 at which point V ′<br />
equals the membrane potential.
CHAPTER 4. ORIGIN OF MEMBRANE SURFACE POTENTIAL 26<br />
site sign of the potential Φ <strong>to</strong> the circuit, the AC current is reduced <strong>to</strong> zero. At this point, Φ<br />
is given as Φ ′ . A calibration by setting the potential <strong>to</strong> zero for the clean water-air interface<br />
(ψ met = ψ w ) gives the surface potential defined as the difference between the clean water<br />
ψ w and a surface with added lipids ψ w+l is ψ w+l − ψ w = ψ w+l − ψ met . A contribution of<br />
ordered water molecules is subtracted by such a calibration [Brockman1994] [Clarke2001].<br />
It has been shown that the ordered surface water that causes ψ w , is estimated <strong>to</strong> be 100mV<br />
[Palush2002] [Parfenyuk2002]. The role of water ordering in the head group region is not<br />
unders<strong>to</strong>od. Attention has <strong>to</strong> be paid when comparing dipole and surface potentials of<br />
a bilayer <strong>to</strong> monolayer since the potential of a monolayer highly depends on the density<br />
of the lipids. Normally one compares measured values of the potentials corresponding <strong>to</strong><br />
the mean molecular area of the lipids in the monolayer [Brockman1994]. For a DPPC<br />
monolayer the dipole potential at a mean molecular area of 49Å 2 is reported <strong>to</strong> be 500mV<br />
<strong>to</strong> 520mV [Nakahara2005] [Shapovalov1998] [Vogel1988].<br />
Fig. 4.3: Possible conformational changes of the choline head group on a DPPC molecule. In contact<br />
with a water surface the hydrophilic choline will the conformation (middle) since only one rotation enables<br />
different orientations. Adapted from [Hauser1981]<br />
4.1 The Head Group of DPPC<br />
From x-ray and neutron diffraction studies of phospholipid multilayers the orientation of<br />
a polar headgroups remain approximately parallel oriented <strong>to</strong> the layer interfaces both in<br />
the gel and liquid state for different degrees of hydration. Both DMPC and DPPC shows<br />
such a behavior [Franks1976] [Hauser1981]. For a DPPC monolayer on aqueous subphase<br />
a constant orientation of the headgroups is not the case. However the x-ray studies give<br />
information of distances and spaces. The distance between the phosphate and the nitrogen<br />
a<strong>to</strong>ms in the choline group is found <strong>to</strong> be |P...N| = 4.3 - 4.5Å and. The distance is then
CHAPTER 4. ORIGIN OF MEMBRANE SURFACE POTENTIAL 27<br />
assumed <strong>to</strong> be the same within DPPC giving rise <strong>to</strong> a dipole moments of DMPC and<br />
DPPC defined as pointing from (-) <strong>to</strong> (+).<br />
The hydrophilic nature f the head groups in a<br />
DPPC monolayer ensures that the polar headgroups<br />
are oriented <strong>to</strong>ward the subphase. The actual orientation<br />
of the choline group and the glycerol backbone<br />
in the water depends on the phase of the lipids but<br />
a satisfying description is not available. Possible conformations<br />
of the headgroup of a DPPC molecule are<br />
ginevn in fig. 4.3. The most probable configuration<br />
allows the headgroup <strong>to</strong> orient freely on a cone by rotation<br />
of one C-C bond [Hauser1981].<br />
Combined measurements of the Π − A isotherm<br />
simultaneously with surface potential enable a calculation<br />
of the average dipole moment normal p ⊥ per<br />
molecular in a media with a relative permittivity ɛ. For<br />
Fig. 4.4: DPPC isotherm (a) and dipole<br />
a layer of homogeneously distributed polar molecules<br />
potential (b) at 21 o C for different concentrations<br />
of sodium chloride. Adapted from<br />
on a 2D lattice, the surface potential Ψ D is described<br />
with the Helmholtz equation:<br />
[Shapovalov1998].<br />
Ψ D =<br />
p ⊥<br />
ɛ 0 ɛA<br />
(4.1)<br />
A measured value of the dipole potential of a monolayer is an average of all contributions<br />
in the detected area. Using e.q. (4.1) <strong>to</strong> calculate the dipole moment from a measured value<br />
of the dipole potential gives an average of dipole components normal <strong>to</strong> the monolayer.<br />
For a DPPC monolayer compressed <strong>to</strong> a mean molecular area of 49Å 2 the surface<br />
potential assumes ≈ 500mV. If it is assumed that the dipole moment is located above the<br />
water surface in the air (ɛ = 1) (used by many authors, see fig. 4.5) the Helmholtz equation<br />
yields p ⊥ = 4.3 · 10 −30 Cm = 0.64 Debye 1 .<br />
If instead, the dipole moment is exclusively ascribed <strong>to</strong> the choline head group embedded<br />
in water (ɛ = 80) one gets p ⊥ = 51.2 Debye.<br />
In relation <strong>to</strong> the large distance between the phosphate and nitrogen, the dipole moment<br />
p of two charges +q and −q spanned by a distance d = 4.2Å is calculated. For the charges<br />
it is assumed | + q| = | − q| = e = 1.6 · 10 −19 C. Thus, the dipole moment of the choline<br />
group is:<br />
p = qd = 6.7 · 10 −29 Cm = 20.1Debye (4.2)<br />
Consider a monolayer or bilayer made of DPPC in a state of 49Å 2 /molecule surrounded<br />
by pure disordered water with ɛ = 80. In the case that the dipoles are oriented normal <strong>to</strong><br />
the surface one calculates the dipole potential , by using p = 20.1Debye and eq. (4.1) <strong>to</strong><br />
Ψ D = 192mV similar <strong>to</strong> what is measured for bilayers (200 - 280mV) [Flewelling1986].<br />
1 1Debye = 3.335·10 −30 C −1 m −1 , ɛ 0 = 8.85C 2 N −1 m −2 .
CHAPTER 4. ORIGIN OF MEMBRANE SURFACE POTENTIAL 28<br />
The contributions <strong>to</strong> the dipole potential from the two polar C=O groups on the headgroup<br />
are not estimated here. A more precise calculation of the dipole moment of the head<br />
group should be based on quantum mechanics and calculation of the polarization due <strong>to</strong><br />
electron distributions of the nitrogen and phosphate a<strong>to</strong>ms.<br />
4.2 Influence of Temperature and sodium chloride<br />
With parallel measurements of Ψ D and Π as a function of<br />
molecular area A, phases of the monolayer can be correlated<br />
with changes in the surface potential. For DPPC,<br />
Ψ D has a rather exotic behavior which not obeys a simple<br />
reduction of the molecular area A, Ψ D ∝ 1/A. It is<br />
instead obvious <strong>to</strong> state that each phase of the monolayer<br />
the lipids provides a particular contribution <strong>to</strong> the<br />
dipole potential. At room temperature Ψ D is fluctuating<br />
around zero in the (G) phase but at the collapses of this<br />
phase at the formation of the continuous (LE) phase, a<br />
dramatic increase in Ψ D from 0 <strong>to</strong> 310mV is observed but<br />
in the pure (LE) phase the potential raises constantly <strong>to</strong><br />
about 350mV. From the middle of the coexistence (LE-<br />
LC) region the constant increase is replaced by steeper<br />
ending at 500mV at the transition <strong>to</strong> the (LC) phase<br />
[Discher2002] [Vogel1988].<br />
One should expect that a subphase containing<br />
sodium chloride reduces the dipole potential due <strong>to</strong> a<br />
shielding of the phosphate and amino group of DPPC.<br />
This is reported (fig. 4.4) not <strong>to</strong> be the case. Instead,<br />
an ionic strength of 100mM NaCl only shifts the<br />
dramatic increase of the dipole potential at the formation<br />
of the (LE) phase <strong>to</strong>ward a higher molecular area<br />
[Nakahara2005].<br />
The width of the (LE) phase and the (LE-LC) region<br />
is known <strong>to</strong> depend on the temperature of the monolayer.<br />
With a subphase of 150mM NaCl, it is shown in fig. 4.5<br />
by [Shapovalov1998], that only at temperatures near the<br />
critical (T c = 40 o C) a decrease of the dipole potential is<br />
observed. The dramatic increase at the beginning of the<br />
(LE) phase remains but is broadened. The absence of<br />
the (LE-LC) region and the constant increase in Ψ D until<br />
the monolayer collapses, then reflects a characteristic<br />
behavior of the dipole potential in the (LE) phase.<br />
Fig. 4.5: DPPC isotherm (a) and<br />
dipole potential (b) at different temperatures<br />
with a 150mM NaCl subphase. (c)<br />
Dipole moment normal <strong>to</strong> the monolayer<br />
µ⊥ calculated using eq. (4.1). Adapted<br />
from [Nakahara2005]
CHAPTER 4. ORIGIN OF MEMBRANE SURFACE POTENTIAL 29<br />
It is then obvious <strong>to</strong> ascribe the enhanced increase of<br />
the dipole potential in the coexistence region at room temperature, <strong>to</strong> the <strong>to</strong>tal area of<br />
domains and conclude that domains have a higher dipole density that the (LE) phase.<br />
4.3 Other Approaches<br />
The discussion between scientist regarding the interpretation of p ⊥ from dipole potential<br />
measurements on monolayers is ongoing. It will not be preceded here but the ideas are<br />
mentioned. The main concerns are the contributions terminal methyl groups of the hydrocarbon<br />
chains, the polar head groups and their interplay with water. Common for the<br />
models of DPPC is the line of arguments which begins with an underestimate of the polar<br />
choline groups since the positive amino groups stick deep in<strong>to</strong> water of high permittivity.<br />
Followed by this is an emphasized contribution of the terminal methyl groups on the carbon<br />
chains, first suggested by [Davies1955]. This has been approached by a three-layer<br />
model [Demchak1974] by assigning a relative permittivity ɛ n and a dipole contribution p ⊥n<br />
<strong>to</strong> each layer. The subscript denotes the 1. subphase, 2. head groups, 3. Hydrophobic<br />
carbon chains. The three contributions are added (due <strong>to</strong> additivity of dipoles) such that<br />
a <strong>to</strong>tal dipole potential is calculated with an extended Helmholtz equation:<br />
Ψ D = 1 [<br />
p⊥1<br />
+ p ⊥2<br />
+ p ]<br />
⊥3<br />
(4.3)<br />
Aɛ 0 ɛ 1 ɛ 2 ɛ 3<br />
With this model [Taylor2000] calculated, for DPPC, the dipole moments for a methyl<br />
group and a head group <strong>to</strong> be 0.236Debye and 0.316Debye. A simplified two-layer model<br />
by [Vogel1988] in which the headgroups and the subphase contributions are lumped <strong>to</strong>gether<br />
in one term, isolates the methyl term for further calculations. By this model the<br />
contribution from the terminal methyl groups of DPPC was calculated <strong>to</strong> be 6/7 of the<br />
dipole moment and 1/7 was ascribed <strong>to</strong> the head groups and subphase. This is widely<br />
discussed in [Brockman1994] [Taylor2000] [Clarke2001].<br />
Interpretation of the Brownian motions of domains caused by the mutual repulsion in<br />
DMPC monolayers, [McConnell1990] [McConnell1993] estimate a differences of the normal<br />
dipole components of domains and the surrounding liquid phase <strong>to</strong> be 260mV.<br />
By investigating the orientation of a fluorescent probe embedded in a DPPC monolayer,<br />
three different orientations of the headgroup are identified. Each corresponding <strong>to</strong> the three<br />
regions (LE-LC)-(LC)-(S) with the changes at the phase transitions [Teissie1994]. Then<br />
a combination of these results with the area covered by domains, let them <strong>to</strong> propurse<br />
that domains in the (LE-LC) region have cores of lipids in the solid (S) phase and a<br />
circumference o lipids in the (LC) phase.<br />
B<br />
NOTICE:<br />
Without having discussed the layer-models in detail it can be stated that underestimations<br />
of the intrinsic large dipole moments of the headgroup and the ordering of water, leads <strong>to</strong><br />
overestimation of the terminal methyl groups. The rough calculation of the intrinsic dipole
CHAPTER 4. ORIGIN OF MEMBRANE SURFACE POTENTIAL 30<br />
moment of the choline group (≈ 20.2Debye) yields a dipole potential of 200mV which is<br />
below the reported 500mV for a DPPC monolayer. It is plausible that detailed knowledge<br />
of charge distribution in the head group and structured water including permittivity of<br />
water would result in dipole potentials closer <strong>to</strong> the measured values.<br />
Sodium chloride will be used <strong>to</strong> increase the conductivity of the subphase in the experimental<br />
work with electric fields. Relative <strong>to</strong> a pure subphase, the Π − A isotherm is<br />
more or less unchanged by using a subphase of 100mM NaCl. The increase of the dipole<br />
potential at the formation of the (LE) phase is shifted <strong>to</strong>ward the gaseous phase with<br />
≈ 10Å 2 /molecule [Shapovalov1998]. This concentration of sodium chloride, however has<br />
no influence on the coexistence region or the dipole potential and the dipole moment of<br />
the lipid domains.<br />
It can be stated that domains in the coexistence region has a higher dipole moment<br />
than the surrounding liquid phase.
CHAPTER 4. ORIGIN OF MEMBRANE SURFACE POTENTIAL 31<br />
.l-
Chapter 5<br />
Materials and Methods<br />
Combination of Fluorescence Microscopy<br />
and <strong>Applied</strong> <strong>Electric</strong> <strong>Field</strong><br />
Description and considerations of the used combined setup are given; Langmuir trough,<br />
fluorescence technique, optics, electrical stimulation and setup.<br />
5.1 Langmuir Trough for Isothermal Compression<br />
The same Langmuir trough used for both normal isothermal compression and electric field<br />
experiments is shortly described in this section focusing on the experimental conditions for<br />
isothermal compression. The results of isothermal compression of DPPC monolayers are<br />
presented in Chapter 3<br />
Fig. 5.1: Langmuir trough used for both normal isothermal compression of DPPC monolayers and for<br />
experiments with an applied electric gradient field. The trough is described in the text above.<br />
The Langmuir trough used was made of teflon containing 20% glassfiber with inner<br />
dimensions of 20cm x 5cm x 0.5cm, fig. 5.1. The glassfiber made the trough less flexible<br />
and the two barriers used for compression were made of Delrin which is less hydrophobic<br />
than glass-teflon. Their two contact angles of the water are respectively 45 o and 90 o<br />
32
CHAPTER 5. MATERIALS AND METHODS 33<br />
[Hardy2006]. The barriers slide easily on the cliff of the trough and sticks 1mm in<strong>to</strong> the<br />
subphase. Four peaces of teflon coated tape are placed on both sides near the end of the<br />
barriers and in contact with the trough and the subphase. This avoids leakages of lipids<br />
in<strong>to</strong> the tiny space between barriers and trough and under the barriers. To allow optical focusing<br />
on the water-monolayer interface the trough was equiped with a cover glass mounted<br />
on a ring of stainles steel inserted in<strong>to</strong> the bot<strong>to</strong>m of the trough. A claning procedure and<br />
a method for gluing the coverglass on<strong>to</strong> the steel ring are provided in Appendix A.3 and A.4.<br />
Materials used in this work<br />
Symbol Description Data<br />
Camera EMCCD Electron Multiplying Change Coupled Device chip array 512 x 512<br />
Delrin<br />
Polyacetal Engineering Polymers, Trough barriers<br />
DPPC (1.) 1,2-dipalmi<strong>to</strong>yl-sn-glycero-3-phosphocholine 734.05g/mole<br />
Ethanol ethanol lipid solvent 99.9% (pure)<br />
Hexane<br />
n-hexane lipid-ethanol solvent<br />
Teflon<br />
Poly(tetrafluoroethene), Trough<br />
TRITC-DHPE (2.) n-(6-tetramethylrhodaminethiocarbamoyl)- 1236.67g/mole<br />
1,2-dihexadecanoyl-sn-glycero-<br />
3-phosphoethanolamine, triethylammonium salt<br />
Wire of 40 Zr (3.) Zirconium. diameter 0.127mm ρ = 421nΩm<br />
Plate of 78 Pt Platinum plate 0.2mm x 5mm x 10mm ρ = 105nΩm<br />
Power supply DC for electric field 0 - 2500V<br />
Power Switch (4.) fast push-pull of the electric potential 0-3000V τ = 10 −9 sec.<br />
(1.) Avanti Polar <strong>Lipid</strong>s, Al. USA<br />
(2.) Invitrogen, Cal. USA<br />
(3.) FOOTE Mineral Co., Phila. USA<br />
(4.) Behlke, Kronberg, Germany
CHAPTER 5. MATERIALS AND METHODS 34<br />
Materials and Method for <strong>Monolayers</strong><br />
The lipid monolyers were made from DPPC (1,2-dipalmi<strong>to</strong>yl-sn-glycero-3-phosphocholine)<br />
dissolved in n-Hexane/Ethanol (95/5 vol.%) at a concentration of 0.5mg/ml or sometimes<br />
0.7mg/ml with the relative amount of the fluorophore (TRITC-DHPE 0.1 <strong>to</strong> o.2 mol%).<br />
The lipid-fluorophore solution was spread from a pipette in droplets of 0.5µl <strong>to</strong> 0.7µl on<br />
the subphsase containing 150mM NaCl originately disolved in pure milli-Q water, 18.2 MΩ<br />
restitivity. All experiments were carried out at room temperature, 20 − 24 o C. A heatbath<br />
was used in the individual experiments <strong>to</strong> stabilize the temprerature in combination<br />
with a thermocouple mounted at the trough bench inside the cover box. Compression rate<br />
were usually 0.8Å 2 /molecule/min. or 1.5Å 2 /molecule/min. Experimental conditions will<br />
shortly be mentioned while the results are pressented.<br />
1mg TRITC-DPHE was dissolved in 4ml ethanol (99.9%) in its plastic tube and removed<br />
<strong>to</strong> a clean tube over 4 trials of each 1ml ethanol <strong>to</strong> have a final density of 0.25mg/ml i.e.<br />
a concentration of 0.2mM.<br />
5.2 Fluorescence and Optics<br />
This powerful technique applied <strong>to</strong> monolayers can<br />
be used <strong>to</strong> study morphology, single particle tracking,<br />
diffusion and a warty of catalyzed surface processes.<br />
The development of the technique <strong>to</strong>ok the<br />
beginning in 1981 with the first combined Langmuir<br />
trough and epi-fluorescence microscope and uncovered<br />
the mysterious behavior of phospholipid films<br />
at air-water interface, [VonTscharner1981]. The<br />
revolution in the field came with the construction<br />
of the first inverted fluorescence microscope 3 years<br />
later and serious monolayer studies now relie on this<br />
idea [Loesche1984]. With the wide field fluorescence<br />
Fig. 5.2: TRITC-DHPE fluorescent molecule<br />
soluble in liquid (LE) phase and has low<br />
solubility in water. Wavelength of max.<br />
excitation λ ex = 540nm = 9.7·10 −19 J<br />
and emission λ em = 580nm = 9.1·10 −19 J.<br />
[www.invitrogen.com].<br />
microscopy (WFM) setup used in this work, high resolution images of the morphology of<br />
DPPC monolayers can be obtained and the important feature , additional instruments can<br />
be applied from above.<br />
TRITC the Fluorophore used<br />
The fluorophore used in this work is TRITC which is a derivative of the often used Rhodamine.<br />
The fluorophore is contained in the TRITC molecule which is attached <strong>to</strong> the<br />
ethanolamoine headgroup of the phospholipid DHPE, fig. 5.2. DHPE has 2 hydrocarbon<br />
chains of each 16 C a<strong>to</strong>m, just as DPPC. It was chosen due <strong>to</strong> its ability <strong>to</strong> fit in<strong>to</strong><br />
the lipid matrix of DPPC molecules forming the monolayer. The relatively large TRITC<br />
molecule does not complicate the lipid matrix if it is used in small amounts, normally 0.1 -<br />
0.2mol% and has low a solubility in water, mostly because of the hydrophoic hydrocarbon
CHAPTER 5. MATERIALS AND METHODS 35<br />
chains. It is only soluble in the liquid expandedn phase of the monolayer, but not in the gel<br />
and gaseous phases. This means that its fluorescence function is normal in the liquid phase.<br />
Fig. 5.3: Overview of the beam line of the wide field fluorescence microscope and the Langmuir trough<br />
mounted in the trough bench. Components are used as described in the text. Torus laser, beam expander,<br />
Lenses (L1) (L2) (L3), Dichroic mirror, Langmuir trough, Acrylic cover box, Flip mirror, EMCCD camera.<br />
The information path for this combined setup is sketched in fig. 5.6.<br />
Fluorescence and Related Problems<br />
I general fluorescence occur when a molecule relaxes <strong>to</strong> its ground state S 0 emitting a<br />
pho<strong>to</strong>n after being excited <strong>to</strong> its first electronically excitation singlet state S 1 . The excitation<br />
happens if the fluorophore absorbs an incoming pho<strong>to</strong>n with the required energy i.e.<br />
wavelength. Equation 5.1 relates the energy and wavelength of a pho<strong>to</strong>n.<br />
E = h · c<br />
λ<br />
(5.1)<br />
h is the Planck constant 6.6 · 10 −34 Js and c the speed of light in vacuum 3 · 10 8 m/s. Due<br />
<strong>to</strong> the molecular structure of TRITC the energy levels S 0 and S 1 are close in the sense<br />
of energy. The emission energy E em is somewhat lower than the excitation energy E ab<br />
because of internal vibrations in the fluorophore, thus the wavelength of the emitted light<br />
is longer than the absorbed light. For TRITC λ ex = 540nm = 9.7·10 −19 J and λ em = 580nm<br />
= 9.1·10 −19 J. The excitation and the emitted light beams of different wavelengths can be<br />
separated by a dichroic mirror such that the emitted light can be analyzed. This is the<br />
corner s<strong>to</strong>ne in fluorescence microscopy.
CHAPTER 5. MATERIALS AND METHODS 36<br />
There are also alternative unwanted pathways for this conservation of energy like nonradiative<br />
relaxation and phosphorescence. They could not be observed <strong>to</strong> have influence<br />
on the monolayer results so they are briefly mentioned next. Non-radiative relaxation<br />
take place if the excitation energy is transfered in<strong>to</strong> vibrational energy and dissipated<br />
as heat if the molecule interact with another molecule. The latter is called quenching.<br />
These pathways and some additional are summarized in a Jablonski diagram with the<br />
characteristic time scales of the effects fig. 5.4. However all these effects can be included in<br />
Fig. 5.4: Jablonski diagram of fluorescence showing possible conversion paths.<br />
an ”efficiency” of the fluorophore called the quantum yield, Φ which can be experimentaly<br />
determined as a relative of the number of emitted pho<strong>to</strong>ns <strong>to</strong> pho<strong>to</strong>ns absorbed in a time<br />
interval<br />
k f<br />
Φ =<br />
k f + ∑ no. of pho<strong>to</strong>ns emitted<br />
n k = (5.2)<br />
n no. of pho<strong>to</strong>ns absorbed<br />
where k f and k m are rate constants for respectively the emission and other effects with no<br />
fluorescence. TRITC appears <strong>to</strong> have a high quantum yield and could be used in smaller<br />
amounts than other fluorophore.<br />
More important in this work is the <strong>to</strong>tal deactivation of the fluorophore called bleaching.<br />
Bleaching can occur if the fluophore reacts with oxygen e.g. when it is exposed <strong>to</strong> air<br />
it will then be a matter of time before this reaction causes the fluorescence cycle <strong>to</strong> s<strong>to</strong>p.<br />
In a monolayer study like this work, that kind of bleaching can be neglected. Instead it<br />
turned out that use of high laser intensity was the major cause of bleaching so obtaining<br />
nice imaging of the monolayer was always a compromise.<br />
Laser - Optics and Imaging<br />
The used WFM was optimized for single particle tracing before this work. This means<br />
that the setup was over tuned for this work and the critical laser power required for single<br />
particle studies and all the fine adjustable parameters could more or less be neglected. This<br />
is a fast travel through the optic table sketch in fig. 5.3 including technical information<br />
and basic theory when needed.
CHAPTER 5. MATERIALS AND METHODS 37<br />
It was assumed that an applied electric gradient field would have changed the shapes<br />
and edges of the lipid domains. Imaging of such changes required high optical resolution<br />
produced from an immersion media objective of high magnification. Such objectives have<br />
high Numerical Apertures (NA > 1) and very short working distances (WD) typically of<br />
100µm - 200µm. NA is a unit less number that defines the size of the focus point i.e. the<br />
optical resolution. More strictly<br />
NA = n · sin(θ cone ) (5.3)<br />
where n is the refractive index of the immersion media 1.00 for air 1.2 for pure water<br />
and θ cone is the half of the maximum angle of the light cone entering the objective.<br />
The working distance is defined as the shortest distance<br />
from the focus point <strong>to</strong> the objective which is the outer<br />
glass covering the lenses see fig. 5.5. Thus, (WD) is includes<br />
the thickness of the coverglass 170µm and the level<br />
of the water above this glass. Further more the distance<br />
from the water <strong>to</strong> the electrode was at least 200µm. For<br />
practical reasons high (WD) was used which enabled using<br />
of the focus point <strong>to</strong> locate the <strong>to</strong>p electrode above<br />
the water. The field only caused small changes of the<br />
water level < 2µm estimated without lipids. This effect<br />
was neglected.<br />
Constrained by the required (WD) and a high optical<br />
resolution the choice felt on LCPlanFl 40x see fig. 5.5<br />
which fitted the conditions very good. Data of objective: Fig. 5.5: Infinity corrected objective<br />
used in monolayer experiments and<br />
Olympus LCPlanFl 40x, NA = 0.60, WD = 2.15mm, Flat<br />
field correction i.e. the normally projected curved image introducing definitions. No immersion<br />
media, 40x magnification, WD =<br />
is corrected <strong>to</strong> a flat image. Fluorite correction for green<br />
2.15mm, NA = 0.6, f = 4.5mm<br />
and blue light. Correction <strong>to</strong> infinity image distance and<br />
for a 0.17mm thick cover glass.<br />
Excitation of the fluororphore happens at a wavelength of 532nm green light using a<br />
200mW <strong>to</strong>rus laser (Laser Quantum, GB) with a beam wide of ω = 0.85mm. To ensure full<br />
limitation of the back focal plane of the objective the narrow gausian beam from the laser<br />
was expanded by two lenses (L1) and (L2) with the focal lengths of respectively 12.5mm<br />
and 200mm. The expanded laser beam then had a width of<br />
ω expand = 0.85mm 200mm<br />
12.5mm<br />
= 14mm (5.4)<br />
This is much higher than the diameter of aperture of the chosen objective 5.5mm. Not<br />
<strong>to</strong> loose beam intensity by over illumination of the back focal plane of the objective the<br />
beam was truncated by a lens before entering the objective (L3). This has focal length<br />
of 300mm and was positioned <strong>to</strong> ensure full illumination of the back focal plane of the<br />
objective. The laser beam was directed through a dichroic mirror and reflected vertical up
CHAPTER 5. MATERIALS AND METHODS 38<br />
in<strong>to</strong> the objective by a 45 o mirror (not shown in figures). Emitted yellow light from the<br />
excited fluorophore in focus enter the objective and travel back the beam ray path but is<br />
separated from the green laser beam by a dichroic mirror. Finally a camera lens focuses<br />
the fluorophore light in<strong>to</strong> a EMCCD camera for analyzing. The beam paths and detection<br />
are schematized in fig. 5.6 for an easy view.<br />
Fig. 5.6: The combined setup of fluorescence microscopy and Langmuir trough used for isothermal<br />
compression of DPPC monolayers and real time imaging of the monolayer. The lenses (L1) and (L2) serve<br />
as a beam expander. (L3) focus the laser beam <strong>to</strong> a broad beam entering the objective thus back focal<br />
plane of the objective is widely illuminated.<br />
Emitted light from the fluorophore was imaged with a special CCD camera with inbuilt<br />
electron multiplying gain enabling use of lowered laser intensity for excitation of the<br />
fluorophore. Bleaching of the fluorophore was still a problem for longer time recordings.<br />
However, the resolution of the final image is determined by both the resolution of the<br />
microscope objective and the CCD chips in the camera. The optical resolution R of the<br />
objective is defined by the Rayleigh resolution criterion [Rayleigh1879] which states that<br />
two point sores of equal intensity can just be resolved with by the first minimums of the<br />
diffraction circles from the two sources. Graphically explained in fig. 5.7. Given by the<br />
wavelength of the entered light in<strong>to</strong> and the <strong>to</strong>tal NA of the objective<br />
R = 0.61 λ<br />
NA = 0.61580nm 0.6<br />
= 0.59µm (5.5)<br />
The second part in optimized imaging is determined by digital CCD camera resolution<br />
i.e. the number of pixels available and the dimensions of those. The EMCCD has a pixel<br />
array of 512 × 512 pixels, each of size 16µm × 16µm. With the chosen microscope objective<br />
of magnification 40x and camera lens 1x, the Rayleigh resolution is then magnified and<br />
and recorded on the chip array as 0.59µm·40 = 23.6µm. This is 1.5 larger than one chip<br />
size which is somewhat in the lower limit of the recommended fac<strong>to</strong>r 2 for optimal imaging.<br />
Originally, the fac<strong>to</strong>r of 2 is derived for optimized distinguishing between two signals in<br />
telegraphy. A signal with frequency width B requires a frequency bandwidth of 2B Nyquist
CHAPTER 5. MATERIALS AND METHODS 39<br />
Fig. 5.7: Intensity profile of emitted light from a point source a and its projected Airy disks b. Optic<br />
Rayleigh resolution R is defined in c as the shortest distance of separation of two intensity centers exactly<br />
when the first two intensity minima overlaps. Distinguishing of the sources in d requires gaussian fitting.<br />
1928 [Nyquist2002]. No matter the theory of signal transmission, the obtained images of<br />
the monolayers had an accuracy slightly bellow 1µm illustrated in Sec. 3<br />
5.3 Langmuir Trough and <strong>Applied</strong> <strong>Electric</strong>al <strong>Gradient</strong><br />
<strong>Field</strong><br />
This section describes the experimental conditions for generating the electric gradient field<br />
used <strong>to</strong> manipulate the monolayer. The results of these experiments are presented in<br />
chapter 6.<br />
Fig. 5.8: Self made holders for <strong>to</strong>p (a) and sub (b) electrodes between which the electric field is generated<br />
by an applied voltage. Left: The <strong>to</strong>p electrode had <strong>to</strong> be adjustable in height and also allow free movement<br />
of the barriers. The holder was mounted in<strong>to</strong> the space between the trough and the trough bench, and<br />
can be moved along the trough. Right: Top view without the cover box. Sub and <strong>to</strong>p electrodes are<br />
connected <strong>to</strong> a power supply and a switch. The electric connections and conveying of data is illustrated<br />
in fig. 5.9.<br />
It was of highest importance <strong>to</strong> keep the monolayer non-contaminated during experiments<br />
mainly from airborne dust and particles. The decided long equilibration time for the<br />
experiments with induced domain free or induced domain cluster required and enclosing<br />
of the system. For this purpose two provisional electrode holders were build <strong>to</strong> fit in<strong>to</strong> the<br />
gap between the trough and the trough bench and were kept low enough <strong>to</strong> use the acrylic<br />
cover box see fig 5.8.<br />
Another important criteria of success was the accuracy of the distance d 0 between the<br />
monolayer and the <strong>to</strong>p electrode since the strength of the electric field is related <strong>to</strong> d 0 as
CHAPTER 5. MATERIALS AND METHODS 40<br />
∝ 1/d 0 . This distance was measured with lens (L3) removed and and observation of the<br />
reflected laser light when focused on the electrode tip. The accuracy of d 0 was estimated<br />
<strong>to</strong> 10µm i.e. 5% deviation for the lowest distance used. This method for locating of the<br />
<strong>to</strong>p electrode is described in Appendix A.5.<br />
The electric field is generated between the 127µm thick and 1cm long <strong>to</strong>p electrode held<br />
a distance of d 0 above the monolayer, and an electrode submersed in<strong>to</strong> the subphase far<br />
away behind a trough barrier. The thickness of the <strong>to</strong>p electrode gave a constraint on how<br />
close it could be positioned <strong>to</strong> the monolayer if a suck up of monolayer on the electrode<br />
should be avoided. This is caused by the high surface tension of the monolayer-water.<br />
When applying an electric gradient field, the polar water molecules align parallel <strong>to</strong> the<br />
field which then exerts a force on the water molecules in direction of the center of the field.<br />
This results in an increase of the water level. The connecting wires from the power supply<br />
<strong>to</strong> the electrodes had a normal low resistance of 0.2Ω. Both <strong>to</strong>p and subphase electrodes<br />
were chosen <strong>to</strong> have high electrical conductivity and were made of respectively Zirconium<br />
and Platinum. The latter also had the capability of negligible reduced conductivity caused<br />
electrochemical reaction with the subphahe. This reaction eq. (5.6) involves hydrogen and<br />
forms hydroxide if a negative potential is applied.<br />
H 2 (g) ⇋ H + (aq) + e − (5.6)<br />
Replacing the Platinum with a silver electrode would have caused a difference in its conductivity<br />
depending on the polarity of the voltage applied between the <strong>to</strong>p and subphase<br />
electrode. A silver electrode will produce silver chloride on its surface if the polarity applied<br />
is positive. A negative polarity reject the chloride in<strong>to</strong> the subphase and neutralize<br />
the silver, forcing the reaction eq. (5.7) <strong>to</strong> the right [Skoog1982].<br />
AgCl(s) + e − ⇋ Ag(s) + Cl − (aq) (5.7)<br />
The high voltages needed for manipulation of the monolayers in this work initially<br />
turned out <strong>to</strong> complicate things and several precautions were taken. Previous published<br />
experiments and pilots highly emphasized a controlled strength of the applied field spanning<br />
10 5 V/m <strong>to</strong> 10 7 V/m. The field was generated by a high voltage power supply (0 -<br />
2500V) connected <strong>to</strong> a very fast push/pull switch controlled with a gaiting voltage difference<br />
of 5V from a computer connected power supply (ID Instruments). Without such<br />
switch and only the high voltage power supply a build up of charges on the <strong>to</strong>p electrode<br />
would be much slower and initially effects in the monolayer could not be distinguished from<br />
slower effects. The electrical connection of the components used is sketched in fig. 5.9<br />
The switch (Behlke, Germany) is very impressive and highly suitable for controlling<br />
high a voltage. It is actually a MOSFET switch that requires a maintained supply of<br />
maximal 5V <strong>to</strong> be active. Both charging of high voltage difference (push) and discharging<br />
of the circuit when switching it off (pull) is exceptionally fast. The push/pull times are<br />
in the order of 10 −9 s. Two resis<strong>to</strong>rs of each 1kΩ were put in between the MOSFET’s and
CHAPTER 5. MATERIALS AND METHODS 41<br />
Fig. 5.9: Sketch of the computer controlled electric gradient field and data path of fluorescence microscopy.<br />
The field was generated by a high voltage power supply (0 -2500V) connected <strong>to</strong> a very fast push/pull<br />
MOSFET switch controlled with a gaiting voltage difference of 5V from a computer connected power<br />
supply (ID Instruments). The MOSFET switch requires a maintained supply of 5V for being active.<br />
output. This functioned as a fuse if a short circuit in case of the mentioned problem with<br />
an accidental connection between the subphase-monolayer and <strong>to</strong>p electrode.
Chapter 6<br />
Induced Changes of <strong>Monolayers</strong> by <strong>Electric</strong><br />
<strong>Gradient</strong> <strong>Field</strong><br />
After an introduction <strong>to</strong> the subject the experimental considerations and progress are<br />
described. These were used <strong>to</strong> design the final experiments and setup. The final results<br />
are then presented and in the last section a model based on electrodynamics is discussed.<br />
6.1 Introduction<br />
The original question of inspiration for the experimental work in this<br />
thesis was ”How does electrical stimulation of a nerve affect the main<br />
membrane components - the lipids” The question was approached<br />
by studying the effect of an electric gradient field applied <strong>to</strong> a model<br />
membrane resembled with an artificial lipid monolayer in a Langmuir<br />
trough. The monolayer was made of the lipid species with the highest<br />
mass percentage representation in non-myelinated nerves. These<br />
lipids are the Diacyl-PhosphatidylCholines (PC’s) with their characteristic<br />
polar choline head groups [Sackmann1995]. To have the model<br />
system as simple as possible one species was chosen namely DPPC<br />
fig. 6.1. At room temperature DPPC monolayers can be compressed<br />
in<strong>to</strong> any state and have a broad coexistence region (LE-LC) containing<br />
a liquid and a condensed phase. This region is of interest since Fig. 6.1: Polar<br />
biological membranes have very broad melting transition profiles and choline head group<br />
thereby a broad region of coexistence containing phases of the different<br />
lipids present in the membranes [Heimburg2005].<br />
of DPPC. Given the<br />
distance d from x-ray<br />
diffraction on multilayers,<br />
the dipole moment<br />
Phase transitions in monolayers induced by mechanical force, temperature,<br />
ionic or pH changes are well-studied in the literature as P = 6.7 · 10 −29 Cm =<br />
mentioned in chapter 3. Phase transitions controlled with an external<br />
20.2Debye, 11 times<br />
electric field are possible if the thermodynamic coupling between larger than a single<br />
water molecule.<br />
the intensive and extensive variable is strong enough, i.e. stronger<br />
than couplings in the system that keeps it in a particular state. Temperature and lateral<br />
42
CHAPTER 6. INDUCED CHANGES IN MONOLAYERS BY ELECTRIC FIELD 43<br />
pressure are clear examples of such intensive variables and phase transitions can widely be<br />
demonstrated with the use of isotherms.<br />
An electrical field will then be a candidate for induction<br />
of a phase transition in a monolayer of DPPC if the polar<br />
choline head groups of DPPC are strongly coupled <strong>to</strong> the<br />
field. The distance between the phosphate and nitrogen is reported<br />
in X-ray studies <strong>to</strong> be 4.2Å [Hauser1981]. This gives<br />
a dipole moment for a single DPPC molecule of the order<br />
6.7 · 10 −29 Cm = 20.2Debye 1 . This is an order of magnitude<br />
10 larger than the dipole moment of a single water molecule<br />
≈ 6·10 −30 Cm = 1.9Debye [Griffiths1999]. However the dipole<br />
moment decreases when the head group is submersed in aqueous<br />
media because of interaction with neighbor lipids and gradient field E with the grounded<br />
Fig. 6.2: Schematic of the electric<br />
subphase electrode behind a barrier<br />
ions in the subphase. Water molecules in the subphase are<br />
and the <strong>to</strong>p electrode of length l 0<br />
thought <strong>to</strong> order around the polar head groups, forming layers<br />
of water giving a small increase in the density of dipoles. layer. The monolayer plane is de-<br />
held a distance d 0 above the mono-<br />
The dipole potential increases dramatically during compression<br />
of the monolayer in<strong>to</strong> the (LE) phase from zero in the<br />
fined at z = 0 and the center of the<br />
field is defined at r = 0.<br />
(G-LE) region and reach a maximum ≈ 600mV in the solid (S) phase [Nakahara2005]<br />
[Vogel1988] [Shapovalov1998]. This indicates a larger surface normal component of the<br />
dipole moments for the condensed lipid domains than the more disordered liquid (LE)<br />
phase. Earlier studies described in chapter 1.4 claims that this difference is responsible<br />
for movements of lipid domains if an electric gradient field is applied <strong>to</strong> the monolayer<br />
[Florsheimer1989] [Florsheimer1990]. The setup for the electric gradient field used was<br />
strongly inspired by the original setup of Möhwald and co. workers fig. 1.4 but instead of<br />
10µm a 127µm thick <strong>to</strong>p electrode is used in this work.<br />
The original question has been reduced <strong>to</strong> how an electric gradient field influences<br />
a Langmuir monolayer of DPPC. The gradient field is produced by a voltage difference<br />
between an electrode hanging above the monolayer and a grounded conducting subphase.<br />
This setup and electric field are illustrated in fig. 6.2 and defines the coordinate system,<br />
the distance d 0 between the monolayer and <strong>to</strong>p electrode, the length of the electrode l 0<br />
and diameter of the electrode b.<br />
Without knowing the distribution of the field in detail it can be stated that it is nonhomogeneous<br />
and is, in essence, a gradient field. Furthermore, the field is independent<br />
of rotation around the z-axis; thus the force exerted by the field on the dipoles in the<br />
monolayer is radial from the center of the field, r = 0. The direction of the radial force<br />
depends on the polarity of the potential applied between the electrodes. Since the dipoles<br />
are oriented in<strong>to</strong> the subphase, a positive potential is applied <strong>to</strong> the <strong>to</strong>p electrode (building<br />
up a positive charge) attracted the dipoles and will move them <strong>to</strong>ward the center. This<br />
increases the density of lipid domains in that region around r = 0. For a negative potential<br />
the dipoles are repelled radial from r = 0, decreasing the density of lipid domains. The<br />
1 1Debye = 3.335·10 −30 Cm
CHAPTER 6. INDUCED CHANGES IN MONOLAYERS BY ELECTRIC FIELD 44<br />
direction of the force is best illustrated in fig. 6.3 with a dipole between two angled<br />
capaci<strong>to</strong>r plates producing a gradient field because of changing distance between the plates.<br />
A secondary effect of the field is a <strong>to</strong>rque on the dipoles. This<br />
tends <strong>to</strong> align them in the direction of the field lines thereby minimizing<br />
the energy of the dipole. This aligning would increase<br />
the normal dipole component and hence the force on the dipoles.<br />
Because of the structural orientation of the polar choline groups,<br />
parallel aligning might favor an increase of the force in the case of<br />
attraction of the domains but a decrease it in the case of repulsion.<br />
The basic themes for this chapter are now introduced. Important<br />
parts of the experimental development/progress and experimental<br />
limitations are described below. These considerations leaded <strong>to</strong> Fig. 6.3: The force F from<br />
the final method condensed in Sec. 6.3 and was used <strong>to</strong> achieve a electric gradient field E<br />
on a dipole pointing in the<br />
the main results presented in Sec. 6.4. Experimental results are<br />
same direction of the field.<br />
theoretically discussed parallel with electrodynamics models of the<br />
system in Sec. 6.5.<br />
6.2 Preliminary Results and the Experimental Progress<br />
All the monolayers in the experiments presented in this chapter was spread with the standard<br />
DPPC solution on a 150mM NaCl subphase described in Section 5. The monolayers<br />
were compressed <strong>to</strong> a lateral pressure of 30mN/m and then fully expanded in order <strong>to</strong><br />
check the setup and ensure equal conditions for the monolayers. A representative compression<br />
isotherm is shown in fig. 6.4 for a monolayer at 22.7 o C. Before the electric gradient<br />
field was applied, the monolayer was compressed in<strong>to</strong> the coexistence region <strong>to</strong> the lateral<br />
pressure of interest.<br />
Two of the first experiments with applied field<br />
These two experiments a and b recovered the effect of the electric gradient field fig. 6.2<br />
were carried out with a primitive setup of the electrodes. These two results gave further<br />
experiences which were used <strong>to</strong> construct the final setup. Attraction of lipid domains in<br />
the monolayer with a positive electric potential applied <strong>to</strong> the <strong>to</strong>p electrode is first demonstrated<br />
in experiment a. Repulsion for the opposite sign for the potential is not shown.<br />
The troublesome influence of drift in the monolayer is observed in experiment b.<br />
The <strong>to</strong>p electrode was held between 500 and 600µm above the monolayer and the water<br />
level was at 500µm above the coverglass in the trough. This was tried <strong>to</strong> be held constant<br />
by compensating for evaporation. The camera lens had 1x magnification and a 40x air<br />
objective in the first and 20x in the second experiment were used.<br />
Spatial location of the <strong>to</strong>p electrode was at this early stage simply found by turning<br />
down the sensitivity of the camera and illuminate above the electrode. It was then possible
CHAPTER 6. INDUCED CHANGES IN MONOLAYERS BY ELECTRIC FIELD 45<br />
Fig. 6.4: Representative isotherm of DPPC monolayer at 22.7 o C for the combined experiments of isothermal<br />
compression and applied electric gradient field. The amount of TRITC-DHPE used in the monolayers<br />
in these experiments varied from 0.1 <strong>to</strong> 0.2 mol%. Such small amounts could not be observed <strong>to</strong> influence<br />
the isotherm or the domains in the coexistence region.<br />
Fig. 6.5: Experiment a. At a Lateral pressure of 10mN/m domains are observed. Left: Before the<br />
electrical field was applied domains was observed in the focus. Middle: After 110 seconds with 500V<br />
applied <strong>to</strong> the <strong>to</strong>p electrode the density of domains was increased due <strong>to</strong> attraction. Right: After 40min.<br />
a packed cluster has formed of mutually repulsive domains. Conditions: Scalebar: 20µm, Mean temperature<br />
23 o C, Subphase 150mM NaCl, 0.1mol% TRITC-DHPE, Compression Rate 0.9Å 2 /molecule/min.,<br />
d 0 =4000µm.<br />
<strong>to</strong> use the microscope and focus on the shadow side and bot<strong>to</strong>m of the <strong>to</strong>p electrode and<br />
observe it with the camera. Having found the horizontal and vertical position of the <strong>to</strong>p<br />
electrode above the monolayer the focus point was moved down in the monolayer plane.<br />
From this the distance d 0 from the bot<strong>to</strong>m of the electrode <strong>to</strong> the monolayer was given.<br />
It was ensured that the illumination was not <strong>to</strong>o strong <strong>to</strong> damage the camera (pho<strong>to</strong>n<br />
counts per exposure time ≪ 1200). This method for locating the <strong>to</strong>p electrode was not<br />
successful every time and the distance d 0 was attached with an accuracy estimated <strong>to</strong> 25µm.
CHAPTER 6. INDUCED CHANGES IN MONOLAYERS BY ELECTRIC FIELD 46<br />
Fig. 6.6: Experiment b. The electric potential was reduced from 1000V <strong>to</strong> 500V on the <strong>to</strong>p electrode<br />
just before t=0. A tail of domains was formed because of the drag force from the constant drift in the<br />
monolayer. The velocity of the drift is is estimated <strong>to</strong> ≈ 0.5mm/s. Conditions: Scalebars: Small 20µm,<br />
large 40µm, d 0 = 5000µm, Mean temperature 21 o C, Lateral pressure 9mN/m, Subphase 150mM NaCl,<br />
0.1mol% TRITC-DHPE, Compression Rate 0.9Å 2 /molecule/min.<br />
Experiment a<br />
A negligible drift in the monolayer was observed. By applying a positive electrical potential<br />
of 500V <strong>to</strong> the <strong>to</strong>p electrode it was observed that domains moved <strong>to</strong>ward the center of the<br />
electric field located beneath the <strong>to</strong>p electrode ,r=0. The density of domains was slowly<br />
but clearly increased in this region fig. 6.5. The diameter of the induced domain cluster<br />
and domain free area (not shown) exceeds the field of focus by several times.<br />
Experiment b<br />
The conditions was the same in this experiment except that the temperature was kept at<br />
21 o C and the monolayer was compressed <strong>to</strong> a lateral pressure of 9mN/m before applying<br />
the field. Repulsion or attraction of domains was again observed with applied voltages for<br />
opposite signs. Significant drift of ≈ 0.5mm/s in the monolayer changed the shape of the<br />
domain cluster. Because of the drift a voltage of 1000V was applied <strong>to</strong> grow a domain<br />
cluster. A reduction of the voltage <strong>to</strong> 500V was not enough <strong>to</strong> keep the diameter of the<br />
domain cluster constant with time. After the reduction a tail of domains on the cluster<br />
was formed with the drag on the domains is <strong>to</strong>ward the left. The main part of the cluster<br />
<strong>to</strong> the right is not shown in fig. 6.6.<br />
Drift and evaporation<br />
The first experiments with the applied electric gradient field were implicated with limiting<br />
experimental disadvantages and problems. Determination of the radius was hindered since<br />
movement of the focus was constrained by the objective itself and the steel ring in the<br />
trough. This was caused by the high water level used for which the space between objective<br />
and steel ring was insufficient. The setup for the electrodes was primitive which made it<br />
difficult <strong>to</strong> adjust and localize the <strong>to</strong>p electrode. A plastic bag was used in an attempt<br />
<strong>to</strong> enclose the combined Langmuir trough and electrode setup. The electrode holders
CHAPTER 6. INDUCED CHANGES IN MONOLAYERS BY ELECTRIC FIELD 47<br />
hindered a tight sealing and constant evaporation of the subphase during the experiments<br />
was observed. In some of the experiments a large convective motion (drift) in the monolayer<br />
was observed. The drift was of the order of 0.5mm/s, so a state of the monolayer close <strong>to</strong><br />
mechanical equilibration could never be reached during these experiments. Evaporation of<br />
the subphase increased the distance between the <strong>to</strong>p electrode and monolayer and thereby<br />
decreased the strength of the applied field and its force on the dipoles in the monolayer. In<br />
addition, the evaporation of the subphase reduced its buoyancy on the tensiometer probe.<br />
In order <strong>to</strong> avoid drift and evaporation of subphase the primitive method for positioning<br />
the electrodes was abandoned.<br />
The improved self-made setup for the electrodes allowing <strong>to</strong>tal encapsulation of the<br />
monolayer and electrodes is described in section 5.<br />
Constraints and Remarks on the Measurements<br />
It is obvious that attraction of lipid molecules in the monolayer <strong>to</strong>ward the center of the<br />
field would increase the density of lipids and thereby increase the lateral pressure. In the<br />
coexistence region of interest a small change in lateral pressure corresponds <strong>to</strong> a large<br />
change in molecular area.<br />
It was thought that an induced change in lateral<br />
pressure as a function of the applied electric field<br />
strength could be measured. To have a large sensitivity<br />
in such measurements a change in molecular<br />
area could be obtained by adjust the trough barriers<br />
<strong>to</strong> have the pressure constant.<br />
However it was impossible <strong>to</strong> measure the lateral<br />
pressure in that region close <strong>to</strong> the electrical field.<br />
The tensiometer used <strong>to</strong> measure the lateral pressure<br />
was affected itself by the electric gradient field.<br />
For the lowest applied voltage of 50V the lateral<br />
pressure jumps initially 0.35mN/m then falls back<br />
and decays from a value 0.1mN/m above the pressure<br />
before the voltage was applied, fig. 6.7. The<br />
tensiometer has a piezo crystal which transforms<br />
the lateral pressure of the monolayer on the probe<br />
in<strong>to</strong> a voltage difference for data processing. This<br />
effect was also observed without monolayer (only<br />
subphase) and also with an empty trough having<br />
the tensiometer at the same spatial position.<br />
Fig. 6.7: Effect of the electric gradient field<br />
on the teniometer with the lowest used voltage<br />
U = 50V . The tensiometer was held 1cm from<br />
the <strong>to</strong>p electrode. (start) marks turn on of the<br />
field and (measurement) marks the time for<br />
measuring the diameter of the induced area in<br />
the monolayer.<br />
A self-made probe of glass was tried instead of the normal one of aluminum but without<br />
reduction of the effect. It was then chosen <strong>to</strong> not <strong>to</strong> pay attention <strong>to</strong> the lateral pressure<br />
and instead keep the area constant during the time when the electric gradient was applied.<br />
It was then tried <strong>to</strong> experimentally find the time it takes <strong>to</strong> induce a domain cluster or<br />
domain free area and thereby estimate an equilibration radius of the induced area. Unfortunately<br />
it appears that these times were very long and the typically area created exceeded
CHAPTER 6. INDUCED CHANGES IN MONOLAYERS BY ELECTRIC FIELD 48<br />
the focus width. The bleaching effect of the fluorophore in focus disabled a prolonged imaging<br />
of the induced domain cluster. Bleaching was avoided by having the laser turned off<br />
between the appliance of the field and the imaging. This would only give reliable results if<br />
evaporation of subphase, contamination and drift of the monolayer could be avoided.<br />
The observed direction of the lipid domain movement was previously reported <strong>to</strong> have an<br />
opposite sign <strong>to</strong> the direction of predicted by electrodynamics [Mohwald1986] [Heckl1988].<br />
The sign of the voltage applied for experiments in this thesis are measured with a voltmeter.<br />
The signs of the polarity of the electrical setup used here were finally demonstrated<br />
by changing the <strong>to</strong>p electrodes with one made of silver. Both the <strong>to</strong>p electrode and the<br />
usual subphase electrode were then immersed in<strong>to</strong> a separated NaCl solution. It is known<br />
that an applied positive voltage on a silver electrode creates a layer of silver chloride AgCl<br />
which appears black on the silver electrode [Skoog1982]. This was the case in this work<br />
and the reversed effect was observed for negative applied voltage. The potential driven<br />
chemical reaction was discussed in section 5.3.<br />
Conclusion<br />
The two experiments clearly showed that the force on a lipid domain from an electric<br />
gradient field was in agreement with the expectations. For a positive potential applied <strong>to</strong><br />
the <strong>to</strong>p electrode, the field pointed down like the orientation of the dipole moment of the<br />
domains. This attracted the domains <strong>to</strong> the field center, r=0. For opposite polarity of the<br />
voltage the field pointed up and the domains were repelled away from the field center. The<br />
growth times for induced cluster or domain free area were observed <strong>to</strong> be of several minutes<br />
for weak fields and increased with field strength. These observations of the force and the<br />
growth time agrees with previously results discussed in Sec. 1.4, so improvements of the<br />
experimental seemed <strong>to</strong> be fruitful. In spite of the limitations of the initial experiments<br />
these effects were defeated and a final setup for the electrodes were developed see Sec. 5.<br />
The final setup made it possible <strong>to</strong> measure the equilibration radius of domain cluster and<br />
domain free area as a function of applied voltage.<br />
6.3 Final Experiments and Settings<br />
Experiments were carried out <strong>to</strong> establish a relation between the applied voltage U and radii<br />
of both induced domain cluster and domain free area. Having the monolayer compressed<br />
in<strong>to</strong> the region of coexistence the field was applied for 1300s = 22 minutes. This time<br />
was used in all experiments because actual equilibration times could not be measured<br />
and it was assumed <strong>to</strong> be longer than the equilibration times. The equilibrium radius<br />
R 0 of an induced area was measured with use of the focus field and the micro-screws for<br />
horizontal movements of the monolayer trough. With this method the accuracy of the<br />
radius measurement was estimated <strong>to</strong> be 15µm which included the accuracy of the microscrews<br />
and the fact that the monolayer displaced a little upon moving it due <strong>to</strong> inertia.<br />
A reliable method for locating the <strong>to</strong>p electrode was developed so the accuracy of the
CHAPTER 6. INDUCED CHANGES IN MONOLAYERS BY ELECTRIC FIELD 49<br />
distance d 0 <strong>to</strong> the <strong>to</strong>p electrodes is of the order 10µm. With this method the horizontal<br />
position of the electrode could be found <strong>to</strong> be right above the focus point. This was highly<br />
needed for the chosen method for collecting the data. A user friendly guide is given in<br />
Appendix A.5.<br />
The water level was maintained at 250µm above the<br />
cover glass in the trough. This was held constant by<br />
moistening the acrylic cover box and compensating for<br />
evaporated subphase by adding new from the s<strong>to</strong>ck solution<br />
(150mM NaCl).<br />
6.4 Results<br />
With the above described improvements manipulation of<br />
monolayers with the applied electric gradient field was<br />
successful. Creation of a domain cluster is first illustrated.<br />
Secondly the radii of induced cluster and domain<br />
free areas are measured as functions of the applied voltage.<br />
Fig. 6.8: Setup for the electric gradient<br />
field applied on<strong>to</strong> a DPPC monolayer<br />
(without the acrylic cover box).<br />
See detailed description section 5.<br />
6.4.1 Creation of a Domain Cluster<br />
With slow isothermal compression of the DPPC monolayer in<strong>to</strong> the coexistence region,<br />
the condensed lipid domains that formed were more or less equal in size and homogeneous<br />
distributed in the monolayer. A small fraction of oddly developed domains was observed.<br />
Distinct behavior of the domains due <strong>to</strong> their shapes with an applied electric gradient<br />
field was recognized but could not be described quantitatively. With the field applied the<br />
domains reoriented during the first few seconds. After the reorientation, the movement<br />
of the domains was <strong>to</strong>ward the center of the field. For some domains this movement was<br />
instant because of an already favorable orientation in the field. Fig. 6.9 gives an example<br />
of these observations during the first 90 seconds with a positive voltage applied on the <strong>to</strong>p<br />
electrode was recorded. A domain with an initial favored orientation is marked by an ⊸<br />
in the figure. In the first 5 seconds this domain is located 91µm from r=0 and reach a<br />
mean velocity estimated <strong>to</strong> 5.3µm/s during its movement from r=91µm <strong>to</strong> r=64µm. From<br />
this point and <strong>to</strong> its position after 10 seconds the mean velocity is decreased <strong>to</strong> 12.8µm/s.<br />
In these experiments with domain clustering, dense packing of domains was observed.<br />
For a field with +300V and d 0 = 150µm the smallest distance between domains was<br />
typically of pixel resolution i.e. 1pixel = 0.4µm. But complete contact and fusion of<br />
domains leading <strong>to</strong> condensation in<strong>to</strong> a solid phase was never observed in any of the<br />
experiments.
CHAPTER 6. INDUCED CHANGES IN MONOLAYERS BY ELECTRIC FIELD 50<br />
Fig. 6.9: The first 90s of the creation of DPPC domain cluster induced by an electric gradient field<br />
applied <strong>to</strong> the monolayer compressed <strong>to</strong> a lateral pressure of 7mN/m. Domains are dark shaded while<br />
the fluorophore containing liquid phase appears bright. The field was applied at applied at t=0 (<strong>to</strong>p left).<br />
Rotation of domains was observed in the first 5s illustrate with the orientation of ⊥. After the rotation<br />
strong attraction and condensation of domains occurs and morphology of the domains are unchanged during<br />
the condensation. Some domains had a favorable initial orientation and are attracted at once, ⊸. Because<br />
of bleaching domain boundaries of domains in the focus field cannot be distinguished. Conditions:<br />
Scalebar = 20µm, <strong>Applied</strong> voltage 3000V, d 0 = 200µm, Mean temperature 21 o C, Lateral pressure 7mN/m,<br />
150mM NaCl subphase, 0.1mol% TRITC-DHPE, Compression Rate 0.9Å 2 /molecule/min.<br />
6.4.2 A Voltage-Radius Relation<br />
It was of importance <strong>to</strong> experimentally find the relation between the voltage U applied<br />
<strong>to</strong> the electrodes and the radius R 0 of the domain cluster and the domain free area. All<br />
raw voltage-radius data are plotted in fig. 6.10 as the radius of the area measured for a<br />
given voltage applied in units of µm and V . Zero radius for zero field is assumed as a<br />
data point in the plots. There are three data sets of induced domain clusters marked by<br />
□ ○ △ and two sets of induced domain free areas marked by + ×. In general R 0 is not<br />
linear with U but the effect decrease for larger values of the voltage applied. The effects of<br />
repulsion and attraction of domains cannot be distinguished in the data. Small variation of<br />
the temperature has no effect. The relation is mostly pronounced for the data set marked<br />
brown ○. The brown data were obtained in the last experiments with the highest degree<br />
of experience of the setup. The two values of the lateral pressure 7mN/m and 9mN/m
CHAPTER 6. INDUCED CHANGES IN MONOLAYERS BY ELECTRIC FIELD 51<br />
Fig. 6.10: Radius of domain cluster and free area induced by a gradient field of applied voltage U.<br />
Accuracy of R 0 is 15µm and d 0 is 10µm.<br />
measured just before appliance of the field are both in the coexisting region and have no<br />
significant influence on R 0 . Notice the applied field is weaker for all the data at 9mN/m<br />
because of the larger values of d 0 . This point is emphasized when the voltage is normalized<br />
fig. 6.11 with the distance d 0 giving the field strength at the center of the gradient field at<br />
the air-monolayer interface right below the electrode i.e. r=z=0. The field strength is of<br />
the order 10 6 V/m.<br />
Fig. 6.11: Radius of domain cluster and free area induced by a gradient field of voltage U normalized<br />
with the distance d 0 between the monolayer and tp electrode i.e. the strength of the electric field in units<br />
of (V/m). Accuracy of R 0 is 15µm and d 0 is 10µm.<br />
Beside the variation of the data the normalization with d 0 reveals constancy in the data<br />
of the effects of the applied electric gradient field. Paying attention <strong>to</strong> the brown data set<br />
they recover the effect of voltage and radius as a power law. This is emphasized in fig. 6.12<br />
with the radius squared R 2 0 as a function of the voltage U. Within error the data follows<br />
straight lines for each series of experiments with similarities among the domain free area
CHAPTER 6. INDUCED CHANGES IN MONOLAYERS BY ELECTRIC FIELD 52<br />
Fig. 6.12: Equilibrium radii of domain clusters and domain free areas squared R 2 0 as a function of the<br />
applied voltage U. Note the 10 3 on the y-axis, accuracy of R 2 0 is 225µm 2 and d 0 is 10µm.<br />
and the domain clustering for both values of the lateral pressure. This largely supports the<br />
a relation between U and R 0 as a power law R 2 0=K·U. The brown data points exhibits a<br />
constant of proportionality K estimated <strong>to</strong> 100µm 2 /V. This agrees with the same order of<br />
magnitude with results obtained in [Heckl1988]. The dependence on the distance d 0 from<br />
the <strong>to</strong>p electrode <strong>to</strong> the monolayer is hardly recognized from the data. For a small d 0 the<br />
field is stronger and one should expect a larger constant of proportionality. Errors of the<br />
radii are relative small because the accuracy of the measurement is 15µm.<br />
6.5 Theory and Discussion of the <strong>Applied</strong> <strong>Electric</strong><br />
<strong>Field</strong> and Dipoles<br />
The observed results fully support the idea of the electric gradient fields and dipole interaction.<br />
The interaction is best proved by the dependence of the domain movements on the<br />
sign of the potential applied. Consequences of this interaction are discussed below.<br />
Force and Dipole Components.<br />
The composition of the head group is known <strong>to</strong> produce a dipole moment but its direction<br />
and thus the direction of the dipole moment of a domain is not obvious. The conformation<br />
of the head group embedded in water is not fully unders<strong>to</strong>od and even in the presence of<br />
an electric field it might change. This was mentioned earlier in chapter 1.4 and chapter 2<br />
where the dipole potential of DPPC monolayers indicate increased density of the dipoles<br />
during compression and a reorientation of the dipoles <strong>to</strong>ward the monolayer normal. This<br />
suggests a more or less in-frozen dipole moment of each condensed lipid domain pointing<br />
down in the subphase and is supported by mutual repulsion between domains.<br />
The exerted force by the field on dipole i is related by F = (p i · ∇)E. The <strong>to</strong>tal dipole<br />
moment of a lipid domain p is a superposition of all dipoles p = ∑ N<br />
i<br />
p i ≤ Np where N is<br />
the number of lipid molecules and ≤ because of different orientations of the dipoles. For an
CHAPTER 6. INDUCED CHANGES IN MONOLAYERS BY ELECTRIC FIELD 53<br />
approximately circular domain of radius a the <strong>to</strong>tal dipole moment of the domain normal<br />
<strong>to</strong> the monolayer is given as p = πa 2 p. Followed from the discussion of the origin of the<br />
dipole potential in chapter 4 values of the mean dipole density p for domains are unclear.<br />
The simple calculation yielded a dipole moment of the choline head group normal <strong>to</strong> the<br />
monolayer in water of permittivity ɛ=80 <strong>to</strong> be p ≈ 0.25Debye/49Å 2 = 5.1·10 −3 Debye/Å 2 .<br />
Deduced from dipole potential measurements on DPPC monolayers p ≈ 0.5Debye/49Å 2 =<br />
1 · 10 −2 Debye/Å 2 .<br />
Since they only differ by a fac<strong>to</strong>r of 2 the measured value of p ≈ 0.5Debye/49Å 2 is used<br />
for calculations in this chapter which should only be taken an estimate.<br />
Because the field used is independent of rotation around its z-axis (center of the field)<br />
a dipole p in the monolayer plane is given:<br />
p = (p r , p z ) E = (E r , E z ) (6.1)<br />
A third component of the dipole p φ regarding its orientation in the monolayer plane is<br />
neglected since the movement of the domains are observed <strong>to</strong> be radial. The initial reorientation<br />
of some domains does not influence the radial movement. The electrical field is<br />
derived from the electric potential between the <strong>to</strong>p electrode and subphase:<br />
E = −∇Ψ (6.2)<br />
This results in the two general expressions for the force F = (p i · ∇)E:<br />
(<br />
) (<br />
)<br />
∂E r<br />
F r = p r<br />
∂r + p ∂E r<br />
∂E z<br />
z<br />
F z = p r<br />
∂z<br />
∂r + p ∂E z<br />
z<br />
∂z<br />
(6.3)<br />
Since the polar head group is embedded in the subphase it is reasonable <strong>to</strong> put z=0 which<br />
leads <strong>to</strong> simplification of the force components because ∂Er = 0 and ∂Ez = 0. Continuity<br />
∂r<br />
∂z<br />
of the electric potential across z=0 implies that the curl of the field 2 ∇ × E = 0. Thus the<br />
components of the force are:<br />
∂E r<br />
F r = p z<br />
∂z = p ∂E z<br />
z<br />
∂r<br />
∂E z<br />
F z = p r<br />
∂r = p ∂E r<br />
r<br />
∂z<br />
(6.4)<br />
The vertical component of the force F z is from now neglected since no vertical movement<br />
of the domains was observed and the radial component of the dipole moment is |p r | < |p z |.<br />
An electric field of the strength used was not observed <strong>to</strong> influence the (LE) phase of the<br />
monolayer. If the E field points down in<strong>to</strong> the subphase, a dipole pointing down in<strong>to</strong> the<br />
subphase is forced <strong>to</strong>ward the center of the field r=0. If the direction of the E field is<br />
reversed (<strong>to</strong> upward) the dipole pointing down is force away from the center of the field.<br />
This dependence was experimentally observed and is shortly summarized in fig. 6.13.<br />
A DPPC bilayer is normally described as a dielectricum with a dielectric constant ɛ=2<br />
with bound charges. If this is also the case for the monolayer, an applied E field would<br />
( 2 ∇ × E = ∂Ez<br />
r∂φ − ∂E φ<br />
∂z<br />
)<br />
r + ( ∂E r<br />
∂z<br />
− ) ∂Ez<br />
∂r φ +<br />
1<br />
r<br />
(<br />
∂(rEφ )<br />
∂r<br />
− ∂Er<br />
∂φ<br />
)<br />
z = 0
CHAPTER 6. INDUCED CHANGES IN MONOLAYERS BY ELECTRIC FIELD 54<br />
induce a charge separation in the dielectricum and attract it in<strong>to</strong> the strongest region of<br />
the field. This effect is then independent of the direction of the field. Only the sketched<br />
dependence of the field direction was observed in all the experiments, which indicates a<br />
non dielectric nature of a DPPC monolayer.<br />
A example of this effect on a dielectricum was found for the clean subphase with an<br />
applied homogeneous electric field of an area of 2cm × 20cm across the air-water interface,<br />
see Appendix A.1. Thus a field of strength 5·10 5 V/m raises the water level about 15µm<br />
because of the fringing field (boundary field) of the homogeneous field. However, a rais in<br />
the water level with the use of the <strong>to</strong>p electrode for the gradient field was not noticed <strong>to</strong><br />
rais in any cases.<br />
The Relation between Voltage and Equilibration<br />
Radius of the Induced Area<br />
The measured values of R 0 of the clusters of attracted domains<br />
and the radius of the domain free areas were found in fig. 6.12<br />
<strong>to</strong> be related U as a power law. For a given U the measurements<br />
imply no distinction between a cluster and a domain free<br />
area.<br />
Fig. 6.13: Movements of lipid<br />
Equilibrium occurs because the radial force exerted by the domains induced with a radial<br />
electric gradient field is balanced by a force from the monolayer electric gradient field. View from<br />
above the monolayer. The direction<br />
of the field and the move-<br />
itself. This balancing force stems from repulsion of domains in<br />
the monolayer repelling each other due <strong>to</strong> dipole-dipole interactionsment<br />
of domains are indicated.<br />
An induced circular cluster of domains will then grow in size until, at a distance R 0<br />
where the force from the electric gradient field is equal the repulsive dipole force from the<br />
cluster.<br />
For the case of a repulsive gradient force domains outside R 0 are compressed and thereby<br />
increase the repulsive forces between the domains outside R 0 . Drift in the monolayer can<br />
influence the equilibrium and hence R 0 .<br />
Torque Excerpted by the <strong>Field</strong> on the Dipoles.<br />
Furthermore, the applied field exert a <strong>to</strong>rque N on a dipole tending <strong>to</strong> align it parallel<br />
<strong>to</strong> the field given as N = p × E. In the case of domain attraction the p z might increase<br />
due <strong>to</strong> the parallel aligning resulting in a larger radial force and hence a larger radius of<br />
equilibrium. For domain repulsion the E field is antiparallel <strong>to</strong> p z which might decrease the<br />
force and result in a reduced radius of equilibrium. This is not supported by the obtained<br />
results but is reported in [Heckl1988]. If the dipoles could align freely without limitations<br />
a dipoles would always be attracted <strong>to</strong>ward the strongest part of an electric field. This is<br />
in fact the case for the water molecules in the subphase thereby raise the water level in the<br />
field region. The effect was only observed with the use of strong fields but negligible and<br />
had no influence on the induced area.
CHAPTER 6. INDUCED CHANGES IN MONOLAYERS BY ELECTRIC FIELD 55<br />
<strong>Electric</strong> <strong>Gradient</strong> <strong>Field</strong> - Two approximations.<br />
The thickness of the electrode and the distance from this <strong>to</strong> the monolayer is of the same<br />
order. The thickness is 0.005” = 127µm and the distance d 0 <strong>to</strong> the monolayer is ≥ 200µm.<br />
The two most straight forward approximations of the field are (1) a point charge as done<br />
by [Mohwald1986] or (2) a vertical charged rod [Heckl1988]. The charged rod is given by<br />
an integration of stacked point charges along the length of the rod. The electric gradient<br />
field across the monolayer plane z=0 is given from a point charge:<br />
E z,Q (r) = −<br />
∂Ψ(r, z)<br />
∂z<br />
2d 0<br />
| z=0 = −const<br />
(r 2 + d 2 0) 3 2<br />
(6.5)<br />
Integrating along the length of the electrode l from d 0 <strong>to</strong> d 0 + l gives the field from a line<br />
charge:<br />
∫ (<br />
)<br />
d0 +l<br />
E z,Rod (r) = E z,Q (r)dd 0 = const ′ 1<br />
1<br />
−<br />
(6.6)<br />
d 0 (r 2 + (l + d 0 ) 2 ) 1 2 (r 2 + d 0 ) 1 2<br />
The second term in eq. (6.6) is now neglected since l ≪ d 0 . The two constants includes<br />
the charge Q and the capacity of the system depending on the geometries of the electrode<br />
and are thus different. The field from a point charge and a solid sphere are equal so<br />
const ≈ bU, where b = 63.5µm is the radius of the sphere (i.e. the electrode). For the thin<br />
rod const ′ ≈ U.<br />
Force on the Domains in the <strong>Field</strong>.<br />
∂E z<br />
F r,Q (r) = p z<br />
∂r = p 6d 0 r<br />
zconst<br />
(r 2 + d 0 ) 5 2<br />
∂E z<br />
F r,Rod (r) = p z<br />
∂r = p zconst ′ r<br />
(r 2 + d 0 ) 3 2<br />
Solutions for both the electric fields and forces are plotted in fig.<br />
300, 200, 100V with d 0 = 200µm.<br />
(6.7)<br />
(6.8)<br />
6.14 for voltages of<br />
Energy Considerations of the <strong>Field</strong>-Dipole interaction.<br />
At room temperature the thermal energy given by k B T is of the order of 1 · 10 −21 J. The<br />
energy of one dipole with dipole moment 0.5Debye aligned <strong>to</strong> an electric field of strength<br />
10 6 V/m is G = p · E = 1.7 · 10 −24 J. Thus in the strongest part of the field beneath the<br />
electrode the thermal energy exceeds the energy of a single DPPC molecule.<br />
For the situation with a domain of radius a in the electric gradient field the energy is<br />
given by an integral of the field over all dipoles contained in the domain. For simplicity<br />
the domain is situated at the center of the field r=0:<br />
G =<br />
∫ a ∫ 2π<br />
0<br />
0<br />
rpE z (r)drdφ (6.9)
CHAPTER 6. INDUCED CHANGES IN MONOLAYERS BY ELECTRIC FIELD 56<br />
Fig. 6.14: Solutions with U = -300V,-200V,-100V of the electric field. Left: For both a point charge and<br />
a rod charge approximation. Right: The force acting on a domain is the positive moving forcing domains<br />
away from r=0. The distance from charge <strong>to</strong> monolayer d 0 = 200µm. The dipole moment density of the<br />
lipids in the domain is assumed <strong>to</strong> be 0.5Debye/49Å 2 and domain radius 10µm.<br />
Calculation of G using the rod approximation E z,Rod (r) gives:<br />
∫ a ∫ 2π<br />
(<br />
)<br />
G Rod = rpE z,Rod (r)drdφ = 2πpU −<br />
√a 2 + d 2 0 + d 0<br />
0<br />
0<br />
For the case with the point charge the energy is given [Mohwald1986] as:<br />
∫ a ∫ (<br />
)<br />
2π<br />
1<br />
G Q = rpE z,Q (r)drdφ = 4πpd 0 bU √ − 1<br />
0 0<br />
a2 + d 2 d<br />
0 0<br />
(6.10)<br />
(6.11)<br />
In the case of attraction U=300V, d 0 = 200µm the energy G of a domain of radius<br />
a = 10µm centered at r=0 can be calculated using eq. (6.11) and (6.10) yields respectively<br />
1 · 10 −15 J and 1.6 · 10 −15 J. Both energies are larger than the thermal energy by a fac<strong>to</strong>r of<br />
10 6 clearly shows the favorable centered position of the domain in the field.<br />
It is worthwhile <strong>to</strong> calculate the repulsive force F rep and the related energy W rep of<br />
a domain-domain interaction in the monolayer in presence of the electric gradient field.<br />
Assume that the two domains are equal with the above used parameters a = 10µm and<br />
p = 0.5Debye/49Å 2 . The electric field of a surface normal dipole p 1 at a point r is given<br />
[Griffiths1999]:<br />
1<br />
E dip =<br />
4πɛ 0 r (3(p ′3 1 · r)r − p 1 ) (6.12)<br />
In the monolayer plane p 1 · r = 0.<br />
Thus the radial component of the force p 1 exerted on the other dipole p 2 a distance r ′<br />
away is derived with eq. (6.4):
CHAPTER 6. INDUCED CHANGES IN MONOLAYERS BY ELECTRIC FIELD 57<br />
F 1,2 = 3p 1p 2<br />
r (6.13)<br />
4πɛ 0 r<br />
′4<br />
Now having the two dipoles equal p 1 = p 2 the energy W it takes <strong>to</strong> move p 2 from ∞ <strong>to</strong> a<br />
distance r ′ <strong>to</strong>ward p 1 is:<br />
W rep =<br />
∫ r ′<br />
∞<br />
F 1,2 dr ′ =<br />
p2<br />
4πɛ 0 r ′3 (6.14)<br />
With the shortest possible distance between the domains as 2 times the radius r ′ = 2a, F rep<br />
and W rep are respectively 9.4 · 10 −14 N and 1.3 · 10 −19 J. These indicate that dense packing<br />
of domains are possible in presence of the approximated electric gradient fields.<br />
6.6 Conclusion<br />
An experimental setup has been designed and constructed for electrical manipulation of<br />
monolayers with an electrical gradient field. Drift in the monolayer and evaporation of the<br />
subphase were avoided with the setup. This is fulfilled by an experimental pro<strong>to</strong>col and<br />
user guide.<br />
Successful manipulation of DPPC monolayers was carried out with the final setup. This<br />
includes attraction and repulsion of domains in the monolayer enabling the measurements<br />
of the applied voltage and size of induced area. The relation of applied voltage and induced<br />
area is found <strong>to</strong> be a power law R0 2 = 100 µm2 U. This is valid for both an induced domain<br />
V<br />
cluster and a induced domain free area.<br />
Repulsion and attraction caused by the electric gradient field proves the dipole behavior<br />
of condensed DPPC domains in a monolayer. The direction of these movements agrees<br />
with those predicted by electrodynamic laws with correct signs. A dielectric behavior of<br />
the monolayer that only causes attraction of the domains in<strong>to</strong> the strongest part of the<br />
applied field is not observed. The liquid phase of the monolayer was not observed <strong>to</strong> be<br />
affected by the field.<br />
Condensed domains were observed <strong>to</strong> reorient and have a preferred orientation in the<br />
field which implies an inhomogeneous distribution of the dipoles in DPPC domains.<br />
The models outlined the strong dependence on the vertical component of the dipole<br />
moment but an equilibration radius of the induced area could not be estimated from these.<br />
Experiments and the two approximations agree in fundamentals however an exact calculation<br />
of the force exerted on the domains is not a part of this thesis. Energy calculations<br />
with the model show the possibility of the experimental observations. In presence of the<br />
electric gradient field it can be stated that the energy of a single DPPC lipid is of the order<br />
G = 1.75 · 10 −24 J. At the temperatures used this energy of a single dipole in the field is<br />
much lower than the thermal energy which is of the order of k B T = 1 · 10 −21 J. By this,<br />
single molecular order induced by the applied field is disabled. The s<strong>to</strong>ry is different for<br />
the condensed domains which carry an more or less in-frozen dipole moment. The energy<br />
of a single domain of radius 10µm in the center of the approximated fields is of the order<br />
G Rod ≈ G Q = 1 · 10 −15 J. Compare this energy <strong>to</strong> the energy of two similar domains of the
CHAPTER 6. INDUCED CHANGES IN MONOLAYERS BY ELECTRIC FIELD 58<br />
order W rep = 1.3 · 10 −19 J, a dense domain packing is possible in the center of the field.<br />
Condensation or fusion of domains are not observed in any case. It can then be stated<br />
experimentally and theoretically that in the region of coexistence, a local phase transition<br />
between (LE) and (LC) can be induced in the local gradient field region.
Chapter 7<br />
Summary & Outlook<br />
7.1 Summary<br />
The work presented in this thesis concentrates on the morphology and electrical manipulation<br />
of the coexistence region of DPPC monolayers. DPPC has been chosen because of<br />
its representation in a variety of cell membranes and its excellence as a monolayer model<br />
for membranes at room temperature. Furthermore, it is one of the most studied phospholipids<br />
in literature. Information was obtained with the use of a designed setup for electric<br />
stimulation and the existing technique of a Langmuir trough and Wide field Fluorescence<br />
Microscopy.<br />
The following experimental results are achieved.<br />
• It is shown with the use of DSC measurements that TRITC-DHPE in amounts of<br />
0.2mol% and 0.4mol% has no influence on the melting properties of hydrated multi<br />
lamellar vesicles. Neither the melting temperature nor the width of the melting<br />
transition is affected.<br />
• The powerful combined technique of a WFM and a Langmuir through is used <strong>to</strong><br />
visualize and confirm the morphology of DPPC monolayers on a subphase of 150mM<br />
NaCl with an emphasize on the (LE-LC) coexistence region. In this region the<br />
condensed lipid domains mostly develop a bean shape but also lobed and oddly<br />
shaped domains appear. Isotherms for different temperatures of DPPC monolayers<br />
are obtained expressing phases and transitions <strong>to</strong> a fine degree with a dependency<br />
on temperature comparable with literature.<br />
• A setup for the electric gradient field is build <strong>to</strong> fit in<strong>to</strong> the existing Langmuir-WFM<br />
setup. This is used <strong>to</strong> confirm the results from the Möhwald group. It is found that<br />
a positive charged <strong>to</strong>p electrode causes attraction of condensed lipid domains in the<br />
(LE-LC) region while a negative charged electrode causes repulsion. In both cases a<br />
circular area is created of either condensed domains or empty of domains. These areas<br />
are found <strong>to</strong> grow with the duration time of the field with a decreasing rate of growth.<br />
To quantify the influence of the electrical field on the DPPC monolayer an equilibrium<br />
59
CHAPTER 7. SUMMARY & OUTLOOK 60<br />
radius R 0 of the areas is defined. For the used geometry of the <strong>to</strong>p electrode the<br />
dependency of the areas affected on the applied voltage U is within errors, found <strong>to</strong><br />
follow R0 2 = 100 µm2 U which agrees with the result previously obtained by [Heckl1988]<br />
V<br />
for a different electrode geometry.<br />
Condensed domains were observed <strong>to</strong> reorient and have a preferred orientation in the<br />
field which implies an inhomogeneous distribution of the dipoles in DPPC domains.<br />
See also [Florsheimer1989].<br />
Theoretically estimations of energies show that dense domain packing in the electric<br />
gradient field is possible which agrees with similar estimations by [Mohwald1986].<br />
The state of a single lipid in the liquid expanded phase in the field region is dominated<br />
by thermal motions. The more or less non-interaction of the headgroup agrees with<br />
the free orientation the headgroup which was indicated by melting enthalpy data of<br />
(PCs). This agrees with the observations of field induced movement of domains and<br />
that the liquid expanded phase is unaffected by the field.<br />
It can then be stated experimentally and theoretically that in the region of coexistence,<br />
a local phase transition between (LE) and (LC) can be induced in the local<br />
gradient field region.<br />
The following experiments are performed but not proceeded.<br />
⋆ The experiments with a homogeneous electric field applied across a DPPC monolayer<br />
only show a week effect on the monolayer and no attraction or repulsion of domains.<br />
Such effect must be influenced by the homogeneous field, the fringing field (boundary<br />
field) and the drastic rise of the water level. For these reasons it was terminated but<br />
the raise in water level h iss found <strong>to</strong> obey h ∝ U 2 as in general for dielectrica.<br />
Appendix A.1.<br />
⋆ Direct stimulation of DPPC a monolayer with an AC current between two electrodes<br />
separated by 2mm and detection with a capaci<strong>to</strong>r like setup was also carried out.<br />
This looked promising for a detection of a possible propagating density wave in the<br />
monolayer because the dipole potential of a DPPC monolayer depends on its state.<br />
The detected signals were found <strong>to</strong> be simultaneous with the stimuli. The magnitude<br />
of the signal increased during the formation of the (LE) phase and at higher values<br />
of the lateral pressure a saturation in the signal was reached. For different reasons<br />
this was not reproducible, see Appendix A.2.<br />
All in all the fluorescence method for imaging monolayers combined with a electric<br />
gradient field emphasize the role of the polar head groups of DPPC. A similar influence<br />
of a gradient electric field on a variety of lipids with polar head groups reported in literature<br />
1 highly indicates that the state of a cell membrane containing zwitterionic lipids can<br />
1 DLPE, DMPE and DMPA at pH 11 [Mohwald1986], DPPC [Heckl1988], the mixtures (DMPC:DSPC),<br />
(DLPC:DSPC) and (Sm:Cer) [Wilke2006a]
CHAPTER 7. SUMMARY & OUTLOOK 61<br />
be locally changed in the field region. The question of inspiration for the experimental<br />
work in this thesis ”How does electrical stimulation of a nerve affect the main membrane<br />
components - the lipids” is actually of relevance.<br />
7.2 Outlook<br />
To provide a deeper understanding of the coupling between an electric gradient field and<br />
a monolayer, the effect (induced areas) has <strong>to</strong> be measured at different lateral pressures<br />
at a constant temperature. Since only the domains are affected, the coexistence region<br />
is of interest and the results should obviously be correlated with compressibility of the<br />
monolayer.<br />
In the case of repulsion, the effect is expected <strong>to</strong> decreases <strong>to</strong>ward the transition <strong>to</strong> the<br />
pure (LC) phase but increases <strong>to</strong>ward the transition <strong>to</strong> the (LE).<br />
For the case of attraction, the expectation is reversed. The two effects will then be<br />
equal at the point where the monolayer is covered by an equal amount of domains and<br />
liquid expanded phase.<br />
Conclusive information of the dipole moment of the headgroups of DPPC can be drawn<br />
if an applied gradient electric field on a monolayer consisting of negative charged lipid<br />
DPPG shows no effect. Thus intuitively, the negative charges only feel a force directed<br />
opposite <strong>to</strong> the electrical field. However, if only attraction of DPPG domains occur for<br />
both directions of the field, an induced dipole moment in the lipids must be stated.<br />
7.2.1 Experimental Extensions<br />
The setup for the gradient field presented in this work suffers from the lack of visualizing<br />
the whole area affected by the field in one image. To achieve this one should use an objective<br />
of lower magnification (5x or 10x) that has a large working distance which is necessary<br />
for location of the <strong>to</strong>p electrode. A disadvantage of such an objective is observation of<br />
smal changes of the domain shapes.<br />
Estimation of the force of the gradient field is only able if the <strong>to</strong>p electrode used has<br />
a genuine geometry that allows a ”correct” approximation. Instead of a <strong>to</strong>p electrode, an<br />
insulated thin wire sticking through the monolayer could be used which allows a numerical<br />
calculation of the force with Bessel functions, see [McConnel1995]. In that case the<br />
reduction of he field caused by the insulating material has <strong>to</strong> be calibrated.<br />
7.2.2 Bilayer Systems<br />
In general bilayers resemble cell membranes better than monolayers do and an extension of<br />
applied electrical fields <strong>to</strong> bilayers is obvious. One can study planar bilayers which are often
CHAPTER 7. SUMMARY & OUTLOOK 62<br />
solid supported and one can prepare vesicles and use confocal microscopy [Feigenson1999].<br />
The observed electric gradient field and domain interaction in DPPC monolayer is in<br />
essence kinetic and the method for studying such an interaction in bilayers has <strong>to</strong> allow<br />
dynamics. The effects of applied electric fields across membranes have in literature focused<br />
on the gaiting of ions across biological membranes (patch-clamp) or across artificial bilayers<br />
measured with the black lipid membrane technique (BLM). A deeper understanding of<br />
the mechanics of a membrane consisting of lipids with polar headgroups is not available.<br />
However, measurements of bending modulus of lipid membranes show a maximum at the<br />
melting temperature and a decrease outside the melting transition, see [Marsh2006]. Both<br />
a gradient and a homogeneous field might induce a bending of a membrane if it is in a<br />
state with two coexisting phases, solid ordered and liquid disordered. The experimental<br />
observation of an in-frozen dipole moment in the gel domains and the unaffected liquid<br />
phase is used <strong>to</strong> sketch such induced bending in fig. 7.1. A homogeneous electric field<br />
across the bilayer simply forces the gel domains (the dipoles) in direction of the field lines<br />
and induces a bending of the membrane. Similar <strong>to</strong> the monolayer experiment, a gradient<br />
field attracts the gel domains e.g on the lower leaflet <strong>to</strong>ward the strongest part of the field<br />
and repels these on the upper leaflet. The degree of bending (radius of curvature) depends<br />
on the voltage applied. Thus, for a electric field on the order of the membrane field of the<br />
order 100mV/5nm = 2·10 7 V/m a dramatic bending is expected.<br />
Fig. 7.1: The idea of the in-frozen dipole moments of the gel domains as found in the DPPC monolayer<br />
studies are here transfered <strong>to</strong> bilayers. These are made of e.g. DLPC:DPPC at a ratio of 67:33 which are<br />
known <strong>to</strong> form two coexisting phases, a liquid disordered and a solid ordered. Possible effects of an applied<br />
down warded electrical field E is sketched for a gradient and a homogeneous field. The directions of the<br />
in-frozen dipole moments are indicated. left: The gradient field is parallel <strong>to</strong> the ordered dipoles of the<br />
lower leaflet and force these <strong>to</strong>ward the center of the field similar <strong>to</strong> the effect observed with monolayers.<br />
The direction of the dipoles in the upper leaflet is antiparallel <strong>to</strong> the field and the domains with an in-frozen<br />
dipole moment are repelled from the center of the field. right: A homogeneous field is applied across the<br />
bilayer. In this case the force on the dipoles is not a gradient force but the in-frozen dipoles are forced<br />
in the direction of the field. This system is similar that of a black lipid membrane where the ionic media<br />
on both sides of the membrane acts as conducting plates. In both of the sketched cases a bending of the<br />
membrane is possible. The degree of bending (radius of curvature) has <strong>to</strong> depend on the voltage applied.
Appendix A<br />
A.1 Effect of Homogeneous <strong>Field</strong>.<br />
Fig. A.1: Left: Schematic of experimental setup for homogeneous E field across a monolayer. At the<br />
boundaries the field is a gradient field (fringing field) . Right: Attraction of dielectric water and raise of<br />
water level.<br />
Effects of a homogeneous electric field applied across DPPC monolayers were investigated<br />
with a setup sketched in fig. A.1 left. The field was produced between the 150mM<br />
NaCl subphase and a 2 × 2cm Cu plate 2.5mm above monolayer. Parallel or anti parallel<br />
aligning of the dipoles in the monolayer <strong>to</strong> the field was thought change the electrostatic<br />
repulsion between the polar molecules. Such might influence domain shapes and repulsive<br />
forces between domains.<br />
Before fields wee applied monolayers were compressed in<strong>to</strong> and a lateral pressure of<br />
4.5N/m at a temperature 0f 21 o C. Normal developed domains were mostly observed.<br />
<strong>Applied</strong> Voltages <strong>to</strong> the Cu plate and the grounded subphase were of magnitudes p ±<br />
500, 100, 1500V resulting in field strengths of the order 10 5 V/m.<br />
Movements of domains were not observed in any cases. For very long time durations<br />
of the field, small changes in the distribution of domain were observed but only in one<br />
experiments. What was alway observed was a significant raise of the water level of several<br />
microns depending on the voltage applied but independent on the field direction fig. A.1<br />
63
APPENDIX A. 64<br />
right. This was also the case with a monolayer spread. Thus, the effect is explained by<br />
the inhomogeneous field at the boundaries of the field affecting the subphase which have<br />
a dielectric behavior even in presence of sodium and chloride ions. It is then comparable<br />
<strong>to</strong> the attractive force on a dielectrica between two capaci<strong>to</strong>r plates for which F ∝ V 2 .<br />
The rarely observed change of the monolayer cannot be interpreted as a single effect<br />
but are influenced by the homogeneous field, the inhomogeneous boundary field, the rise<br />
of the water level. However freely aligning of the water molecules is demonstrated which<br />
is in contrast <strong>to</strong> the in frozen dipole moment of lipid domains observed in this work.<br />
A.2 Direct Stimulation of DPPC <strong>Monolayers</strong><br />
Direct stimulation of DPPC a monolayer on 150mM<br />
NaCl with an AC current between two electrodes of<br />
silver separated by 2mm and detection with two<br />
plates on each side of the monolayer, see fig. A.2.<br />
the voltage difference was measured between these<br />
two plates. It would then be possible <strong>to</strong> measure<br />
a build up of charges of the plates is then caused<br />
by density wave that passes the between the plates.<br />
Stimulus was performed for 50 micro seconds: with<br />
(0, 0.2, 0.5, 1, 2, and 20mA) at different values<br />
of the lateral pressure (2, 3, 4, 5, 6, 8, 10 and<br />
31mN/m). In the last runs (lowest pressure about<br />
2mN/m) the stimulation signal is only detected at<br />
and above 2mA, and not at 1mA. Data presented in<br />
Fig. A.2: Flat Cu electrodes, c:a 0.5 x 0.5<br />
cm (squared) were used for detection. The<br />
minus-pole electrode was placed ca 0.5-1 mm<br />
under the water surface, the plus pole (red)<br />
was placed ca 1 mm up above the interfase.<br />
These were on a lack-isolated Cu-wire (soldered<br />
<strong>to</strong> the plates).<br />
fig. A.3 are all original data (i.e. non-modified) from Scope and no background subtraction<br />
has been performed. The reading time was about 60ms which was followed by an 10ms<br />
equilibration period. The curves are averages of 1024 stimuli-recordings.<br />
The detected signals were found <strong>to</strong> be simultaneous with the stimuli. The magnitude<br />
of the signal increased during the formation of the (LE) phase. At higher values of the<br />
lateral pressure a saturation in the signal was reached. Note also that a stronger stimuli<br />
were needed <strong>to</strong> detect a signal at lateral pressures in the (LE) phase. For different reasons<br />
this was not reproducible. Measurements of the conductivity in both DPPC monolayers<br />
and subphases neverthe less indicates an influence by the monolayer-water interface, see<br />
[Morgan1991] and related work.<br />
Note on pressure. Because of primitive experimental setup, we had some evaporation<br />
and unstable temperature over the long time of sample collection. For these reasons, the<br />
pressure determination may be inaccurate.<br />
Technicalities:<br />
Sample and setup description: DPPC (4mg) was dissolved in 4mL of Chloroform/Methanol<br />
(1:10 v/v%) at RT <strong>to</strong> give a 1mg/ml DPPC S<strong>to</strong>ck solution.
APPENDIX A. 65<br />
Flat Cu electrodes, c:a 0.5 x 0.5 cm (squared) were used for detection. The minus-pole<br />
electrode was placed ca 0.5-1 mm under the water surface, the plus pole (red) was placed<br />
ca 1 mm up above the interfase. These were on a lack-isolated Cu-wire (soldered <strong>to</strong> the<br />
plates). A grounding wire (Cu as well) was arranged for, by a connection <strong>to</strong> the water<br />
phase (at the one end and <strong>to</strong> the grounded shielding of the detection Cu electrodes at the<br />
other end). The distance between the two stimulus electrodes was c:a 0.5 cm. The distence<br />
between the stimulus electrodes and sensor electrodes was c:a 3-4 cm The electrodes were<br />
located in the middle of tray, in a perpendicular direction <strong>to</strong> the tray, and the two traypressure-lurgs!<br />
Data recordings were arranges <strong>to</strong> provide averages of 1024 readings (sweeps)<br />
per stimulis strength (provided in mA below). Data was collected at different pressure (in<br />
a direction from high pressure <strong>to</strong> low, after having recorded a phase diagram from low P<br />
<strong>to</strong> high P.<br />
DirStimulation/DirStim0x5mA.jpg<br />
Fig. A.3: Sketch of the .<br />
A.3 Recipe for Trough Handling<br />
Profound rinse of a dirty trough.<br />
S<strong>to</strong>re the trough in tap water and the soap Deconex 10% at least over night.<br />
Rubbing with ace<strong>to</strong>ne, Ethanol and water until visible dirt is removed.
APPENDIX A. 66<br />
Sonicate in Ethanol 10% for 2x 15 minutes and rinse trough in MQ water.<br />
Sonicate in MQ water for 10-15 minutes and sonicate inn Ethanol (99,9%) f6r 15 minutes.<br />
Sonicate in MQ water for 5 minutes and rinse in MQ water.<br />
Finnish with compleely drying with N 2 .<br />
Normally rinse of trough before experiment<br />
Flush the trough under hot tap water for 15 minutes <strong>to</strong> remove dust and enlarge the trough<br />
and then lower the steel ring with the coverglass in<strong>to</strong> the trough used for microscopy.<br />
To remove agrigated lipids and substances rub the trough and especially the corners and<br />
branches with Methanol and be careful not <strong>to</strong> <strong>to</strong>uch the coverglass.<br />
Rinse <strong>to</strong>tally with Ethanol (99,9%) and use MQ water for the final rinse. Use N 2 for drying.<br />
Very important: no Ethanol must be left in the trough, else it would mix with the ssubphase.<br />
Clean the needle for the tensiometer by flushing with ethanol on the tip which will be<br />
in contact with the monolayer and subphase. Finnish with MQ water and dry with N 2 .<br />
Use a gas burner <strong>to</strong> heat the tip until the flame is normal blue. NOTE that an exponentially<br />
drop in pressure is often caused by evaporation of water from this needle if is’s not dry.<br />
A.4 Glue a coverglass on<strong>to</strong> the steel ring<br />
Remove old broken glass with a steel scraper. The glue used is extremely hard.<br />
The laze way:<br />
S<strong>to</strong>re the ring with glass in ace<strong>to</strong>ne in a enclosed container over night in the fume cupboard...<br />
The hard way:<br />
S<strong>to</strong>re the ring with glass in ace<strong>to</strong>ne and a thorough sonication has <strong>to</strong> be done with the<br />
powerfull sonicater for 15 minutes...<br />
...Continued:<br />
Use a steel scraper <strong>to</strong> dredge the rest of the glass and rub with Ace<strong>to</strong>ne <strong>to</strong> remove glass<br />
dust. (If not all glass has been removed repeat the sonicating and rubbing once more).<br />
When all glass is removed use a fine sand paper <strong>to</strong> make the steel a little rough <strong>to</strong> increase<br />
the effect of the glue.<br />
A finish rinse before gluing has <strong>to</strong> bee done with Ace<strong>to</strong>ne and Ethanol and <strong>to</strong>tally drying.<br />
Carefulness has <strong>to</strong> be taken under the gluing process if a successful result should be reached.<br />
I.e. no glue or fingerprints on the covergass or on the rest of the steel ring.
APPENDIX A. 67<br />
A clean coverglass has <strong>to</strong> be prepared before gluing.<br />
Put a narrow strobe of glue on the steel ring. Use only a very small amount! Heat the ring<br />
<strong>to</strong> 30 ◦ C which will make the glue homogeneous.<br />
Place the clean coverglass on the steel ring. (There is only one try).<br />
Harden the glue in UV light for 2 fours and 2 hours with the bot<strong>to</strong>m up.<br />
After that small amounts of Ace<strong>to</strong>ne has <strong>to</strong> be used <strong>to</strong> remove extra glue which else would<br />
mix with the subphase. Dry completely with N 2 .<br />
The glue has <strong>to</strong> solidify for 4-5 days at room temperature.<br />
A.5 Locating the <strong>to</strong>p electrode<br />
The subphase used is here named water.<br />
The WD of the x40 air objective is 2.5mm which make it suitable for focusing above the<br />
water level.<br />
1) Focus on the cover glass in the trough using the backward reflected beam and move the<br />
trough down 200µm.<br />
2) Place the holder with the Pt electrode in the subphase behind the barrier.<br />
3) Clean the water surface as usual leaving the barriers at the outer position and suck a<br />
little more water of than the 200µm water level.<br />
4) Place the electrode and holder away from the focus area and ensure the electrode don’t<br />
come in<strong>to</strong> <strong>to</strong>uch with the water.<br />
5) Connect the electrode and adjust the hight of the electrode by lowering it until a reflection<br />
can be seen in the water. NOT further.<br />
6) Move the holder with the electrode side wise in<strong>to</strong> focus so the laser beam illuminates<br />
the electrode tip and use the acrylic cover box.<br />
7) Move the trough further down by 250µm and locate the tip by moving the focus horizontally.<br />
Focusing is done like in 1). A nearly round spot is seen when the tip is in focus.<br />
8) Focus vertically and you have the distance from the electrode tip <strong>to</strong> the cover glass.<br />
Check the water level. Small amounts of water can be added.
Bibliography<br />
[Abbott1960] B. C. Abbott. Heat production in nerve and electric organs. J. og Gen.<br />
Physiol., pages 119 – 127, 1960.<br />
[An<strong>to</strong>nov1980] V. E. An<strong>to</strong>nov, A. A. Petrov, V. V. andMolnar, D. A. Predvoditelev, and<br />
A. S. Ivanov. The appearence of single-ion channels in unmodified lipid<br />
bilayer membranes at the phase transition temperature. Nature, 283:585 –<br />
588, 1980.<br />
[Benvegnu1992] D. J. Benvegnu and H. McConnell. Line tension between liquid domains<br />
in lipid monolayer. J. Phys. Chem., 96:6820 – 6840, 1992.<br />
[Bil<strong>to</strong>nen1993] R. Bil<strong>to</strong>nen and D. Lichtenberg. The use of differential scanning calorimetry<br />
as a <strong>to</strong>ol <strong>to</strong> characterize liposome preperations. Chemistry and Physics of<br />
<strong>Lipid</strong>s, 64:129 – 142, 1993.<br />
[Blodgett1934] K. B. Blodgett. J. Amer. Chem. Soc., 56:495, 1934.<br />
[Brockman1994] H Brockman. Dipole potential of lipid membranes. Chemistry and Physics<br />
of <strong>Lipid</strong>s, 73:57–79, 1994.<br />
[Clarke2001] R. J. Clarke. The dipole otential of phospolipid membranes and methods for<br />
its detection. Adwances in Colloid Interface Science, 89-90:263 – 281, 2001.<br />
[Davies1955] J. T. Davies and E. Ridael. Interfacial potentials. Can. J. Chem., 33:947 –<br />
960, 1955.<br />
[Demchak1974] R. J. Demchak and T. Fort. Surface dipole moments of close-packed inionized<br />
monolayers at the air-water interface. J. Colloid Interface Sci., 46:191<br />
– 2002, 1974.<br />
[Discher2002] B. M. Discher, K. M. Maloney, D. W. Grainger, and S. B. Hall. Effect og<br />
neutral lipids on coexisting phases in monolayers of pulmonary surfactant.<br />
Biophys. Chem., 101-102:333 – 345, 2002.<br />
[Feigenson1999] G. W. Feigenson, J. Korlach, P. Schwille, and W. W. Webb. Characterization<br />
of lipid bilayer phases by confocal microscopy and fluorescence<br />
correlation spectroscopy. Proc. Natl. Acad. Sci., 96:8461 – 8466, 1999.<br />
68
BIBLIOGRAPHY 69<br />
[Flewelling1986] R. F. Flewelling and W. L. Hubbell. Hydrophobic ion interactions with<br />
membranes. thermodynamic analysis of tetraphenylphosphonium binding <strong>to</strong><br />
vesicles. Biophys. J., 49:531 – 540, 1986.<br />
[Florsheimer1989] M. Flörsheimer and H. Möhwald. Development of equilibrium domain<br />
shapes in phosholipid monolayers. Chem. and Phys. of <strong>Lipid</strong>s, 49:231 – 241,<br />
1989.<br />
[Florsheimer1990] M. Flörsheimer and H. Möhwald. Growth of large liquid crystaline<br />
domains of phospholipids at air-water interface. Thin Solid Films, 189:379 –<br />
387, 1990.<br />
[Franks1976] N. P. Franks. Structural analysis of hydrated egg lectidin and cholesterol<br />
bilayers i. x-ray diffraction. J. Mol. Biol., 100:345 – 358, 1976.<br />
[Gaines1966] Geroge L. Gaines. Insoluble <strong>Monolayers</strong> At Liquid-Gas Interface. Interscience<br />
Publishers, John Wiley & Sons, Inc., 1966.<br />
[Gennis1989] R. B. Gennis. Biomembranes. Molecular Structure and Function. Springer,<br />
1989.<br />
[Griffiths1999] David. J. Griffiths. Introduction <strong>to</strong> Electrodynamics. Prentice Hall, 1999.<br />
[Hardy2006] N. J. Hardy, T. H. Richardson, and F. Grunfeld. Minimising monolayer<br />
collapse on langmuir troughs. Colloids and Surfaces A, 284-285:202 – 206,<br />
2006.<br />
[Hauser1981] H. Hauser, r I Pasche, Pearson R. E., and l S. Sundel. Prefered conformation<br />
and molecular packing of phosphatidylethanolamine and phosphatidylcholine.<br />
Biochemica et Biophysica Acta, 650:21–51, 1981.<br />
[Hazel1979] J. R. Hazel. Influence of thermal acclimation on membrane lipid composition<br />
of rainbow trout liver. Am. J. Physiol., 287:633 – 641, 1979.<br />
[Heckl1988] W. M. Heckl, A. Miller, and H. Möhwald. <strong>Electric</strong>-field-induced domains<br />
movement in phospholipid monolayers. Thin Solid Films, 159:125 – 132,<br />
1988.<br />
[Heimburg1998] T. Heimburg. Mechanical aspects of membrane thermodynamics. estimation<br />
of the mechanical properties of lipid membranes close <strong>to</strong> the chain<br />
melting transition from calorimetry. Biochem. Biophys. Acta, 1415:147 – 162,<br />
1998.<br />
[Heimburg2005] T. Heimburg and A. D. Jackson. On soli<strong>to</strong>n propagation in biomembranes<br />
and nerves. Proc. Natl. Acad. Sci., 102:9790 – 9795, 2005.<br />
[Heimburg2007] T. Heimburg. Thermal Biophysics of <strong>Membrane</strong>s. WILEY-VCH, 2007.
BIBLIOGRAPHY 70<br />
[Hodgkin1952] A. Hodgkin and A. Huxley. A quantitative description of membrane current<br />
and its application <strong>to</strong> conduction and excitation in nerve. J. of Physiology,<br />
117:500 – 544, 1952.<br />
[Kandel2000] E. R. Kandel, J. H. Sxcwartz, and T. M. Jesseull.<br />
Science. McGraw-Hill, 2000.<br />
Principles Of Neural<br />
[Kjaer1987] K. Kjaer, J. Als-Nielsen, C. A. Helm, L. A. Lauxhuber, and Möhwald. Ordering<br />
in lipid monolayers studied by synchrotron x-ray diffraction and florescence<br />
microscopy. Phys. Rev. Lett., 58:2224, 1987.<br />
[Kroon1989] A. I. P. M. de Kroon, J. de Gier, and B. de Kruijff. Association of synthetic<br />
model peptides with phosphalipid vesicles induced by a membrane potential.<br />
Biochem. Biophys. Acta, 981:371 – 373, 1989.<br />
[Langmuir1917] I. Langmuir. The construction and fundamental properties of solids and<br />
liquids part ii liquids. J. Am. Chem. Soc, 39:1848, 1917.<br />
[Loesche1984] M. Lösche and H. Möhwald. Inverted fluorescence microscopy. Rev. Sci.<br />
Instrum., 55:1968, 1984.<br />
[Losche1983] M. Lösche, E. Sackmann, and H. Möhwald. A fluorescence microscopic study<br />
concerning the phase-diagram of phospholipids. Ber. Busenges. Phys. Chem.,<br />
87:848 – 852, 1983.<br />
[Marsh2006] D. Marsh. Elastic curvature constants of lipid monolayers and bilayers.<br />
Chem. and Phys.of <strong>Lipid</strong>s, 144:146 – 159, 2006.<br />
[McConnel1995] H. M. McConnel and K. Y. C. Lee. Effect of electric field gradients on<br />
lipid monolayer membranes. Biophys. J., 68:1740 – 1751, 1995.<br />
[McConnell1990] H. M. McConnell, P. A. Rice, and D. J. Bervegnu. Brownian motion of<br />
lipid domains in electrostatic traps in monolayers. J. Phys. Chem., 94:8965<br />
– 8968, 1990.<br />
[McConnell1993] H. M. McConnell. Elementary theory of brownian motion of trapped<br />
domains in lipid monolayers. Biophys. J., 64:577 – 580, 1993.<br />
[Mellier1989] A. Mellier. Infared study of phospholipid hydration. new thermodynamic<br />
data about the main phase transition of saturated phosphatidylcholine water<br />
multilayers. Chem. and Phys. of <strong>Lipid</strong>s, 51:23 – 29, 1989.<br />
[Mohwald1986] H. Möhwald and A. Miller. Collecting two-dimensional phosphalipid crystals<br />
in inhomogeneous electric fields. Europhys. Lett., 2:67 – 74, 1986.<br />
[Mohwald1998] H. Möhwald, J. B Li, R Miller, and D. Vollhard. Spreading concentration<br />
effect on the morphology of phospholipid monolayers. Thin Solid Films,<br />
pages (327–329) 84–86, 1998.
BIBLIOGRAPHY 71<br />
[Mohwald1999] H. Möhwald, P. Dutta, and V. M Kanagar. Structure and phase transitions<br />
in langmuir monolayers. Review of the Modern Pysics, 71 (3), 1999.<br />
[Morgan1991] H. Morgan, D. M. Taylor, and N. Oliveria. Pro<strong>to</strong>n transport at the<br />
monolayer-water interface. Biochem.Biophys. Acta, 1062:149 – 156, 1991.<br />
[Mouritsen2007] O. Mouritsen, T. Bjø rnholm, and L. K. Nielsen. Thermodynamic and<br />
real-space structural evidence of a 2d critical point in phospholipid monolayers.<br />
Langmuir, 23:11684 – 11692, 2007.<br />
[Nakahara2005] H. Nakahara, S. Nakamua, S. Lee, G. Sugihara, and O. Shibata. Inluence<br />
of a new amphiphili peptide with phospholipid monolayers at the air-water<br />
interface. Colloids and Surfaces A, 270-271:52 – 60, 2005.<br />
[Napolitano1967] L. Napolitano, F. LeBaron, and J Scaletti. Preservation of myelin lamellar<br />
structures in the absence of lipid. J. Cell Bio., 94:817 – 826, 1967.<br />
[Neher1976] E. Neher and B. Sakmann. Single-channel currents recorded from membrane<br />
of denervated frog muscle fibers. Nature, 260:799 –802, 1976.<br />
[Nyquist2002] H. Nyquist. Certain <strong>to</strong>pics intelegraph transition theory. Proceedings of the<br />
IEEE, 90 (2):280 – 305, 2002.<br />
[Palush2002] M. Palush. <strong>Electric</strong>al properrties of free surface of water and aqueous solutions.<br />
Adwanced Colloid and Interface Sci., 84:27 – 45, 2002.<br />
[Parfenyuk2002] V. I. Parfenyuk. Surface potential at the gas-aqueous solution interface.<br />
Colloid J., 64:588 – 595, 2002.<br />
[Pink1982] D. A. Pink and A. Georgallas. Phase transitions in monolayers of saturated<br />
lipids. exact resuts and monte carlo simulations. J. of Colloid and Interface<br />
Sci., 89 (1):107 – 116, 1982.<br />
[Pockels1891] A. Pockels. Nature, 43:437, 1891.<br />
[Rayleigh1879] Rayleigh. Investigations in optics with special reference <strong>to</strong> the spectroscope.<br />
resolving or seperating power of optical instruments. Phil. Mag., 8:261 – 274,<br />
1879.<br />
[Rayleigh1889] Rayleigh. Philos. Mag., 48:321, 1889.<br />
[Russel1975] E. J. Russel, H. Bruce, and H. C. Andersen. A theory of the chain melting<br />
phase transition of aqeous phospholipid dispersions. Proc. Nat. Acad. Sci.<br />
USA, 72 No. 10:3993 – 3997, 1975.<br />
[Sackmann1995] E. Sackmann. Physical basis of self organization and function of membranes:<br />
Physics of Vesicles. 1995.
BIBLIOGRAPHY 72<br />
[Sax<strong>to</strong>n1987] M. J. Sax<strong>to</strong>n. Lateral diffusion in an archipelago - the distance dependence<br />
of the diffusion constant. Biophysical Journal, 51(2):A542–A542, 1987.<br />
[Shapovalov1998] V. L. Shapovalov. Interaction of dppc monolayer at air-water interface<br />
with hydrophobic ions. Thin Solid Films, 327 - 329:599 – 602, 1998.<br />
[Skoog1982] Douglas A. Skoog and Donald m West. Fundamentals of Analytical Chemistry.<br />
Saunders College Publishing, 1982.<br />
[Tasaki1939] I Tasaki. <strong>Electric</strong> stimulation and the excita<strong>to</strong>ry process in the nerve fiber.<br />
Amer. J. Physiol., 125:380 – 395, 1939.<br />
[Tasaki1980] I. Tasaki and K. Iwasa. Mechanical changes in giant axons associated with<br />
production of action potentials. Biochem. and Biophys. Research Communications,<br />
95(3):1328 – 1331, 1980.<br />
[Tasaki1989] I. Tasaki, K. Kusano, and P. M. Byrne. Rapid mechanical and thermal<br />
change in the garfish olfac<strong>to</strong>ry nerve associated with propagated impulse.<br />
Biophys. J., 55:1033 – 1040, 1989.<br />
[Tasaki1992] I. Tasaki and P. M. Byrne. Heat production associated witha propagated<br />
impulse in the bullfrog myelinated nerve fibers. Jpn. J. Physiol., 42:805 –<br />
813, 1992.<br />
[Tasaki1999] I. Tasaki. Rapd structural changes in nerve fibers and cells associated with<br />
teir excita<strong>to</strong>ry processes. Jpn. J. of Physiol., 49:125 – 138, 1999.<br />
[Taylor2000] D. M Taylor. Developments in the theoretical modelling an experimental<br />
measurement of the surface potential of ordered monolayers. Adwances in<br />
Colloid and Interface Sci., 87:183 – 2003, 2000.<br />
[Teissie1994] J. Teissi, N. Denocurt, and P. Tancrde. The main transition of dipalmi<strong>to</strong>ylphosphatidylcholin.e<br />
monolayers: A liquid expanded <strong>to</strong> solid condensed<br />
high order transformation. Biophys. Chem., 49:153 – 162, 1994.<br />
[Vanderlick1998] T. K. Vanderlick and C. W. McConlogue. <strong>Monolayers</strong> with one components<br />
of variable solubility: Studies of lysophosphocholine/dppc mixtures.<br />
Langmuir, 14:6556 – 6562, 1998.<br />
[Vogel1988] V. Vogel and D. Möbius. Local surface potentials and electric dipole moments<br />
of lipid monolayers: Contribution of the water/lipid and the lipid/air<br />
interface. Journal of Colloid and Interface Science, 129 (2):408 – 420, 1988.<br />
[Volhardt2006] D. Volhardt. Nucleation in monolayers. Advance in Colloid and Interface<br />
Science, 123-126:173 –188, 2006.
BIBLIOGRAPHY 73<br />
[VonTscharner1981] V. Von Tscharner and H M. McConnell. An alternative view of phospholipid<br />
phase behavior at the air-water interface. microscope and film balance<br />
studies. Biopfys. J., 36 (2):409 – 419, 1981.<br />
[Wilke2006] N. Wilke, S. A. Dassie, E. P. M. Levia, and B. Maggio. Externally applied<br />
electric fields on immiscible lipid monolayers: Repulsion between condensed<br />
domains precludes domain migration. Langmuir, 22:9664 – 9670, 2006.<br />
[Wilke2006a] N. Wilke and B. Maggio. Effect of externally applied electric fields on the<br />
surface <strong>to</strong>pography of ceramide-enriched domains in mixed monolayers with<br />
sphingomyelin. Biophys. Chem., 122:36 – 42, 2006.
BIBLIOGRAPHY 74