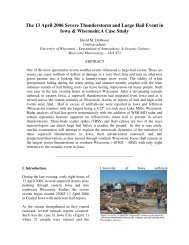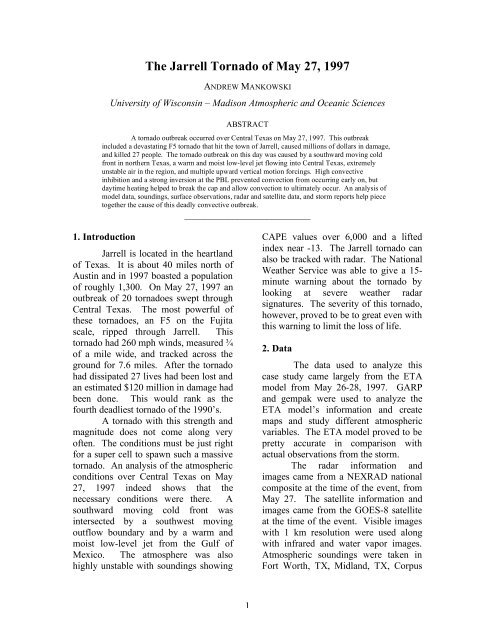
The Jarrell Tornado of May 27, 1997 - Atmospheric and Oceanic ...
The Jarrell Tornado of May 27, 1997 - Atmospheric and Oceanic ...
The Jarrell Tornado of May 27, 1997 - Atmospheric and Oceanic ...

You also want an ePaper? Increase the reach of your titles
YUMPU automatically turns print PDFs into web optimized ePapers that Google loves.
<strong>The</strong> <strong>Jarrell</strong> <strong>Tornado</strong> <strong>of</strong> <strong>May</strong> <strong>27</strong>, <strong>1997</strong><br />
ANDREW MANKOWSKI<br />
University <strong>of</strong> Wisconsin – Madison <strong>Atmospheric</strong> <strong>and</strong> <strong>Oceanic</strong> Sciences<br />
ABSTRACT<br />
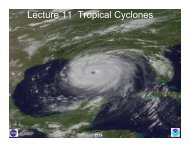
A tornado outbreak occurred over Central Texas on <strong>May</strong> <strong>27</strong>, <strong>1997</strong>. This outbreak<br />
included a devastating F5 tornado that hit the town <strong>of</strong> <strong>Jarrell</strong>, caused millions <strong>of</strong> dollars in damage,<br />
<strong>and</strong> killed <strong>27</strong> people. <strong>The</strong> tornado outbreak on this day was caused by a southward moving cold<br />
front in northern Texas, a warm <strong>and</strong> moist low-level jet flowing into Central Texas, extremely<br />
unstable air in the region, <strong>and</strong> multiple upward vertical motion forcings. High convective<br />
inhibition <strong>and</strong> a strong inversion at the PBL prevented convection from occurring early on, but<br />
daytime heating helped to break the cap <strong>and</strong> allow convection to ultimately occur. An analysis <strong>of</strong><br />
model data, soundings, surface observations, radar <strong>and</strong> satellite data, <strong>and</strong> storm reports help piece<br />
together the cause <strong>of</strong> this deadly convective outbreak.<br />
__________________________<br />
1. Introduction<br />
<strong>Jarrell</strong> is located in the heartl<strong>and</strong><br />
<strong>of</strong> Texas. It is about 40 miles north <strong>of</strong><br />
Austin <strong>and</strong> in <strong>1997</strong> boasted a population<br />
<strong>of</strong> roughly 1,300. On <strong>May</strong> <strong>27</strong>, <strong>1997</strong> an<br />
outbreak <strong>of</strong> 20 tornadoes swept through<br />
Central Texas. <strong>The</strong> most powerful <strong>of</strong><br />
these tornadoes, an F5 on the Fujita<br />
scale, ripped through <strong>Jarrell</strong>. This<br />
tornado had 260 mph winds, measured ¾<br />
<strong>of</strong> a mile wide, <strong>and</strong> tracked across the<br />
ground for 7.6 miles. After the tornado<br />
had dissipated <strong>27</strong> lives had been lost <strong>and</strong><br />
an estimated $120 million in damage had<br />
been done. This would rank as the<br />
fourth deadliest tornado <strong>of</strong> the 1990’s.<br />
A tornado with this strength <strong>and</strong><br />
magnitude does not come along very<br />
<strong>of</strong>ten. <strong>The</strong> conditions must be just right<br />
for a super cell to spawn such a massive<br />
tornado. An analysis <strong>of</strong> the atmospheric<br />
conditions over Central Texas on <strong>May</strong><br />
<strong>27</strong>, <strong>1997</strong> indeed shows that the<br />
necessary conditions were there. A<br />
southward moving cold front was<br />
intersected by a southwest moving<br />
outflow boundary <strong>and</strong> by a warm <strong>and</strong><br />
moist low-level jet from the Gulf <strong>of</strong><br />
Mexico. <strong>The</strong> atmosphere was also<br />
highly unstable with soundings showing<br />
CAPE values over 6,000 <strong>and</strong> a lifted<br />
index near -13. <strong>The</strong> <strong>Jarrell</strong> tornado can<br />
also be tracked with radar. <strong>The</strong> National<br />
Weather Service was able to give a 15-<br />
minute warning about the tornado by<br />
looking at severe weather radar<br />
signatures. <strong>The</strong> severity <strong>of</strong> this tornado,<br />
however, proved to be to great even with<br />
this warning to limit the loss <strong>of</strong> life.<br />
2. Data<br />
<strong>The</strong> data used to analyze this<br />
case study came largely from the ETA<br />
model from <strong>May</strong> 26-28, <strong>1997</strong>. GARP<br />
<strong>and</strong> gempak were used to analyze the<br />
ETA model’s information <strong>and</strong> create<br />
maps <strong>and</strong> study different atmospheric<br />
variables. <strong>The</strong> ETA model proved to be<br />
pretty accurate in comparison with<br />
actual observations from the storm.<br />
<strong>The</strong> radar information <strong>and</strong><br />
images came from a NEXRAD national<br />
composite at the time <strong>of</strong> the event, from<br />
<strong>May</strong> <strong>27</strong>. <strong>The</strong> satellite information <strong>and</strong><br />
images came from the GOES-8 satellite<br />
at the time <strong>of</strong> the event. Visible images<br />
with 1 km resolution were used along<br />
with infrared <strong>and</strong> water vapor images.<br />
<strong>Atmospheric</strong> soundings were taken in<br />
Fort Worth, TX, Midl<strong>and</strong>, TX, Corpus<br />
1
Christi, TX, <strong>and</strong> Del Rio, TX throughout<br />
the duration <strong>of</strong> the event. <strong>The</strong>se<br />
soundings helped to show the areas <strong>of</strong><br />
instability <strong>and</strong> they were used to analyze<br />
actual atmospheric conditions<br />
throughout the event. Additionally, data<br />
archived from the SPC <strong>and</strong> NWS was<br />
also used to help derive, analyze, <strong>and</strong><br />
explain the existence <strong>of</strong> these storms.<br />
3. Synoptic Overview<br />
<strong>The</strong> main synoptic feature over<br />
Central Texas on <strong>May</strong> <strong>27</strong>, <strong>1997</strong> was a<br />
cold front. Figures 1a-d show 850 mb<br />
frontogenesis <strong>and</strong> temperatures at 6Z on<br />
the <strong>27</strong> th <strong>and</strong> 12Z on the <strong>27</strong> th . <strong>The</strong>se<br />
figures show the location <strong>of</strong> the cold<br />
front over Central Texas <strong>and</strong> its<br />
southward movement. A gradient <strong>of</strong> 15°<br />
C from the panh<strong>and</strong>le to Central Texas<br />
define this cold front at 12Z. <strong>The</strong><br />
figures show frontogenesis is occurring<br />
at this time. This front is not that strong,<br />
but it does provide enough forcing to<br />
help the convection occur in the highly<br />
unstable atmosphere over Central Texas.<br />
<strong>The</strong> upper level jet streak associated<br />
with this front is not particularly strong.<br />
Model analysis shows about 50 to 60<br />
knot easterly winds blowing over the<br />
region. Frontogenesis creates vertical<br />
motions. Martin (2006) explains that<br />
horizontal advection increases the<br />
magnitude <strong>of</strong> the temperature gradient,<br />
which subsequently causes an increase<br />
in wind shear <strong>and</strong> the jet core wind<br />
speed. <strong>The</strong> more intense jet results in an<br />
increase in vorticity. This increased<br />
vorticity suggests that there is<br />
divergence in the area, which implies<br />
there is also upward vertical motions.<br />
Figure 1: (a) <strong>May</strong> <strong>27</strong> 6Z temperatures <strong>and</strong> wind (upper left). (b) <strong>May</strong> <strong>27</strong> 6Z<br />
frontogenesis (upper right). (c) <strong>May</strong> <strong>27</strong> 12Z temperatures <strong>and</strong> wind (lower left). (d) <strong>May</strong><br />
<strong>27</strong> 12Z frontogenesis (lower right).<br />
2
So Martin is saying that an increase in<br />
the magnitude <strong>of</strong> the temperature<br />
gradient requires the production <strong>of</strong> a<br />
vertical circulation in the atmosphere.<br />
This frontal feature is the main<br />
synoptic feature effecting Central Texas<br />
during the <strong>Jarrell</strong> tornado. Another<br />
synoptic feature was the existence <strong>of</strong> a<br />
weak long wave <strong>and</strong> trough over Texas.<br />
<strong>The</strong> trough is not an overwhelmingly<br />
dominant feature, but it does play a<br />
minor role in the synoptic forcings over<br />
Texas. <strong>The</strong> trough has only a slight<br />
curvature associated with it. Its location<br />
over Central Texas helps aid in<br />
additional upward vertical motions<br />
downstream <strong>of</strong> its axis. Ageostrophic<br />
wind divergence associated with the<br />
curvature <strong>of</strong> the long wave causes<br />
upward vertical motions. Though the<br />
curvature is not that strong, this feature<br />
is worth mentioning because it does<br />
provide another synoptic forcing in the<br />
region. It is a minor yet relevant feature<br />
in the synoptic overview.<br />
4. Mesoscale Analysis<br />
<strong>The</strong>re are multiple mesoscale<br />
features that play a significant role in the<br />
tornado outbreaks, particularly the<br />
<strong>Jarrell</strong> tornado. This presence <strong>of</strong> a lowlevel<br />
jet bringing warm moist air from<br />
the Gulf <strong>of</strong> Mexico into Central Texas is<br />
a very important feature. <strong>The</strong> presence<br />
<strong>of</strong> an outflow boundary <strong>and</strong> its<br />
interaction with the cold front was an<br />
important mesoscale feature with<br />
significant implications. Additionally<br />
the extremely unstable air in the<br />
atmosphere, which allowed this event to<br />
be as intense as it was, is an essential<br />
feature. It is this unstable air that will<br />
first be discussed.<br />
To aid in this discussion <strong>of</strong><br />
atmospheric instability soundings from<br />
the day <strong>of</strong> the event will be analyzed.<br />
Unfortunately the closest soundings<br />
available on the day <strong>of</strong> the event were<br />
located a couple hundred miles away<br />
from <strong>Jarrell</strong>. <strong>The</strong>se areas were Fort<br />
Worth, TX, Midl<strong>and</strong>, TX, Corpus<br />
Christi, TX, <strong>and</strong> Del Rio, TX. <strong>The</strong> most<br />
relevant soundings were taken from Fort<br />
Worth, TX <strong>and</strong> Del Rio, TX.<br />
Figure 2a shows the Fort Worth<br />
sounding taken on <strong>May</strong> <strong>27</strong> th at 12Z.<br />
This is a good example <strong>of</strong> a “loaded<br />
gun” sounding. It has a low moist level,<br />
an inversion capping the planetary<br />
boundary layer (PBL), <strong>and</strong> an elevated<br />
mixed layer above this inversion. Now<br />
this is not a perfect sounding for severe<br />
weather, but there are definitely some<br />
strong indications that severe weather is<br />
possible. This sounding gives a<br />
convective available potential energy<br />
(CAPE) value <strong>of</strong> 3712 J/kg, a very<br />
strong value. However, it also has a<br />
convective inhibition (CIN) value <strong>of</strong> -<br />
131 J/kg, which is a pretty high value.<br />
This means that it will be difficult to<br />
break through this level <strong>of</strong> stable air.<br />
Because CIN hinders the production <strong>of</strong><br />
updrafts necessary to create super cells<br />
<strong>and</strong> thunderstorms this sounding<br />
indicates that severe weather will only<br />
occur if this high level <strong>of</strong> CIN can be<br />
overcome. Since this sounding was<br />
taken at 12Z, or 6AM local time, it is<br />
important to note that daytime heating<br />
could very well help break the cap on the<br />
PBL <strong>and</strong> intense convection may occur.<br />
When large amounts <strong>of</strong> CIN are reduced<br />
due to heating <strong>and</strong> moistening<br />
convective storms are a lot more severe<br />
than in cases when no CIN is present.<br />
This may play a role in explaining why<br />
the <strong>Jarrell</strong> tornado was so severe. It is<br />
interesting to note that the listed indices<br />
for this particular sounding do not seem<br />
to show any definite signs <strong>of</strong> severe<br />
weather. <strong>The</strong> SWEAT index is only<br />
3
Figure 2: (a) Sounding from Fort Worth, TX 12Z <strong>May</strong> <strong>27</strong> <strong>1997</strong> (top). (b) Sounding from<br />
Del Rio TX 00Z <strong>May</strong> 28 <strong>1997</strong> (bottom).<br />
4
46.62. It has a total totals index <strong>of</strong> 43.6,<br />
a Showalter index <strong>of</strong> 3.68, <strong>and</strong> a K index<br />
<strong>of</strong> 21.10. <strong>The</strong>se are all very low values<br />
for severe weather outbreaks. <strong>The</strong> high<br />
CAPE value though shows that the<br />
atmosphere does have some potential to<br />
produce some significant severe weather<br />
if the cap can be broken.<br />
Figure 2b shows another<br />
sounding. This sounding was taken at<br />
Del Rio, TX at 00Z on <strong>May</strong> 28 th . In<br />
contrast with the Forth Worth sounding<br />
taken twelve hours earlier this sounding<br />
shows an imminent severe weather<br />
outbreak. Daytime heating has brought<br />
the surface temperatures up about 7° C.<br />
This heating has lowered the CIN<br />
significantly. Twelve hours earlier the<br />
CIN in Del Rio was -194 J/kg. Now it is<br />
only -18.1 J/kg. CAPE has also<br />
increased to an incredible 6,598 J/kg up<br />
from an impressive 5,520 J/kg twelve<br />
hours earlier. <strong>The</strong> atmosphere is<br />
extremely unstable at this time. <strong>The</strong><br />
indices over Del Rio at this time all<br />
indicate severe weather. <strong>The</strong> SWEAT<br />
index is 499, the total totals index is 61,<br />
the K index is 38.7, <strong>and</strong> the Showalter<br />
index is -10.2. <strong>The</strong>se are all extremely<br />
high values indicating strong severe<br />
weather. Central Texas has seen many<br />
super cells <strong>and</strong> tornadoes by the time<br />
this sounding was taken. <strong>The</strong> <strong>Jarrell</strong><br />
tornado occurred between 20Z <strong>and</strong> 21Z<br />
on the <strong>27</strong> th , a few hours before this<br />
sounding was taken.<br />
It is important to note that both<br />
the Fort Worth sounding <strong>and</strong> the Del Rio<br />
sounding were chosen because <strong>of</strong> their<br />
locations to <strong>Jarrell</strong> <strong>and</strong> Central Texas.<br />
<strong>The</strong> atmosphere over <strong>Jarrell</strong> was not<br />
exactly like that over Fort Worth or Del<br />
Rio at their respective times, but it had<br />
to have been relatively similar. <strong>The</strong>re<br />
was no doubt high instability <strong>and</strong> readily<br />
available moisture present in the air over<br />
<strong>Jarrell</strong> during the F5 tornado outbreak.<br />
Figure 3 shows the lifted index<br />
values over Texas at 18Z on the <strong>27</strong> th .<br />
This again verifies the presence <strong>of</strong> the<br />
highly unstable air. <strong>The</strong> most unstable<br />
areas are in Southwest <strong>and</strong> Central<br />
Texas. <strong>The</strong> reason that Central Texas<br />
got hit harder with severe weather was<br />
because <strong>of</strong> two key mesoscale features,<br />
the low-level jet <strong>and</strong> the outflow<br />
boundary.<br />
Figure 3: Lifted Index values over Texas at 18Z <strong>May</strong> <strong>27</strong>, <strong>1997</strong>.<br />
5
<strong>The</strong> low-level jet is what brought<br />
warm moist air into Central Texas from<br />
the Gulf <strong>of</strong> Mexico. Figure 4 shows this<br />
low-level jet. Figure 4a shows the 850<br />
mb jet at 6Z on the <strong>27</strong> th , while figure 4b<br />
shows the jet at 18Z on the <strong>27</strong> th . <strong>The</strong> jet<br />
continues to push its way further into<br />
Central Texas as the day goes on.<br />
Southerly winds with speeds up to 30<br />
knots cover the southeast side <strong>of</strong> Texas<br />
throughout the day. This low-level jet is<br />
a common feature over the Central<br />
United States. <strong>The</strong> low-level jet is a<br />
thermal slope flow phenomena that can<br />
be explained by a couple arguments.<br />
<strong>The</strong>re is a cooling <strong>of</strong> higher elevated air<br />
in the west relative to the same<br />
geopotential height in the east because <strong>of</strong><br />
its higher elevation in the mountains.<br />
This causes a pressure gradient <strong>of</strong> warm<br />
east air flowing to colder west air. This<br />
case also includes the cold front moving<br />
in from the northwest <strong>of</strong> Texas. This<br />
flow helps aid in the frontogenesis<br />
occurring over Central Texas at this time<br />
bringing a southerly flow into the<br />
northerly flow. As discussed in the<br />
synoptic overview section this also aids<br />
in upward vertical motions over Central<br />
Texas. When daytime heating warms up<br />
the surface these upward vertical<br />
motions are able to break through the<br />
PBL <strong>and</strong> reach the unstable air <strong>and</strong> level<br />
<strong>of</strong> free convection.<br />
This air being pumped in by the<br />
low-level jet is very warm <strong>and</strong> moist.<br />
Figure 5 verifies this with the surface<br />
observations over Texas at 18Z.<br />
Temperatures are in the 80’s (°F) <strong>and</strong><br />
low 90’s (°F), while dew point<br />
temperatures hover in the upper 70’s<br />
(°F). This low-level jet is providing the<br />
necessary moisture <strong>and</strong> energy for the<br />
severe thunderstorms <strong>and</strong> super cells that<br />
form.<br />
Figure 4: (a) 850mb LLJ 6Z <strong>May</strong> <strong>27</strong> (top). (b) 850mb LLJ 18Z <strong>May</strong> <strong>27</strong> (bottom).<br />
6
Figure 5: Surface observations from 18Z <strong>May</strong> <strong>27</strong>, <strong>1997</strong>.<br />
Figure 6 is a h<strong>and</strong> drawn crosssection<br />
from Fort Worth, TX (DFW) to<br />
Del Rio, TX (DRT). This cross section<br />
is valid for 00Z <strong>May</strong> 28, <strong>1997</strong>. <strong>The</strong><br />
variables drawn on this cross-section are<br />
<strong>The</strong>ta E (K) <strong>and</strong> the Mixing Ratio (g/kg).<br />
This cross section shows the high<br />
amounts <strong>of</strong> low-level moisture over<br />
Central Texas. Areas north <strong>of</strong> DRT have<br />
a mixing ratio around 23.0 g/kg while<br />
areas around DFW have mixing ratios<br />
near 14 g/kg at the surface. <strong>The</strong>ta E<br />
shows the instability <strong>of</strong> the air over<br />
Central Texas. Very high <strong>The</strong>ta e<br />
values, around 372 K, exist around the<br />
DRT area. A region with a relatively<br />
high <strong>The</strong>ta E is <strong>of</strong>ten the region with the<br />
most instability. Warmer low-level<br />
temperatures <strong>and</strong> higher low-level dew<br />
points increase instability, which as<br />
Figure 5 has already shown is the case.<br />
<strong>The</strong> low-level jet continues to bring in<br />
these low <strong>The</strong>ta E values. <strong>The</strong> <strong>The</strong>ta E<br />
lines also show that there is convection<br />
occurring in between DFW <strong>and</strong> DRT,<br />
which through surface observations <strong>and</strong><br />
reports again can be verified.<br />
Figure 7 is a h<strong>and</strong> drawn diagram<br />
depicting the surface streamlines over<br />
the United States at 20Z on <strong>May</strong> <strong>27</strong>,<br />
<strong>1997</strong>. <strong>The</strong> most important feature to<br />
note in this diagram is the convergence<br />
over Central Texas. <strong>The</strong>se converging<br />
air masses are causing upward vertical<br />
motions. <strong>The</strong>se motions along with<br />
daytime heating <strong>and</strong> additional upward<br />
vertical motion forcings are helping to<br />
break the inversion cap that is creating<br />
the convection over this region.<br />
7
Figure 6: Cross-section from DFW to DRT, valid 00Z <strong>May</strong> 28, <strong>1997</strong>, variables depicted<br />
are <strong>The</strong>ta E (K) <strong>and</strong> the Mixing Ratio (g/kg).<br />
8
Figure 7: Surface streamline analysis valid 20Z <strong>May</strong> <strong>27</strong>, <strong>1997</strong>.<br />
9
Another important mesoscale<br />
feature that was part <strong>of</strong> these convective<br />
storms was the outflow boundary. An<br />
outflow boundary is essentially a<br />
mesoscale cold front. An outflow<br />
boundary usually originates from a<br />
thunderstorm when the colder mid-level<br />
air is brought down to the surface by a<br />
downdraft. Once a few thunderstorms<br />
were able to form this outflow boundary<br />
provided an additional mechanism to<br />
help the warm moist air rise. When this<br />
air came into contact with the colder <strong>and</strong><br />
denser outflow boundary it was forced<br />
upward. This was an important<br />
mechanism in helping to increase the<br />
duration <strong>of</strong> the convection <strong>and</strong> severity<br />
<strong>of</strong> the storms.<br />
Next an analysis <strong>of</strong> satellite <strong>and</strong><br />
radar data will be made to help create a<br />
better underst<strong>and</strong>ing <strong>of</strong> what occurred<br />
over <strong>Jarrell</strong> during its F5 tornado.<br />
Figure 8 depicts the GOES-8 satellite<br />
4km resolution IR imagery at 2015Z <strong>and</strong><br />
2215Z on <strong>May</strong> <strong>27</strong> th . Convection over<br />
Central Texas is clear from these<br />
images. <strong>The</strong> two-hour difference in time<br />
shows a significant increase in the IR<br />
cloud tops. <strong>The</strong>re are five apparent<br />
super cells that are associated with these<br />
main IR cloud features over Central<br />
Texas by 2215Z. <strong>The</strong>ir anvils stretch a<br />
few hundred kilometers each. <strong>The</strong><br />
biggest anvil at 22:15Z is associated<br />
with the super cell that spawned the F5<br />
tornado that flattened <strong>Jarrell</strong>. This anvil<br />
is the second most easterly one in Texas.<br />
Figure 8: IR satellite images, (a) 2015Z <strong>May</strong> <strong>27</strong> (top), (b) 22:15Z <strong>May</strong> <strong>27</strong> (bottom)<br />
10
Figure 9: GOES-8 satellite visible image, valid at 1915Z <strong>May</strong> <strong>27</strong>, 4km resolution<br />
Figure 9 depicts a GOES-8<br />
visible satellite image at 1915Z <strong>May</strong><br />
<strong>27</strong> th . Visible is the super cell that<br />
produces the <strong>Jarrell</strong> tornado. This super<br />
cell is the most pronounced cloud feature<br />
over Central Texas. <strong>The</strong> <strong>Jarrell</strong> tornado<br />
touches down about an hour plus from<br />
this time, so this super cell is still in its<br />
initial stages. Once the inversion cap<br />
was broken convection occurred rapidly<br />
because <strong>of</strong> the highly unstable air.<br />
Figure 10 shows the <strong>Jarrell</strong><br />
tornado on the radar. Figure 10a shows<br />
a zoomed out radar depiction over Texas<br />
at 2035Z with two kilometer resolution.<br />
<strong>The</strong> largest <strong>and</strong> most intense reflectivity<br />
in the center <strong>of</strong> Texas is the <strong>Jarrell</strong><br />
tornado. Figure 10b zooms in on this<br />
super cell to analyze some <strong>of</strong> its features.<br />
This figure is valid at 2048Z. An<br />
obvious hook echo is visible near the<br />
southwest flank <strong>of</strong> the super cell. This is<br />
where the F5 <strong>Jarrell</strong> tornado is located at<br />
this time. This is a great example <strong>of</strong> a<br />
hook echo <strong>and</strong> a tornadic signature. A<br />
V-notch is also visible on this super<br />
cell’s radar image. A V-notch is another<br />
excellent way to verify the presence <strong>of</strong> a<br />
severe thunderstorm super cell. Figure<br />
10c shows the radial velocity at 2025Z.<br />
A radial velocity couplet <strong>of</strong> contrasting<br />
velocities is visible near <strong>Jarrell</strong> at this<br />
time. This is an excellent tornadic<br />
vortex signature (TVS). This TVS<br />
shows the presence <strong>of</strong> the <strong>Jarrell</strong> tornado<br />
from yet another perspective. Radar <strong>and</strong><br />
satellite images can be very helpful in<br />
detecting severe weather. Using radar<br />
the NWS was able to give a 15-minute<br />
warning about this tornado.<br />
Unfortunately its intensity was still too<br />
much for many people to avoid. Its<br />
destruction was devastating to this small<br />
Texas town <strong>and</strong> nothing could prepare<br />
these people for the 260 mph winds <strong>of</strong><br />
this monstrous F5 tornado.<br />
11
Figure 10: (a) radar base II level reflectivity valid 2035Z <strong>May</strong> <strong>27</strong> (top)<br />
(b) radar base II level reflectivity valid 2048Z <strong>May</strong> <strong>27</strong> (middle)<br />
(c) radar radial velocity valid 2025Z <strong>May</strong> <strong>27</strong> (bottom)<br />
12
Figure 11: H<strong>and</strong> drawn conceptual model <strong>of</strong> the tornado outbreak in Central Texas on<br />
<strong>May</strong> <strong>27</strong>, <strong>1997</strong>.<br />
13
5. Conclusion<br />
In conclusion, the <strong>Jarrell</strong> tornado<br />
was one <strong>of</strong> the most deadly <strong>and</strong><br />
destructive tornadoes in US history.<br />
Figure 11 gives a h<strong>and</strong> drawn conceptual<br />
model that summarizes the main factors<br />
involved in the tornado outbreak over<br />
Texas on <strong>May</strong> <strong>27</strong>, <strong>1997</strong>. From a<br />
synoptic view the main feature was a<br />
cold front pushing its way south into<br />
Texas. Frontogenesis helped aid in<br />
forcing some <strong>of</strong> the upward vertical<br />
motions. From the Gulf <strong>of</strong> Mexico came<br />
a southerly low-level jet bringing warm<br />
moist air. This warm moist air from the<br />
LLJ helped destabilize the air. <strong>The</strong> air<br />
was already highly unstable with CAPE<br />
values reaching 6,000 J/kg. A strong<br />
inversion <strong>and</strong> high CIN values over the<br />
area helped prevent convection from<br />
occurring early on. Once daytime<br />
heating started to heat the surface the<br />
cap was able to break <strong>and</strong> convection<br />
occurred. A strong outflow boundary<br />
over Central Texas created from these<br />
thunderstorms’ cold downdrafts helped<br />
promote additional upward vertical<br />
motions, which increased these<br />
thunderstorm intensities. <strong>The</strong> most<br />
intense super cell was the one that<br />
spawned the <strong>Jarrell</strong> F5 tornado. This<br />
tornado killed <strong>27</strong> people <strong>and</strong> caused over<br />
$120 million in damage with its winds<br />
exceeding 260 mph. <strong>The</strong> satellite <strong>and</strong><br />
radar data verified this super cell’s<br />
presence <strong>and</strong> intensity. Using radar data<br />
severe weather signatures can be seen.<br />
<strong>The</strong>se signatures helped the NWS give a<br />
warning out to the people in Central<br />
Texas. <strong>The</strong> magnitude <strong>of</strong> the F5 tornado<br />
in <strong>Jarrell</strong> in particular made the warning<br />
ineffective in the end. This case study<br />
was an excellent example <strong>of</strong> the<br />
destructive force <strong>of</strong> a super cell when<br />
many essential atmospheric conditions<br />
are met.<br />
6. References <strong>and</strong> Acknowledgements<br />
Haby, Jeff “Outflow Boundary<br />
Conditions.” <strong>The</strong> Weather<br />
Prediction<br />
Martin, Jonathon E. (2006) Mid-Latitude<br />
<strong>Atmospheric</strong> Dynamics: A First<br />
Course. John Wiley & Sons Ltd.<br />
National Weather Service Austin/San<br />
Antonio (<strong>1997</strong>) “<strong>The</strong> <strong>Jarrell</strong>,<br />
Cedar Park, <strong>and</strong> Pedernales<br />
Valley <strong>Tornado</strong>es: Summary <strong>of</strong><br />
Weather Event <strong>of</strong> <strong>May</strong> <strong>27</strong>,<br />
<strong>1997</strong>.”<br />
University <strong>of</strong> Wyoming, <strong>Atmospheric</strong><br />
Sounding Archive. <strong>May</strong> <strong>1997</strong><br />
data<br />
Wade, Gary “<strong>Atmospheric</strong> stability<br />
fields derived from the GOES<br />
Sounder support preferred<br />
locations for extremely severe<br />
convection” NOAA<br />
Special thanks to Pr<strong>of</strong>essor Greg Tripoli<br />
<strong>and</strong> Holly Hassenzahl for helping in the<br />
process <strong>of</strong> obtaining archived weather<br />
data.<br />
14