2012 - Geoinformatics
2012 - Geoinformatics
2012 - Geoinformatics

You also want an ePaper? Increase the reach of your titles
YUMPU automatically turns print PDFs into web optimized ePapers that Google loves.
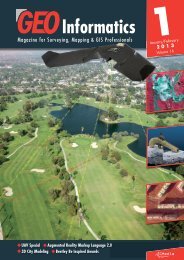
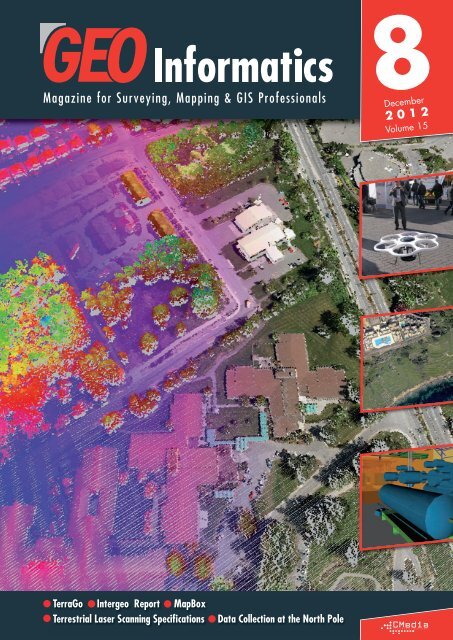
Magazine for Surveying, Mapping & GIS Professionals<br />
8<br />
December<br />
2 0 1 2<br />
Volume 15<br />
TerraGo Intergeo Report MapBox<br />
Terrestrial Laser Scanning Specifications<br />
Data Collection at the North Pole
I believe in reliability.<br />
The Leica Viva GNSS – this exceptionally rugged,<br />
easy-to-use instrument with a self-explanatory<br />
interface is a fine example of our uncompromising<br />
dedication to your needs. Reliability: yet another<br />
reason to trust Leica Geosystems.<br />
Reliability means peace of mind –knowing that<br />
your equipment will never let you down.<br />
Regardless of the situation, you want to be able to rely on your<br />
equipment and the results you get. That’s why Leica Geosystems<br />
places great emphasis on dependability. Our comprehensive<br />
spectrum of solutionscoversall your measurement needsfor<br />
surveying, engineering and geospatial applications. And they are<br />
all backed with world-class service and support that delivers<br />
answers to your questions. When it matters most. When you<br />
are in the field. When it hasto be right.<br />
You can count on Leica Geosystems to provide a highly reliable<br />
solution for every facet of your job.<br />
Leica Geosystems AG<br />
Switzerland<br />
www.leica-geosystems.com
GeoInformatics is the leading publication for Geospatial<br />
Professionals worldwide. Published in both hardcopy and<br />
digital, GeoInformatics provides coverage, analysis and<br />
commentary with respect to the international surveying,<br />
mapping and GIS industry.<br />
GeoInformatics is published<br />
8 times a year.<br />
Editor-in-chief<br />
Eric van Rees<br />
evanrees@geoinformatics.com<br />
Copy Editor<br />
Elaine Eisma<br />
Editors<br />
Florian Fischer<br />
ffischer@geoinformatics.com<br />
Huibert-Jan Lekkerkerk<br />
hlekkerkerk@geoinformatics.com<br />
Remco Takken<br />
rtakken@geoinformatics.com<br />
Joc Triglav<br />
jtriglav@geoinformatics.com<br />
Contributing Writers:<br />
Cornelius König, Saviour Formosa, Elaine Sciberras,<br />
Janice Formosa Pace, Luigi Colombo, Barbara<br />
Marana, Bonnie Bogle, Henk Key, Jim Baumann,<br />
Remco Takken, Gregory Marler.<br />
Columnists<br />
Raj Singh, Matt Sheehan<br />
Finance<br />
finance@cmedia.nl<br />
Marketing & Sales<br />
Ruud Groothuis<br />
rgroothuis@geoinformatics.com<br />
Subscriptions<br />
GeoInformatics is available against a yearly<br />
subscription rate (8 issues) of € 89,00.<br />
To subscribe, fill in and return the electronic reply<br />
card on our website www.geoinformatics.com<br />
Webstite<br />
www.geoinformatics.com<br />
Graphic Design<br />
Sander van der Kolk<br />
svanderkolk@geoinformatics.com<br />
ISSN 13870858<br />
© Copyright <strong>2012</strong>. GeoInformatics: no material may<br />
be reproduced without written permission.<br />
P.O. Box 231<br />
8300 AE<br />
Emmeloord<br />
The Netherlands<br />
Tel.: +31 (0) 527 619 000<br />
Fax: +31 (0) 527 620 989<br />
E-mail: services@geoinformatics.com<br />
GeoInformatics has a collaboration with<br />
the Council of European Geodetic<br />
Surveyors (CLGE) whereby all individual<br />
members of every national Geodetic<br />
association in Europe will receive the<br />
magazine.<br />
About Intergeo<br />
In this issue you will find coverage on the biggest geospatial trade fair in the industry,<br />
namely the annual Intergeo Conference and Trade Fair. The event has changed<br />
a lot in the last few years and will, more than likely, continue to change in the<br />
future. The event gives a good overview of the current state of the industry, which,<br />
of course, is no different from how other industries are doing in the current economic<br />
climate. There have been a lot of mergers and acquisitions by the major<br />
surveying and GIS companies, which is reflected in the decreased number of<br />
exhibitors. For example, the acquisitions of Trimble and Hexagon. Software companies<br />
were a different story at Intergeo: only Esri had a large booth, whereas<br />
Bentley Systems was no longer present at the trade fair at all. Autodesk used to<br />
have a very large booth, but is it really appropriate for software companies to<br />
have this sort of presence on a trade fair that is dominated by hardware for data<br />
collection in the field<br />
Software seemed to be less present overall, which resulted in a much smaller<br />
OSGeo Park than in recent years. Is it possible that open source is imploding as<br />
well – and, if so, why is this It would be interesting to know why this is. What I<br />
sense is, that on the one hand the industry is growing in terms of players (organizations,<br />
applications, markets, vendors and service providers), and on the other<br />
hand, at the same time, is very fragmented. What I mean by this is that there are<br />
more and more geospatial conferences and meetings, for example, but for a smaller,<br />
specified or regional audience. Is this a bad thing I don’t think so, but to say<br />
exactly what belongs to the geospatial market and what doesn’t, isn’t very easy.<br />
It is unclear because geospatial companies are moving away from their core business,<br />
to new markets such as business intelligence (Esri) and construction software<br />
(Trimble). They are also incorporating new social media and, making broader use<br />
of general IT. This kind of innovation is what sets these companies apart from<br />
open source.<br />
Intergeo is also wrestling with this phenomenon of fragmentation, which<br />
is reflected in the topics discussed during the press conference and<br />
which is covered in more detail in this issue. ‘When do we need a<br />
surveyor’ This seems like an obvious question, but the reality is<br />
more complex. What was striking was that in North America, the<br />
cloud is already a technology that has been fully embraced, whereas<br />
the complete opposite is true for Europe. Why is this so Is it<br />
because the cloud is still a geographically located and static phenomenon,<br />
as opposed to what we were told it would be For<br />
more on this topic, please refer to the interview with Safe<br />
Software’s Don Murray in this issue.<br />
For the future, I think Intergeo has a great deal of potential,<br />
since it combines the knowledge of professionals in the industry<br />
with a large trade fair, which showcases the latest new<br />
products. This doesn’t go unnoticed elsewhere, judging<br />
from the increasingly growing presence from North<br />
American media. The event seems to get more international<br />
every year, attracting a more geographically<br />
diverse crowd, which is a good sign. If the organization<br />
can successfully capture the changing<br />
nature of the industry as a whole, by<br />
working together even more closely with<br />
media partners, the industry itself, interest<br />
groups, non-governmental organizations<br />
and science, then the event can become even<br />
more influential and important than it already is.<br />
Enjoy reading,<br />
Eric van Rees<br />
evanrees@geoinformatics.com<br />
Photography: www.bestpictures.nl<br />
3<br />
December <strong>2012</strong>
C o n t e n t<br />
At the cover:<br />
The cover image uses data from the Township of Langley to illustrate how basic point<br />
cloud data can be colored. The original uncolored data on the left side was colored by<br />
using FME technology (www.safe.com) to overlay an orthophoto and apply RGB figures<br />
from each raster pixel to the points within pixel extents (the colored output is on the<br />
right).<br />
A r t i c l e s<br />
From 3D Point Clouds to CAD Map 10<br />
Securing the Spatial Environment 18<br />
Capturing Cape Town 20<br />
Safe Software 22<br />
Terrestrial Laser Scanning Specifications 28<br />
Make Web Maps with MapBox 34<br />
E v e n t s<br />
Intergeo Press Conference <strong>2012</strong> 32<br />
Intergeo Trade Fair <strong>2012</strong> 36<br />
Partners and Best Practices 44<br />
State of the Map 47<br />
N e w s l e t t e r<br />
CLGE newsletter 6<br />
The ISPRS Foundation 42<br />
C o l u m n s<br />
Smart Cities and Cooperation 27<br />
Mobile GIS in <strong>2012</strong> 48<br />
I n t e r v i e w s<br />
Collecting Data Under Harsh Conditions 14<br />
TerraGo 24<br />
Long-Term Geospatial Data Storage 40<br />
C a l e n d a r / A d v e r t i s e r s I n d e x 50
Scalypso is a new developed<br />
software for the evaluation of<br />
3D terrestrial laser scan data.<br />
10<br />
The software combines the experience<br />
of 10 years work in<br />
3D laser scanning and 3D modelling.<br />
The evaluation of the<br />
3D scan data will be done in a<br />
photorealistic 2,5D view and<br />
not in the point cloud.<br />
Safe Software’s President and<br />
Co-founder Don Murray talks<br />
22<br />
about recent releases and how<br />
the company is wrapping their<br />
heads around real-time data<br />
feeds, LiDAR, non-relational<br />
data tables and cloud<br />
computing.<br />
Getmapping,<br />
20<br />
a company that<br />
produces its own vertical aerial<br />
photography, oblique photography<br />
and height data,<br />
captured and delivered over<br />
2500 km 2 of high resolution<br />
(6.25cm) imagery covering<br />
the entire City of Cape Town<br />
Metropolitan area.<br />
Last April, a team of researchers<br />
went to the North Pole<br />
14<br />
for a scientific program, where<br />
they performed data collection<br />
and measurements of weather<br />
data, ice-sea drift and plankton.<br />
The area’s climatic conditions<br />
required state-of-art<br />
equipment.<br />
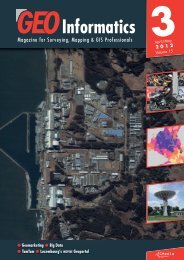
The world’s most important<br />
conference and trade show for<br />
geodesy, geo-information and<br />
land management attracted<br />
36<br />
around 16,000 Geomaticand<br />
GIS professionals to<br />
Hanover, Germany. A look at<br />
this year’s trends and topics.<br />
44<br />
With as many as ten sessions<br />
going on at once, every attendee<br />
could choose his or her own<br />
individual programme of<br />
Technical Workshops and User<br />
Presentations at Esri’s European<br />
User Conference in Oslo.<br />
32<br />
Wednesday October 10 was<br />
the date for the yearly press<br />
conference at the Intergeo<br />
Conference and Trade Fair,<br />
organized by DVW e.V. - the<br />
German Society for Geodesy,<br />
Geoinformation and Land<br />
Management.<br />
Striving to develop a baseline<br />
spatial information sys-<br />
18<br />
tem for cross-domain thematic<br />
analysis, Malta has<br />
embarked on a project<br />
aimed at integrating the<br />
environmental themes in their<br />
wider aspect: the natural,<br />
physical and social domains.
N e w s l e t t e r<br />
Let’s fight the Baker Syndrome<br />
CLGE and INTERGEO, an excellent Mix<br />
From 8 to 14 October <strong>2012</strong>, CLGE had a very busy and successful week. INTERGEO, the 3rd Conference<br />
of the European Surveyor, the 2nd European Students meeting and the Ist European Students contest,<br />
followed by the Autumn CLGE General Assembly.<br />
Jean-Yves Pirlot opens the Award Ceremony of the Ist CLGE Students Contest<br />
CLGE was indeed a major player at the<br />
annual INTERGEO fair and following this,<br />
has organized its second General<br />
Assembly of <strong>2012</strong>, including elections for the<br />
appointment of a new Executive Board.<br />
INTERGEO secured a lot of visibility for CLGE.<br />
President Pirlot was invited to give an address at<br />
the opening of this event. He insisted on the absolute<br />
need for associations to cooperate and,<br />
whenever possible, to join. He stressed the important<br />
role of the Surveyor at a local, regional and<br />
global level.<br />
The ‘baker syndrome’ was introduced at the 3rd<br />
Conference of the European Surveyor. While all<br />
surveyors know exactly what a baker does, most<br />
bakers do not really know what surveyors do,<br />
although they are as important for society as bakers<br />
are. CLGE’s aim must be to raise the profile<br />
of the profession and to ensure they appear on<br />
the radar of the policy makers and the general<br />
public. The conference offered the ideal opportunity<br />
to compare different systems of ownership<br />
protection in Europe and to define the pros and<br />
cons related to these approaches. Needless to<br />
say, the German and Swiss systems were the most<br />
appealing and many of the specialists who took<br />
part in the discussions were assured in their belief<br />
that a generalization of the legal cadaster in<br />
Europe would have very beneficial effects.<br />
The Conference was an ideal occasion for the<br />
solemn adoption of the European Code for the<br />
Measurement of Buildings. The code will be promoted<br />
via the European Real Estate Area Label<br />
(www.euREAL.eu). This topic will be covered in<br />
one of our next editions.<br />
Another highlight of CLGE’s participation in<br />
INTERGEO was the second European Students<br />
contest. Since 2009, CLGE has organized these<br />
meetings, with the aim to motivate young surveyors<br />
to take part in the shaping of their professional<br />
future. This time, 280 students from 10 countries<br />
were able to take part in the event. They<br />
gathered at the first CLGE Students Contest<br />
awards ceremony, where prizes were given to<br />
the authors of two papers. The first was in the<br />
field of Geodesy and Topography and the second<br />
in the field of GIS and Mapping. For this first<br />
edition 11 papers were sent in, which was a very<br />
promising start. All the papers are available on<br />
www.clge.eu. There was no ranking established<br />
for the non-awarded papers, but all the participants<br />
were, of course, warmly thanked by the<br />
organizers. The support given by the DVW<br />
President Thöne will allow a broadening of the<br />
contest in the coming years. The students’ gathering<br />
was the occasion for CLGE President Pirlot to<br />
stress the extent of the benefits of INTERGEO. He<br />
sees it as an ideal platform for the continuous professional<br />
development of his members, as a platform<br />
for business and networking and as a platform<br />
from where initiatives can be launched with<br />
the aim to increase CLGE’s and the European surveyors’<br />
visibility.<br />
The CLGE General Assembly was also very successful.<br />
Once again, the organization of workshops<br />
shaping the future of the association, were<br />
very well received. Additionally, a new board<br />
was appointed for the election period <strong>2012</strong> –<br />
2014. The Bureau was unanimously confirmed<br />
by acclamation and thanked for the work done<br />
in the previous period. Vice-President Leiv-Bjarte<br />
Mjøs of Norway, was also reelected. Danko<br />
Markovinović from Croatia and Pedro Ortiz Toro<br />
from Spain are the two incoming CLGE Vice-<br />
Presidents, who complete the board.<br />
6<br />
December <strong>2012</strong>
N e w s l e t t e r<br />
4th International Training Course in Topography<br />
for Young Surveyors<br />
The course organized by CNGeGL in cooperation with S.P.A. Geoweb and with local support from the<br />
Spanish Land surveyor’s Association took place in Madrid, from 17 to 28 September <strong>2012</strong>.<br />
Fotograph of the group in the entrance of the Royal Observatory Museum in Madrid.<br />
Hello, Hola (Spanish), Ciao (Italian), Përshendetje (Albanian),<br />
你 好 (Chinese), Zdravo (Montenegrin), Zdravo (Macedonian),<br />
Bonjour (Belgium), Γεια σου (Greek), Tere (Estonian),<br />
مالسلا (Danish), Merhaba (Turkish), Guten Tag (German), Goddag<br />
(Russian), (Moroccan), Pozdravljeni (Slovenian), Привет مكيلع<br />
Buna Ziua (Moldavian). We don’t think that any of you has ever<br />
experienced such a wonderful greeting and it comes from young<br />
surveyors in Madrid.<br />
First of all we would like to thank all the people, associations and<br />
authorities who made this two weeks long course possible. It has<br />
been a great opportunity and a wonderful life experience for fifty<br />
young surveyors from sixteen European countries.<br />
Many of us did not know what to expect from this course, as it was<br />
our first international community meeting involving different cultures<br />
and professional habits and we weren’t sure if we could manage<br />
to collaborate together.<br />
After the opening ceremony and the official speeches, our study<br />
programme began. During the first week we were mentored by<br />
seven teachers from Italy, Greece, Spain, Turkey and the UK, who<br />
taught us about different kind of instruments, techniques and applications,<br />
within a variety of areas of the surveying profession.<br />
Subjects covered included topographical and geomatic surveys,<br />
orthophoto production, GNSS surveys and deformation, photogrammetric<br />
and LIDAR survey, scanner and 3D photogrammetric<br />
or survey of artistic and heritage assets.<br />
For the first three days of the course classroom lessons were scheduled<br />
and covered GNSS surveys and photogrammetry. We had the<br />
chance to learn about some new technologies and applications.<br />
Our first field surveying journey came on Thursday, and took place<br />
at Debod Temple. It gave us an idea as to what an integrated survey<br />
is and also brought the group closer, whilst increasing our<br />
knowledge of surveying tasks. Debod is an Egyptian temple which<br />
was a present from Egypt to Spain. It was moved in 1968 stone<br />
by stone and it is located in downtown Madrid. Once the survey<br />
was done, we still had time in the afternoon for a practical modelling<br />
lesson with the data obtained. This linked with Friday’s topic,<br />
which was LIDAR and aerial surveys.<br />
On Saturday morning, we discovered how our colleagues in the<br />
past worked, as we visited the Royal Observatory Museum in<br />
Madrid. We saw the new Herschel’s telescope, the library, the<br />
Latest News Visit www.geoinformatics.com December <strong>2012</strong><br />
7
N e w s l e t t e r<br />
windy morning, it didn’t stop us from surveying the park and then,<br />
in the afternoon, we did the post-processing calculations.<br />
Midweek we began to notice a feeling of sadness, as the course<br />
was coming to an end. After a complete class dedicated to GIS,<br />
some of us took advantage of our remaining time together and<br />
attended a football match in Santiago Bernabeu stadium.<br />
Unfortunately, Christiano Ronaldo was not playing and some of the<br />
girls were pretty disappointed. The match was great though and a<br />
fabulous experience, which we will remember for the rest of our<br />
lives. The rest of the group went to a local music pub guided by a<br />
Spanish member of the class from Madrid and watched football<br />
and enjoyed the traditional fulfilling tapas.<br />
CLGE President, Jean-Yves Pirlot, addressing the students said “Please, when you go home, spread the word<br />
that we need the commitment of all surveyors for the future of our beautiful and proud profession. Be<br />
aware that during this course you are building a network of collegiality and friendship that you will never<br />
forget… and keep in mind, we have to build on this for the best future of the Surveying Profession.”<br />
meridian circle and clocks’ room, and watched some videos inside<br />
the Science of the Earth and Universe room. As a conclusion to our<br />
week-end activities, Sunday was spent sight-seeing and looking at<br />
some of this country’s wonderful treasures in the imperial city of<br />
Toledo.<br />
After almost a week of work we could certainly say that this course<br />
was achieving its target; once we had broken the ice everyone<br />
managed to co-operate well and establish good social relationships.<br />
We started the second Monday a little tired, due to the intense<br />
weekend and a little too much curiosity about Madrid’s night-life!<br />
Despite this, we started the week as a more connected group, and<br />
with great enthusiasm; ready to learn more things together.<br />
We had a long day in front of our laptops preparing for the next<br />
day’s class. On Tuesday we were scheduled to practice measuring<br />
with GPS in the Juan Carlos I park. Although it was a cold and<br />
Thursday morning in the classroom was very interesting, as we were<br />
looking at a lot of structural monitoring graphics examples. Having<br />
finished lunch, the lesson on land registry and cadastre started. This<br />
was an introduction to Friday’s class.<br />
After we finished studying, we prepared a good-bye party, as some<br />
of the participants were leaving a day earlier than the rest. We had<br />
a party with guitar playing, singing, dancing and talked well into<br />
the night. To make the evening even more special, everyone tried<br />
to bring something traditional from their culture. Our Moroccan colleagues<br />
brought some tea and small cakes from Meknes city. The<br />
Spanish citizens introduced us to Rioja wine and their famous pipas.<br />
We also had Belgian and international beers!<br />
Finally the second Friday arrived and, after a visit to the Spanish<br />
Land Agency, we returned to our hotel for a quick lunch and to rest<br />
a little before attending the closing ceremony. After the officials had<br />
given their speeches, we were surprised with a video of us in the<br />
opening ceremony. This was closely followed by the presentation<br />
of the diplomas. We stayed to talk to the officials in the hall of the<br />
hotel, enjoying a beautiful cake, which had been prepared for the<br />
occasion. We then had time to go up to our rooms to change into<br />
our ‘Sunday best’ before leaving together to attend the closing dinner.<br />
This was held in a very nice restaurant in the centre of Madrid.<br />
Jamón, queso, paella and good wine were enjoyed by all.<br />
Back at the hotel, sadness surfaced once again, as the time had<br />
come to say good bye to our friends. This was our last opportunity<br />
to see each other, as some of us had to catch planes early in the<br />
morning. We were happy at the thought of seeing our families again<br />
after fifteen days, but this was tinged with sorrow as these wonderful<br />
two weeks together came to an end. Saturday arrived, of course,<br />
and we left in the rain …<br />
And now, a few days after this very pleasant and enriching experience,<br />
we can say one thing for certain: Good bye dear friends.<br />
You will see us again soon! These two weeks will never be forgotten!<br />
In his opening address, CNGeGL President, Fausto Savoldi, pointed out “The presence of our international<br />
organisation is important, because we have completely understood that this is an exceptional occasion<br />
for the professional training of the young surveyors. Their competence must be homogeneous in each<br />
part of the world.”<br />
8<br />
December <strong>2012</strong>
®
A r t i c l e<br />
Evaluating the Scan Project<br />
From 3D Point Clouds to CAD<br />
Scalypso is a new developed software for the evaluation of 3D terrestrial laser scan data. The software<br />
combines the experience of 10 years work in 3D laser scanning and 3D modelling. The evaluation<br />
of the 3D scan data will be done in a photorealistic 2,5D view and not in the point cloud. The 2,5D<br />
view will be generated out of the diffuse reflectance data or out of the coloured point cloud.<br />
By Cornelius König<br />
Greystep picture<br />
The 2,5D view makes it easy for other<br />
office workers to evaluate the scan project.<br />
In addition to that there is no need<br />
anymore to navigate in the 3D point cloud.<br />
This kind of evaluation helps you to save<br />
time and money.<br />
Scalypso consists out of four different programmes<br />
and two modules and is build up<br />
modular. By adding other modules you can<br />
expand the software basis version for you<br />
upcoming needs and projects. The main programme<br />
is the Modeler. All coming evaluation<br />
tools are combined in that programme.<br />
Some of the main functions are the registration<br />
and geo registration of sole scans via<br />
bowl or measuring marks. Real time transfer<br />
of 3D points, 3D lines, 3D circle, 3D polygons,<br />
3D areas, cuboids into a CAD aim system<br />
like Auto CAD or MicroStation. The<br />
automatic mash of objects for the generation<br />
of profiles along the coordinate axis is also<br />
a very helpful tool for the upcoming evaluation.<br />
It always depends on your needs which<br />
tools suit your tasks and which of them are<br />
necessary for your special assignment.<br />
To work with the Modeler you first have to<br />
convert your laser scan data into the<br />
Scalypso format. However every scan format<br />
can be transformed and in the uniform<br />
workflow a fast and easy evaluation is guaranteed.<br />
The Viewer is a free tool for the customers<br />
to get an easy eye on the data. With<br />
that, everyone involved in the assignment<br />
can have a quick view on first results and<br />
misunderstandings can be prevent right in<br />
the beginning. If you want to navigate, manage<br />
and select your scans easily, the<br />
Navigator would suit well into your workflow.<br />
The Navigator allows you to calculate<br />
layers und draw maps of your scan project.<br />
We also developed a pipe module and a<br />
building information modelling (BIM) module.<br />
The test campaign<br />
In spring 2011 our company had the<br />
assignment to measure and evaluate for the<br />
Berlin City Cleaning Company (BSR) the east<br />
pump.<br />
The BSR is the largest urban waste disposal<br />
contractor in the EU and has its main office<br />
in Berlin-Tempelhof. The place of work was<br />
the waste devaluation ground in Berlin-<br />
Ruhleben.<br />
The east pump is part of the large pumping<br />
system in the BSR area. First of all we had<br />
so survey the whole room with all its different<br />
characteristics and in the following steps<br />
we started the evaluation with our software<br />
solution system Scalypso.<br />
Our customer made clear, that he wanted a<br />
CAD model with all details containing every<br />
pipe, every room geometry and every other<br />
useful detail. They needed an as-completed<br />
drawing for an overview about all engines.<br />
The aim was it, to develop out of the 3D<br />
point clouds with the help of the evaluation<br />
software Scalypso a CAD plan. Every window,<br />
every door and every offset should be<br />
10<br />
December <strong>2012</strong>
A r t i c l e<br />
Map<br />
Pumping system<br />
evaluated and transformed into a CAD programme.<br />
For our customers it was very important that<br />
they had not to stop the machines and that<br />
the surveying was done without any interruption<br />
of the normal working process.<br />
Therefore the use of a 3D laser scanner is<br />
perfect. The contact free system allows all<br />
machines to work and we received in a comparatively<br />
short time all need able information.<br />
No machine has to stop and nothing<br />
has to be changed in the daily process.<br />
The whole area contained about ten rooms<br />
with the whole pumping systems. Because<br />
of all the pipes and constructions the task<br />
was perfectly to test all the software functions.<br />
A two head measurement group<br />
arrived in Berlin and started the work.<br />
Firstly the workers allocated measuring<br />
marks all over the rooms for the geo referenzatioin<br />
afterwards. With the help of the<br />
measuring marks the scans were transferred<br />
into one common coordinate system. Shortly<br />
after all necessary arrangements the survey<br />
began. Seventeen different scan positions<br />
later all data was captured and the workers<br />
left the area and went back to the office. At<br />
the end of the day lasting several hours of<br />
measuring the workers left the BSR area and<br />
went back to the headquarter to star the<br />
evaluation.<br />
Evaluation<br />
Before we started the evaluation the row<br />
data had to be converted into the software<br />
own *.syo format. After uploading the scanner<br />
files just start the converter and the programme<br />
will work. All the established scanner<br />
formats can be converted such as Riegl,<br />
Faro or Z&F.<br />
The evaluator Stefanie Peda said: “The BSR<br />
project was in its volume quite large and the<br />
whole evaluation took definitely a lot of<br />
time.” For the evaluation of the east pump<br />
two modules were especially important. The<br />
Pipe Module and the building information<br />
modelling module (BIM). Both modules were<br />
used quite often during the evaluation<br />
Detail picture<br />
Latest News Visit www.geoinformatics.com December <strong>2012</strong><br />
11
A r t i c l e<br />
because of the large amount of pipes and<br />
the BIM module because of the many different<br />
rooms.<br />
After we generated the pipe runs, we transferred<br />
them in real time into our CAD system.<br />
An *.xml interface could export the<br />
data also into other plant construction applications.<br />
Different functions simplified the<br />
work with the pipe runs. Very helpful for our<br />
tasks were the different fittings, T-pieces,<br />
welding or flange connections. These connections<br />
can be fit easily in the existing pipe<br />
run.<br />
The BIM module reconstructs complete building<br />
geometries after you generated them<br />
with your 3D laser scanner. With only a couple<br />
of clicks we reconstructed the whole piping<br />
rooms with all doors, windows and other<br />
geometric openings.<br />
Every evaluator has its own strategy to evaluate<br />
such a project. Stefanie Peda said:<br />
“First of all I mark all important pieces and<br />
add polygons, rectangles or ellipses.<br />
Afterwards I start to export room geometries<br />
with the help of the BIM module to my CAD<br />
air system. That makes it easy to have a first<br />
overview about what to come. The ground<br />
plan helps a lot to navigate through the<br />
scans.”<br />
After she made the ground plan she added<br />
pipes and landing platforms into the CAD<br />
model. “With all its constructions the evaluation<br />
was a large and comprehensive task.<br />
I needed about two weeks time to evaluate<br />
the pipe room with all its details.” Miss Peda<br />
tells. After two weeks of evaluation everybody<br />
was convinced about the result. The<br />
finished CAD plan was delivered to our customers<br />
the BSR.<br />
Conclusion<br />
In conclusion the BSR project was a good<br />
project to test nearly all software functions.<br />
You always need good staff, good hardware<br />
and also a good software to get a venture<br />
like this to an good end.<br />
“Working in such a huge complex is always<br />
interesting and if everything works out and<br />
everything was successful, we can say that<br />
it was a good project.” The director Ralf<br />
König said. “The pipe and BIM module<br />
worked - like all other functions - really well<br />
and everyone was happy with the result.”<br />
In a short time the whole pipe area was surveyed<br />
and the regular work could be continued.<br />
Back in the office we evaluated all<br />
necessary areas and exported them to our<br />
CAD system.<br />
Ralf König said: “All in all the assignment<br />
in Berlin with the BSR was a great success<br />
and everything worked out very well. The<br />
project was for everyone a good experience<br />
and we hope that we could suite all needs.”<br />
Stefanie Peda reflects afterwards: “I can say<br />
that I am very happy about how everything<br />
worked out and we can be proud of the<br />
result. That is what counts in the end.”<br />
Dipl.-Hist Cornelius König, Scalypso Potsdam, Germany.<br />
For more information, have a look at www.scalypso.com
I n t e r v i e w<br />
North Pole Expedition<br />
Collecting Data Under Harsh<br />
Last April, a team of researchers went to the North Pole for a scientific program, where they performed<br />
data collection and measurements of weather data, ice-sea drift and plankton. The area’s climatic<br />
conditions required state-of-art equipment.<br />
By the editors<br />
First measurements at the North Pole<br />
Measuring radioactivity<br />
Study Area<br />
The geographical North Pole, due to its location in the middle of the<br />
Arctic Ocean, is a very relevant spot for studies for scientists. It is<br />
important to follow the North Pole’ sea-ice coverage evolution, especially<br />
its thickness, density and drift. What happens in the Arctic<br />
Ocean affects the rest of the world’s weather. The location of the<br />
North Pole, in the middle of this frozen ocean is also important for<br />
other studies, such as mercury data, microbiology and more.<br />
Last April, a team of researchers went to the North Pole to conduct<br />
scientific research, where they performed data collection and measurements<br />
of weather data, ice-sea drift and plankton. The team was<br />
composed of a former polar logistics engineer for the French and<br />
German Polar Institutes, Alan Le Tressoler and Julien Cabon, a journalist<br />
who has previous experience of the Arctic.<br />
The North Pole is a very difficult spot to go to and survive, says Alan<br />
Le Tressoler: “the sea-ice is not flat, and is full of open-water that<br />
needs to be crossed, either with the pulks or by swimming. You can<br />
also find compression ridges, which are composed of blocks of seaice<br />
that sit on each other, up to over 10 meters high.” Then there’s<br />
the extreme cold; the position can be very windy and one can often<br />
have polar bears as neighbors. Satellites are not exactly positioned<br />
above the geographic North Pole, so there’s a black spot of no data<br />
around the area, making human presence the only way to obtain<br />
that data and to get the samples, says Le Tressoler.<br />
Data Collection<br />
Every day, the team performed many hours of data collection, consisting<br />
of GPS data, taken as often as possible, as the sea-ice was<br />
constantly drifting, due to the wind and sea currents. Weather data<br />
was collected by a handy weather station. It was sometimes difficult<br />
to do sampling of snow and sea-ice, depending of the weather situation,<br />
says Le Tressoler: “we had to take off head protection in order<br />
to put on a special mask, in order not to contaminate the samples.<br />
We also had to change our “warm” gloves for scientific plastic<br />
gloves”.<br />
Collecting the plankton and sea water was also a bit difficult sometimes.<br />
Le Tressoler: “First of all, you have to make a big hole in the<br />
sea-ice in order to be able to put the big plankton net in the water.<br />
In some areas the sea-ice thickness is 1, 5 meters and it’s very hard<br />
14<br />
December <strong>2012</strong>
I n t e r v i e w<br />
Conditions<br />
Russian helicopter MI8<br />
ice to drill through with a manual ice-drill. Then, we saw a big square<br />
with a manual ice-saw. You have to cut it in many pieces, as one<br />
big one would be far too heavy to take out or push down.” That job<br />
could sometimes take almost a day. Using the same hole the day<br />
after would require opening it again, since the sea-ice thickness in<br />
the former hole would rise approximately 20 cm in 12 hours.<br />
Water properties such as temperatures, salinity and density were<br />
calculated. Then, we would put plankton nets in or a Niskin bottle<br />
to take water samples from different depths. The equipment was put<br />
down to different depths, with the maximum depth being 130 meters.<br />
Each time the equipment was brought back manually, the team’s<br />
trousers and gloves froze. Le Tressoler is optimistic about the weather<br />
during the work: “by chance the weather was very nice during<br />
the expedition, just a few days of wind and a record of “only” -<br />
36°C.”<br />
Data Analysis<br />
This kind of data has been rarely collected in this area, some of it<br />
almost never, and certainly not over such a long period. The expedition<br />
lasted “only” 3 weeks, but that was the maximum possible given<br />
the climatic and logistic circumstances.<br />
The data was first analyzed ‘on-site’ in a tent immediately after data<br />
collection thanks to the computer. If something “strange” or interesting<br />
was collected, this data was sent to the scientists who could then<br />
tell them what to sample for the next day. The most visual data on<br />
the computer was the sea-water data, says Le Tressoler: “we could<br />
see that there was a cold layer of sea just under the surface, then a<br />
few meters of “warm water”, and then the water became colder and<br />
colder into the deep. At some depths there were some changes,<br />
meaning that it should have been a great place to collect a lot of<br />
plankton.”<br />
After the expedition, the data and samples were transmitted to the<br />
lab directly. Le Tressoler says that the scientists studying the plankton<br />
were happy with the samples, as they are species that were not<br />
expected in this area so early, and in such a large quantity.<br />
Technology use<br />
For data collection, the team used the compact Algiz XRW ultrarugged<br />
notebook, under conditions which tested not only human<br />
endurance but also that of the quality and durability of the equipment.<br />
According to Le Tressoler, the computer was key to the suc-<br />
Latest News Visit www.geoinformatics.com December <strong>2012</strong><br />
15
I n t e r v i e w<br />
Scientific measurements with the Algiz XRW<br />
cess of the expedition: “without the computer,<br />
we could not have collected the scientific<br />
data and wouldn’t have been able to send<br />
daily pictures and comments about the expedition.“<br />
The computer had also a very important<br />
safety function: “we could directly connect<br />
our satellite phone to the computer,<br />
which would then work even with a flat battery.<br />
It could also be used to send photos or<br />
video of a possible bad injury to a doctor<br />
in a hospital in order to help if first aid was<br />
required.”<br />
The expedition expected a lot from the<br />
equipment: the team was looking for a powerful<br />
computer that could endure very cold<br />
weather and snow, without being too heavy.<br />
It also needed to be readable sunlight, could<br />
connect to the scientific instruments, and<br />
have powerful batteries, since they could not<br />
be recharged in the field. “The Algiz XRW<br />
was perfect for the expedition, since everything<br />
worked perfectly. The touch-screen of<br />
the computer was also fantastic, as we could<br />
work with the computer without having to<br />
take our different layers of gloves.”<br />
In cold environments, batteries are the main<br />
problem: it takes only a few minutes before<br />
they go down: “we needed batteries for the<br />
computer that can hold power for a long<br />
time when collecting water data. The batteries<br />
of the Algiz XRW are very impressive.<br />
They last forever in the cold environment,<br />
much more than what we thought was possible.”<br />
The next project<br />
A new project has already been planned for<br />
Spring 2013, on the west coast of Green -<br />
land. It is scheduled to last until summer<br />
2014. There is a lab onboard and different<br />
scientific equipment which will be used to<br />
mainly study sea-ice in this area. Two people<br />
will be onboard all year long: Alan Le<br />
Tressoler as skipper and expedition leader<br />
and Elin Austerheim, a marine biologist and<br />
scientific coordinator. Le Tressoler: “the boat<br />
can take up to five scientists. Of course, the<br />
Algiz XRW will be onboard as one of the<br />
most important pieces of equipment for the<br />
expedition: if outside temperatures should<br />
drop down to -45°C, it will not be that warm<br />
inside either, despite the heater; just above<br />
0°C.”<br />
Internet: www.handheldgroup.com<br />
16<br />
December <strong>2012</strong>
A r t i c l e<br />
A Socio-Technic Enterprise<br />
Securing the Spatial Environment<br />
Striving to develop a baseline spatial information system for cross-domain thematic analysis, Malta<br />
has embarked on a project aimed at integrating the environmental themes in their wider aspect: the<br />
natural, physical and social domains. Targeting the full data-cycle, the project focused on various activities:<br />
strategy drafting, data capture, information system development, acquisition of technologies, territorial<br />
zone scanning and ultimately, the development of a Shared Environmental Information System<br />
aimed at disseminating all the data for free to the general public.<br />
By Saviour Formosa, Elaine Sciberras and Janice Formosa Pace<br />
Figure 1: Aerial image depicting the Fort Chambray in Gozo<br />
An initiative started in 2006 and<br />
awarded in 2010, focused on the<br />
spatial data enhancement of information<br />
in the physical, social and natural environment<br />
domains, leading to an integrated<br />
monitoring system. The mechanism em ploy -<br />
ed to finance such a major undertaking<br />
formed part of a €4.6 million project, entitled<br />
Developing National Environmental<br />
Monitoring Infrastructure and Capacity. This<br />
project was co-financed by the European<br />
Regional Development Fund, which has provided<br />
85% of the project’s funding and the<br />
Government of Malta, which financed the<br />
rest under Operational Programme 1 -<br />
Cohesion Policy 2007-2013 - Investing in<br />
Competitiveness for a Better Quality of Life.<br />
The authors are implementing the project<br />
through the Malta Environment and Planning<br />
Authority in collaboration with the Malta<br />
Resources Authority (MRA), the Department<br />
of Environmental Health, the National<br />
Statistics Office (NSO) and the University of<br />
Malta.<br />
The project was required to span the divide<br />
between the theme-specific fieldworkers in<br />
the natural-physical-social environments, the<br />
relative information specialists, the thematic<br />
analysts and the policy makers. The problem<br />
to date has been garnered by the fear<br />
of information by social scientists on one<br />
hand and the society-phobic developments<br />
of the techno-centric experts on the other.<br />
The Maltese endeavor aims to create a<br />
socio-technic environment that sits in the middle<br />
and delivers high end technological<br />
functionality for the technology knowledgeable,<br />
whilst providing easily workable information<br />
systems for the phobics.<br />
Concentrating on creating a strategy and a<br />
series of methodological requirements for<br />
the environmental domains, the project<br />
sought to create baseline datasets in the spatial<br />
fields, through the ambitious launching<br />
of a high resolution 3D terrestrial data coverage<br />
for the Maltese Islands. This was<br />
undertaken through a combination of<br />
oblique aerial imagery (Figure 1) and Light<br />
Detection and Ranging (LIDAR) data (Figure<br />
2), as well as through a bathymetric survey<br />
18<br />
December <strong>2012</strong>
A r t i c l e<br />
Figure 3: The Blue area depicts the bathymetric sidescan zone, the<br />
brown depicts the bathymetric LIDAR zone and the green depicts the<br />
terrestrial LIDAR zone.<br />
of coastal waters within 1 nautical mile (nm)<br />
radius off the baseline coastline, which<br />
utilised a combination of bathymetric LIDAR<br />
surveys, acoustic scans and a physical grab<br />
sampling survey of the entire land area<br />
(316.16 km.sq) and the immediate marine<br />
area (361 km.sq) (Figure 3). The terrestrial<br />
and bathymetric scans were entrusted to<br />
Terraimaging and their subcontractors Aqua -<br />
BioTech Group.<br />
The main outputs to be disseminated to the<br />
public within an accessible interface comprise:<br />
• LIDAR Scan: Terrestrial (Topographic Light<br />
Detection and Ranging (LiDAR)) Digital<br />
Surface Model (DSM) and Digital Terrain<br />
Model (DTM) (316 km.sq)<br />
• Bathymetric LIDAR aerial survey - depths<br />
of 0 m to 15m within 1 nautical mile from<br />
the Maltese coastline (38 km.sq)<br />
• Bathymetric Scan: Acoustic (side scan<br />
sonar) Digital Surface Model and an<br />
acoustic information map of sea bed<br />
(361 km.sq)<br />
• High resolution oblique aerial imagery<br />
and derived orthophoto mosaic and tiled<br />
ima ge ry of the Maltese Islands (316<br />
km.sq)<br />
• Satellite imagery (GeoEye, RapidEye,<br />
Quickbird) (316 km.sq)<br />
In addition to the service deliveries, a number<br />
of supply technologies have been<br />
acquired and implemented. These include:<br />
• Remote GPS Cameras (Remote capture<br />
GPS receiver)<br />
• Integrated GI infrastructure (workstations,<br />
servers, san and GI raster/vector –based<br />
software)<br />
• 3D scanner and 3D printer<br />
• GIS Handhelds for field surveys<br />
• Global Navigation Satellite System Sta -<br />
tion<br />
There are many ancillary spin-offs envisaged<br />
from the activity, such as nautical charts,<br />
viewshed analysis maps and cross-thematic<br />
studies in the physical, social and environmental<br />
domains. Of special interest is the<br />
impact that the planning development has<br />
on the health and socio-psychological fields<br />
through shadow-analysis and other cross-thematic<br />
studies. Users will be able to generate<br />
digital terrain 3D models, which can be<br />
used for various applications planned for<br />
urban and transport planning, environmental<br />
impact assessments, infringement analysis,<br />
security review, green criminology, risk<br />
maps, climate change and its socio-economic<br />
impact, monitoring of and enforcement of<br />
land use activities and predictive analysis<br />
and migration, amongst others.<br />
All this will be possible through the implementation<br />
of an innovative product that<br />
adheres to international directives, in turn<br />
ensuring the free delivery of all project-related<br />
data to the general public. This drive<br />
effectively brings together the requirements<br />
Figure 2: Lidar image depicting the Maltese countryside<br />
as outlined by the Commission’s Com mu -<br />
nication COM (2008) 46 Final “Towards a<br />
Shared Environmental Information System”,<br />
the INSPIRE Directive (Directive 2007/2/EC)<br />
and the Aarhus Convention. The tool is<br />
being developed by Epsilon International<br />
through the creation of a viewing, analytical<br />
dissemination tool employing a web portal,<br />
which is compliant to the EU’s Shared<br />
Environmental Information System (SEIS). It<br />
will lead the way for voluntary geographic<br />
input, for which a system is to be launched<br />
in the coming months.<br />
Saviour Formosa is a Senior Lecturer at the University of Malta. His<br />
main area of research is in spatio-temporal analysis of crime and its<br />
social and physical relationships using spatial information systems.<br />
Elaine Sciberras is a senior projects officer within the Information<br />
Resources Unit at the Malta Environment and Planning Authority. She<br />
is currently part of the team managing an ERDF project, which is<br />
developing national environmental monitoring infrastructure and<br />
capacity. Janice Formosa Pace is a visiting lecturer at the University of<br />
Malta. Her main area of research is in the transmission of crime<br />
across the generations with emphasis on the period between 1950<br />
and 2010, in the Maltese Islands.<br />
Latest News Visit www.geoinformatics.com December <strong>2012</strong><br />
19
A r t i c l e<br />
Aerial Photography<br />
Capturing Cape Town<br />
Getmapping, a company that produces its own vertical aerial photography, oblique photography and<br />
height data, captured and delivered over 2500 km 2 of high resolution (6.25cm) imagery covering the<br />
entire City of Cape Town Metropolitan area.<br />
By the editors<br />
existing budget, and deliver the data in less<br />
time than it would have previously taken to<br />
produce standard (12.5cm) imagery.<br />
By using the A3, Geosense was able to overcome<br />
the challenges posed by the area’s terrain<br />
and airspace restrictions by flying at<br />
approximately twice the height of a conventional<br />
survey, with a footprint twice as large.<br />
By flying higher, many ATC restrictions were<br />
overcome, and by effectively flying half as<br />
many survey lines, Geosense was able to<br />
complete the project in a fraction of the time<br />
it would otherwise have taken. The captured<br />
imagery comprised 690,886 frames of<br />
imagery captured across 13,025 sweeps.<br />
Founded in 1999, Getmapping pioneered<br />
the concept of nationwide coverage<br />
of aerial photography. Today<br />
Getmapping produces its own vertical aerial<br />
photography, oblique photography and<br />
height data.<br />
Getmapping services a wide variety of business<br />
sectors including central and local government,<br />
utilities, the emergency services,<br />
media and publishing, property and construction,<br />
transport, communications and the<br />
environment across Great Britain and internationally.<br />
The Challenge<br />
Getmapping, through its African subsidiary<br />
Geosense, was commissioned by the City of<br />
Cape Town (CoCT) to provide the most<br />
detailed imagery of their municipality ever<br />
captured. The challenge was to capture, process<br />
and deliver over 2500 km2 of high resolution<br />
(6.25cm) imagery covering the<br />
entire City of Cape Town Metropolitan area.<br />
CoCT is one of the most pro-active Local<br />
Authority users of imagery in the world, and<br />
Green Point Stadium in Cape Town<br />
employs imagery across many of its service<br />
divisions including planning, enforcement<br />
and transport. CoCT is growing rapidly and<br />
undergoing significant change every year.<br />
As a result, CoCT requires regular surveys<br />
of its entire region to support a wide range<br />
of core services.<br />
The CoCT region covers the City of Cape<br />
Town, including outlying suburbs and the<br />
Cape Peninsula. The region also includes<br />
the world famous Table Mountain Park. As<br />
a result, undertaking aerial survey of the<br />
area faces a number of challenges created<br />
by significant variations in the terrain, as<br />
well as having to work around the busy<br />
Cape Town International Airport.<br />
The Solution<br />
Geosense deployed the VisionMap A3<br />
Digital Mapping System to meet CoCT’s<br />
challenge. Prior to this project, CoCT has<br />
mostly commissioned 12.5cm imagery for<br />
their entire region. However, by deploying<br />
the A3 system, Geosense was able to provide<br />
CoCT with full coverage of their region<br />
at high resolution, without stretching their<br />
In total, the survey took approximately 45<br />
hours including transits and occasional holding<br />
patterns from ATC. This compared to a<br />
similar number of hours for flying 12.5cm<br />
imagery of the region the previous year<br />
using a frame based camera system.<br />
Processing high resolution imagery for a<br />
project of this size would normally be very<br />
labour intensive and time consuming, to<br />
undertake aerial triangulation, mosaicing<br />
and finalising. However, the A3 Lightspeed<br />
Processing System automated many of these<br />
tasks and reduced the amount of manual<br />
effort by approximately 75%, delivering<br />
huge time and cost savings. Geosense was<br />
able to process all of the imagery rapidly<br />
and deliver the finished accurate and seamless<br />
imagery to the client within three months<br />
of starting the capture. The final delivery,<br />
consisting of a seamless, ortho-rectified<br />
mosaic of the entire CoCT area, is now in<br />
CoCT’s central GIS system and used<br />
throughout the organisation.<br />
For more information, have a look at: www.visionmap.com<br />
20<br />
December <strong>2012</strong>
A r t i c l e<br />
Data on the move<br />
Safe Software<br />
Data movers at Safe Software have been busy keeping up with the latest technology and data trends.<br />
Safe Software’s President and Co-founder Don Murray talks about recent releases and how the company<br />
is wrapping their heads around real-time data feeds, LiDAR, non-relational data tables and cloud<br />
computing.<br />
By Eric van Rees<br />
Interoperability extension<br />
Safe Software is known for its flagship<br />
product FME (Feature Manipulation<br />
Engine) for data transformation. Since<br />
the release of FME <strong>2012</strong>, the company<br />
has been keeping up with new<br />
technology and data trends. With a<br />
new release of Esri’s ArcGIS, version<br />
10.1, Safe Software has something to<br />
share regarding that; for starters a<br />
new version of the ArcGIS Data interoperability<br />
extension. This is an<br />
optional extension to ArcGIS that provides<br />
support for over 150 GIS, CAD<br />
and database formats. This update<br />
provides two years worth of improvements<br />
to the, which means a new<br />
focus on LiDAR data. Murray: “the<br />
ArcGIS Data interoperability extension<br />
makes it really easy for people to get<br />
LiDAR data into ArcGIS 10.1. LiDAR<br />
data is everywhere – railways are<br />
starting to put LiDAR scanners on the<br />
front, so they can measure track<br />
anomalies to better determine where<br />
tracks need maintenance, for example.<br />
Obviously, the data volumes are<br />
through the roof.”<br />
ArcGIS for Local<br />
Government<br />
The other big issue is local government. Esri<br />
has the ArcGIS for Local Government systems,<br />
which is essentially a data model.<br />
Murray: “once local governments get data<br />
into the data model, they’re able to leverage<br />
a lot of apps and maps at Esri. It’s easy<br />
to use our technology and, whether you’re<br />
coming from ArcGIS or from other systems,<br />
to get data into that data model, so that you<br />
can leverage all those apps which just come<br />
out of the box with ArcGIS for Local<br />
Government.”<br />
On the same ‘data moving theme’, there’s<br />
Parcel Fabric, which is part of the tools for<br />
Esri’s ArcMap. Murray: “it enables users to<br />
Don Murray<br />
manage their cadaster, for example, property<br />
boundaries, but it has its own data<br />
model. So in order to use that tool you have<br />
to put data into that data model. Many cities<br />
still use CAD for that, and then start moving<br />
that into ArcGIS. The easiest way to get that<br />
data in is to use cadastral XML. We’re showing<br />
people how easy it is with FME to take<br />
your cadastral fabric into the cadastral XML<br />
model, so you can then simply load that XML<br />
directly into ArcGIS.”<br />
FME Server in the cloud<br />
FME Server, Safe Software’s server product<br />
for handling large data volumes, can be<br />
deployed in the cloud now, says Murray.<br />
But, at the present moment, it’s not ‘software<br />
as a service’. Murray: “we have<br />
a number of clients who have deployed<br />
FME Server in the cloud: all of our FME<br />
Server sites that you hit are running on<br />
Amazon AWS. At this point we don’t<br />
have a ‘pay for use service’ model, but<br />
this will come out in the near future.”<br />
Putting up your own server is not a<br />
small task, says Murray, and that’s why<br />
clients approach Safe Software for<br />
doing this: “clients have specific tasks<br />
they want to perform, but they don’t<br />
want to go through the expense and<br />
effort of buying the hardware, bandwidth,<br />
security, and someone to manage<br />
it. From an efficiency and cost<br />
standpoint, there’s a good argument.”<br />
The big thing though, is data and<br />
where it resides. Murray:<br />
“Organizations are very hesitant to put<br />
their data in the cloud, because they<br />
need to know where the data actually<br />
resides. So if you’re in Europe for<br />
example, you probably don’t want your<br />
data stored in the US, because different<br />
countries have different laws on<br />
who has access to data.” Also, if the<br />
data is closer to you, you’re going to<br />
get a better response. The path is shorter<br />
and, therefore, there’s less chance of finding<br />
a bottleneck on the internet.<br />
Real-time data<br />
From the server side, Murray is seeing a lot<br />
of movement into real-time data. Murray:<br />
“there are sensors everywhere with real-time<br />
data-feeds – people want to leverage these<br />
live data-streams, combine it with their own<br />
data and make better faster decisions than<br />
they can with the traditional static data<br />
approach. On the FME Server front, we’re<br />
spending a lot of effort on that.”<br />
On FME Desktop, ‘formats’ define which systems<br />
we can work with. The more formats the<br />
more systems we can work with. Formats<br />
22<br />
December <strong>2012</strong>
A r t i c l e<br />
Location of buses, ships, and planes in the San Francisco area displayed on Google Maps using FME Server to process the real-time data feeds.<br />
cover everything from database, to files, to<br />
web services such as WFS. On the server,<br />
‘protocols” define the systems that our server<br />
can connect. The goal here is to add support<br />
for as many protocols as possible. Some popular<br />
ones that we support are HTTP (REST),<br />
FTP, email, UDP, and JMS. “The goal is to<br />
have as many protocols as possible so it is<br />
easy for people to get data into FME Server<br />
so it can do its thing”, says Murray.<br />
Big Data<br />
As for the Big Data move, the company has<br />
started looking at some of these things, for<br />
example CouchDB, an open source data -<br />
base system. Murray: “we’re experimenting<br />
with it but haven’t come up with a great user<br />
scenario at this point, but we want to make<br />
sure that they can get data in and out easily.<br />
And then we’re hoping to find somebody<br />
who knows what they want to do with it and<br />
grow the functionality to support that scenario.<br />
“<br />
It makes sense that datasets are, in general,<br />
exploding, says Murray: “just think about<br />
the size of a LiDAR dataset – the files are<br />
measured in tens of gigabytes. At this point<br />
we haven’t had a focus on big non-relational<br />
data tables, but it’s coming – the same<br />
goes for full-motion video.”<br />
A point cloud was colorized by using FME to overlay an orthophoto on a point cloud with no color information.<br />
Internet: www.safe.com<br />
You can read more of Don’s thoughts at http://blog.safe.com.<br />
Latest News Visit www.geoinformatics.com December <strong>2012</strong><br />
23
I n t e r v i e w<br />
On Acquiring Geosemble, Product Integration<br />
TerraGo<br />
In July <strong>2012</strong>, US-based TerraGo Technologies announced the acquisition of Geosemble Technologies.<br />
Rick Cobb is President and Chief Executive Officer of TerraGo. Here, he talks about the complementary<br />
product portfolios of both companies and what the future has in store.<br />
By Eric van Rees<br />
Rick Cobb<br />
TerraGo is a software company that provides<br />
a platform for the development of<br />
geospatial intelligence applications and<br />
reports. Based in Atlanta, Georgia, TerraGo<br />
has more than 1,000 paying software customers<br />
around the world. The company has<br />
clients in sectors such as defense and intelligence,<br />
homeland security, crisis planning and<br />
response, public safety, natural resources and<br />
energy. In July of this year, TerraGo an -<br />
nounced the acquisition of the technology,<br />
assets, and staff of Geosemble, a company<br />
from Manhattan Beach, California. Why did<br />
the TerraGo make this acquisition and what<br />
does this mean for both product portfolios and<br />
customer base Rick Cobb, President and<br />
Chief Executive Officer of TerraGo Tech no -<br />
logies explains all.<br />
of course there are a couple of common customers,<br />
as well, who use both of our solutions.”<br />
Both companies also share the same investor,<br />
In-Q-Tel, a non-profit venture capital firm “created<br />
to bridge the gap between the technology<br />
needs of the U.S. Intelligence Community<br />
(IC) and new advances in commercial technology.”<br />
Finally, Cobb discussed in earnest how both<br />
firms can be brought together to develop synergistic<br />
high-value applications, based on<br />
each other’s strengths. Cobb: “our expertise<br />
is heavy in bringing all kinds of different<br />
geospatial data together, putting it into context<br />
and delivering into the hands of the user<br />
who doesn’t have expertise in geospatial technology.<br />
Geosemble’s expertise is in the discovery<br />
and analysis of unstructured content<br />
from social media and more generally documents<br />
from the Web and elsewhere, making<br />
associations between that content and points<br />
of interest, then providing tools to visualize<br />
and find only that content which is relevant to<br />
the user’s particular interest or application. We<br />
bring the complementary technologies together<br />
to provide solutions for customers who want<br />
to discover geospatial information, package<br />
it and provide it to the edge in collaborative<br />
applications.”<br />
GeoXray and MapStrata<br />
TerraGo has a suite of software that supports<br />
desktop, server and mobile applications. The<br />
Geosemble technology comprises server-based<br />
technology, says Cobb: “Geosemble is best<br />
known for a product called GeoXray, a very<br />
powerful solution that allows people to plug-in<br />
to all kinds of unstructured data sources, like<br />
social media, news blogs and then mine all<br />
that data based on a topic, place and time.<br />
When a user passes unstructured data across<br />
a location or point of interest area in<br />
Geosemble, only the relevant material sticks.”<br />
GeoXray also lets people visualize on Google<br />
Maps and Google Earth, as well as maps provided<br />
by Web services, such as those provided<br />
by Esri’s ArcGIS Online. Also, GeoXray<br />
implementations enable visualization on enterprise<br />
geospatial assets, and that’s why they<br />
offer integration - with Esri software products.<br />
Geosemble and TerraGo<br />
When comparing the two companies, Cobb<br />
mentions the synergy across both, as well as a<br />
number of other common features: “both<br />
TerraGo and Geosemble support the same<br />
industries, and we have a similar mindset<br />
because we’re young and emerging companies.<br />
Through the acquisition, we got the<br />
opportunity to bring an exciting new set of<br />
capabilities to many more customers and then<br />
GeoXray overview<br />
24<br />
December <strong>2012</strong>
I n t e r v i e w<br />
GeoXray screenshot<br />
Cobb: “GeoXray is going to become a core<br />
capability. We have been developing serverbased<br />
and service-based technology to let<br />
people access and combine GIS data and<br />
other structured data and unstructured data<br />
and documents for some time now. In addition,<br />
we’ve been asked to tap into other<br />
sources, such as SharePoint, so we’re working<br />
on that. The goal is to be able to bring<br />
almost any data together on the map. The<br />
GeoXray capabilities greatly enhance our<br />
ability to deliver a single, coherent solution.”<br />
What a lot of people don’t know is that<br />
TerraGo has been developing server technology<br />
for a number of uses, such as homeland<br />
security, GeoEye and others. Cobb: “Geo -<br />
semble also has some interesting technology<br />
that is not as quite as productized as GeoXray,<br />
called MapStrata, which does conflation of<br />
all kinds of different data with imagery. So,<br />
for instance, users can take a satellite or aerial<br />
image and take a vector map without any<br />
geospatial registration and register the two<br />
with some really clever pattern recognition<br />
algorithms.”<br />
Integration with ArcGIS Server<br />
From an overall architecture functionality perspective,<br />
the acquisition is a good fit for<br />
TerraGo, says Cobb. How will the different<br />
products be developed further and integrated<br />
“The first thing we’re doing is integrating<br />
GeoXray with ArcGIS for Server. There are a<br />
growing number of sources of data for visualization<br />
and analysis out there, but at the end<br />
of the day, many of our customers want to use<br />
their own assets, and much of that is managed<br />
by Esri’s ArcGIS, so it’s a natural starting point.”<br />
This integration enables the following workflow:<br />
“if you do a search and identify a bunch<br />
of interesting content and now you want to<br />
create a mobile app, you push a button in an<br />
ArcGIS for Server implementation and push it<br />
out to TerraGo Mobile. Somebody in the field<br />
can now get maps, structured and unstructured<br />
data and content, add their own fieldcollected<br />
data and content, share it with everybody<br />
and send it back into the enterprise. “<br />
The ArcGIS for Server integration also enables<br />
access to GeoPDF maps, imagery and applications.<br />
The term GeoPDF sometimes causes<br />
misunderstandings. What is exactly meant by<br />
GeoPDF Cobb explains that GeoPDF itself is<br />
a trademark used to brand a suite of technologies<br />
developed by TerraGo: “a GeoPDF<br />
application has content, it has functionality, it<br />
has digital rights, it’s interactive, and it works<br />
in the TerraGo workflow. With TerraGo software,<br />
I can make my own content, import<br />
shapefiles, export KML and more, to personalize<br />
my GeoPDF maps. To us, a GeoPDF is<br />
a core set of technologies that represents<br />
mobility and interactivity and collaboration.<br />
What makes GeoPDF GeoPDF is not the georeferencing<br />
technique, which we opened and<br />
released through OGC and elsewhere, but<br />
rather the creation, configuration, and collaboration<br />
capabilities that are made possible by<br />
our software.”<br />
Roadmap of TerraGo<br />
The acquisition has its consequences for both<br />
companies’ release schedules. TerraGo issued<br />
a major release last summer: “In July <strong>2012</strong>,<br />
we released Version 6 (V6), which spans the<br />
core software products - Composer, Publisher,<br />
the SDK and TerraGo Toolbar. These were<br />
upgraded and more deeply integrated. We<br />
added some neat technology like geoforms<br />
for doing structured field data collection and<br />
collaboration infrastructure to share near realtime<br />
information in the field.”<br />
The company also is planning a major mobile<br />
release. Cobb: “we’ve completely written<br />
TerraGo Mobile for Android from scratch,<br />
including our own powerful rendering engine<br />
because there’s really not much out there.<br />
Over the past year and a half we’ve built an<br />
entire front to back solution in the core<br />
TerraGo technology products. Most exciting<br />
of these is TerraGo Mobile for Android which<br />
on schedule for a November release.”<br />
As for Geosemble technologies, there are<br />
already plans for how to work with them, says<br />
Cobb: “they shipped the brand-new release<br />
GeoXray Version 3 last April that includes significant<br />
new functionalities and features. In<br />
particular, we’re working on scalability and<br />
usability, a few things that will solidify the current<br />
offering and then we’ll start the initial integration<br />
work.” This integration is not so much<br />
between the product lines initially, but into the<br />
workflow. Cobb: “The good news is we didn’t<br />
have to rip anything apart to rebuild it, so<br />
these are standalone solutions we get to integrate<br />
at more of a services level, which is a<br />
very powerful way to do it.”<br />
GeoXray screenshot<br />
Internet: www.terragotech.com<br />
Latest News Visit www.geoinformatics.com December <strong>2012</strong><br />
25
C o l u m n<br />
Smart Cities and Cooperation<br />
Futuristic scenarios will become reality as integrated standards platforms<br />
enable cities’ and citizens’ information systems to integrate information from<br />
GIS, BIM and civil engineering documents and services.<br />
Smart City advancement depends on a platform<br />
of communication infrastructure that<br />
enables seamless interoperation of diverse<br />
systems for representing the urban world, including<br />
systems for design – CAD, BIM and Civil Engi -<br />
neering software – and systems for observation and<br />
management – sensors, imaging and geospatial<br />
processing. These systems were created by different<br />
professional communities to solve different kinds<br />
of problems. The communities have different cultures,<br />
vocabularies and worldviews, so they tend<br />
to deal with their in-community interoperability<br />
needs in different ways.<br />
Despite these differences, progress toward interoperation<br />
moves forward, because the Smart City<br />
vision and the BIM vision become increasing compelling<br />
for both governments and businesses, and<br />
because at the same time cooperation in the standards<br />
organisation ecosystem is advancing.<br />
Some of the key players in the location standards<br />
ecosystem are the Open Geospatial Consortium<br />
(OGC), ISO/TC 211 (Geographic informa -<br />
tion/Geomatics), ISO/TC 59/SC 13 (Organi -<br />
zation of information about construction works) and<br />
Building Smart International (bSI). In October, at<br />
the Smart Geospatial Expo <strong>2012</strong> conference in<br />
Seoul, Korea, the OGC organized an “Inter oper -<br />
ability Day” along with the ISO/TC 211 ad hoc<br />
group on GIS-BIM, ISO/TC 59/SC 13 and the<br />
Korea Ministry of Land, Transport, and Maritime<br />
Affairs. This Joint Workshop was titled “The<br />
Challenge of GIS-BIM Standardization for<br />
Ubiquitous Public Access”. Representatives of the<br />
organizations made presentations and participated<br />
in discussions designed to help each organization<br />
understand the others’ problem sets, cultures,<br />
vocabularies and worldviews.<br />
Also in attendance were representatives from companies<br />
such as Autodesk, Bentley, Leica and Trimble<br />
who have much to gain from standards that will<br />
expand the market for products like theirs.<br />
Most of these companies have representatives who<br />
participate in the standards work of two or more<br />
of the four organizations. While written agreements<br />
between the organizations set the stage for cooperation,<br />
ongoing collaboration in technical meetings<br />
allows standards organizations to dig into the<br />
details, aligning their respective standards work<br />
programs and providing a workable set of standards<br />
that hide the differences among the systems.<br />
The OGC has liaised with ISO TC/211 for sixteen<br />
years (some OGC standards are now also ISO standards),<br />
and the OGC also has a memorandum of<br />
understanding with bSI. Several years ago, the<br />
OGC and bSI’s American member organization,<br />
the buildingSMART alliance (bSa), worked together<br />
in the joint bSa-OGC Architecture/Engineering<br />
/Construction/Owner/Operator Testbed (AECOO-<br />
1). The AECOO-1 Testbed was an exploratory step<br />
towards achieving service-based interoperability in<br />
the AECOO world. Today bSI is working with<br />
ISO/TC 59/SC 13 on matters related to the bSI’s<br />
Industry Foundation Class (IFC) specifications.<br />
Within the OGC, the 3D Information Management<br />
Domain Working Group (3DIM DWG) has long<br />
provided a forum to advance action to address<br />
standards related to CAD/BIM/geospatial integration<br />
as well as 3D information models.<br />
The OGC City Geography Markup Language<br />
(CityGML) Encoding Standard was built on top of<br />
the OGC Geography Markup Language (GML)<br />
Encoding Standard, and now CityGML is becoming<br />
widely used for the storage and exchange of<br />
virtual 3D city models.<br />
Visualization is an important factor in communication<br />
among the inhabitants of Smart Cities, and<br />
therefore the OGC, working closely with the<br />
Web3D Consortium, recently completed the 3D<br />
Portrayal Interoperability Experiment (3DPIE) to test<br />
and demonstrate different approaches for servicebased<br />
3D visualization using two related candidate<br />
OGC standards for 3D portrayal: the OGC Web<br />
3D Service (W3DS) and Web View Service (WVS)<br />
Interface standards. CityGML, and perhaps W3DS<br />
and WVS, will play an important role in Smart<br />
Cities, but they are not the whole solution.<br />
It is within OGC’s mission to enable interoperability<br />
between existing established workflows, to connect<br />
the Civil, Geospatial and Building worlds and<br />
to incorporate emerging technologies like Aug -<br />
mented Reality and Sensor Webs for the Internet of<br />
Things.<br />
Raj Singh,<br />
Director of Interoperability Programs<br />
Open Geospatial Consortium (OGC).<br />
C O L U M N<br />
Latest News Visit www.geoinformatics.com December <strong>2012</strong><br />
27
A r t i c l e<br />
A Specification Synthesis<br />
Terrestrial Laser Scanning<br />
In recent years, the use of terrestrial laser scanners (TLS) has spread rapidly throughout the world,<br />
undoubtedly due to their survey speed and automation, but probably also for their novelty value. The<br />
technology has certainly influenced the improvement of previous well-known techniques (for instance,<br />
close-range photogrammetry), with the development of issues such as dense point-cloud generation,<br />
process automation and large technique synergy. But, what specifications should currently be under<br />
consideration for terrestrial scanning works With these points in mind, this article analyses the basic<br />
themes connected with this technology and presents them as a specification synthesis, with examples.<br />
By Luigi Colombo and Barbara Marana<br />
Figure 1: The scanning step specifications<br />
Scanning and imaging<br />
Laser technology is the metrological basis of terrestrial measurement<br />
systems for object description. They are transportable and reliable<br />
devices, which record panoramic point clouds, with sophisticated<br />
servo systems for movement control.<br />
The point relative precision is usually higher than 1/10,000: it matches<br />
an absolute precision < 10 mm inside a range up to 200 m.<br />
The object scanning resolution (namely sampling)<br />
is achieved through a combination of:<br />
device-object distance, azimuthal and zenithal<br />
laser beam slant and object surface morphology.<br />
The point positioning precision (reflectorless<br />
or with optical targets) is a combination<br />
of: distance, beam divergence (the spot footprint),<br />
object morphology, surfaces material<br />
reflectivity (light, dark, mat, translucent, etc.)<br />
and environment.<br />
The scanning survey technique allows interactive<br />
procedures without accuracy check<br />
(redundancy is not assured) for the acquired<br />
points, unless measurements are taken from<br />
different locations. The surveyed surface is<br />
reconstructed in an independent way and then<br />
proper statistic comparisons are calculated.<br />
Figure 2: Sampling grid and laser footprints<br />
Figure 3: Scanners: a) phase-difference laser device with a superimposed photo-camera, b) and c) laser<br />
scanner with the support for an external photo-camera, d) time of flight scanner with photo-camera<br />
The new terrestrial device generation, based on phase difference<br />
and width modulated waves, are highly versatile solutions to survey<br />
built objects in medium range (100-200 m), allowing panoramic<br />
scanning of good precision. The acquisition<br />
rate is very high (up to 1,000,000 points per<br />
second) and so it is possible to also provide<br />
pseudo-dynamic applications.<br />
The scanning field of view is nearly spherical<br />
(360° horizontal and 305-320° vertical), the<br />
points precision is accurate to a few millimetres<br />
and a direct measurement can be realized<br />
on natural surfaces, even dark ones, and<br />
in reduced energy return conditions (at least<br />
5 % of the emitted one).<br />
By comparison, time of flight scanners allow<br />
only sub-panoramic acquisitions (about 360°<br />
x (60°-100°)), have medium speed, lower precision,<br />
but quite a high range (up to some<br />
thousands of meters); for this reason, they are<br />
also suitable for land measurement.<br />
28<br />
December <strong>2012</strong>
A r t i c l e<br />
Specifications<br />
Figure 4: Texturing: a) low resolution point cloud, b) good resolution point cloud, c) mesh with a<br />
re-projected image<br />
The acquisition time for a panoramic scan takes only a matter of<br />
minutes, despite very dense sampling. The final 3D point-model can<br />
be mapped with materic reflectance values or photo textured with<br />
colour images, so as to provide a realistic depiction of the surveyed<br />
object.<br />
Specifications for acquisition<br />
It is interesting to note that the following scanning specifications refer<br />
to (and partially complete) some executive proposals suggested in<br />
2006 by the English Heritage (www.heritage3d.org).<br />
We know that the sampling step is highly influenced by the object<br />
morphology and dimensions, by the required level of detail and,<br />
obviously, by the expected precision, which limit the choice of the<br />
most suitable surveying device.<br />
A survey project always starts from definition of Level of Detail (LoD)<br />
and required precision.<br />
It is possible to proceed according to the following steps.<br />
1) The dimension dr of the smallest object-element, to be recognized<br />
in the reconstructed model, is assigned together with a level of identification<br />
probability p%; then, the corresponding linear sampling<br />
step s (to be kept constant horizontally and vertically) can be calculated.<br />
From the English Heritage relationship:<br />
identification probability = p% = (1 - s/dr) x 100;<br />
set N = 1/ (1- p% / 100), it follows dr/s = N.<br />
Given dr and p%, the value s of the useful sampling step is derived.<br />
Figure 5: Image draping: the original photos (top) and the stitched panoramic image (bottom)<br />
Figure 1 shows the relationship of the ratio dr/s with the probability<br />
level.<br />
2) The low noise of the points acquired over the scan demands the<br />
fulfilment of the conditions s ≥b/2 or , preferably, s ≥ b (see fig. 2),<br />
between the grid step s and the laser beam footprint b.<br />
In fact, it is known that the laser beam footprint b follows the relationship<br />
b = b 0 + dα, with b 0 = the sensor spot at emission, d the<br />
working range and α the beam angular divergence.<br />
3) Finally, the laser precision σ should satisfy the numerical relation<br />
σ ≤ s.<br />
Anyway, the real scanning step performed over the object depends<br />
on the geometric conditions (normality or not) of the beam impact<br />
and, generally, on the surface morphology.<br />
To avoid loss of information or its decay, it is advisable to discard<br />
cloud areas acquired with too many slanting points of view (normal<br />
deviation > 45°, both horizontally and vertically).<br />
According to survey occlusions, a scan is assumed to be globally<br />
acceptable with data voids (holes) smaller than 5% of the whole surface;<br />
data voids are areas without points, whose dimension is at<br />
least 3 times greater than the sampling step s.<br />
It is also possible to scan at different LoD, while decreasing both the<br />
area of interest and the sampling step.<br />
Some laser scanners are provided with auxiliary devices, such as a<br />
GNSS positioning sensor, an inclinometer (to calculate the verticality<br />
of the azimuthal rotation axis) and a compass for angular bear-<br />
Latest News Visit www.geoinformatics.com December <strong>2012</strong><br />
29
A r t i c l e<br />
The point model can then be geo-referenced thanks to control points,<br />
with a surveying measurement, inside the selected reference system;<br />
the result is acceptable only if the residuals for each coordinate are<br />
less than 2s (with a statistical confidence of 95%).<br />
Figure 6: Point models of exteriors, with reflectance values, and<br />
interiors, with photo-texturing<br />
ing: all this can simplify the cloud registration and final geo-referencing.<br />
Operating steps<br />
The scanning procedure can be outlined as follows:<br />
1 Set the scanner to the dimension dr of the smallest object element,<br />
which is to be identified over the reconstructed model and then it<br />
should be possible to gain the sampling step s.<br />
For instance, if a probability level p equal to 67% is selected, then<br />
it follows N = 3 and then s = dr/ 3.<br />
Additionally, the precision for point positioning must satisfy the specification<br />
σ ≤ s;<br />
2 Define the range d of the surveyed area;<br />
3 Choose the most fitting laser device according to precision, range<br />
and speed;<br />
4 Calculate the laser beam footprint b, according to the angular<br />
divergence (b = b 0 + dα) in the interest area, which has to fulfil<br />
the specification s ≥ b/2.<br />
Point model construction<br />
All point clouds, usually panoramic and well overlapping, are connected,<br />
via software, to provide a 3D point model in a common reference<br />
system (for instance, the one from the most barycentric scan).<br />
The model can then be geo-referenced within an assigned coordinate<br />
system.<br />
The registration procedure between groups of clouds is initially<br />
achieved with the support of control points (at least 5 common points),<br />
which have been pre-targeted on the boundary and at the centre of<br />
the overlapping area (targets of fitting dimension and shape).<br />
Then, cloud registration is refined automatically, according to iterative<br />
alignment techniques (such as ICP algorithm, etc.) which use<br />
homologous features (points, lines and polygons) selected over cloud<br />
groups, so as to estimate the transformation parameters.<br />
In order to limit random errors, cloud connection is usually accomplished<br />
according to a procedure which initially links each of them<br />
to a pre-selected reference cloud and then minimizes the residuals<br />
with a further global approach.<br />
The result is only acceptable when the residuals Δx, Δy, Δz (among<br />
clouds) are less than:<br />
1 2s, for each coordinate, over the targeted control points (with a<br />
statistical confidence of 95%);<br />
2 s, for each coordinate, after accomplishing the matching procedure<br />
over features (with a statistical confidence of 95%).<br />
Photo-texturing<br />
Photo-texturing, which allows the construction of a realistic model<br />
(both for geometric and qualitative reading), is performed by draping<br />
images over the surveyed model, with the support of the internal<br />
and external orientation parameters.<br />
It is important that the digital photo camera is calibrated and integrated<br />
precisely with the scanning device. Doing this ensures the<br />
point clouds are already “coloured”. Additionally, as integrated cameras<br />
provide medium resolution images, it is often useful to acquire<br />
additional images of higher resolution, with external cameras.<br />
This means that photographs can be taken both on-line whilst scanning<br />
(through an integrated photo-camera) and off-line with an external<br />
camera. In addition, a series of shots are taken through wide<br />
angle or fish eye lenses, from the same scanning positions, so as to<br />
limit parallax errors (fig. 3). After this, each image is re-projected:<br />
• directly over the point cloud if it has a resolution at least homogeneous<br />
with that of the image: namely, if the sampling step s is<br />
nearly equal to the image pixel over the object (Ground Sampling<br />
Distance);<br />
• over a surface model (mesh model), reconstructed from point<br />
clouds, if the image has a resolution much higher than scans; the<br />
aim being to preserve its quality (fig. 4).<br />
In order to avoid having to manually re-project the images, one at a<br />
time over the model, which would require the selection of a high<br />
number of homologous points (to tie each image to the model); one<br />
could use stitching software to produce a few panoramic images<br />
from the acquired ones. (fig. 5).<br />
In fact, the homologous point search for co-registration between each<br />
image and the model is actually performed in a semi-automatic way,<br />
due to the continued existence of insufficient computing reliability.<br />
In any case, the results of the projecting process must be checked<br />
by analysing the residuals over tie points.<br />
The photos must be taken with a proper overlay, so as to minimize<br />
the effects from the line of sight slanting and occlusion effects<br />
(figure 6).<br />
In fact, both dynamic and static occlusions limit the completeness of<br />
the depiction. In order to overcome this problem, it is advisable to<br />
start surveying only after careful consideration to identify suitable<br />
shooting positions.<br />
Output<br />
Usually the following documentation, consistent with the customer<br />
software packages, is requested:<br />
1 a 3D digital coloured and measurable point model with phototextures;<br />
it will provide the free software for the model viewing<br />
and virtual visit, together with the tools for coordinates, distance<br />
and area evaluations;<br />
2 2D vector drawings, such as scaled orthographic views, horizontal<br />
and vertical profiles, plans, sections, DTMs, contour lines, elevations.<br />
Furthermore, in order to provide object elevations, it is possible to<br />
start from a raw draw, acquired in a semi-automatic way, through<br />
cut planes and angular-discontinuity-line extraction (according to the<br />
evaluation of the Normal-direction variability over the recorded<br />
points).<br />
This first output can be integrated later by tracing over orthographic<br />
views, direct survey and manual editing.<br />
30<br />
December <strong>2012</strong>
A r t i c l e<br />
Figure 7: The trade software<br />
Geometric and qualitative testing<br />
All the provided output has to be verified by sampling (≥10%), both<br />
for metric and qualitative features.<br />
In the beginning, a comparison is carried out between corresponding<br />
distances measured on the model and on the object; they must<br />
cross different clouds and should be easily identifiable, due to phototexturing.<br />
The residuals between distances (model minus object) must fulfil (with<br />
a statistical confidence of 95%) the condition Δd ≤ 2s .<br />
The accuracy of the cloud alignment can also be enhanced visually<br />
by colouring in, in complementary ways, the adjacent point clouds<br />
and verifying the resulting chromatic effect in the overlapping areas.<br />
It is important to check the continuity of the reconstructed entity<br />
boundaries and those of the extracted section profiles (which must<br />
be allowed despite occlusions and data voids), radiometric quality<br />
and colour uniformity.<br />
Examples<br />
a) First case<br />
Acquisition<br />
1 with a selected probability level (for instance 67%), the smallest<br />
detail dr is set to be identified over the reconstructed model: given<br />
dr = 20 mm →s = dr/3 = 6.7 mm (≅ 7 mm) and the expected<br />
precision σ ≤ 7 mm;<br />
2 the maximum scanning range is prefixed to: d = 30 m;<br />
3 the laser scanner choice is Z+F 5010; this instrument does not<br />
have a built-in calibrated camera for direct photo-texturing. The<br />
constructor precision for the selected range is σ ≅ 1 mm (therefore<br />
σ ≤ s);<br />
4 The footprint maximum value (data provided by the constructor):<br />
b = 12.5 mm is checked;<br />
5 the condition: sampling step s (mm) ≥ 12.5/2 mm is verified.<br />
Model construction<br />
6 residuals (with a statistical confidence of 95%) among clouds ∆x,<br />
∆y and ∆z ≤ 2s (14 mm);<br />
7 residuals (with a statistical confidence of 95%) among clouds,<br />
after entity matching, ≤ s (7 mm);<br />
8 geo-referencing residuals (with a statistical confidence of 95%) ≤<br />
2s (14 mm);<br />
9 testing residuals (with a statistical confidence of 95%) for distances<br />
≤ 2s (21 mm).<br />
b) Second case<br />
Acquisition<br />
10 with a selected probability level (for instance 80%), the smallest<br />
detail dr is set to be identified over the reconstructed model:<br />
given dr = 25 mm → s = dr/5 = 5 mm and the expected precision<br />
σ ≤ 5 mm;<br />
11 the maximum scanning range is prefixed to: d = 50 m;<br />
12 the laser scanner choice is: Leica HDS 6100 or Z+F 5006h;<br />
these instruments do not have a built-in calibrated camera for<br />
direct photo-texturing. The constructor precision for the selected<br />
range is σ ≅ 2 mm (therefore σ ≤ s);<br />
13 The footprint maximum value (data provided by the constructor):<br />
b = 14 mm is checked;<br />
14 the condition: sampling step s (mm) ≥ 14/2 mm must be accomplished.<br />
Point 5 is not true.<br />
So as to provide a sampling grid at the established level of probability,<br />
it is necessary to limit the scanning maximum range to 30 m<br />
(then b = 9.6 mm), or to get the requested reliability level to a lower<br />
value, such as 67%: then it follows s = 8.3 mm.<br />
Steps 6), 7), 8) and 9) are as above.<br />
Hardware and software<br />
All current laser scanners are usually of good quality, in spite of different<br />
operating features and costs. The provided hardware is certainly<br />
of a higher reliability level, as compared to the processing<br />
software currently available. This is still a sticking point for this emergent<br />
survey technique.<br />
In data processing, some steps are almost totally automated, such<br />
as the acquisition phase, while others must still be improved, such<br />
as for the model reconstruction and data co-registration. Other steps,<br />
such as elevation and extraction, will probably remain semi-automated.<br />
Furthermore, in order to provide the requested output and meet the<br />
different end-user data management capabilities, technicians often<br />
have to use different packages (scanning control software, general<br />
processing, specific software).<br />
A global overview of the present main trade packages is shown in<br />
fig. 7.<br />
Expectations<br />
Nowadays, expectations for technology improvement are aimed<br />
towards the growth of the degree of automation, reliability and<br />
speed of data processing, in order to provide a nearly expert system<br />
for applications.<br />
To clarify, it would be prudent to enhance the following working<br />
steps:<br />
• cloud registration;<br />
• spatial model texturing and image co-registration;<br />
• production of satisfying 2D output, such as elevations, plans, vertical<br />
sections, together with gridding and contour-line drawings.<br />
Luigi Colombo is professor of Geomatics and Barbara Marana is assistant professor at the University of<br />
Bergamo - Engineering Department - Dalmine (Italy).<br />
References:<br />
• Aguilera D., Gonzàlvez P., Lahoz J. (2009) - An automatic procedure for co-registration of terrestrial laser<br />
scanners and digital cameras - ISPRS Journal of Photogrammetry and Remote Sensing, 64 (3).<br />
• Colombo L., Marana B. (2011) - Surveying buildings. GeoInformatics - vol. 7.<br />
• Colombo L., Marana B. (2010) - Terrestrial laser scanning. GIM International - vol. 12.<br />
Latest News Visit www.geoinformatics.com December <strong>2012</strong><br />
31
E v e n t<br />
Public and Private Sector Discuss Current Trends in the Industry<br />
Intergeo Press Conference <strong>2012</strong><br />
Wednesday October 10 was the date for the yearly press conference at the Intergeo Conference and<br />
Trade Fair, organized by DVW e.V. - the German Society for Geodesy, Geoinformation and Land<br />
Management. Representatives from the public and private sector discussed a number of international<br />
trending topics in the industry.<br />
By Eric van Rees<br />
comes to standardizing quality of data, and<br />
therefore ‘the question of quality is a relative<br />
one’.<br />
All speakers during the International press conference at Intergeo <strong>2012</strong>, organized by DVW e.V. - the German Society for Geodesy, Geoinformation<br />
and Land Management (source: Hinte Messe)<br />
It’s a tradition that every Intergeo edition<br />
features a press conference with national<br />
and international speakers from the private<br />
and public sector. Speakers present this<br />
year were Prof. Ing. Karl F. Thone (President<br />
DVW e.V.), Steve Berglund (President of<br />
Trimble), Teo CheeHai (president of FIG),<br />
Jean-Yves Pirlot (President of CLGE), Dr.<br />
Andreas Scheuer (Parlimentary State<br />
Secretary at the Federal Ministry of<br />
Transport, Building and Urban Development)<br />
and Arnulf Christl (President OSGeo FOSS-<br />
GIS).<br />
Topics discussed covered many issues pertinent<br />
to the surveying profession, including<br />
the changing nature of the profession, now<br />
that new technology is enabling surveyors<br />
to do their work differently. Crowdsourcing<br />
is also raising questions within the profession:<br />
when do you need a surveyor in the<br />
field Surveying organizations such as FIG<br />
and CLGE, who represent their members,<br />
have requested more visibility in the political<br />
arena, not only to support their members,<br />
but to show the necessity for qualitative<br />
data. The topic of free available data is<br />
also proving to be a rather difficult one, as<br />
the private and public sectors are often at<br />
loggerheads with one another, as they have<br />
different interests.<br />
Geospatial data quality<br />
Spatial data quality is a topic that popped up<br />
a number of times during the one hour press<br />
conference. The quality of crowdsourced data,<br />
as opposed to authoritative data, was questioned.<br />
As there are already many industry<br />
standards, do we need more standards or<br />
would one single industry standard be better<br />
Steve Berglund summed it up best by saying<br />
that there may not be a universal standard that<br />
applies to all uses, but rather there may be<br />
various standards as defined by the user and<br />
within that context. Also, not all functions<br />
require the highest attainable accuracy “if you<br />
are using data to do a critical function in construction<br />
or infrastructure, the quality of the<br />
data needs to be perfect or as close as to perfection.<br />
For another purpose, using geospatial<br />
data, good enough is good enough.”<br />
What will be a challenge though, is defining<br />
the quality of huge amounts of data. Berglund<br />
stated that Trimble, as a technology company,<br />
works on building solutions relative to specific<br />
circumstances of an industry when it<br />
The surveying profession<br />
As expected, surveying representatives’ organizations,<br />
such as FIG and CLGE, discussed<br />
the changing nature of the surveying industry<br />
and pleaded for more organization with politicians<br />
on a regional level and collaboration<br />
on a local level.<br />
Jean-Yves Pirlot mentioned the Third CLGE<br />
Conference of the European surveyor, which<br />
was organized together with the Intergeo<br />
Conference and Trade Fair on October 11th,<br />
as an example where European surveyors<br />
shared national case studies and experiences.<br />
He explained that one of the organization’s<br />
tasks is to appear on the radar of policy makers,<br />
but that in the case of Brussels, this is very<br />
difficult. The good news is that Europe has recognized<br />
CLGE as an organization representing<br />
the profession as a whole, not only the private<br />
sector, but also in the public sector.<br />
Public and private sector views<br />
on geospatial data<br />
With organizations such as FIG and CLGE<br />
functioning as a sort of intermediate between<br />
the public and private sector, commercial companies<br />
are forced to develop strategies in the<br />
short term, whilst governments can make policies<br />
for years ahead. The two are closely<br />
linked, however, since it’s these indicators that<br />
create an environment where commercial<br />
companies have to operate. Says Bergland:<br />
“there need to be clear indicators in terms of<br />
what are the right behaviors, in other words<br />
clarity and certainty of governmental regulations<br />
– the more confused they are, the more<br />
difficult it is for companies as Trimble to produce<br />
practical solutions. The more clear and<br />
certain, the better.”<br />
As for the use of new technology, he stated<br />
that technology enables solutions, but they are<br />
32<br />
December <strong>2012</strong>
E v e n t<br />
not the same thing: “the cloud and the internet<br />
are enablers in some sense, the same way<br />
that infrastructure development of a hundred<br />
years ago – harbors and roads – were<br />
enablers. They are enabling technologies that<br />
lead us to solutions.”<br />
The remainder of the discussion was about<br />
free geospatial data. Should governments<br />
give away their authoritative data for free<br />
And who has to pay for creating this data<br />
Unfortunately, there are still no easy answers<br />
to this one. In the US, the assumption is that<br />
the bulk of geospatially referenced data available<br />
will not be coming from governments, but<br />
that there will be multi-sourcing of data from<br />
a number of different sources. Bergland mentioned<br />
a regulated environment that will be<br />
‘government-focused’ with the official certification<br />
associated with it, as well as a lot of<br />
other participants that will make their data<br />
available. But then, there’s the question of the<br />
quality of that data since there’s no quality<br />
guarantee. In short: more free data, but without<br />
the official certification.<br />
Internet: www.intergeo.de
A r t i c l e<br />
An Introduction<br />
Make Web Maps with MapBox<br />
New technologies have emerged that are making web mapping much simpler and more accessible to<br />
cartographers, GIS specialists, and those with less specialized skills alike. Mapbox is one such a tool.<br />
By Bonnie Bogle<br />
A look at Washington, DC in MapBox Streets.<br />
Mapbox is a platform for creating<br />
beautiful interactive maps and<br />
sharing them on the web and<br />
mobile devices. It starts with a beautiful<br />
world street map as a base layer, which you<br />
can style and add location markers to<br />
through a web-based interface. Then you<br />
can add your own data using TileMill, a free<br />
desktop application for web cartography.<br />
Finally, share your maps on the web or<br />
mobile devices through a scalable and fast<br />
web service with embed codes and a robust<br />
API. MapBox is designed to be easy to use<br />
and flexible — new users can get started by<br />
changing the color and style of a map and<br />
adding points of interest to it, and more<br />
advanced cartographers can experiment<br />
with compositing, hexagonal binning, heat<br />
maps, and other artistic techniques.<br />
from a drop down. The<br />
colors and saturations of<br />
roads, areas, water, and<br />
land can all be changed<br />
using the color selector.<br />
Markers showing points<br />
of interest like museums,<br />
res taurants, or bus stops<br />
can be manually added<br />
to the map. The design<br />
of markers is flexible too,<br />
with the wide variety of<br />
icons and colors available<br />
through the Maki<br />
icon set.<br />
Using just these features,<br />
users can create custom styled maps that<br />
match the interface of their website or the<br />
look and feel they’re going for — with no<br />
technical skills and very little time required.<br />
Dive into advanced cartography<br />
Beautiful maps and the flexible tools to make<br />
them are at the heart of MapBox, and at the<br />
very core of this is TileMill. TileMill is an<br />
open source desktop application that simplifies<br />
designing beautiful web maps and<br />
adding custom, interactive data to them.<br />
While theming out MapBox Streets and<br />
adding data points is possible through the<br />
MapBox interface, TileMill is for advanced<br />
uses like adding large custom data sets to<br />
the map, adding interactivity and hover<br />
details, or experimenting with water color<br />
or pirate map designs.<br />
TileMill can pull data in from a range of popular<br />
file formats and databases including<br />
ESRI Shapefile, KML, GeoJSON, GeoTIFF,<br />
PostGIS, and SQLite. It uses the rendering<br />
engine Mapnik, a powerful, full-featured<br />
library that supports features like RGBA<br />
color, True Type fonts, rasters, patterns, and<br />
SVG transforms. Within TileMill itself, users<br />
can manipulate map design through an easy<br />
to use editor using CartoCSS, a language<br />
inspired by CSS the stylesheets used in web<br />
design, that gives full control and flexibility<br />
over map design. There are many built-in<br />
examples to help new users grab code and<br />
get familiar with CartoCSS, while power<br />
users can dive in and hack away.<br />
It’s also easy to add interactivity to maps<br />
through tooltips and clickable pop ups,<br />
revealing context, photos, graphs, and other<br />
details when desired. TileMill uses UTF-8<br />
grid technology to leverage interactivity for<br />
hundreds of thousands of data points while<br />
keeping maps fast.<br />
Share maps online<br />
Beautiful maps want to be seen. However,<br />
getting interactive, zoomable maps online<br />
is not an easy task. The final output of all<br />
maps made in MapBox is a set of tiles —<br />
Start with the baselayer<br />
MapBox Streets is a street-level map of the<br />
world and the primary baselayer used within<br />
the toolset. It has a clean, bright design<br />
that you may be familiar with if you’re a<br />
foursquare user, but users aren’t locked in<br />
to the design.<br />
There are twelve different preset custom<br />
styles for MapBox Streets - ranging from<br />
Terrain showing topological features like<br />
mountains and gorges, to Light providing an<br />
easy to read grayscale style, to Nightvision<br />
(yes, like the goggles) - that users can select<br />
Pirate map designed in TileMill.<br />
34<br />
December <strong>2012</strong>
A r t i c l e<br />
By mapping fires in the last twelve years, journalists were able to show that they generally occur in<br />
areas with the highest rates of deforestation.<br />
Map of areas in food crisis and on the ground operations to offer relief.<br />
256px by 256px squares that make up the<br />
basis of the zoomable, pannable web maps<br />
we’ve grown accustomed to seeing online.<br />
Through MapBox you can publish these<br />
maps in any website with embed codes,<br />
such as iframes, or you can use the MapBox<br />
API to take full control over the details of<br />
your maps and adjust image compression,<br />
layer compositing, interaction, legends, and<br />
more. MapBox also has a series of open<br />
source map site templates that serve as<br />
wrappers for full screen maps, turning an<br />
interactive map into a full-fledged microsite.<br />
Flexibility is a core tenant of MapBox. Any<br />
map designed in TileMill can be exported<br />
in the open MBTiles format, allowing users<br />
to export the millions of small tiles that make<br />
up a map in a single file. MBTiles integrates<br />
with many other map platforms, so it’s easy<br />
to take styled maps to use elsewhere or host<br />
them on private servers.<br />
Back to the storytelling<br />
The map-making space right now is flourishing.<br />
The tools are more accessible than ever,<br />
do more than ever, and are used by a wider<br />
swath of people - cartographers, GIS specialists,<br />
web developers, journalists, artists,<br />
data analysts, teachers, NGOs, gamers,<br />
and just about anyone who has a passion<br />
for maps and data visualization. And this is<br />
leading to some very interesting stories<br />
being told with maps. These two examples<br />
both were made with MapBox.<br />
Deforestation in the rainforest<br />
Journalists reporting on the Amazon<br />
Rainforest came together to launch<br />
InfoAmazonia.org, a collaborative project<br />
mapping news stories on the most important<br />
issues in the region — deforestation, extractive<br />
industries, and the overall destruction of<br />
land. The maps themselves are stunning, taking<br />
advantage of some of the advanced cartography<br />
features in TileMill like compositing<br />
and heat maps to convey the essence of<br />
the rainforest, the impact of deforestation,<br />
and the terror of forest fires.<br />
A food crisis and the world’s<br />
response<br />
Right now more than 18 million people in<br />
the Sahel region of West Africa are facing<br />
a food crisis. Drought, population movements,<br />
and conflict are compounding the<br />
problem. Recently nine international organizations<br />
came together to share information<br />
and collectively map the situation on the<br />
ground and international operations to provide<br />
food assistance, resulting in sahelresponse.org.<br />
Above all, the map practical. It<br />
clearly tells the story of why the food crisis<br />
exists, where it’s affecting, and operationally<br />
who is doing what on the ground to provide<br />
relief.<br />
Powered by open data and<br />
open source<br />
MapBox is made up of open data and open<br />
source code. MapBox Streets and all of<br />
Data harvested collectively shows deforestation in the rainforest and<br />
the major infrastructure locations playing a role in driving forest<br />
destruction.<br />
MapBox’s baselayer maps are populated<br />
with data from OpenStreetMap, the world’s<br />
free, editable community map. Open Street -<br />
Map first rose to prominence after the earthquake<br />
in Haiti, when volunteers quickly filled<br />
an almost blank map with streets, landmarks,<br />
and points of interest - turning it into<br />
far and away the most detailed map of Haiti<br />
in existence. It continues to see exponential<br />
growth in map content and people using it,<br />
especially with recent additions of<br />
foursquare, MapQuest, and Apple to its user<br />
base. Its data quality in much of the world<br />
shows that citizens can map their surroundings<br />
with greater detail and focus than any<br />
company has done.<br />
The MapBox team works with several open<br />
source projects to develop its toolset, notably<br />
JavaScript and Node.js for application<br />
development, Mapnik for rendering, the<br />
community map client project Modest Maps,<br />
and libraries like Wax, Easey, and markers.js.<br />
TileMill itself is an open source project,<br />
and can be freely downloaded and<br />
forked.<br />
By building tools in the open, we make sure<br />
our tools are tested and working for our<br />
users. As this is a rapidly evolving space,<br />
we develop agilely with lots of public feedback<br />
and collaboration.<br />
Get started designing maps with MapBox<br />
To get started designing maps with MapBox,<br />
sign up for a free account at mapbox.com.<br />
From there you can explore MapBox Streets,<br />
download TileMill, and start making your<br />
own custom maps. How-to guides are available,<br />
and there’s a support forum for any<br />
issues or questions that come up.<br />
Internet: http://mapbox.com<br />
Latest News Visit www.geoinformatics.com December <strong>2012</strong><br />
35
E v e n t<br />
A Review<br />
Intergeo Trade Fair <strong>2012</strong><br />
The world’s most important conference and trade show for geodesy, geo-information and land management<br />
attracted around 16,000 Geomatic- and GIS professionals to Hanover, Germany. A look at<br />
this year’s trends and topics.<br />
By Henk Key<br />
Figure 1: The open-air space<br />
Figure 2: Six rotors, a hexacopter<br />
The <strong>2012</strong> Intergeo conference and trade<br />
show took place at the Hanover Messe<br />
centre, which has a total of 26 halls and<br />
pavilions. Apart from the stunning architecture<br />
of the Exhibition Centre’s halls, it boasts a number<br />
of other features, including a Convention<br />
Centre with 35 function rooms, glassed-in<br />
areas between halls, grassy park-like areas<br />
and “chill-out” zones. The major exhibitions<br />
attract somewhere in the region of 400,000<br />
visitors, as compared to the figures of Intergeo:<br />
3 halls, 16,000 visitors, 28,000 square meters<br />
of exhibition space, 510 exhibitors including<br />
co-exhibitors, manufacturers, specialist dealers,<br />
consultants/service providers, public<br />
authorities, associations, institutions and publishers.<br />
After passing the entry-gates, visitors immediately<br />
look out over the open-air space, dozens<br />
of cars equipped with photogrammetric and<br />
LiDAR instruments which are ready to roll, a<br />
huge Topcon truck with a variety of instruments<br />
on display and buzzing octocopters or similar<br />
airborne flying objects.<br />
About 1400 visitors participated at the<br />
Intergeo conference and covered 40 subject<br />
areas. The first national INSPIRE (Infra struc ture<br />
for Spatial Information in Europe) conference,<br />
the CLGE (Council of European Geodetic<br />
Surveyors) and the Navigation conference<br />
were included in the Intergeo conference programme.<br />
Also, there were press conferences<br />
organized by commercial companies as well<br />
as a press conference from the Intergeo organization<br />
itself, where a newly formed Intergeo<br />
Advisory Board with Esri, Hexagon and<br />
Trimble as partners was announced.<br />
Trends and Topics<br />
Last year, during the Nuremberg Intergeo,<br />
there was a noticeable invasion of UAV’s<br />
(Unmanned Aerial Vehicles), commonly known<br />
as drones. This year many more types of UAV’s<br />
were on display in several booths; Quad-.<br />
Hex-, and Octocopters, named after the number<br />
of rotors (Figure 2).<br />
Planes, helicopters and gyrocopters<br />
The number of UAV underlines the shift towards<br />
exploring methods to gather huge amounts of<br />
data in order to meet the needs of the market;<br />
not only for 2D maps, but also for 3D computer-<br />
and scale-models. UAV’s can also be very<br />
useful for collecting information when the overlook<br />
of a site is more important than the accuracy,<br />
for example in crowd control and disaster<br />
management.<br />
Leading companies like Trimble and Leica also<br />
presented UAV’s at their booths. Trimble<br />
acquired Gatewing and Leica showed a two<br />
rotor UAV by Swiss-drone (Figure 3), confirming<br />
the potential of this technology. Spokesmen<br />
from both companies talked about filling the<br />
gap between traditional photogrammtry and<br />
terrestrial technologies.<br />
Many of these UAV’s have a number of limitations,<br />
such as being unstable, limited payload,<br />
36<br />
December <strong>2012</strong>
E v e n t<br />
Figure 4: Full-size Bundeswehr drone<br />
Figure 3: Two-rotor UAV by Swiss-drone<br />
vibration issues and problems in connection<br />
with all the necessary permits needed to operate<br />
these drones, as some countries do not<br />
allow private drones at all. However, in my<br />
opinion, they will become increasingly important<br />
in our profession.<br />
Several companies are already offering very<br />
small stabilizing devices for UAV’s to keep camera’s<br />
stable and aligned and the payload problem<br />
could be solved by using bigger UAV’s.<br />
There is a military version, a full size drone,<br />
on display in the Bundeswehr, German Army<br />
booth (Figure 4) which would be ideal.<br />
Another solution to these problems could be<br />
the gyrocopter, also known as autogyro (Figure<br />
5). According to the manufacturer these<br />
machines are very stable, even better than a<br />
helicopter and have sufficient payload for the<br />
big photogrammetric cameras like Ultra-cam.<br />
Additionally, the operational costs are very low<br />
compared to manned helicopters and planes;<br />
only € 60.00 per hour flight-time and, as they<br />
are manned, there are less problems in getting<br />
permits to operate them. The only thing you<br />
need is an area the size of a football pitch for<br />
take-off (100 m) and landing (10 m).<br />
Surveying Instruments<br />
Numerous manufacturers presented level instruments,<br />
rotating- and line-lasers, theodolites,<br />
tachymeters and other survey instruments in<br />
their booths. As mentioned before, the demand<br />
for these kinds of instruments for mass data collecting<br />
is declining. It seems as if the development<br />
of these instruments has stagnated. Of<br />
course, software is improving, accuracy is<br />
improving and performance is improving, but<br />
I did not notice any really new developments.<br />
There will continue to be a great demand for<br />
these “classic” instruments on construction sites<br />
and in gathering a limited amount of data, for<br />
example, to keep maps up to date. The only<br />
“traditional” surveying instrument which has<br />
improved significantly over the last few years<br />
is the laser scanner. Leica’s ScanStation P20 is<br />
definitely a forerunner (Figure 6).<br />
What is remarkable is the increasing number<br />
of manufacturers producing low budget instruments.<br />
The production numbers they mention<br />
are incredible, but until now they have been<br />
producing mainly for the home market.<br />
Figure 5: Gyrocopter, an alternative<br />
Figure 6: ScanStation P20. Also upright usable<br />
Latest News Visit www.geoinformatics.com December <strong>2012</strong><br />
37
E v e n t<br />
Figure 7: Low-budget instruments<br />
Figure 8: Used Leica laser scanner for sale<br />
Exporting, selling and after sales service<br />
abroad are still problematic, but the prices are<br />
amazing (Figure 7).<br />
Meanwhile some companies presented used<br />
instruments; top instruments at budget prices.<br />
Geotrade from the Netherlands, told me about<br />
the sale of a used scanner in order to map<br />
archaeological sites. In this case reliability and<br />
accuracy are of primary importance and<br />
speed is secondary, thus a used Leica scanner<br />
was the perfect and affordable solution (Figure<br />
8).<br />
The development of GNSS systems is continual.<br />
Within a few years four fully operational<br />
GNNS satellite systems will cover our globe;<br />
GPS from the USA, Glonass from Russia,<br />
Galileo from Europe and the Chinese Beidou<br />
system. India and Japan are also working on<br />
GNSS systems, but these are planned to operate<br />
locally. Many firms offer receivers to track<br />
satellite signals from these systems or a combination<br />
of them and to calculate coordinates<br />
with or without the use of all kinds of augmentation<br />
systems. The number of channels which<br />
can be tracked simultaneously is increasing.<br />
The record holder for this at this moment, as<br />
far as I know, is Javad. One of Javad’s<br />
receivers is capable of tracking and processing<br />
over 200 GPS, Glonass and Galileo signals<br />
simultaneously.<br />
The next challenge will be to solve the problem<br />
of indoor positioning. At the moment<br />
GNSS signals are too weak to be received<br />
inside buildings or tunnels. In densely populated<br />
areas with high rise skyscrapers so called<br />
‘urban canyons’ are created. They affect the<br />
GNSS signal by reflecting and disturbing it.<br />
Consumers are awaiting one system, usable<br />
outside and inside. The first attempts at providing<br />
this could be seen on this show; namely<br />
small transponders inside buildings and tunnels,<br />
to complement or enforce the GNSS signals.<br />
Miscellaneous<br />
A great number of exhibitors presented software<br />
for all kinds of purposes; 3D modelling<br />
and the use of tablets seems to have become<br />
the trend in this field. The demand for 3D printing<br />
is increasing; 3D models of buildings and<br />
even complete 3D city-models were shown on<br />
several stands (Figure 9).<br />
To visit all 520 exhibitors, is almost too much.<br />
One has to focus on certain aspects.<br />
Additionally, in between visiting the stands,<br />
there is the reunion function of a congress like<br />
this. Time flies when meeting former colleagues<br />
(Figure 10) and friends, and comparing<br />
notes. Before you know it, the exhibition<br />
doors are ready for closing.<br />
Internet: www.intergeo.de<br />
Figure 9: A 3D city model produced by a printer Figure 10: Colleagues back in 1985<br />
38<br />
December <strong>2012</strong>
One Flight... One Solution<br />
WIDE-AREA<br />
MAPPING<br />
CORRIDOR<br />
MAPPING<br />
URBAN<br />
MAPPING<br />
Lidars. Cameras. Action!<br />
Please join us at:<br />
ELMF <strong>2012</strong>, December 4-5<br />
Salzburg, Austria,<br />
Stand #47<br />
www.optech.com
I n t e r v i e w<br />
Stanford University’s Dr. Julie Sweetkind-Singer<br />
Long-Term Geospatial Data<br />
Stanford University’s Dr. Julie Sweetkind-Singer currently serves as both the assistant director of<br />
Geospatial, Cartographic and Scientific Data and Services and the head of the Branner Earth Sciences<br />
Library and Map Collections at the school. With her, Esri writer Jim Baumann discusses the importance<br />
and impact of long-term geospatial data storage.<br />
By Jim Baumann<br />
Baumann: As a recognized<br />
authority, please discuss the primary<br />
considerations for archiving and<br />
preserving digital information over<br />
the long term.<br />
Sweetkind-Singer: From a<br />
librarian’s point of view, digital<br />
data is very different and much<br />
more difficult to preserve for extended<br />
periods of time than paperbased<br />
data. For example, a book<br />
on acid-free paper can be kept on<br />
a shelf in a cool, dark place for<br />
100 years, and if it is well taken<br />
care of, one would expect it to<br />
remain in pretty good shape. With<br />
digital information, you have to<br />
implement a process from the very beginning that will allow you to<br />
preserve it well into the future. This includes making sure that the<br />
data is well managed technically, that metadata exists in order to<br />
ensure someone in the future will understand what the data represents<br />
and how it has been stored, and that legal documents are in<br />
place indicating how the data may be used in the future. It’s important<br />
for digital archivists to develop long-term preservation plans that<br />
include both technical and legal stipulations. Unless digital files are<br />
correctly preserved and documented, we run the risk of losing the<br />
information, which is then unavailable to future generations.<br />
Stanford University’s Dr. Julie Sweetkind-Singer<br />
Baumann: How did the National<br />
Geospatial Digital Archive [NGDA]<br />
come about and what role does it<br />
play in preserving geospatial data<br />
Sweetkind-Singer:<br />
The NGDA [www.ngda.org] is a<br />
collaborative research effort<br />
between Stanford University and<br />
the University of California at Santa<br />
Barbara, with funding from the<br />
Library of Congress [LC], to examine<br />
the issues surrounding the longterm<br />
preservation of geospatial<br />
data. The program funded by LC is<br />
called the National Digital Infor -<br />
mation Infrastructure and Preser -<br />
vation Program [NDIIPP]. One of<br />
the goals of the NGDA was to set up the structure for a preservation<br />
network and eventually add more partners covering a variety of<br />
regions around the United States including both libraries and state<br />
archives. Maintaining geospatial data in various locations is one<br />
important aspect for its long-term preservation in case of man-made<br />
or natural disaster. In addition, I think it’s important to remember<br />
that many organizations may produce geospatial data but aren’t<br />
involved in its collection or preservation. However, the mandate for<br />
libraries and government archives is to preserve valuable documents<br />
for the future.<br />
Baumann: From an educator’s perspective, what are some of the<br />
key reasons to preserve geospatial data<br />
Baumann: What procedures has the NGDA recommended to facilitate<br />
the long-term storage of geospatial data<br />
Sweetkind-Singer: For both educational and research purposes,<br />
it is critical that we preserve data for the long term. For example,<br />
the opportunity to trace the development of a region using historical<br />
maps is useful to researchers who are studying population growth<br />
or the change from an agriculture-based to an industry-based economy.<br />
A historian may want to know when the railroad first reached<br />
the study area; what effect the railroad played on it; what agricultural<br />
crops formerly grew there; in which direction the area began<br />
its expansion; when were major roadways built through it; and which<br />
cities did they connect. You can analyze all this over time by studying<br />
geospatial data, but only if you have the content to do so.<br />
Preserving historic data and continually adding to that collection on<br />
a regular basis is a critical part of change detection research.<br />
Sweetkind-Singer: You have to assume that both the software<br />
and hardware components that originally created the data will<br />
change in the future. Given that, it’s important to have metadata<br />
for all geospatial data that is archived including details about the<br />
software that was used to create it and related white papers. We<br />
developed a registry to track information about formats because<br />
they will certainly change over time. This information was the basis<br />
of the Library of Congress’ Geospatial Content section on its<br />
Sustainability of Digital Formats website [www.digitalpreservation.gov/formats/<br />
content/gis.shtml]. Regarding the preservation<br />
of remotely sensed imagery, you need to know which sensors were<br />
used; when they were updated; and what software was used to<br />
interpret the data format.<br />
40<br />
December <strong>2012</strong>
I n t e r v i e w<br />
Storage<br />
Legal documents are another important part of the long-term data<br />
storage process. We drafted agreements with the participating<br />
NGDA members about collection development policies specifying<br />
what each institution is going to collect and curate. There is another<br />
contract that brokers the relationship between copyrighted or<br />
licensed data and the university that wants to archive it. Data<br />
providers want their data preserved, but as a university we have to<br />
have assurances that our faculty and students can use that data for<br />
research and educational purposes. So we have contracts that specify<br />
the acceptable use of the archived data. I think long-term data<br />
preservation is a matter of developing a plan that includes technical<br />
solutions from the IT department, as well as recommendations<br />
from librarians, archivists, and lawyers to make sure geospatial<br />
data is properly and legally preserved for the future.<br />
Baumann: Please describe some of the key datasets that you have<br />
collected for the Stanford University archive.<br />
Sweetkind-Singer: One of the first datasets we archived was<br />
the David Rumsey digital map collection [www.davidrumsey.com].<br />
David Rumsey is a map collector in San Francisco who has spent<br />
many years building a fine collection of maps, atlases, and books<br />
detailing the growth of cartography in the United States during the<br />
eighteenth and nineteenth centuries. About 10 years ago, he decided<br />
to enhance his collection by scanning it and making those<br />
images available to the general public. Today, he has more than<br />
29,000 items in the digital collection. David uses the digital maps<br />
in a variety of ways that are impossible with the printed versions.<br />
However, he doesn’t have a robust and secure way to store the<br />
digital images for the future. Working together, we were able to<br />
provide secure, long-term preservation of the imagery as well as<br />
the accompanying metadata.<br />
We also worked with the California Spatial Information Library<br />
[CSIL], a government agency tasked with maintaining geospatial<br />
data for the state of California. [CSIL collects] transportation data,<br />
Landsat imagery, SPOT imagery, and other content. CSIL is the primary<br />
source of California statewide data. In addition, we have<br />
downloaded data from the USGS [US Geological Survey] Seamless<br />
Data Warehouse. In conversations with John Faundeen, the<br />
archivist at the USGS EROS [Earth Resources Observation and<br />
Science] Data Center, he was happy to hear that we were downloading<br />
high-resolution ortho-imagery of the San Francisco Bay<br />
Area from the site and archiving it as part of our collection process.<br />
Baumann: As Stanford continues to build its spatial data archives,<br />
what do you hope to add to your collection in the near future<br />
Sweetkind-Singer: We have collected a fair amount of high-resolution<br />
orthoimagery for the Bay Area and recently added the elevation<br />
data that goes along with it so that researchers can do threedimensional<br />
modeling using the imagery sitting on top of the<br />
elevation data. I would also like to collect more datasets for the<br />
California National Parks and the state’s coastline data. Important<br />
content for our collection is local data from places like the Hopkins<br />
Marine Station, which is Stanford’s marine biology station in<br />
Monterey [California]. [At Hopkins,] they’ve collected a large amount<br />
of heterogeneous data types: imagery, fish populations, transect<br />
information, and weather data. Our future data collection activities<br />
range from very specific content such as the Hopkins Marine Station<br />
data to very broad layers like the National Elevation Dataset for the<br />
United States.<br />
Baumann: Are standard procedures for the preservation of geospatial<br />
data widely implemented in libraries and government archives<br />
today<br />
Sweetkind-Singer: I think that the long-term preservation of data<br />
is something that is just emerging as an issue for libraries. While<br />
many libraries and state archives are aware of the problem, they<br />
don’t really know how to tackle it yet. It may seem at first like an<br />
overwhelming task, but breaking the procedure down into its component<br />
parts will make the process achievable. One important effort<br />
that has emerged over the past few years, also funded by NDIIPP, is<br />
the Geospatial Data Preservation Resource Center [http://geopreservation.org].<br />
This site has been designed specifically to bring<br />
together “freely available web-based resources about the preservation<br />
of geospatial information.” It also gives practitioners a place to<br />
start, discover best practices, and get their questions answered. As<br />
we go forward, we will figure out sustainable methods to manage,<br />
archive, preserve, and create access to digital information, but relatively<br />
speaking, we’re in the early days. It’s a process that we’ll<br />
develop and refine as we continue to work with this type of content.<br />
Long-term data archiving is a very interesting and challenging area<br />
for libraries because we are building the digital collections of the<br />
future. Libraries have an important role to play in making sure that<br />
we provide proper stewardship and preservation of geospatial data.<br />
Jim Baumann, Esri Writer<br />
Latest News Visit www.geoinformatics.com December <strong>2012</strong><br />
41
N e w s l e t t e r<br />
The ISPRS Foundation<br />
The ISPRS Foundation was developed in 2004 by ISPRS to pursue<br />
its philanthropic endeavours. Its goals are to provide grants for a<br />
range of purposes that will assist those who wish to further their<br />
knowledge, skills and experience in the photogrammetry, remote<br />
sensing and spatial information sciences and technologies.<br />
It is a non-profit entity, managed by a Board of 11 Trustees who<br />
are responsible for fund raising, investment, management and<br />
approval for grants of Foundation funds. Trustees do not receive<br />
any salary or other compensation for their services. Examples of<br />
activities supported by The ISPRS Foundation:<br />
Sponsorship of International Workshops – to fund, support or cosupport<br />
the education, training and technical program aspects of<br />
international scientific workshops sponsored by the ISPRS and other<br />
international organizations.<br />
Research Initiatives - for advancing the capabilities and applications<br />
of the ISPRS sciences, technologies and disciplines to the benefit<br />
of the international community.<br />
Travel Grants - to enable young authors, distinguished speakers,<br />
and officially designated national Delegates, especially from developing<br />
countries, to participate in ISPRS sponsored events.<br />
Scholarships and Fellowships - to support professional development<br />
in the Photogrammetry, Remote Sensing and Spatial<br />
Information (P&RS&SI) sciences and technologies.<br />
Awareness Education - to stimulate youth (K-12), public awareness,<br />
and participation in the P&RS&SI sciences and technologies to help<br />
meet the growing worldwide need for trained and educated practitioners<br />
Tools and Literature - to solicit, assemble, translate if needed, underwrite<br />
subscriptions, and distribute textbooks, technical publications,<br />
and basic tools and equipment that include the ISPRS disciplines.<br />
Awards - to provide international recognition for young authors,<br />
research, publications, training/education, and significant achievements.<br />
Since 2004 The ISPRS Foundation:<br />
• Received more than $US210,000 in donations and grants that are being used to support The ISPRS<br />
Foundation funding activities<br />
• Received large donations of up to $US25,000 from major spatial information companies;<br />
• The Foundation continues to receive regular sizable grants from the commercial sector.<br />
• Is supported by leading representatives from academia, government and business in the spatial information<br />
industry as Trustees of the Foundation Board.<br />
• Provided grants to more than 50 individuals from developing countries in Africa, Asia and Latin America<br />
to attend workshops and conferences to improve their knowledge and skills in spatial information sciences<br />
• Funded prizes for CATCON (Computer Aided Teaching Contest) events in 2006, 2008 and <strong>2012</strong> to<br />
encourage the development of freely available software for teaching in spatial information processing<br />
and management.<br />
• Funded major awards in 2008 and <strong>2012</strong> for outstanding performance by an individual in the spatial<br />
information sciences<br />
• Provided grants for Science Initiatives.<br />
The ISPRS Foundation needs your donation to continue its work.<br />
Go to: www.isprs.org/foundation/donations<br />
42<br />
December <strong>2012</strong>
E v e n t<br />
Esri European User Conference<br />
Partners and Best Practices<br />
With as many as ten sessions going on at once, every attendee could choose his or her own individual<br />
programme of Technical Workshops and User Presentations at Esri’s European User Conference in<br />
Oslo.<br />
By Remco Takken<br />
ArcGIS demos and previews<br />
Esri CEO Jack Dangermond<br />
On the main stage, David Cardella previewed<br />
some ArcGIS Apps for iOS,<br />
Android and Windows. A sneak<br />
preview included Arc GIS Online on Win -<br />
dows 8, so that attendees experienced the<br />
‘no toolbars’ phenomenon for the first time<br />
within a GIS context. Norwegian Esri partner<br />
Geodata hosted a three day GIS revue<br />
full of surprises, locally and internationally.<br />
Jack Dangermond<br />
In his traditional keynote speech, Esri CEO<br />
Jack Dangermond notably used the word<br />
‘footprint’ to his European listeners. In general,<br />
ecological footprints of human activities<br />
may be seen as a bad thing, meaning<br />
that they degene rate the planet we live on.<br />
As Dangermond stated, one can also view<br />
it as a positive contribution to the world:<br />
‘geographers make a great collective footprint<br />
with their work’. Dangermond also<br />
dwelled a few moments on Esri’s new focus<br />
on developers. In fact, he alluded to the<br />
acquisition of Geoloqi, a platform for location-based<br />
services (LBS). The according<br />
press release was issued the following day.<br />
Geoloqi<br />
Geoloqi will merge its staff and product<br />
capabilities into Esri’s existing geospatial<br />
platform and launch a new Esri Research<br />
and Development (R&D) Center in Portland,<br />
Oregon, where Geoloqi is headquartered.<br />
Geoloqi enables rapid development of<br />
cross-platform, geography-based applications<br />
using a single API in any development<br />
language. Geoloqi provides specialized<br />
algorithms that help preserve battery life<br />
while location runs in the background or at<br />
stated intervals. “Geoloqi’s capabilities and<br />
relationships with the developer community<br />
will build on Esri’s already impressive suite<br />
of ArcGIS products to create more dynamic<br />
mobile and web applications”, said<br />
Dangermond in an official statement, published<br />
shortly after his keynote speech in<br />
Oslo. The Esri R&D Center in Portland will<br />
be focused on developing new tools and<br />
functionality to create improved, integrated<br />
products that accentuate the strength of a<br />
combined platform.<br />
Nordic flavour<br />
A distinct Norwegian touch was added to<br />
Esri’s European User Conference in Oslo,<br />
and not only by featuring a highly blonde<br />
Geodata GIS operator on the main stage.<br />
With his bearded Norwegian colleague he<br />
ably showed some locally developed applications<br />
for safer ship navigation, published<br />
in ArcGISOnline. Nordic examples on the<br />
big screen: hot spots for oil, gas or fishing<br />
activity, based on spatial analysis and made<br />
for NCA Risk Assessment. Very impressive<br />
was a ten meter deep 3D buffer deep down<br />
in the sea. Vast improvements in fairway<br />
design are the end result. Norwegian oil<br />
and gas company Statoil summarized what<br />
is easily forgotten: “GIS data management<br />
may suggest it is all about routines and compliance,<br />
but to end-users it’s about bringing<br />
value.” Statoil presented a vast array of<br />
44<br />
December <strong>2012</strong>
E v e n t<br />
BlomStreet aka CycloMedia, with Streetview like imagery for professional use.<br />
ArcGIS demos and previews<br />
automated specialist geo data for mass web<br />
use, notably employing SAFE Software’s<br />
Feature Manipulation Engine FME for interoperability.<br />
Last keynote by the Norwegian<br />
Red Cross organisation showed a different<br />
side of Northern Europe, it’s humanistic<br />
view on life. Instead of boasting his achievements<br />
in his own country, in a speech called<br />
‘The Geography Of Risks’, Sven Mollekleiv<br />
pointed out the need for access in troubled<br />
countries in faraway continents.<br />
Blom ASA<br />
This year’s User Conference took place in<br />
Oslo’s Congressenter, which is located opposite<br />
of the Norwegian Labour Party. It’s also<br />
near the heart of the infamous ‘Anders<br />
Breivik Attack’ of last summer. Outside the<br />
venue, building and renovation activities<br />
could still be seen. Inside, Blom ASA presented<br />
their BlomSTREET panorama pictures<br />
made by CycloMedia, showing recent<br />
‘before’ and ‘after’ bombing situations of<br />
Oslo’s inner city. Also shown was the<br />
GlobeSpotter application, with its measuring<br />
possibilities. One of the examples featured<br />
an ArcMap plug-in for street view pictures<br />
by Belgian implementation partner SIGGIS .<br />
Powel<br />
Asset management requirements of water<br />
powered energy utilities in Norway have<br />
specific needs. Energy company Powel calls<br />
its solution ‘ArcGIS for Smart Generation’.<br />
Oftentimes, roads in the North disappear<br />
under thick layers of snow or ice. Accurate<br />
location information about unsafe ice for<br />
skating and skiing is needed for maintenance,<br />
during unforeseen outages and general<br />
crisis management in mid-winter. For<br />
its daily processes, Powel has detailed information<br />
on water levels in their regulated<br />
river courses. Added value of Powel’s data<br />
is their flood warning system. The worst<br />
case scenario for energy producers regarding<br />
flooding is of course a dam break. In<br />
some impressive visualisations, a number of<br />
those scenarios were worked out.<br />
Powel explained some of the differences<br />
between its ‘emergency’ and ‘regular’<br />
mobi le communication.<br />
Exelis<br />
In a live demo called ‘change detection based<br />
on SAR data in ArcGIS’ by Exelis, ArcGIS<br />
plus ENVI 5.0 and SARscape Modules for<br />
ENVI showed some fast geocoding. A onepixel<br />
accuracy proved good enough for flood<br />
mapping, but the final map on display<br />
impressed with real-time change detection<br />
results between two ‘pictures’ at the live demo.<br />
Geocom<br />
Swiss Esri partner Geocom showed its wind<br />
park data model within an elaborate infrastructure<br />
management system and deploying<br />
ArcGIS and Geonis as core geospatial products<br />
Supporting Wind Park Projects.<br />
AED-SICAD<br />
AED-SICAD explained the functionalities of<br />
their enduring ArcFM UTsystem along the<br />
Latest News Visit www.geoinformatics.com December <strong>2012</strong><br />
45
E v e n t<br />
fact that most German municipalities are<br />
‘multi-utilities’. Field workers were also highlighted.<br />
Dutch water utility Brabant Water<br />
lets its people carry around 20-30 gB on<br />
their laptops, enabling on the spot network<br />
tracing and full GIS functionality, said AED-<br />
SICAD’s Florian Brandi-Dohrn.<br />
INSPIRE, SDI’s, Conterra and FME<br />
German Esri Gold partner Conterra showed<br />
its INSPIRE compliant SDI portal in Saxon,<br />
which runs on out-of-the-box Esri software.<br />
All WFS, Shape and CS-W data go<br />
through an FME-driven translation schema to<br />
get those files ready for search engines.<br />
During a live demo, attendees saw csv-files<br />
being turned into Shape (SHP). More than<br />
once during this conference, the notion was<br />
felt that successful data-interoperability within<br />
traditional GIS often equals FME. The<br />
folks at Conterra are good with it, too. In an<br />
almost intimidating fashion Conterra’s Mark<br />
Döring quickly built up a complete FME<br />
Workbench. It looked rather convincing, but<br />
then he said: “now, this isn’t INSPIRE compliant.”<br />
His point: INSPIRE should just be a technical<br />
thing in the background. “Com pare it<br />
to how exactly GPS communicates with your<br />
device: nobody knows exactly how it works.<br />
And so it should be when dealing with<br />
INSPIRE.”<br />
Solutions in full swing<br />
Paradoxically, in Oslo, the absence of a big<br />
new ArcGIS release gave way to a plethora<br />
of factual information on the actual, dayto-day<br />
use of ArcGIS and its add-ons by<br />
implementation partners from all over<br />
Europe. It was great to witness all of those<br />
solutions in full swing. Even during the closing<br />
remarks, nobody stood up to enquire<br />
about the possible contents of next year’s<br />
version of ArcGIS. The absence of this halfexpected<br />
ritual by hi-end users, was partly<br />
due to a slightly disturbing Powerpoint slide<br />
depicting some guy working with mobile<br />
GIS in Lederhosen. The next edition of Esri’s<br />
European User Conference will be in<br />
München, Bayern, Germany, October 23-<br />
25, 2013, right after the Octoberfest.<br />
Internet: www.esri.com/events/euc/index.html<br />
46<br />
December <strong>2012</strong>
E v e n t<br />
OpenStreetMap’s 6th International Conference<br />
State of the Map<br />
At the start of September, a wide mixture of people headed to Tokyo for OpenStreetMap’s 6th annual<br />
international conference known as “State of the Map”(SotM). The conference first ran in 2007 as a<br />
way for the dedicated volunteer mappers and early adopters to meet, having known each other online<br />
as they added to a very bare map and programmed the initial tools needed. The OpenStreetMap(OSM)<br />
user base has grown exponentially now beyond 650,000 registered users, and so the conference<br />
has grown to include people with various interests in the project, several having never made a contribution<br />
to the map or previously met the community.<br />
By Gregory Marlor<br />
Waste Map, (source: OpenStreetmap)<br />
OpenStreetMap to the<br />
Rescue<br />
OpenStreetMap rocketed in international<br />
awareness following the<br />
devastating earthquake in Haiti at<br />
the start of 2010. Many SotM<br />
<strong>2012</strong> delegates represented the<br />
efforts of HOT (Humanitarian<br />
Open Street Map Team) and other<br />
aid organizations. The first conference<br />
day was given the title “OSM<br />
To The Rescue”. We were updated<br />
on continued work and support for<br />
Haitian mappers, and projects in<br />
countries that include Afghanistan,<br />
Indonesia, and Cambodia. Not<br />
forgetting the host country, Japan,<br />
which also held a stream of talks<br />
in the native language. Topics covered stories<br />
of events that had been organized, new<br />
tools, methods, and resources being used,<br />
and upcoming projects looking for support.<br />
A standard question at the annual conference<br />
was “When will OpenStreetMap coverage<br />
be complete” until everyone moved<br />
onto the question “How much detail counts<br />
as complete”. We now see the road network<br />
and associated facilities complete<br />
across most of the developed world, even<br />
surpassing coverage by national mapping<br />
agencies in some areas. Large users of map<br />
data have started to become interested and<br />
focus is turning to navigation applications.<br />
The SatNav business is fast paced at the<br />
moment, so it’s good to know what’s happening<br />
and who else is working with community<br />
created data. Technical issues are the<br />
main concern, dealing with such vast information<br />
and ever growing calculations.<br />
Discussion wasn’t just limited to car navigation,<br />
but reached over to include emergency<br />
routing, and public transport systems.<br />
This area has a range of complete new-comers<br />
to SotM regulars such as Raul Kraut -<br />
hausen of WheelMap.org. It’s great to see<br />
an update on how the website is helping<br />
people in more countries find step-free<br />
access to shops, buildings, and neighbourhoods.<br />
We watched a TV advert filmed and<br />
funded by Google that showed Open Street -<br />
Map to advertise WheelMap.org.<br />
Mapping In Memory<br />
Last summer, at the the State of the Map EU<br />
conference I had listened to Kinya Inoue<br />
(known as Ikiya), a resident of Fukushima,<br />
tell how he had gone out to map the<br />
changes to the road network. He showed<br />
screenshots of a residential area he had surveyed<br />
and the whole area covered by the<br />
sea. It would be easy to look at the frustration<br />
of time consuming work being wasted,<br />
but Inoue’s thoughts are with those<br />
who have lost their homes and perhaps<br />
loved ones. He hopes that with<br />
time his GPS traces will be able to<br />
provide a memory of places that can<br />
now longer be visited. The talk was<br />
repeated this year and despite hearing<br />
it before I struggled to hold in<br />
my tears. Continuing on the recalling<br />
of events, Kinya pointed out he<br />
was aware the coast line moved by<br />
several metres and this would need<br />
resurveying. A beautiful coastline<br />
and landscape, in his talk last year<br />
not mentioned but now he revealed<br />
to us how he had been unable to<br />
visit the places he knew and loved<br />
for over a year following the devastating<br />
work of the tsunami. Not confidently<br />
fluent in English, yet the whole room was<br />
captivated and gripped on each word read<br />
out. With time, OpenStreetMap and its need<br />
for resurveying was part of the grieving process.<br />
If there is one talk to watch, it is this<br />
one that took place at midday on Thursday.<br />
Gregory Marler is a web developer, data lover, and geospatial consultant.<br />
When he’s not having fun working or singing, he’s getting lost<br />
creating a map and blogging at LivingWithDragons.com<br />
The full schedule of the conference, complete with video recordings<br />
and slides is available at http://wiki.osm.org/SotM12<br />
Events across the world are happening each week, a calendar is<br />
shown on the OSM Wiki homepage. http://wiki.osm.org<br />
The main map (not including all the different subject-focused renderings)<br />
can be seen at www.openstreetmap.org<br />
Latest News Visit www.geoinformatics.com<br />
47<br />
December <strong>2012</strong>
C o l u m n<br />
Mobile GIS in <strong>2012</strong><br />
Since this is the last column for <strong>2012</strong>, I thought it might be good to reflect on<br />
the year. Mobile remains driven by consumers. Smartphones and tablets, are<br />
replacing PC’s and laptops. A slew of new products have been released; from<br />
the iPhone 5, and the new smaller iPad to the entrance of Microsoft into the<br />
tablet market with the Surface. The map wars began in earnest, as both Apple<br />
and Amazon entered the fray. And venture capital money continues to pour<br />
into any startups with ‘geolocation’ in their mission statement.<br />
Matt Sheehan is Principal and Senior<br />
Developer at WebmapSolutions. The company<br />
build location focused mobile applications<br />
for GIS, mapping and location<br />
based services (LBS). Matt can be<br />
reached at matt@webmapsolutions.com.<br />
C O L U M N<br />
Business adoption remains slow. The public sectors,<br />
both local and national, have been quicker<br />
to explore the possibilities mobile brings to their<br />
organisations. The old paradigm of pen and paper use<br />
by field workers remains solidly in place. This is partly<br />
an organisational fear of new technology, but also the<br />
tendency of (often older) field workers to be late<br />
adopters. Surprisingly in many organisations GIS<br />
remains a desktop application only. Many organisations<br />
in disaster management for example rely on desktop<br />
GIS apps generating paper maps for distribution to<br />
field workers. Presumptions that mobile technology will<br />
end the days of non-digital means of gathering data for<br />
example, may be wide of the mark. In many cases<br />
mobile may compliment non digital field processes.<br />
The Term GIS<br />
The GIS industry is coming from out of the shadows.<br />
That has long been the hope. To broaden its application<br />
and appeal. Increasingly there is discussion that<br />
the term GIS should be retired. With the launch of platforms<br />
like ArcGIS Online, with its wider appeal to a<br />
broader spectrum of users, there may be a point to this<br />
argument. There is little doubt mobile is changing the<br />
playing field. We have a fragmented geospatial marketplace.<br />
Location based services(LBS) are consumer<br />
focused and the main driver of new players like Apple<br />
and Amazon. Money and media attention is centered<br />
here. Esri talk often about ‘non-GIS users’. With story<br />
maps and embedding maps in documents, certainly the<br />
emphasis is broadening the user base. Back end integration<br />
with other business systems such as SAP, is also<br />
high on Esri’s radar. Again appealing to the business<br />
non-GIS community. So we live in changing times. A<br />
time of churn and emergence of a new immature<br />
paradigm; which is mobile.<br />
ArcGIS Online<br />
After being broadsided by Google maps in 2006, Esri<br />
have fired back with ArcGIS Online. This is a truly innovative<br />
cloud based cross platform, cross device solution<br />
for publishing and sharing maps. Organisations with<br />
an ArcGIS Online account can now publish data from<br />
multiple different sources; shapefiles, ArcGIS endpoints,<br />
KML, CSV, GRX. Data access can be controlled by<br />
ArcGIS online account administrators, and map groups<br />
48<br />
set up with open or restricted access. Solution templates<br />
are being built by Esri and development companies.<br />
These are web or mobile applications which are easy<br />
to implement from within ArcGIS Online, and configure.<br />
Some are designed for GIS users others a broader<br />
audience. Published, so called web maps, are easy to<br />
load into mobile apps, they can also be embedded in<br />
documents such as Word and Excel. ArcGIS Online has<br />
been in development for over 4 years. It is a truly innovative<br />
product, whose impact has only just begun to be<br />
felt.<br />
Expectations for 2013<br />
Looking into the crystal ball, what do we anticipate for<br />
2013 As a mobile geospatial development company,<br />
extrapolating from <strong>2012</strong>:<br />
1) The continued growth of interest from larger organisations,<br />
looking to build end to end mobile geospatial<br />
apps or initial prototypes.<br />
2) Even given tight budgets, but with established GIS<br />
departments, growing public sector adoption of<br />
Mobile GIS.<br />
3) The evolution of true offline mobile apps. Esri and<br />
others are feverishly working on disconnected solutions.<br />
4) Increasing popularity of ArcGIS Online, broadening<br />
the appeal and reach of geospatial data.<br />
5) More focus and discussion on the performance of<br />
mobile web GIS apps versus hybrid.<br />
6) The increasing convergence and competition<br />
between the major providers of geospatial solutions;<br />
Esri, Google Maps, MapQuest, Apple, Amazon.<br />
7) Increasing popularity of responsive web design.<br />
Where a single application can be styled based on<br />
the device loading the app.<br />
Final Thoughts<br />
Mobile is increasingly more popular. New smartphones<br />
and tablets have been regularly launched throughout<br />
<strong>2012</strong>. Ever more mobile apps are being released for<br />
both browser consumption and via the various app<br />
stores. Private sector business adoption has been slow.<br />
The geospatial mobile market remains fragmented. But<br />
with the release of new platforms such as Esri’s ArcGIS<br />
Online, we anticipate mobile geospatial technology will<br />
see both broader and wider adoption.<br />
December <strong>2012</strong>
C a l e n d a r 2 0 1 2 / 2 0 1 3 /<br />
A d v e r t i s e r s I n d e x<br />
December<br />
03-05 December European Space Solutions ‘Discover<br />
what space brings to your life’<br />
Central Hall Westminster, London, U.K.<br />
Internet: www.space-solutions.eu<br />
04-05 December European LiDAR Mapping Forum <strong>2012</strong><br />
Salzburg, Austria<br />
Internet: www.lidarmap.org/ELMF<br />
10-14 December FIG Commission 3 Workshop<br />
‘Spatial Information, Informal Development,<br />
Property and Housing’<br />
Athens, Greece<br />
E-mail: sagi.dalyot@ikg.uni-hannover.de<br />
Internet: http://bit.ly/FIG3_Athens<strong>2012</strong><br />
11-12 December MapInfo Professional Foundation<br />
Level Training Course<br />
CDR Group, Hope, Derbyshire, U.K.<br />
E-mail: sales@cdrgroup.co.uk<br />
Internet: www.cdrgroup.co.uk/train_mi2info.htm<br />
13-16 December Gi4DM <strong>2012</strong><br />
UT, Enschede, The Netherlands<br />
E-mail: info@gi4dm.net<br />
Internet: www.gi4dm.net/<strong>2012</strong><br />
Januari 2013<br />
21-23 January 9th Annual Defence Geospatial<br />
Intelligence (DGI) Conference & Exhibition<br />
QEII Conference Centre, London, U.K.<br />
E-mail: dgi@wbr.co.uk<br />
Internet: www.wbresearch.com/dgieurope/home.aspx<br />
24-25 January GeoDesign Summit<br />
Esri, Redlands, CA, U.S.A.<br />
Internet: www.geodesignsummit.com<br />
Februari<br />
06-08 February CEGeoIC Conference 2013<br />
Bogota, Colombia<br />
Internet: http://CEGeoIC.net<br />
11-13 February International LiDAR Mapping Forum<br />
2013<br />
Denver, CO, U.S.A.<br />
Internet: www.lidarmap.org/ILMF.aspx<br />
14-15 February IV International Conference<br />
“Geodesy, Mine Survey and Aerial Photography.<br />
At the turn of the centuries”<br />
Novotel-Hotel, Moscow, Russia<br />
Internet: http://con-fig.ru/r=indexen<br />
27-28 February International Workshop “The Role of<br />
Geomatics in Hydrogeological Risk”<br />
Padua, Italy<br />
Internet: www.cirgeo.unipd.it/geomatics4risk<br />
March<br />
06-08 March GeoViz_Hamburg 2013: Interactive<br />
Maps That Help People Think<br />
Hamburg, Germany<br />
E-mail: geoviz@geomatik-hamburg.de<br />
Internet: www.geomatik-hamburg.de/geoviz<br />
07-08 March EUROGI Conference 2013<br />
Dublin, Ireland<br />
Internet: www.eurogi.org/conference-2013.html<br />
11-13 March “Wavelength 2013”<br />
Glasgow, U.K.<br />
E-mail: andy@rspsoc-wavelength.org.uk<br />
Internet: www.rspsoc-wavelength.org.uk/wavelength2013<br />
24-28 March ASPRS 2013 Annual Conference<br />
Baltimore Marriott Waterfront Hotel, Baltimore, MD, U.S.A.<br />
Internet: www.asprs.org<br />
April<br />
15-17 April 19th Annual CalGIS Conference<br />
Westin Long Beach, CA, U.S.A.<br />
Internet: www.calgis.org<br />
21-23 April Joint Urban Remote Sensing Event<br />
(JURSE 2013)<br />
Sao Paulo, Brazil<br />
Internet: www.inpe.br/jurse2013<br />
23-25 April ENC 2013 ‘The European Navigation<br />
Conference’<br />
Vienna, Austria<br />
Internet: www.enc2013.org<br />
25-26 April 3D Documentation Conference<br />
Marina Mandarin Hotel, Singapore<br />
Internet: www.3d-documentation-conference-2013.com<br />
May<br />
13-16 May Geospatial World Forum<br />
Beurs/ World Trade Center, Rotterdam, The Netherlands<br />
E-mail: info@geospatialworldforum.org<br />
Internet: www.geospatialworldforum.org<br />
21-22 May Location Intelligence + Oracle Spatial<br />
and Graph User Conferences 2013<br />
Ronald Reagan Building and International Trade Center,<br />
Washington, D.C.<br />
Internet: www.oracle.com<br />
21-24 May ISPRS Workshop “High-Resolution Earth<br />
Imaging for Geospatioal Information”<br />
Hannover, Germany<br />
Internet: www.ipi.uni-hannover.de/isprs_hannover2013.html<br />
29-31 May UDMS 2013, 29TH Urban Data<br />
Management Symposium<br />
University College London, London, U.K.<br />
E-mail: info@udms.net<br />
Internet: www.udms.net<br />
June<br />
03-06 June Hexagon 2013 (ERDAS, Intergraph,<br />
Leica, Metrology)<br />
Las Vegas, NV, U.S.A.<br />
Internet: http://<strong>2012</strong>.hexagonconference.com<br />
16-22 June 13th International Multidisciplinary<br />
Scientific GeoConference & EXPO SGEM2013<br />
Albena Resort & SPA, Bulgaria<br />
E-mail: sgem@sgem.org<br />
Internet: www.sgem.org<br />
17-21 June FMEdays 2013<br />
Berlin, Germany<br />
E-mail: info@fmedays.de<br />
Internet: www.fme-days.com<br />
18-20 June MundoGEO#Connect LatinAmerica 2013<br />
São Paulo, Brasil<br />
Internet: http://mundogeoconnect.com<br />
25-27 June RIEGL International Airborne, Mobile,<br />
Terrestrial, and Industrial User Conference 2013<br />
Marriott, Vienna, Austria<br />
E-mail: userconference2013@rieglusa.com<br />
Internet: www.riegl.com<br />
02-05 July GI_Forum 2013<br />
Salzburg, Austria<br />
Internet: www.gi-forum.org<br />
July<br />
08-12 July Esri International User Conference<br />
San Diego Convention Center, San Diego, U.S.A.<br />
Internet: www.esri.com/events<br />
August<br />
25-29 August SPIE Optics + Photonics 2013<br />
San Diego Convention Center, San Diego, CA, U.S.A.<br />
Internet: http://spie.org/opticsphotonics.xmlWT.mc_id=RCal-OPW<br />
25-30 August 26th International Cartographic<br />
Conference<br />
Dresden, Germany<br />
E-mail: manfred.buchroithner@tu-dresden.de<br />
Internet: www.icc2013.org<br />
September<br />
04-06 September Unmanned Aerial Vehicles in<br />
Geomatics (UAV-g)<br />
Rostock University, Rostock, Germany<br />
Internet: www.uav-g.org<br />
04-06 September RSPSoc 2013<br />
Glasgow, U.K.<br />
E-mail: rspsoc@nottingham.ac.uk<br />
Internet: www.rspsoc.org<br />
09-13 September AGSE 2013 “The Geospatial<br />
Momentum for Society and Environment”<br />
CEPT University, Ahmedabad, India<br />
Internet: http://applied-geoinformatics.org<br />
Please feel free to e-mail your calendar notices to: calendar@geoinformatics.com<br />
Advertisers Index<br />
CHC www.chcnav.com 21<br />
DATEM www.datem.com 12<br />
ERDAS www.erdas.com 52<br />
Esri www.esri.com 13<br />
FOIF www.foif.com.cn 49<br />
GMA www.con-fig.ru 46<br />
Global Geo Supplies www.softmouse3d.com 51<br />
Leica Geosystems www.leica-geosystems.com 2<br />
Microsoft UltraCam www.iFlyUltraCam.com 17<br />
Optech www.optech.com 39<br />
Pacific Crest www.pacificcrest.com/adl 9<br />
SuperMap www.supermap.com 43<br />
Geneq<br />
www.geneq.com<br />
33<br />
Topcon www.topcon.eu 26<br />
50<br />
December <strong>2012</strong>