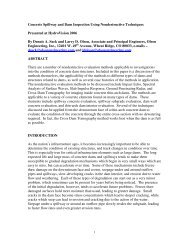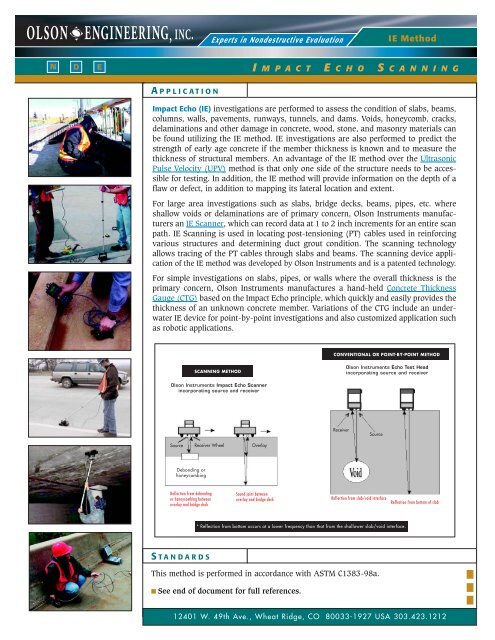
Impact Echo - Olson Instruments, Inc.
Impact Echo - Olson Instruments, Inc.
Impact Echo - Olson Instruments, Inc.

Create successful ePaper yourself
Turn your PDF publications into a flip-book with our unique Google optimized e-Paper software.
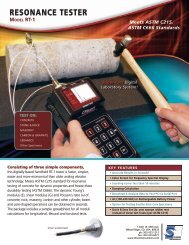
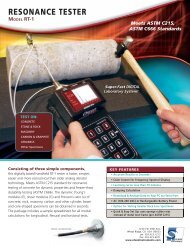
IE Method<br />
N D E<br />
I M P A C T E C H O S C A N N I N G<br />
A PPLICATION<br />
<strong>Impact</strong> <strong>Echo</strong> (IE) investigations are performed to assess the condition of slabs, beams,<br />
columns, walls, pavements, runways, tunnels, and dams. Voids, honeycomb, cracks,<br />
delaminations and other damage in concrete, wood, stone, and masonry materials can<br />
be found utilizing the IE method. IE investigations are also performed to predict the<br />
strength of early age concrete if the member thickness is known and to measure the<br />
thickness of structural members. An advantage of the IE method over the Ultrasonic<br />
Pulse Velocity (UPV) method is that only one side of the structure needs to be accessible<br />
for testing. In addition, the IE method will provide information on the depth of a<br />
flaw or defect, in addition to mapping its lateral location and extent.<br />
For large area investigations such as slabs, bridge decks, beams, pipes, etc. where<br />
shallow voids or delaminations are of primary concern, <strong>Olson</strong> <strong>Instruments</strong> manufacturers<br />
an IE Scanner, which can record data at 1 to 2 inch increments for an entire scan<br />
path. IE Scanning is used in locating post-tensioning (PT) cables used in reinforcing<br />
various structures and determining duct grout condition. The scanning technology<br />
allows tracing of the PT cables through slabs and beams. The scanning device application<br />
of the IE method was developed by <strong>Olson</strong> <strong>Instruments</strong> and is a patented technology.<br />
For simple investigations on slabs, pipes, or walls where the overall thickness is the<br />
primary concern, <strong>Olson</strong> <strong>Instruments</strong> manufactures a hand-held Concrete Thickness<br />
Gauge (CTG) based on the <strong>Impact</strong> <strong>Echo</strong> principle, which quickly and easily provides the<br />
thickness of an unknown concrete member. Variations of the CTG include an underwater<br />
IE device for point-by-point investigations and also customized application such<br />
as robotic applications.<br />
CONVENTIONAL OR POINT-BY-POINT METHOD<br />
SCANNING METHOD<br />
<strong>Olson</strong> <strong>Instruments</strong> <strong>Echo</strong> Test Head<br />
incorporating source and receiver<br />
<strong>Olson</strong> <strong>Instruments</strong> <strong>Impact</strong> <strong>Echo</strong> Scanner<br />
incorporating source and receiver<br />
Receiver<br />
Source<br />
Source<br />
Receiver Wheel<br />
Overlay<br />
Debonding or<br />
honeycombing<br />
Reflection from debonding<br />
or honeycombing between<br />
overlay and bridge deck<br />
Sound joint between<br />
overlay and bridge deck<br />
Reflection from slab/void interface<br />
Reflection from bottom of slab<br />
* Reflection from bottom occurs at a lower frequency than that from the shallower slab/void interface.<br />
S TANDARDS<br />
This method is performed in accordance with ASTM C1383-98a.<br />
■ See end of document for full references.<br />
12401 W. 49th Ave., Wheat Ridge, CO 80033-1927 USA 303.423.1212
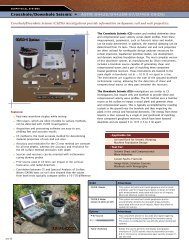
IE N D E<br />
GPR<br />
I MPACT E CHO S CANNING<br />
F IELD<br />
I NVESTIGATION<br />
ACCESS<br />
Only one surface needs to be accessible for receiver<br />
placement and hammer or solenoid impact. For IE<br />
investigations, relatively smooth, clean surfaces are<br />
needed. Water can be applied to the surface to<br />
improve coupling of the receiver. The figures on the<br />
previous page show the field setups for scanning IE<br />
investigations and conventional IE investigations.<br />
The IE scanning technology uses the <strong>Olson</strong> <strong>Instruments</strong><br />
developed Scanner that contains two sources for<br />
generating acoustic energy with different primary<br />
frequency content and a receiver wheel made up of<br />
multiple sensors. <strong>Olson</strong> <strong>Instruments</strong> also developed<br />
the CTG which contains a source and receiver for<br />
simple operation.<br />
COLLECTION OF DATA<br />
In conventional IE investigations, the hammer or<br />
impactor is used to generate compressional waves<br />
which reflect back from the bottom of the tested<br />
member or from a discontinuity. The response of<br />
the system is measured by the receiver placed next<br />
to the impact point. The receiver output and sometimes<br />
the hammer input, depending on the equipment<br />
used, are recorded with an <strong>Olson</strong> <strong>Instruments</strong><br />
Freedom Data PC equipped with an <strong>Impact</strong> <strong>Echo</strong><br />
System (IE-1, IE-W, IE-2, and IE-T). However,<br />
<strong>Olson</strong> Engineering typically uses the CTG1-TF<br />
handheld unit in collecting conventional data due to<br />
the portability and flexibility of a handheld system.<br />
IE scanning measurements are possible with <strong>Olson</strong><br />
<strong>Instruments</strong> Scanner which contains two sources<br />
capable of generating acoustic energy with differing<br />
frequency content and a receiver wheel with multiple<br />
sensors. The scanner is pushed across one of<br />
the accessible surfaces of the structural element<br />
and measurements are taken every 1-2 inches. A<br />
calibrated distance wheel allows the impactor to hit<br />
the surface with precise timing and accurate positioning.<br />
The data are then automatically processed<br />
for identification of thickness echo peaks. The<br />
identified peaks are processed to calculate thicknesses<br />
and the thicknesses are plotted out on a<br />
graph of thickness versus location.<br />
Conventional IE measurements are possible with<br />
either the Freedom Data PC equipped with an<br />
<strong>Impact</strong> <strong>Echo</strong> System or a Concrete Thickness Gauge<br />
(CTG). The conventional method is a point-by-point<br />
application often for quality assurance purposes.<br />
The data are processed for thickness echo peaks<br />
and the peaks are processed in the handheld<br />
unit or can be downloaded to a laptop for complete<br />
processing if necessary. An exportable table is generated<br />
for data collected using a CTG that indicates<br />
filename, depth, and thickness mode of investigation.<br />
D ATA<br />
R EDUCTION<br />
PROCESSING TECHNIQUES<br />
The IE time traces are transformed to the frequency<br />
domain via FFT for calculations of the transfer and<br />
coherence functions, and the auto power spectrum of<br />
the receiver. Spectrum data are used to determine the<br />
depth of reflectors according to the following equation:<br />
D = VP / (2 x f1) where D is the reflector depth,<br />
f1 is the highest amplitude frequency peak identified<br />
in the response, and VP is the compressional wave<br />
velocity. <strong>Olson</strong> Engineering uses a proprietary, internally<br />
developed software package for IE processing<br />
and analysis. This software handles data collected<br />
using the <strong>Impact</strong> <strong>Echo</strong> Systems or the CTG1-TF. Often<br />
in QA/QC investigations of concrete placement either<br />
in slabs or beams, the field data must be immediately<br />
analyzed to ensure proper data collection design<br />
and parameters. The IE software permits on-site,<br />
preliminary analysis to ensure quality data have<br />
been collected. The software includes a variety of<br />
digital filters, and typically, a Butterworth high-pass<br />
filter is applied to the data in order to clarify echo<br />
peaks corresponding to void/debond peaks or slab<br />
bottom peaks.<br />
OLSON ENGINEERING, INC., 5191 Ward Rd., Suite 1, Wheat Ridge, CO 80033-1936 USA 303.423.1212<br />
[ Page 2 ]
IE N D E<br />
I MPACT E CHO S CANNING<br />
D ATA<br />
R EDUCTION<br />
INTERPRETATION OF DATA<br />
The highest amplitude frequency peak is the main<br />
indicator of a reflector depth (thickness echo). The<br />
presence of additional echo peaks can also be significant,<br />
indicating the presence of possible defects<br />
or other interfaces in the concrete. Shape effects<br />
due to beam boundaries, or from an elevated slab<br />
positioned directly on a beam can influence thickness<br />
measurements. When void/debond areas<br />
exist, the thickness echo peak is often shifted to a<br />
lower frequency. This causes the slab to appear<br />
thicker as a result of a later arrival time around the<br />
void/debond area.<br />
E FFECTIVENESS<br />
The <strong>Impact</strong> <strong>Echo</strong> method requires access to only<br />
one side of the structural member being investigated.<br />
There are two modes of investigation:<br />
thin and thick. These two modes allow for a wide<br />
range of thicknesses to be measured utilizing one<br />
instrument. For thin members of 4 to 24 inches<br />
thick, a solenoid impactor is used to generate high<br />
frequency energy. For thick members of 24 to 48<br />
inches thick, a small hammer is used to generate<br />
low frequency energy. <strong>Impact</strong> <strong>Echo</strong> investigations<br />
can determine member thickness within a 5%<br />
accuracy. The IE Scanning method is currently<br />
used for investigating shallow void/debond or<br />
honeycombing often found between an overlay on<br />
a bridge deck or surrounding dense rebar mats.<br />
The scanning method is not capable of determining<br />
bottom echo thicknesses beyond 24 inches.<br />
E XAMPLE<br />
R ESULTS<br />
IE - SHALLOW VOID/DEBOND<br />
Figure to the right shows an<br />
example of a shallow void/debond<br />
beneath a rebar mat. The data were<br />
collected utilizing the conventional<br />
point-by-point method. A 6 x 6 inch<br />
grid was established on the elevated<br />
slab. The slab was placed directly<br />
on top of a beam, as is evident<br />
from the two peaks in the spectrum<br />
plots. The first peak is at a frequency<br />
indicative of the thickness of the<br />
slab. The second peak is an echo<br />
from the side of the underlying<br />
beam.<br />
OLSON ENGINEERING, INC., 5191 Ward Rd., Suite 1, Wheat Ridge, CO 80033-1936 USA 303.423.1212<br />
[ Page 3 ]
CSL IE N N D D E E<br />
I MPACT E CHO S CANNING<br />
E XAMPLE R ESULTS cont.<br />
IE - CONCRETE LOCATION<br />
Performing the IE method at a sound concrete location gives results similar to the figure below. A single, sharp, clear<br />
peak representing a known thickness is indicative of sound concrete. The beam investigated was 10 inches wide and<br />
the bottom echo results in a peak at 10 inches.<br />
OLSON ENGINEERING, INC., 5191 Ward Rd., Suite 1, Wheat Ridge, CO 80033-1936 USA 303.423.1212<br />
[ Page 4 ]
IE N D E<br />
I MPACT E CHO S CANNING<br />
E XAMPLE R ESULTS cont.<br />
IE - VOIDS IN POST TENSIONED DUCTS<br />
An application of IE Scanning is locating voids in post-tensioned ducts. The figure below shows the results of scanning<br />
a concrete wall with PT ducts installed for research. IE scanning was performed on and off the centerline of the ducts.<br />
The first scan was performed along the centerline of the 7.5 cm (3 inch) diameter steel duct. The second, third, and<br />
fourth scans were performed 2.5, 5, and 7.5 cm (1, 2 and 3 inches) off the centerline of the steel duct. The thickness<br />
results from all four scans are presented in the figure below. Review of the figure shows that the first three scans yielded<br />
almost identical thickness results. The last scan (7.5 cm or 3 inches off the duct) yielded the nominal thickness of<br />
the concrete wall. This shows no effect from offset scanning as long as the offset was within 0.635 cm (0.25 inches)<br />
of the edge of the duct (5.5 cm or 2 inches offset from the centerline or less).<br />
OLSON ENGINEERING, INC., 12401 W. 49th Ave., Wheat Ridge, CO 80033-1927 USA 303.423.1212<br />
[ Page 5 ]
IE N D E<br />
I MPACT E CHO S CANNING<br />
R EFERENCES<br />
Standards and<br />
Governmental Reports<br />
■ C1383-98a, “Standard Test Method for Measuring<br />
the P-Wave Speed and the Thickness of<br />
Concrete Plates Using the <strong>Impact</strong>-<strong>Echo</strong><br />
Method,” Book of Standards Volume<br />
04.02, ASTM International.<br />
OLSON ENGINEERING P UBLICATIONS<br />
■ “<strong>Impact</strong>-<strong>Echo</strong> Scanning for Internal Grout Evaluation<br />
in Post-Tensioned Ducts,” Yajai Tinkey, Larry D.<br />
<strong>Olson</strong>, P.E., and L. C. Muszynski, Publication in<br />
the Proceedings of Seventh CAMNET/ACI<br />
International Concrete Conference on Recent<br />
Advance in Concrete Technology, to be published<br />
May of 2004.<br />
■ “<strong>Impact</strong>-<strong>Echo</strong> Scanning of Concrete Slabs<br />
and Pipes,” Dennis Sack and Larry D. <strong>Olson</strong>,P.E.,<br />
Advances in Concrete Technology, The 2nd<br />
CANMET/ACI Intl. Symposium, Las Vegas, NV,<br />
pp. 683-692, 1995.<br />
■ “<strong>Impact</strong>-<strong>Echo</strong> Scanning for Internal Grout Evaluation<br />
in Post-Tensioned Ducts,” L. C. Muszynski,<br />
Publication in the Proceedings of Seventh CAM<br />
NET/ACI International Concrete Conference on<br />
Recent Advance in Concrete Technology, to be<br />
published May of 2004.<br />
■ “<strong>Impact</strong>-<strong>Echo</strong> Scanning of Concrete Slabs and<br />
Pipes,” Dennis Sack and Larry D. <strong>Olson</strong>,P.E.,<br />
Advances in Concrete Technology, The 2nd<br />
CANMET/ACI Intl. Symposium, Las Vegas, NV,<br />
pp. 683-692, 1995.<br />
O LSON<br />
E NGINEERING, INC.<br />
CORPORATE OFFICE:<br />
12401 W. 49th Ave.<br />
Wheat Ridge, CO 80033-1927 USA<br />
Phone: 303.423.1212<br />
Fax: 303.423.6071<br />
■ www.olsonengineering.com<br />
■ www.olsoninstruments.com<br />
■ info@olsonengineering.com