

Get set for a liquidity rally - the DBS Vickers Securities Equities ...
Get set for a liquidity rally - the DBS Vickers Securities Equities ...
Get set for a liquidity rally - the DBS Vickers Securities Equities ...

Create successful ePaper yourself
Turn your PDF publications into a flip-book with our unique Google optimized e-Paper software.
Regional ETF Focus<br />
<strong>Get</strong> <strong>set</strong> <strong>for</strong> a <strong>liquidity</strong> <strong>rally</strong><br />
<strong>DBS</strong> Group Research Equity 21 Oct 2010<br />
In search of higher yields<br />
• QE2 will probably be announced on November 3<br />
• Asia markets are benefiting from ample <strong>liquidity</strong><br />
but impact to be short-lived<br />
• Improving US growth outlook brought about by<br />
QE2 to keep markets firm<br />
• Reflationary trade is back – commodity and<br />
property are prime beneficiaries<br />
• Look <strong>for</strong> valuation gaps to secure upside<br />
As <strong>the</strong> G3 central banks continue to push <strong>for</strong> QE2, <strong>the</strong><br />
flood in <strong>liquidity</strong> will continue to search <strong>for</strong> higher yielding<br />
as<strong>set</strong>s. Asia equities market will be <strong>the</strong> choice destination<br />
<strong>for</strong> <strong>liquidity</strong> flows on relative growth appeal.<br />
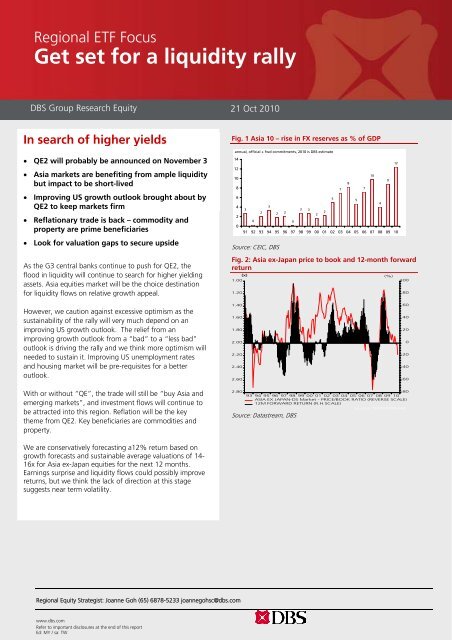
Fig. 1 Asia 10 – rise in FX reserves as % of GDP<br />
annual, official + fwd commitments, 2010 is <strong>DBS</strong> estimate<br />
14<br />
12<br />
10<br />
8<br />
6<br />
4<br />
2<br />
0<br />
3<br />
0<br />
2<br />
3<br />
2 2<br />
0<br />
3 3<br />
2<br />
91 92 93 94 95 96 97 98 99 00 01 02 03 04 05 06 07 08 09 10<br />
Source: CEIC, <strong>DBS</strong><br />
Fig. 2: Asia ex-Japan price to book and 12-month <strong>for</strong>ward<br />
return<br />
(x)<br />
1.00<br />
1.20<br />
2<br />
5<br />
7<br />
8<br />
5<br />
7<br />
10<br />
4<br />
9<br />
(%)<br />
12<br />
100<br />
80<br />
However, we caution against excessive optimism as <strong>the</strong><br />
sustainability of <strong>the</strong> <strong>rally</strong> will very much depend on an<br />
improving US growth outlook. The relief from an<br />
improving growth outlook from a “bad” to a “less bad”<br />
outlook is driving <strong>the</strong> <strong>rally</strong> and we think more optimism will<br />
needed to sustain it. Improving US unemployment rates<br />
and housing market will be pre-requisites <strong>for</strong> a better<br />
outlook.<br />
1.40<br />
1.60<br />
1.80<br />
2.00<br />
2.20<br />
2.40<br />
2.60<br />
60<br />
40<br />
20<br />
0<br />
-20<br />
-40<br />
-60<br />
With or without “QE”, <strong>the</strong> trade will still be “buy Asia and<br />
emerging markets”, and investment flows will continue to<br />
be attracted into this region. Reflation will be <strong>the</strong> key<br />
<strong>the</strong>me from QE2. Key beneficiaries are commodities and<br />
property.<br />
2.80 -80<br />
93 94 95 96 97 98 99 00 01 02 03 04 05 06 07 08 09 10<br />
ASIA EX JAPAN-DS Market - PRICE/BOOK RATIO (REVERSE SCALE)<br />
12M FORWARD RETURN (R.H.SCALE)<br />
Source: DATASTREAM<br />
Source: Datastream, <strong>DBS</strong><br />
We are conservatively <strong>for</strong>ecasting a12% return based on<br />
growth <strong>for</strong>ecasts and sustainable average valuations of 14-<br />
16x <strong>for</strong> Asia ex-Japan equities <strong>for</strong> <strong>the</strong> next 12 months.<br />
Earnings surprise and <strong>liquidity</strong> flows could possibly improve<br />
returns, but we think <strong>the</strong> lack of direction at this stage<br />
suggests near term volatility.<br />
Regional Equity Strategist: Joanne Goh (65) 6878-5233 joannegohsc@dbs.com<br />
www.dbs.com<br />
Refer to important disclosures at <strong>the</strong> end of this report<br />
Ed: MY / sa: TW
Regional ETF Guide<br />
<strong>Get</strong> <strong>set</strong> <strong>for</strong> a <strong>liquidity</strong> <strong>rally</strong><br />
In search of higher yields ( Joanne Goh, joannegohsc@dbs.com)<br />
The impact from QE2 is two fold, both of which are positive<br />
<strong>for</strong> equities. Firstly, <strong>the</strong> markets will be flushed with <strong>liquidity</strong>.<br />
Asian as<strong>set</strong>s thriving under higher economic growth rates,<br />
attractive yield gaps and currency appreciation are<br />
destinations of choice. Secondly, Fed’s policy of inflation<br />
targeting should favour equities as an as<strong>set</strong> class as a<br />
=beneficiary of reflation.<br />
2011 – a <strong>liquidity</strong> driven year ….<br />
As in 2009 when <strong>the</strong> Fed and major central banks were<br />
committed to as<strong>set</strong> purchases, we believe 2011 will be<br />
ano<strong>the</strong>r <strong>liquidity</strong> driven year. With <strong>the</strong> possible US$1 trillion<br />
targeted <strong>for</strong> as<strong>set</strong> purchases, which is sizeable compared to<br />
US$1540bn previously pumped in, we expect Asia equities<br />
to benefit from <strong>the</strong> <strong>liquidity</strong> flows.<br />
Indeed Asia markets were up by close to 100% from QE1<br />
(March 08 – 1Q10). Since <strong>the</strong>n Asia markets have been in a<br />
tight trading range, and only broke out of <strong>the</strong> 6-month<br />
trading range when signs of a possible QE2 emerged in<br />
September.<br />
Asia and US market per<strong>for</strong>mance with timeline of QE1<br />
100<br />
90<br />
80<br />
70<br />
60<br />
50<br />
40<br />
Nov '08:<br />
MBS<br />
purchase<br />
Jan-08 Jul-08 Jan-09 Jul-09 Jan-10 Jul-10<br />
Source: Datastream, <strong>DBS</strong><br />
Q1'10: QE1 complete<br />
Mar '09: Expand MBS<br />
program to $1.25t and<br />
US$300b LT secs<br />
MSCI Asia ex-Japan S&P 500<br />
Fundamentals needed <strong>for</strong> follow through<br />
Most <strong>liquidity</strong> rallies which were not supported by<br />
fundamentals ended in tears as in 1993, 1997 and 2007.<br />
The sudden outflow of <strong>liquidity</strong> driven by monetary<br />
tightening (1994), overheating and leading to hedge funds<br />
speculative attack (1997), and overheating leading to credit<br />
crisis (2007) were <strong>the</strong> main reasons in <strong>the</strong> sudden change in<br />
sentiment.<br />
Possible speed bumps ahead<br />
We do not believe <strong>the</strong> markets will rise in a straight line next<br />
year, as what was witnessed during QE1. Firstly, <strong>the</strong><br />
uncertainty in <strong>the</strong> US growth outlook is still threatening <strong>the</strong><br />
global recovery. Whe<strong>the</strong>r this is a pure <strong>liquidity</strong> <strong>rally</strong> or that<br />
supported by earnings growth remains to be seen. Since <strong>the</strong><br />
<strong>rally</strong> to 11000 on <strong>the</strong> Dow, markets are refocusing yet again<br />
on <strong>the</strong> corporate earnings season ahead. The outlook <strong>for</strong><br />
earnings growth is conservative, and upside risk remains to<br />
be seen.<br />
Secondly, <strong>the</strong> Japan experience of a long-term deflationary<br />
environment has raised concerns as to whe<strong>the</strong>r QE2 will<br />
really work in stemming deflationary fears. But who wants a<br />
lost decade It is gene<strong>rally</strong> believed that G3 central banks<br />
will avoid that scenario. The central bank “put“ is powerful<br />
enough to institute <strong>the</strong> belief that <strong>liquidity</strong> will be <strong>the</strong>re <strong>for</strong><br />
<strong>the</strong> long term.<br />
Thirdly, <strong>the</strong> weak USD outlook (as a result of QE2) is leaving<br />
uncom<strong>for</strong>table reminiscences that <strong>the</strong> <strong>liquidity</strong> rush involves<br />
a lot of carry trades and speculative positions in risky as<strong>set</strong>s,<br />
as in 2007. There is higher inflationary pressure stemming<br />
from competition from <strong>for</strong>eign money <strong>for</strong> goods, such as<br />
property and discretionary items; and rising commodity<br />
prices as a result of excessive speculation. The side effects of<br />
<strong>the</strong> increased capital flow on <strong>the</strong> real economy cannot be<br />
ignored.<br />
Fourthly, on <strong>the</strong> financial markets, rising valuations as a<br />
result of <strong>liquidity</strong> flows will lead to extended valuations.<br />
However valuations are subjective and everything looks<br />
cheap if <strong>the</strong> cost of capital is zero!<br />
Bond market bubble but not equities .. current valuations<br />
are sustainable and has room <strong>for</strong> re-rating<br />
There are reasons to believe that <strong>liquidity</strong> flows are<br />
benefiting <strong>the</strong> bond market more than <strong>the</strong> equities markets<br />
in <strong>the</strong> past six months. We have seen falling bond yields and<br />
currency appreciation but no re-rating in P/E valuations. Net<br />
<strong>for</strong>eign buying amounted to about US$712m a day (daily<br />
average since September) based on <strong>the</strong> 6 countries<br />
(Thailand, Indonesia, Philippines, Korea, Taiwan and India)<br />
where official data are available. However, <strong>the</strong> amount<br />
bought to date barely covers what was sold off during <strong>the</strong><br />
financial crisis.<br />
Page 2
Regional ETF Guide<br />
<strong>Get</strong> <strong>set</strong> <strong>for</strong> a <strong>liquidity</strong> <strong>rally</strong><br />
Cumulative net <strong>for</strong>eign inflow<br />
US$bil<br />
160<br />
140<br />
120<br />
100<br />
80<br />
60<br />
40<br />
20<br />
0<br />
-20<br />
03 04 05 06 07 08 09 10<br />
Source: Datastream, <strong>DBS</strong><br />
As a classic example, <strong>DBS</strong> fixed income strategist argues that<br />
<strong>the</strong> Indon bond market has extended beyond its<br />
fundamentals as <strong>the</strong> yield curve is too flat( see “Indonesia<br />
interest rate strategy: inflows drown fundamentals”, Jens<br />
Lauschke, 9 October 2010, included in this report), while<br />
<strong>DBS</strong> economist thinks that <strong>the</strong> economy is not yet<br />
overheated ( see “Indonesia: inflows & monetary policy”,<br />
Ma Tieying, 13 October 2010, included in this report) .<br />
Meanwhile, <strong>the</strong> Indonesia P/E is capped at 14x, which is<br />
within its long-term re-rating trend. It was only very recently<br />
that equity flows exceeded bond flows with <strong>the</strong> equities<br />
market going past 14x P/E. Hence, we believe current<br />
valuations are sustainable <strong>for</strong> Asia markets and has room <strong>for</strong><br />
re-rating.<br />
Foreign flows into Indonesian stock and bond markets<br />
IDR trillion<br />
25<br />
20<br />
15<br />
10<br />
5<br />
0<br />
-5<br />
-10<br />
Bonds<br />
Stocks<br />
Jun-09 Dec-09 Jun-10 Dec-10<br />
Source: CEIC<br />
Asia valuations cheap on PEG and P/E, expensive on<br />
P/B<br />
Valuations in Asia can be argued as cheap when using <strong>the</strong><br />
PEG model. It stands at 0.86x, which is still about 10%<br />
below historical average of 0.95x. This corresponds with<br />
Asia being a growth region, and <strong>the</strong> higher valuations<br />
(when compared to <strong>the</strong> US) are justified. However when<br />
using <strong>the</strong> P/B model, which is more of a predictive model <strong>for</strong><br />
12-month return, Asia ex-Japan is extremely expensive!<br />
Asia ex-Japan PEG ratio<br />
(x)<br />
2.5<br />
2<br />
1.5<br />
1<br />
0.5<br />
0<br />
N/A<br />
due to<br />
ve gro<br />
93 95 97 99 01 03 05 07 09<br />
Source: Datastream, <strong>DBS</strong><br />
Asia ex-Japan 12-month <strong>for</strong>ward P/E<br />
(x)<br />
21<br />
19<br />
17<br />
15<br />
13<br />
11<br />
9<br />
7<br />
00 01 02 03 04 05 06 07 08 09 10<br />
Source: Datastream, <strong>DBS</strong><br />
Earnings growth supports only 12% return <strong>for</strong> 2011<br />
With valuations at fair levels and 12% earnings growth <strong>for</strong><br />
2012 (we use a <strong>for</strong>ward P/E model), return expectations <strong>for</strong><br />
Asia equities are conservative at 12% <strong>for</strong> 2011. Ample<br />
<strong>liquidity</strong> will push valuations higher.<br />
Page 3
Regional ETF Guide<br />
<strong>Get</strong> <strong>set</strong> <strong>for</strong> a <strong>liquidity</strong> <strong>rally</strong><br />
On stretched valuations to +1SD of 10-year average<br />
valuations, potential returns can be 17% from current<br />
levels. That said re-rating drivers from <strong>liquidity</strong> will render<br />
valuations expensive. We believe rotational interest into<br />
value laggards will bring about <strong>the</strong> re-rating, and a<br />
convergence towards 14x P/E will be <strong>the</strong> likely re-rating<br />
path. We thus prefer Thailand and Korea as potential<br />
candidates <strong>for</strong> re-rating, Indonesia and China <strong>for</strong> growth<br />
surprises.<br />
We are underweight in Taiwan on potential earnings<br />
disappointment and India on de-rating from higher<br />
valuations.<br />
High price to book will cap upside<br />
One reservation we have <strong>for</strong> more upside is high price to<br />
book value multiples.<br />
Our valuation study has found that price to book is one of<br />
<strong>the</strong> better indicators <strong>for</strong> projecting 12-month <strong>for</strong>ward<br />
returns. Current levels indicate a negative return <strong>for</strong> <strong>the</strong> next<br />
12 months.<br />
Asia price to book vs 12-month <strong>for</strong>ward per<strong>for</strong>mance<br />
1.00<br />
1.20<br />
1.40<br />
1.60<br />
1.80<br />
2.00<br />
2.20<br />
2.40<br />
2.60<br />
(x)<br />
2.80 -80<br />
93 94 95 96 97 98 99 00 01 02 03 04 05 06 07 08 09 10<br />
ASIA EX JAPAN-DS Market - PRICE/BOOK RATIO (REVERSE SCALE)<br />
12M FORWARD RETURN (R.H.SCALE)<br />
Source: Datastream, <strong>DBS</strong><br />
(%)<br />
100<br />
80<br />
60<br />
40<br />
20<br />
0<br />
-20<br />
-40<br />
-60<br />
Source: DATASTREAM<br />
Upside surprise from growth needs fur<strong>the</strong>r catalysts<br />
At this juncture we do not see upside surprise from growth<br />
projections. After a strong economic year in 2010, <strong>DBS</strong><br />
economist refers to next year’s growth as more normalised<br />
with a return to growth trend. A gloomy outlook <strong>for</strong> <strong>the</strong> US<br />
and Europe hinders a more optimistic outlook <strong>for</strong> <strong>the</strong><br />
region.<br />
QE2 and reflation<br />
We believe <strong>the</strong> direct beneficiaries <strong>for</strong> QE2 will be<br />
commodities and properties. QE2 will help bring interest<br />
rates down with <strong>the</strong> purchase of long term securities. At<br />
Asia market economic growth and earnings growth<br />
<strong>for</strong>ecasts<br />
GDP growth, % YoY Earnings growth, % YoY<br />
2010f 2011f 2010f 2011f<br />
US 2.8 2.4 39.7 13.8<br />
Japan 2.7 1.6 79.5 17.1<br />
Eurozone 1.7 1.5 35.3 16.0<br />
Indonesia* 6.0 5.8 17.3 14.6<br />
Malaysia* 8.0 5.5 16.8 14.3<br />
Philippines 6.2 5.0 22.3 12.4<br />
Singapore* 15.0 4.5 18.8 12.8<br />
Thailand* 9.0 4.0 19.5 13.9<br />
China* 10.0 9.5 13.9 11.8<br />
Hong Kong* 7.0 4.5 15.8 13.7<br />
Taiwan 9.5 3.8 90.3 9.2<br />
Korea 6.2 3.9 55.3 6.3<br />
India 8.8 8.5 23.4 22.3<br />
Source: <strong>DBS</strong> <strong>for</strong>ecasts (GDP), IBES (earnings growth) except <strong>for</strong><br />
markets marked with *s which are <strong>DBS</strong><strong>Vickers</strong> coverage.<br />
Earnings growth <strong>for</strong> Hong Kong refers to HSI and China refers<br />
to H-share universe<br />
<strong>the</strong> same time with inflation targeting real interest rates will<br />
also fall. Commodities are good inflation and weak USD<br />
hedge. But we are selective on Asia property sector as an<br />
inflation hedge due to tightening fears in Asia.<br />
Interest rate tightening in Asia, however<br />
In Asia interest rate hikes will be <strong>the</strong> main concern. In 3Q10,<br />
Asia central banks showed <strong>the</strong>ir confidence on growth with<br />
rate hikes. Due to very strong domestic demand and<br />
inflows, inflation in Asia continued to rise, pressurising<br />
central banks to raise raises.<br />
<strong>DBS</strong> economists believe that rate hikes will continue in<br />
4Q10. Singapore tightened its grip on monetary policies by<br />
steepening and widening <strong>the</strong> SGD NEER currency band to<br />
allow <strong>for</strong> more and faster appreciation in early October.<br />
That was followed by RRR hikes and interest rate hikes in<br />
China. We expect most o<strong>the</strong>r Asia countries to follow suit.<br />
That said, <strong>the</strong> strategy team believes that Asia central banks<br />
are facing a dilemma in balancing growth and inflation. As<br />
such a rate hike should signal confidence ra<strong>the</strong>r being seen<br />
as restrictive on growth. On <strong>the</strong> o<strong>the</strong>r hand, central banks<br />
might send <strong>the</strong> wrong signal if rates are not raised, ei<strong>the</strong>r<br />
being perceived as non-independent or too complacent, or<br />
lack of confidence in growth.<br />
Interest rate normalisation, at least hiking towards mid point<br />
of <strong>the</strong> precrisis level, should be taken as a healthy move<br />
towards prevention of a build up of inflationary<br />
expectations. The strategy team believes most Asia countries<br />
will slow <strong>the</strong> interest rate normalisation process.<br />
Page 4
Regional ETF Guide<br />
<strong>Get</strong> <strong>set</strong> <strong>for</strong> a <strong>liquidity</strong> <strong>rally</strong><br />
Table of Contents<br />
In search of higher yields 2<br />
Asia economic focus: ano<strong>the</strong>r day, ano<strong>the</strong>r<br />
$2bn inflow 6<br />
Forex: Pause first 9<br />
Asia equity ETF Investment ideas 11<br />
Singapore-listed ETFs at a glance 13<br />
Hong Kong-listed ETFs at a glance 14-15<br />
Singapore market outlook 16<br />
Hong Kong / China market outlook 18<br />
China economic outlook: 21<br />
Forex: Chinese yuan 23<br />
India market outlook 24<br />
India economic outlook 25<br />
Korea market outlook 28<br />
Korea economic outlook: 29<br />
Taiwan market outlook 32<br />
Taiwan economic outlook 33<br />
Indonesia market outlook 36<br />
Indonesia economic outlook 38<br />
Indonesia interest rate strategy 41<br />
Thailand market outlook 43<br />
Malaysia market outlook 45<br />
Page 5
Regional ETF Guide<br />
<strong>Get</strong> <strong>set</strong> <strong>for</strong> a <strong>liquidity</strong> <strong>rally</strong><br />
Asia economic Focus: ano<strong>the</strong>r day, ano<strong>the</strong>r $2bn inflow (David Carbon,<br />
davidcarbon@dbs.com, re-published from same name report, 1 October)<br />
• Since Apr09, inflows have been pouring into Asia to<br />
<strong>the</strong> tune of $2bn per day. Foreign reserves have risen<br />
by $962bn, or 13% of GDP, significantly faster than<br />
any time in history<br />
• It is no coincidence that, over <strong>the</strong> same time period,<br />
<strong>the</strong> Fed injected $1500bn of <strong>liquidity</strong> into markets via<br />
purchases of Treasuries and housing securities (MBS<br />
and agency paper)<br />
• Washington howls at currency intervention. But<br />
quantitative easing and currency intervention are both<br />
just <strong>liquidity</strong> injections. Who’s really intervening, <strong>the</strong><br />
Fed or Asia<br />
• With QE1 inflows not having run <strong>the</strong>ir course and QE2<br />
already in <strong>the</strong> wings, talk of “one-way bets” in Asian<br />
markets is on <strong>the</strong> rise. Appropriately so<br />
The world may or may not be at war on <strong>the</strong> currency front.<br />
But, as Milton Friedman said, it’s <strong>the</strong> “as if” part that<br />
matters. The pool shark may not know a thing about <strong>the</strong><br />
laws of physics but if he plays as if he does, he can make a<br />
lot of waves. Thus <strong>the</strong> Fed pushes <strong>the</strong> dollar down with<br />
$1.5 trn of quantitative easing between Mar08 and Mar09<br />
(QE1). Japan pushes back by intervening in currency<br />
markets. Washington cringes: QE is kosher, CI (currency<br />
intervention) is not. The Fed counters, all but announcing<br />
QE2, ano<strong>the</strong>r $500bn to $1000bn of <strong>liquidity</strong> injections.<br />
Japan recoils, but creatively. If CI is out, no problem: it<br />
prepares its own QE and fingers <strong>the</strong> trigger. If Bernanke<br />
launches, <strong>the</strong> BoJ will too, be<strong>for</strong>e <strong>the</strong> Fed’s missles can land.<br />
CI, as Japan has so aptly shown, is not very much in<br />
practical terms. Both inject <strong>liquidity</strong> into <strong>the</strong> larger pool of<br />
wet stuff that flows across all markets – <strong>the</strong>y just do it via<br />
different doors. But plainly, <strong>the</strong> water’s just as high on <strong>the</strong><br />
currency side of <strong>the</strong> pool as it is on <strong>the</strong> money/bond side of<br />
<strong>the</strong> pool. The only difference between QE and CI would<br />
seem to be <strong>the</strong> time it takes <strong>for</strong> <strong>the</strong> water to flow from one<br />
side of <strong>the</strong> pool to <strong>the</strong> o<strong>the</strong>r. And in today’s high-tech<br />
markets packed with all kinds of traders, that’s not very<br />
long.<br />
Liquid is as liquid does<br />
By hook or by crook – QE or CI – <strong>the</strong> Fed is flooding markets<br />
with <strong>liquidity</strong>, Japan is flooding <strong>the</strong> markets with <strong>liquidity</strong><br />
and <strong>the</strong> UK is flooding markets with <strong>liquidity</strong>. The trouble<br />
is, a lot of that money isn’t staying where it was put.<br />
Growth in <strong>the</strong> G3 is subpar and most expect it to remain<br />
that way <strong>for</strong> a couple years if not <strong>for</strong> longer. So a big chunk<br />
of those G3 injections is heading <strong>for</strong> o<strong>the</strong>r shores, where<br />
growth and returns are expected to be higher.<br />
A lot of it has gone to Asia, and <strong>for</strong> good reason. Asia<br />
didn’t stop growing just because <strong>the</strong> US and Japan and<br />
Europe did. Output (GDP) in Asia is 10% higher than it was<br />
in 3Q08. Consumption (private) is 18% higher than it was<br />
in 3Q08. In <strong>the</strong> G3, consumption has not grown a bit.<br />
O<strong>the</strong>r things equal, faster growth means higher returns and<br />
it’s little wonder that that a lot of that G3 <strong>liquidity</strong> is flowing<br />
to Asia in an attempt to capture <strong>the</strong>m.<br />
Real global consumption<br />
Asia 10: Equity markets<br />
3Q08=100, seas adj<br />
simple avg of Asia-10 national indices, Jan08=100, weekly data, eop [1]<br />
110<br />
Nov07: 104<br />
100<br />
Oct10: 102.8<br />
120<br />
116<br />
Asia-10<br />
90<br />
112<br />
80<br />
70<br />
60<br />
50<br />
40<br />
Jan-05 Jan-06 Jan-07 Jan-08 Jan-09 Jan-10 Jan-11<br />
Mutually assured destruction Not if you’re an Asian equity<br />
market. In fact, a lot of investors are saying, if this is war,<br />
bring it on. Why Because <strong>the</strong> difference between QE and<br />
108<br />
104<br />
100<br />
96<br />
Sep-<br />
08<br />
Dec-<br />
08<br />
Mar-<br />
09<br />
Jun-<br />
09<br />
Sep-<br />
09<br />
The growth that<br />
came "from<br />
nowhere"<br />
Dec-<br />
09<br />
Mar-<br />
10<br />
Jun-<br />
10<br />
US, JP<br />
EU16<br />
Page 6
Regional ETF Guide<br />
<strong>Get</strong> <strong>set</strong> <strong>for</strong> a <strong>liquidity</strong> <strong>rally</strong><br />
Momentum<br />
In <strong>the</strong> short-run, everyone succeeds. As <strong>the</strong> chart on <strong>the</strong><br />
page 1 shows, equity markets have, on average, risen by<br />
20% since May (and 16% since <strong>the</strong> start of <strong>the</strong> year).<br />
Markets have doubled in value since early-2009, on average,<br />
and are now only about 1% shy of fully recovering <strong>the</strong>ir<br />
pre-crisis highs of Nov07.<br />
Asia – currency appreciation<br />
%, 2010 to date<br />
10 9 9<br />
9<br />
8<br />
7<br />
6<br />
5<br />
4<br />
3<br />
2<br />
1<br />
0<br />
6<br />
6<br />
5<br />
MYR THB SGD PHP IDR INR TWD KRW CNY<br />
As one would expect, and much to <strong>the</strong> chagrin of local<br />
central banks, currencies are appreciating too. Since<br />
January, Asian currencies have risen by 6% on average<br />
4<br />
4<br />
3<br />
2<br />
against <strong>the</strong> dollar. The ringgit and baht are leading <strong>the</strong><br />
region with year-to-date appreciation of 9%, followed by<br />
<strong>the</strong> Singapore dollar <strong>the</strong> Philippine peso (6%), <strong>the</strong> rupiah<br />
(5%) and <strong>the</strong> rupee, won and TWD at about 4%. China<br />
continues to intervene <strong>the</strong> most in currency markets<br />
allowing only 2% appreciation of <strong>the</strong> yuan against <strong>the</strong><br />
dollar this year.<br />
Who’s “intervening”: Asia or <strong>the</strong> Fed<br />
China’s intervention in currency markets is of course <strong>the</strong><br />
source of much irritation to US politicians. How much<br />
intervention has <strong>the</strong>re been Since April of 2009, when<br />
inflows into Asia really started to pick up, China’s <strong>for</strong>eign<br />
reserves have risen by some $535bn. That’s a little more<br />
than half (56%) of <strong>the</strong> total increase in <strong>for</strong>eign reserves<br />
($962bn) by Asia’s central banks since <strong>the</strong>n (chart below<br />
left).<br />
That’s a lot of inflow and a lot of intervention – $2bn per<br />
day to be precise and and it works out to some 13% of one<br />
year’s GDP <strong>for</strong> Asian economies on average (chart below<br />
right). It’s easy to see why Asian markets are rising and why<br />
Asian currencies are rising. And why US politicians are a<br />
little piqued.<br />
Asia – rise in <strong>for</strong>eign reserves<br />
g<br />
USD bn, including fwd commitments, Apr09-Aug10 [2]<br />
600<br />
535<br />
500<br />
400<br />
300<br />
200<br />
118<br />
100<br />
77 68 67<br />
44<br />
27 21<br />
6<br />
0<br />
CH KR SG HK TW TH PH ID MY<br />
Asia – rise in <strong>for</strong>eign reserves<br />
g<br />
% of GDP, including fwd commitments, Apr09-Aug10 [2]<br />
35 33<br />
30<br />
25<br />
24<br />
20<br />
15<br />
13<br />
12 12<br />
11<br />
10<br />
8<br />
5<br />
3 2<br />
0<br />
SG HK TW TH PH KR CH ID MY<br />
Page 7
Regional ETF Guide<br />
<strong>Get</strong> <strong>set</strong> <strong>for</strong> a <strong>liquidity</strong> <strong>rally</strong><br />
But should <strong>the</strong>y really be up<strong>set</strong> If you take <strong>the</strong> view that<br />
QE and CI (currency intervention) are both just <strong>liquidity</strong><br />
injections <strong>the</strong> question <strong>the</strong>n becomes: who is really<br />
intervening, <strong>the</strong> US or China/Asia The answer is a lot less<br />
clear than what you’d ga<strong>the</strong>r from reading <strong>the</strong> papers every<br />
day.<br />
Between Feb09 and Aug10, <strong>the</strong> Fed pumped $1540bn into<br />
markets via its purchases of Treasuries and housing<br />
securities (MBS+agency paper). Since Apr09, Asia’s <strong>for</strong>eign<br />
reserves have soared by $962bn. Not only is <strong>the</strong> Fed’s<br />
intervention $600bn larger than Asia’s, but Asia’s chicken<br />
sure looks to have hatched from <strong>the</strong> Fed’s egg.<br />
One way bet<br />
Irrespective of who’s doing <strong>the</strong> intervening, Asia is being<br />
inundated with inflows. At 13% of GDP on average, <strong>the</strong><br />
accumulation of <strong>for</strong>eign reserves is significantly higher than<br />
at any time in history (chart below). That includes <strong>the</strong> early-<br />
90’s when <strong>for</strong>eign inflows into Asia led to soaring equity<br />
markets, too-low interest rates, high leverage, over<br />
investment, excess capacity, property bubbles and ultimately<br />
<strong>the</strong> blowout known as <strong>the</strong> Asian financial crisis of 1997/98.<br />
Asia 10 – rise in FX reserves as % of GDP<br />
annual, official + fwd commitments, 2010 is <strong>DBS</strong> estimate<br />
14<br />
12<br />
10<br />
8<br />
6<br />
4<br />
2<br />
0<br />
3<br />
0<br />
2<br />
3<br />
2 2<br />
0<br />
3 3<br />
2<br />
91 92 93 94 95 96 97 98 99 00 01 02 03 04 05 06 07 08 09 10<br />
In previous research [3], we argued at some length that <strong>the</strong><br />
next 5-10 years in Asia is likely to look very much like <strong>the</strong> 5-<br />
10 years that led up to <strong>the</strong> Asian financial crisis. Much of<br />
<strong>the</strong> reason, we argued, was that inflows into Asia seemed<br />
likely to rise sharply, partly due to long-term “structural”<br />
reasons (Asia is where <strong>the</strong> world’s new demand is being<br />
generated) and partly <strong>for</strong> cyclical reasons – namely, <strong>the</strong><br />
outflow of G3 QE quantitative easing programs into higher<br />
yielding economies / regions such as Asia.<br />
2<br />
5<br />
7<br />
8<br />
5<br />
7<br />
10<br />
4<br />
9<br />
12<br />
Without a doubt, <strong>the</strong> cyclical flows have been more<br />
aggressive than even we imagined a year ago. And with <strong>the</strong><br />
US, Japan and England now on <strong>the</strong> verge of ano<strong>the</strong>r round<br />
of QE it is little wonder that most strategists now predicts<br />
fur<strong>the</strong>r gains in Asian equities, bonds and currencies. Who<br />
would dare stand in <strong>the</strong> way of a QE2 freight train pointed<br />
straight down <strong>the</strong> tracks at Asia when <strong>the</strong> effects of QE1<br />
have yet to run <strong>the</strong>ir course Most seem happy to climb<br />
aboard what is increasingly regarded as a one-way bet.<br />
Of course one-way bets never stay that way <strong>for</strong>ever. And,<br />
yes, <strong>the</strong>y often end in tears. But our view, expressed a year<br />
ago [3] is that Asia has spent <strong>the</strong> last ten years deleveraging<br />
and thus seems well placed to wea<strong>the</strong>r a multi-year period<br />
of re-leveraging. And though it is true that things are<br />
developing more rapidly than we imagined a year ago, it<br />
still seems as though this train has barely left <strong>the</strong> station.<br />
With <strong>the</strong> trillions of dollars of QE1 coal yet to be burned<br />
through and ano<strong>the</strong>r trillion of QE2 seemingly on <strong>the</strong> way,<br />
it’s surely going to take more than a few weeks or months<br />
or quarters be<strong>for</strong>e this train comes to rest.<br />
Notes<br />
1. Asia10: CH, HK, TW, KR, SG, MY, TH, ID, PH, IN<br />
2. “Effective reserves” include not just actual dollar holdings<br />
but also commitments to purchase dollars at a future date in<br />
<strong>the</strong> <strong>for</strong>ward market. Such intervention is now reported by<br />
most IMF member countries as part of <strong>the</strong> re<strong>for</strong>ms<br />
introduced in <strong>the</strong> aftermath of <strong>the</strong> Asian financial crisis of<br />
1997/98. Forward market intervention has <strong>the</strong> same impact<br />
on <strong>the</strong> currency as spot purchases even though it does not<br />
(yet) appear in official reserve figures. This earlier lack of<br />
transparency was judged to have contributed to <strong>the</strong> crisis,<br />
particularly in <strong>the</strong> case of Thailand, where reported reserves<br />
appeared substantial but were, in effect, already zero<br />
because <strong>the</strong>y had been sold <strong>for</strong>ward in <strong>the</strong> <strong>for</strong>ward currency<br />
market.<br />
3. “Asia-vu: back to <strong>the</strong> ‘90s”, <strong>DBS</strong> Economics-Markets-<br />
Strategy, 17Sep09.<br />
Page 8
Regional ETF Focus<br />
<strong>Get</strong> <strong>set</strong> <strong>for</strong> a <strong>liquidity</strong> <strong>rally</strong><br />
Forex: Pause first (Philip Wee, philipwee@dbs.com, re-published and extracted from same name report in “<br />
Economics-Markets-Strategy, 11 Sep 2010)<br />
November is an important month<br />
The most important month in 4Q 2010 is probably<br />
November, which houses many key events that look <strong>set</strong> to<br />
politicize <strong>the</strong> Chinese yuan issue again. Unlike June, <strong>the</strong>re<br />
appears to be a bias by <strong>the</strong> US and o<strong>the</strong>r major economies<br />
to lean towards <strong>the</strong> carrot ra<strong>the</strong>r than <strong>the</strong> stick to achieve<br />
more progress on <strong>the</strong> yuan.<br />
• US Treasury Currency Report (mid-October)<br />
The semiannual Currency Report was last delayed in<br />
April to “encourage” China to free its yuan from <strong>the</strong> US<br />
dollar. China announced yuan re<strong>for</strong>ms on June 19 to<br />
introduce flexibility into its exchange rate. The Treasury<br />
finally released <strong>the</strong> report on July 8 without naming<br />
China a currency manipulator.<br />
The next Currency Report is unlikely to be released on<br />
schedule in mid-October owing to <strong>the</strong> US midterm<br />
elections. China is unlikely to be named a manipulator<br />
when it is eventually published. The Ministry of<br />
Commerce in China has already started to take steps to<br />
increase imports. The USD/CNY trading band is also<br />
likely to be widened nearer <strong>the</strong> G20 summit.<br />
• US midterm elections (November 2)<br />
According to US undersecretary of State Robert Hormats<br />
on September 3, US lawmakers have become impatient<br />
with a lack of progress by China to address currency and<br />
trade issues. With <strong>the</strong> economy and jobs topping voter<br />
concerns ahead of <strong>the</strong> US midterm elections in<br />
November, risks have increased <strong>for</strong> US lawmakers to<br />
become more protectionist.<br />
A key committee in <strong>the</strong> US House of Representatives is<br />
scheduled to hold a hearing on September 15 to<br />
determine if <strong>the</strong> undervalued yuan has provided unfair<br />
advantages to Chinese companies against US Inc. Owing<br />
to <strong>the</strong>ir interdependency, Washington and Beijing are<br />
likely to continue cooperating to avoid <strong>the</strong> political<br />
pitfalls linked to legislation.<br />
• G20 summit (November 11-12)<br />
Unlike <strong>the</strong> last G20 summit in June, <strong>the</strong> US is unlikely to<br />
strongly <strong>rally</strong> emerging countries to pressure China on<br />
<strong>the</strong> yuan. First, emerging countries are less tolerant of<br />
currency appreciation because of <strong>the</strong> second half<br />
slowdown story amidst concerns that US double-dip<br />
recession risks are no longer zero. Second, <strong>the</strong> IMF fiveyear<br />
review, which is likely to be held alongside <strong>the</strong> G20<br />
summit, is expected to boost <strong>the</strong> voting power of<br />
emerging economies. The job now is to persuade China<br />
to live up to its global responsibility to address<br />
imbalances with its new clout.<br />
Looking ahead, <strong>the</strong> G20 summits in 2011 have more<br />
scope to renew <strong>the</strong> dollar’s depreciation. France, who<br />
will be assuming <strong>the</strong> G20 presidency in 2011, has voiced<br />
its desire to re<strong>for</strong>m <strong>the</strong> current international monetary<br />
system modelled around <strong>the</strong> US dollar to reflect an<br />
increasingly multipolar global economy.<br />
• IMF five-year review (November)<br />
According to IMF managing director Dominique Strauss-<br />
Kahn on June 27, <strong>the</strong> increase in China’s voting power<br />
in <strong>the</strong> IMF is expected to be “ra<strong>the</strong>r big”. An agreement<br />
to shift more (5% or more) voting power in <strong>the</strong> IMF to<br />
under-represented emerging economies was reached at<br />
<strong>the</strong> G20 summit in late September 2009. This was <strong>the</strong><br />
summit that <strong>for</strong>malized <strong>the</strong> G20 as <strong>the</strong> world’s premier<br />
economic <strong>for</strong>um.<br />
Compared to a year ago, Eurozone no longer appears as<br />
keen to share power in <strong>the</strong> IMF today. After <strong>the</strong> EU<br />
fiscal/debt crisis in 2Q, Eurozone was unhappy that <strong>the</strong><br />
US placed its recovery over EU’s need to emphasize fiscal<br />
austerity, as well as China’s slow progress in allowing<br />
yuan appreciation. None<strong>the</strong>less, Eurozone is expected to<br />
eventually honor its earlier commitment. If so, China is<br />
expected to overtake France and UK to become <strong>the</strong><br />
fourth loudest voice in <strong>the</strong> IMF, after <strong>the</strong> US, Japan and<br />
Germany.<br />
Page 9
Regional ETF Focus<br />
<strong>Get</strong> <strong>set</strong> <strong>for</strong> a <strong>liquidity</strong> <strong>rally</strong><br />
More flexible CNY is also USD – sensitive<br />
Voting power in IMF – SDR vs BRIC economies<br />
90<br />
6.84<br />
25<br />
% of total votes<br />
88<br />
86<br />
84<br />
82<br />
DXY (USD) index<br />
(lhs)<br />
USD/CNY (rhs)<br />
6.83<br />
6.82<br />
6.81<br />
6.80<br />
6.79<br />
6.78<br />
20<br />
15<br />
10<br />
19.55<br />
16.77<br />
SDR: EUR, USD, JPY, GBP<br />
BRIC: CNY, RUB, INR, BRL<br />
80<br />
78<br />
76<br />
Jan-10 Mar-10 May-10 Jul-10 Sep-10<br />
6.77<br />
6.76<br />
6.75<br />
6.74<br />
5<br />
0<br />
6.02<br />
4.86<br />
3.66<br />
2.69<br />
1.89<br />
1.33<br />
EU US Japan UK China Russia India Brazil<br />
The yuan is, however, unlikely to be included in <strong>the</strong><br />
Special Drawing Right (SDR) <strong>for</strong> this IMF review. The<br />
yuan needs to be closer to <strong>the</strong> SDR basket of currencies<br />
(US dollar, euro, British pound and <strong>the</strong> Japanese yen) in<br />
two regards. The yuan needs to be more marketdetermined<br />
and more convertible on <strong>the</strong> capital account.<br />
4Q 2010 – a tough transition towards a sustainable<br />
global recovery<br />
In summary, <strong>the</strong> final quarter is likely to comprise two halves.<br />
Until economic data improves, especially <strong>for</strong> <strong>the</strong> US, global<br />
slowdown worries should dominate and support <strong>the</strong> US<br />
dollar as a safe haven currency.<br />
China’s <strong>for</strong>eign reserves breakdown<br />
November should be closely watched as a potential turning<br />
point <strong>for</strong> <strong>the</strong> US dollar to depreciate again. Hopefully by<br />
<strong>the</strong>n, most economies would have exhibited signs of<br />
returning to a more sustainable moderate growth path,<br />
preferably with China allowing more yuan appreciation. If so,<br />
this should <strong>set</strong> <strong>the</strong> stage <strong>for</strong> risk appetite to return on <strong>the</strong><br />
back of a broad-based depreciation in <strong>the</strong> US dollar.<br />
If 2009/10 was about emerging from <strong>the</strong> (US/EU) global<br />
crisis, 2011 and <strong>the</strong> next few years will be about moving<br />
towards a more sustainable global recovery. When this<br />
happens, expect more diversification out of US dollars.<br />
Weights of basket currencies in SDR<br />
GBP, 5%<br />
JPY, 3%<br />
JPY, 15%<br />
EUR, 26%<br />
GBP, 10%<br />
USD, 45%<br />
USD, 65%<br />
EUR, 29%<br />
Sources:<br />
Sources <strong>for</strong> all charts and tables are Bloomberg . Forecasts are <strong>DBS</strong> Group Research.<br />
Page 10
Regional ETF Focus<br />
<strong>Get</strong> <strong>set</strong> <strong>for</strong> a <strong>liquidity</strong> <strong>rally</strong><br />
Asia equity ETF Investment ideas (Joanne Goh, joannegohsc@dbs.com)<br />
Over <strong>the</strong> last two months mid caps stocks have stolen <strong>the</strong><br />
limelight. Big caps and main indices were stuck in a trading<br />
range as broad macro factors were uncertain and lagging in<br />
per<strong>for</strong>mance.<br />
We believe that as <strong>the</strong> uncertainty dissipates, coupled with<br />
<strong>the</strong> <strong>liquidity</strong> boost by central banks, large caps will have a<br />
lot of catch up to do.<br />
We recommend buying into ETFs to capture <strong>the</strong> upside as<br />
<strong>the</strong> equities market recovery becomes broad based. QE2 will<br />
probably be announced on November 3 which could drive<br />
ano<strong>the</strong>r <strong>liquidity</strong> <strong>rally</strong>.<br />
Our currency strategist points to November as an important<br />
month to watch (See “Forex: Pause first” included in this<br />
report). As far as Asia equities are concerned, we believe<br />
<strong>for</strong>ex volatility with a streng<strong>the</strong>ning bias should be positive<br />
<strong>for</strong> Asia markets. However, with Asia currencies and Asia<br />
equities up by 3.9% and 10% respectively since 1 Sep, we<br />
see <strong>the</strong> possibility that November will be a month of<br />
consolidation be<strong>for</strong>e <strong>the</strong> next leg up. Any weakness is a<br />
buying opportunity in our view.<br />
“Buy Asia and Emerging markets”<br />
The debate over whe<strong>the</strong>r QE2 will be successful is irrelevant<br />
to <strong>the</strong> “Buy Asia and emerging markets” <strong>the</strong>me as Asia will<br />
still be <strong>the</strong> growth region. Under a moderate US growth<br />
environment and continuation of low rates policy, Asia<br />
markets could potentially mirror <strong>the</strong> early 1990s’ where<br />
investments will lead growth in <strong>the</strong> next decade.<br />
ETFs exposed to Asia ex-Japan markets<br />
ETF Ticker Mkt Cap Country/ Underlying<br />
(US$ m) Region Index<br />
Tracker<br />
Singapore listed ETFs<br />
CIMBFTASEAN40 ASEAN SP Equity 209 ASEAN ASEAN40<br />
Lyxor APEX50 APEX SP Equity 13 Asia ex-Jap MXAPEXA<br />
Lyxor Asia AEJ SP Equity 139 Asia Pac ex-Jap MXAPJ<br />
DBXT MS Asia X-JP XAXJ SP Equity 508 Asia ex-Jap NDUECAXJ<br />
DBXT MSCI EM Asia XMAS SP Equity 7 Asia Pac ex-Jap NDUEEGFA<br />
DBXT MSCI Pacific ex Japan XPXJ SP Equity 43 Pac ex-Jap NDDUPXJ<br />
Hong Kong listed ETFs<br />
iShares APEX50 3010 HK Equity 43 APAC ex-J MXAPEXA<br />
iShares APEX Mid Cap 3032 HK Equity 21 APAC ex-J MXAPEXAM<br />
iShares APEX Small Cap 3004 HK Equity 13 APAC ex-J MXAPEXAS<br />
Lyxor MSCI Asia ex-Japan 2815 HK Equity 68 APAC ex-J MXAPJ<br />
iShares Emerging Asia 2802 HK Equity 28 Asia MXMS<br />
DBXT Emerging Mkts Asia 3035 HK Equity 8 Asia NDUEEGFA<br />
DBXT Pacific ex Japan 3043 HK Equity 43 Pac x Jap NDDUPXJ<br />
SPDR FTSE Greater China ETF 3073 HK Equity 72 HK/Taiwan GPSSG239<br />
Source: Datastream<br />
Singapore STI to break out of its trading range<br />
<strong>DBS</strong><strong>Vickers</strong>’ strategist <strong>for</strong> Singapore, Janice Chua, believes<br />
that <strong>the</strong> Singapore market is ready to break out of its<br />
trading band and sees <strong>the</strong> STI trading up to 3500 in <strong>the</strong> next<br />
12 months. (See report “Singapore strategy : All boats rise<br />
with <strong>the</strong> tide”, 13 October, 2010”). She recommends going<br />
<strong>for</strong> big large caps laggards. As good news gets reflected in<br />
<strong>the</strong> valuation of a handful of current market leaders, <strong>the</strong>re is<br />
room <strong>for</strong> future <strong>liquidity</strong> inflows to benefit <strong>the</strong> rest of <strong>the</strong><br />
index laggards as <strong>the</strong>y play catchup. Our target is 3500 <strong>for</strong><br />
year end 2011, suggesting 10% upside.<br />
Multi-year <strong>rally</strong> awaits <strong>the</strong> Thai market<br />
We also believe that a multi-year <strong>rally</strong> awaits <strong>the</strong> Thai<br />
market. As seen from <strong>the</strong> following relative per<strong>for</strong>mance<br />
chart, Thailand has been lagging its regional peers in local<br />
currency and USD terms <strong>for</strong> <strong>the</strong> past 20 years! If politics is<br />
one of one of <strong>the</strong> key reasons <strong>for</strong> <strong>the</strong> P/E de-rating, <strong>the</strong><br />
easing of political tension from its peak should see <strong>the</strong> stock<br />
market re-rate back to historical average.<br />
While short-term valuation opportunities have become<br />
harder to identify following <strong>the</strong> recent <strong>rally</strong> in Thailand, it is<br />
still one of <strong>the</strong> cheapest markets in <strong>the</strong> region. The SET<br />
index could potentially trade towards <strong>the</strong> upper limit of its<br />
historical P/E range in <strong>the</strong> last 10 years.<br />
Thai relative per<strong>for</strong>mance to MSCI Asia ex-Japan<br />
120<br />
100<br />
80<br />
60<br />
40<br />
20<br />
0<br />
90 91 92 93 94 95 96 97 98 99 00 01 02 03 04 05 06 07 08 09 10<br />
Source: Datastream<br />
Local currency<br />
USD<br />
Source: DATASTREAM<br />
Page 11
Regional ETF Focus<br />
<strong>Get</strong> <strong>set</strong> <strong>for</strong> a <strong>liquidity</strong> <strong>rally</strong><br />
Thai P/E band<br />
700<br />
600<br />
500<br />
400<br />
300<br />
200<br />
100<br />
700<br />
600<br />
500<br />
400<br />
300<br />
200<br />
100<br />
Malaysia – market uptrend intact<br />
<strong>DBS</strong> Malaysia strategist believes that <strong>the</strong> market uptrend is<br />
intact and is targeting 1650 on KLCI by end 2011 –11%<br />
upside from current levels. Budget 2011 is private sector<br />
friendly and Malaysia’s PM reaffirmed commitment to <strong>the</strong><br />
RM40bn high impact MRT project that will start in 2011.<br />
We believe <strong>the</strong> project, if completed, will be instrumental in<br />
trans<strong>for</strong>ming Malaysia to a high income nation and benefit<br />
many private sectors.<br />
ASEAN – back to 1990’s<br />
9<br />
96 97 98 99 00 01 02 03 04 05 06 07 08 09 10<br />
Source: Datastream<br />
Indonesia – no overheating in <strong>the</strong> stock market<br />
Source: DATASTREAM<br />
Although it has re-rated to 14.3x we don’t see <strong>the</strong> JCI<br />
market being overheated. JCI’s per<strong>for</strong>mance to date is in<br />
line with past years per<strong>for</strong>mance and flows to Indonesia<br />
weren’t any larger. Notably this year we see a lot of capital<br />
raising to absorb <strong>the</strong> demand, both domestic and <strong>for</strong>eign,<br />
which should bode well <strong>for</strong> <strong>the</strong> longer sustainability of <strong>the</strong><br />
<strong>rally</strong>.<br />
With <strong>the</strong> index now trading at 14.8x 12-month <strong>for</strong>ward P/E<br />
we expect consolidation in <strong>the</strong> market be<strong>for</strong>e <strong>the</strong> next leg<br />
up. Accordingly our conservative approach to valuations of<br />
14x P/E (no re-rating) and 20% growth could bring <strong>the</strong> JCI<br />
to 4125 by <strong>the</strong> end of 2011, which represents only 10% rise<br />
from current levels.<br />
9<br />
We believe that ASEAN markets will continue to outper<strong>for</strong>m<br />
<strong>the</strong> Asia ex-Japan benchmark led by many investment<br />
initiatives, strong domestic demand and a low interest rate<br />
environment. A diversified portfolio can be achieved<br />
through investing in CIMB ASEAN40 ETF listed in Singapore.<br />
Hong Kong / China to continue to outper<strong>for</strong>m<br />
China and China related H-share index outper<strong>for</strong>med <strong>the</strong><br />
regional index by 3-9% and <strong>the</strong> 2823 HK now trades at a<br />
premium of 8% to its NAV.<br />
We continue to see that China A- share should benefit<br />
directly from RMB revaluation. China related ETFs continue<br />
to draw interest, with a combined turnover of US$360mil a<br />
day among those listed in Hong Kong and Singapore.<br />
The A-share ETF traded at a premium to NAV, reflecting<br />
strong demand <strong>for</strong> A-shares amid limited supply. The Hang<br />
Seng Index A-H premium index has rebounded from <strong>the</strong> low<br />
since we highlighted it in our last report, but it’s still about<br />
20% from <strong>the</strong> high, suggesting that A-shares still look<br />
attractive.<br />
Meanwhile <strong>the</strong> index heavyweights like <strong>the</strong> Banks and Oil<br />
companies have been lagging in terms of per<strong>for</strong>mance. We<br />
expect easing concerns on policy uncertainty and firming oil<br />
prices to benefit <strong>the</strong>se two sectors; and an influx of <strong>liquidity</strong><br />
to benefit <strong>the</strong> big caps.<br />
Page 12
Regional ETF Focus<br />
<strong>Get</strong> <strong>set</strong> <strong>for</strong> a <strong>liquidity</strong> <strong>rally</strong><br />
Fig. 8: Singapore listed ETF<br />
ETF Ticker Mkt Cap Style Country/ Underlying Ask Bid NAV/ Premium/ Avg Daily Avg Daily<br />
(US$ m) Region Index Price Price INAV Discount Volume Value (US$m)<br />
Tracker 15-Oct 15-Oct (latest) (20 day) (20 day)<br />
EQUITIES<br />
Global / Regional Funds - Ex Asia<br />
Lyxor World WLD SP Equity 25 Global Fund Global MXWO 1.22 1.23 1.23 -0.2% 6,233 0.007<br />
DBXT MSCI World XMWO SP Equity 5 Global Fund Global NDDUWI 2.93 2.94 2.96 -0.9% 16,716 0.049<br />
DBXT DJ Stoxx Gl Dvd XGSD SP Equity 423 Global Fund Global SDGP 26.86 26.86 27.64 -2.8% 636 0.017<br />
DBXT MSCI Europe XMEU SP Equity 1120 Region Fund Europe NDDUE15 44.75 44.75 45.64 -2.0% 1,470 0.064<br />
Lyxor MSCI Europe MEU SP Equity 6 Region Fund Europe MXEU 12.95 13.03 12.98 0.0% 3,040 0.038<br />
DBXT DJ Euro Stoxx XESX SP Equity 2669 Region Fund Europe SX5E 41.59 41.59 40.77 2.0% 802 0.033<br />
Lyxor Emerg.Markets LEM SP Equity 66 Region Fund Emerg. Mkt MXEF 11.27 11.32 11.26 0.3% 8,392 0.089<br />
DBXT Emerg. Mkts XMEM SP Equity 6 Region Fund Emerg. Mkt NDUEEGF 4.23 4.12 4.20 -0.6% 574 0.002<br />
Lyxor Eastern Europe CEC SP Equity 12 Region Fund East Europe CECEEUR 5.92 5.94 5.95 -0.3% 11,975 0.066<br />
Lyxor Latin America LTM SP Equity 25 Region Fund Latin America MXLA 9.21 9.21 9.22 -0.1% 11,720 0.102<br />
Country Funds - OECD<br />
Lyxor NASDAQ-100 NDX SP Equity 27 Growth US NDX 8.27 8.29 8.22 0.7% 400 0.003<br />
DBXT S&P Short XSPS SP Equity 233 Contrarian US SPXTS 48.84 48.84 48.74 0.2% 3,662 0.184<br />
Lyxor DJIA DJI SP Equity 7 Country Fund US INDU 11.12 11.14 11.12 0.1% 1,866 0.020<br />
DBXT MSCI USA XMUS SP Equity N/A Country Fund US NDDLUS 26.68 26.75 27.69 -3.5% - N/A<br />
DBXT S&P 500 K6K SP Equity N/A Country Fund US SPTR500N 18.47 18.47 18.42 0.3% 1,650 0.030<br />
Lyxor Japan JPN SP Equity 24 Country Fund Japan TPX 1.03 1.03 1.03 0.2% 32,725 0.034<br />
DBXT MSCI Japan LF2 SP Equity 389 Country Fund Japan NDDUJN 37.53 37.81 37.60 0.2% 3,000 0.111<br />
DBXT S&P/ ASX 200 LF1 SP Equity 151 Country Fund Australia ASA51 33.12 33.36 33.23 0.0% 6,055 0.194<br />
Country Funds - Emerging (Non-Asia)<br />
DBXT MSCI Brazil XMBR SP Equity 9 Country Fund Brazil NDUEBRAF 7.49 7.62 7.43 1.7% 2,952 0.021<br />
Lyxor Russia RUS SP Equity 33 Country Fund Russia RU10D 4.02 4.04 4.05 -0.5% 15,009 0.059<br />
DBXT Russia Capped XMRC SP Equity 8 Country Fund Russia MXRUC25P 3.10 3.11 3.10 0.1% 4,063 0.012<br />
Regional Funds - Asia x Japan<br />
CIMBFTASEAN40 ASEAN SP Equity 209 Region Fund ASEAN ASEAN40 10.24 10.28 10.26 0.0% 12,130 0.123<br />
Lyxor APEX50 APEX SP Equity 13 Region Fund Asia ex-Jap MXAPEXA 4.19 4.22 4.21 -0.1% 12,690 0.051<br />
Lyxor Asia AEJ SP Equity 139 Region Fund Asia Pac ex-Jap MXAPJ 4.71 4.72 4.71 0.1% 470,922 2.108<br />
DBXT MS Asia X-JP XAXJ SP Equity 508 Region Fund Asia ex-Jap NDUECAXJ 32.73 32.96 32.91 -0.2% 402 0.000<br />
DBXT MSCI EM Asia XMAS SP Equity 7 Region Fund Asia Pac ex-Jap NDUEEGFA 3.87 3.83 3.82 0.7% 1,155 0.004<br />
DBXT MSCI Pacific ex Japan XPXJ SP Equity N/A Region Fund Pac ex-Jap NDDUPXJ N/A N/A 4.35 N/A - N/A<br />
Country Funds - North Asia<br />
Lyxor China H ASI SP Equity 80 Country Fund China HSCEI 17.52 17.68 17.61 -0.1% 14,451 0.234<br />
DBXT FTChina25 XX25 SP Equity 377 Country Fund China TXINOU 33.44 33.44 33.65 -0.6% 9,283 0.302<br />
United SSE 50 China S$ USSE50 SP Equity 104 Country Fund China SSE50 2.23 2.24 2.00 11.9% 386,320 0.532<br />
DBXT CSI300 Index XCSI SP Equity 37 Country Fund China SHSZ300 10.88 11.16 9.77 12.8% 116,015 1.155<br />
DBXT MSCI China LG9 SP Equity 6 Country Fund China NDEUCHF 13.23 13.34 13.30 -0.1% 8,650 0.109<br />
Lyxor HangSeng HSI SP Equity 26 Country Fund Hong Kong HSI 3.07 3.09 3.08 0.0% 10,773 0.032<br />
Lyxor Korea KRW SP Equity 66 Country Fund South Korea MXKR 4.76 4.79 4.78 -0.1% 54,066 0.245<br />
DBXT MSCI Korea XMKO SP Equity 247 Country Fund South Korea MXKR 53.73 54.05 54.00 -0.2% 8,397 0.428<br />
DBXT MSTaiwan XMTW SP Equity 160 Country Fund Taiwan NDEUSTW 17.36 17.48 17.47 -0.3% 15,347 0.265<br />
Lyxor Taiwan TWN SP Equity 62 Country Fund Taiwan TAMSCI 0.97 0.97 0.98 -1.0% 87,010 0.084<br />
Country Funds - South Asia<br />
IS MSCI INDIA INDIA SP Equity 1038 Country Fund India MXIN 8.35 8.37 8.35 0.1% 554,305 4.503<br />
Lyxor MS India INR SP Equity 303 Country Fund India MXIN 18.63 18.63 18.51 0.6% 863 0.016<br />
DBXT MSCI India LG8 SP Equity 4 Country Fund India NDEUSIA 11.63 11.68 11.77 -1.0% 17,386 0.198<br />
DBXT Nifty XNIF SP Equity 534 Country Fund India NIFTY 140.81 141.67 141.43 -0.1% 4,508 0.627<br />
Lyxor India Nifty S$ LNFU SP Equity 46 Country Fund India NIFTY 18.06 18.30 18.01 0.9% 1,813 0.022<br />
Country Funds - South East Asia<br />
Streetracks STI ETF S$ STTF SP Equity 153 Country Fund Singapore FSSTI 3.25 3.26 3.27 -0.5% 193,400 0.424<br />
<strong>DBS</strong> STI ETF S$ <strong>DBS</strong>STI SP Equity 32 Country Fund Singapore FSSTI 3.23 3.25 3.22 0.5% 48,840 0.106<br />
Lyxor Malaysia MAL SP Equity 31 Country Fund Malaysia MXMY 8.96 9.04 8.96 0.4% 108,764 0.946<br />
DBXT MSCI Malaysia LG6 SP Equity 4 Country Fund Malaysia NDDUMAF 12.23 12.32 12.32 -0.4% 3,905 0.047<br />
DBXT MSCI Thailand LG7 SP Equity 25 Country Fund Thailand NDEUTHF 15.76 15.86 15.84 -0.2% 28,493 0.429<br />
DBXT MSCI Indonesia XMIN SP Equity 96 Country Fund Indonesia NDEUINF 14.46 14.60 14.41 0.8% 202,166 2.900<br />
DBXT FTSE Vietnam XFVT SP Equity 248 Country Fund Vietnam FVTTE 37.37 37.37 36.64 2.0% 30,746 1.128<br />
FIXED INCOME<br />
ABF SG BOND S$ SBIF SP Equity 227 Total Return Singapore N/A 1.16 1.17 1.14 1.8% 30,400 0.025<br />
DBXT USD My Mkt XUSD SP Equity N/A Money Market US DBMMFED1 N/A N/A 170.88 N/A - N/A<br />
DBXT Infl Lkd Treasuries XUIT SP Equity N/A Sovereign US DBLNUSD 245.50 245.50 246.75 -0.5% 1,331 0.316<br />
DBXT iBoxx Treasuries XUTD SP Equity 28 Sovereign US ITRROV 192.96 192.96 191.95 0.5% 3 0.000<br />
DBXT SG Mny Mkt S$ XSGO SP Equity N/A Money Market Singapore DBMMSGDO N/A N/A 107.75 N/A - N/A<br />
DBXT iBoxx Korea KT2 SP Equity 30 Total Return South Korea ABUTKOGO 125.00 125.00 125.69 -0.5% 2,047 0.270<br />
DBXT AU Mny Mkt A$ KV5 SP Equity 22 Money Market Australia DBMMAUDO 188.37 188.37 189.07 -0.4% - N/A<br />
DBXT AU Mny Mkt US$ KV6 SP Equity 7 Money Market Australia DBMMAUDO 182.71 182.71 188.44 -3.0% 8 0.001<br />
DBXT AU Mny Mkt S$ KV7 SP Equity 7 Money Market Australia DBMMAUDO 242.60 242.60 243.83 -0.5% 357 0.060<br />
DBXT iBoxx SG Govt S$ KV4 SP Equity 29 Sovereign Singapore ABTRSGGO 122.91 122.91 120.46 2.0% 1,805 0.151<br />
DBXT DBLCI-OY Balanced J0S SP Equity N/AAs<strong>set</strong> Allocation Australia DBLCBUTN 36.77 36.95 30.32 N/A - N/A<br />
DBXT AU Bonds K6Y SP Equity 34 Debt Australia DBLNSSAB 154.83 154.83 152.48 1.5% 154 0.019<br />
COMMODITIES<br />
SPDR Gold Trust GLD SP Equity 33713 Commodities Global GOLDLNPM 134.76 134.87 134.62 0.1% 34,618 4.510<br />
Lyxor CRB Non Energy CRN SP Equity 30 Commodities Global CRYNETR 2.77 2.78 2.77 0.2% 3,747 0.010<br />
Lyxor Commodity CRB SP Equity 108 Commodities Global CRYTR 2.90 2.91 2.90 0.2% 22,358 0.062<br />
DBXT DJUBS Comm Index L5F SP Equity 5 Commodities Global DBCMDCTU 34.07 34.24 33.67 1.5% 60 0.002<br />
DBXT Light Energy L5G SP Equity 5 Commodities Global DBCMBUTN 20.48 20.59 20.00 2.7% 90<br />
Source: Bloomberg. Price and NAV in USD unless indicated o<strong>the</strong>rwise in ETF column<br />
0.002<br />
Page 13
Regional ETF Focus<br />
<strong>Get</strong> <strong>set</strong> <strong>for</strong> a <strong>liquidity</strong> <strong>rally</strong><br />
Fig. 9: Hong Kong listed ETFs<br />
ETF Ticker Mkt Cap Style Country/ Underlying Ask Bid NAV/ Premium/ Avg Daily Avg Daily<br />
(US$ m) Region Index Price Price INAV Discount Volume Value<br />
Tracker 15-Oct 15-Oct (latest) (20 day)<br />
('000)<br />
(20 day)<br />
(US$m)<br />
EQUITIES<br />
Global / Regional Funds - Ex Asia<br />
Lyxor World 2812 HK Equity 25.2 Global Fund Global MXWO 9.55 9.49 9.54 -0.2% 14 0.017<br />
DBXT MSCI World 3019 HK Equity 5.5 Global Fund Global NDDUWI 23.25 23.10 22.97 0.9% 0 0.000<br />
Lyxor Emerging Mkts 2820 HK Equity 65.7 Emerg. Mkt Int'l MXEF 88.00 87.25 87.94 -0.4% 2 0.022<br />
DBXT Emerging Mkts 3009 HK Equity 6.5 Emerg. Mkt Int'l NDUEEGF 33.05 32.90 32.61 1.1% 0 0.002<br />
Country Funds - OECD<br />
Lyxor NASDAQ-100 2826 HK Equity 26.9 Geographically<br />
Focused Fund US NDX 64.50 64.10 64.21 0.1% 1 0.006<br />
Lyxor RAFI Europe 2806 HK Equity 12.8 Growth & Inc. EZ FREU 49.85 49.60 49.65 0.2% 7 0.043<br />
Lyxor RAFI US 2803 HK Equity 12.6 Growth & Inc. US FR10 41.50 40.70 40.93 0.4% 6 0.033<br />
DBXT USA 3020 HK Equity 1810.9 Country Fund US NDDLUS 216.40 215.80 214.85 0.6% 0 0.001<br />
Lyxor Japan Topix 2814 HK Equity 23.7 Country Fund Japan TPX 8.02 7.98 7.99 0.1% 114 0.116<br />
Country Funds - Emerging (Non-Asia)<br />
DBXT MSCI Brazil 3048 HK Equity 8.8 Country Fund Brazil NDUEBRAF 58.80 58.55 57.64 1.8% 15 0.112<br />
Lyxor Russia 2831 HK Equity 32.3 Country Fund Russia RU10D 31.80 31.10 31.58 -0.4% 47 0.185<br />
DBXT MSCI Russia 3027 HK Equity 8.2 Country Fund Russia MXRUC25P 24.20 24.05 24.08 0.2% 2 0.007<br />
Regional Funds - Asia x Japan<br />
iShares APEX50 3010 HK Equity 47.9 Region Fund APAC ex-J MXAPEXA 38.95 38.70 38.84 0.0% 6 0.030<br />
iShares APEX Mid Cap 3032 HK Equity 23.5 Region Fund APAC ex-J MXAPEXAM 45.75 45.50 45.60 0.1% 4 0.023<br />
iShares APEX Small Cap 3004 HK Equity 14.7 Region Fund APAC ex-J MXAPEXAS 47.60 47.35 47.50 -0.1% 3 0.016<br />
Lyxor MSCI Asia ex-Japan 2815 HK Equity 139.4 Country Fund APAC ex-J MXAPJ 36.80 36.65 36.70 0.1% 162 0.755<br />
iShares Emerging Asia 2802 HK Equity 31.7 Emerg. Mkt Asia MXMS 43.90 43.85 43.55 0.7% 22 0.118<br />
DBXT Emerging Mkts Asia 3035 HK Equity 6.7 Region Fund Asia NDUEEGFA 30.30 30.15 29.68 1.8% 1 0.003<br />
DBXT Pacific ex Japan 3043 HK Equity 47.1 Region Fund Pac x Jap NDDUPXJ 33.95 33.80 33.78 0.3% 0 0.002<br />
Country Funds - North Asia<br />
Hang Seng H-Share IDX 2828 HK Equity 2908.1 Growth Fund China HSCEI 137.30 137.20 137.36 -0.1% 1,839 21.061<br />
Hang Seng FTChina 25 2838 HK Equity 36.2 Country Fund China XIN0I 205.40 204.20 205.09 -0.1% 2 0.035<br />
iShares A50 China Tracker 2823 HK Equity 8622.7 Country Fund China XIN50 14.24 14.22 13.19 7.9% 115,759 192.483<br />
iShares MSCI China 2801 HK Equity 185.4 Country Fund China MXCN 23.60 23.50 23.62 -0.3% 194 0.550<br />
WISE CSI 300 China 2827 HK Equity 912.7 Country Fund China SHSZ300 37.40 37.25 33.58 11.1% 2,182 9.840<br />
WISE SSE 50 China 3024 HK Equity 68.0 Country Fund China SSE50 23.50 23.40 21.11 11.1% 51 0.136<br />
DBXT FT Xin China 25 3007 HK Equity 377.2 Country Fund China TXINOU 261.60 259.80 261.20 -0.2% 0 0.013<br />
VALUE CHINA ETF 3046 HK Equity 51.3 Country Fund China GPVP002 42.50 42.15 42.55 -0.5% 134 0.676<br />
ISHARES CSI 300 INDEX 2846 HK Equity 203.4 Country Fund China CSIR0300 32.15 32.05 31.02 3.5% 768 2.957<br />
CICC-SZSE 100 INDEX TRACKE 3051 HK Equity 23.9 Country Fund China SI100 43.75 43.60 40.13 8.8% 1 0.003<br />
DBXT CSI 300 Index 3049 HK Equity 299.2 Country Fund China SHSZ300 8.63 8.62 7.83 10.2% 42,756 42.891<br />
Paragon CSI RAFI 50 2818 HK Equity 34.8 Country Fund China SH000925 34.05 33.75 29.61 14.5% 12 0.046<br />
SPDR FTSE Greater China ETF 3073 HK Equity 71.7 Country Fund China GPSSG239 26.65 26.40 24.94 6.4% 24 0.081<br />
Lyxor MSCI Korea 2813 HK Equity 66.1 Country Fund S. Korea MXKR 37.10 36.85 37.08 -0.3% 62 0.282<br />
DBXT MSCI Korea 2848 HK Equity 247.7 Country Fund S. Korea MXKR 419.60 418.40 418.93 0.0% 0 0.017<br />
Lyxor MSCI Taiwan 2837 HK Equity 62.6 Country Fund Taiwan TAMSCI 7.54 7.51 7.60 -1.0% 160 0.153<br />
DBXT MSCI Taiwan 3036 HK Equity 161.6 Country Fund Taiwan NDEUSTW 136.00 135.20 135.52 0.1% 1 0.010<br />
POLARIS TAIWAN TOP50 3002 HK Equity 25.9 Country Fund Taiwan TW50 12.20 12.18 12.43 -1.9% 40 0.062<br />
Hang Seng Index ETF 2833 HK Equity 3820.2 Growth Fund HK HSI 241.20 240.80 240.97 0.0% 89 0.853<br />
WISE CSI HK Tracker 2825 HK Equity 20.8 Growth Fund HK CSIHHK 20.45 20.15 20.36 -0.3% 1 0.004<br />
Tracker Fund of HK 2800 HK Equity 6452.7 Growth Fund HK HSI 24.35 24.30 24.33 0.0% 18,137 54.448<br />
Country Funds - South Asia<br />
iShares Sensex Tracker 2836 HK Equity 289.9 Country Fund India SENSEX 20.45 20.30 20.25 0.6% 1,234 3.126<br />
Lyxor MSCI India 2810 HK Equity 301.0 Country Fund India MXIN 145.30 144.70 143.54 1.0% 6 0.106<br />
DBXT S&P CNX Nifty 3015 HK Equity 534.7 Country Fund India NIFTY 1100.00 1095.00 1097.47 0.0% 0 0.068<br />
Country Funds - South East Asia<br />
DBXT FTSE Vietnam 3087 HK Equity 248.0 Country Fund Vietnam FVTTE 290.60 289.80 284.55 2.0% 30 1.124<br />
FIXED INCOME<br />
ABF HK Bond Index Fund 2819 HK Equity 306.1 Total Return N/A N/A 104.00 103.00 103.47 0.0% 3 0.037<br />
ABFPan-Asia Bd Idx Fd US$ 2821 HK Equity 2370.8 Total Return N/A ABTRPAUH 124.95 124.10 124.25 0.2% 4 0.552<br />
DB X-TRACKERS USD MONEY M3011 HK Equity 49.7 Global Fund N/A DBMMFED1 170.90 170.80 170.88 0.0% - N/A<br />
COMMODITIES<br />
Lyxor Commodity CRB 2809 HK Equity 107.1 Commodities Global CRYTR 22.60 22.45 22.51 0.1% 56 0.155<br />
SPDR Gold Trust 2840 HK Equity 57310.6 Commodities Global GOLDLNPM 1046.00 1045.00 1044.76 0.1% 21 2.744<br />
Source: Bloomberg. Price and NAV in HKD unless indicated o<strong>the</strong>rwise in ETF column<br />
Page 14
Regional ETF Focus<br />
<strong>Get</strong> <strong>set</strong> <strong>for</strong> a <strong>liquidity</strong> <strong>rally</strong><br />
Fig. 9 cont’d: Hong Kong listed ETFs<br />
ETF Ticker Mkt Cap Style Country/ Underlying Ask Bid NAV/ Premium/ Avg Daily Avg Daily<br />
(US$ m) Region Index Price Price INAV Discount Volume Value<br />
Tracker 15-Oct 15-Oct (latest) (20 day)<br />
('000)<br />
(20 day)<br />
(US$m)<br />
Sector Funds<br />
C-TRACKS Bldg/ Constr. 10800 HK Equity 0.1 Sector Funds China TWSECON N/A N/A 3.25 N/A - N/A<br />
C-TRACKS Hang Seng ChinaH 10828 HK Equity N/A Sector Funds China H-FIN N/A N/A 17.45 N/A - N/A<br />
C-TRACKS Hang Seng Property 10829 HK Equity N/A Sector Funds China HSP N/A N/A 2.86 N/A - N/A<br />
C-TRACKS S&P Financials 10816 HK Equity N/A Sector Funds China SP5TFINL N/A N/A 2.85 N/A - N/A<br />
C-TRACKS TAIEX Electronics 10801 HK Equity 0.0 Sector Funds Taiwan TWSEELEC N/A N/A 3.39 N/A - N/A<br />
C-TRACKS TAIEX Finance 10802 HK Equity 0.1 Sector Funds Taiwan TWSEBKI 9.64 9.50 8.85 0.08 - N/A<br />
iShares CSI Materials 3039 HK Equity 102.1 Sector Funds China CSIR0909 17.64 17.56 16.54 6.4% 211 0.410<br />
iShares CSI Financials 2829 HK Equity 164.8 Sector Funds China CSIR0914 13.90 13.88 12.71 9.3% 391 0.635<br />
iShares CSI Infra Index 3006 HK Equity 42.7 Sector Funds China CSIR0950 14.42 14.38 13.31 8.2% 15 0.026<br />
iShares CSI Energy 3050 HK Equity 67.8 Sector Funds China CSIR0908 15.06 15.02 14.05 7.0% 157 0.257<br />
DBXT CSI300 Banks 3061 HK Equity 45.5 Sector Funds China SH000951 10.90 10.88 9.80 11.1% 4,533 5.483<br />
DBXT CSI300 Real Estate 2816 HK Equity 44.5 Sector Funds China SH000952 11.30 11.28 10.26 10.0% 3,837 4.842<br />
DBXT CSI300 Materials 3062 HK Equity 55.6 Sector Funds China SH000909 9.29 9.28 8.36 11.1% 2,860 2.835<br />
DBXT CSI300 Consumer 3025 HK Equity 47.3 Sector Funds China SH000911 10.84 10.82 9.79 10.6% 1,718 2.248<br />
DBXT CSI300 Health Care 3057 HK Equity 28.2 Sector Funds China SH000913 15.52 15.50 14.00 10.8% 1,947 3.970<br />
DBXT CSI300 Transportation 3063 HK Equity 17.2 Sector Funds China N/A 4.48 4.46 4.10 9.0% 2,214 1.132<br />
DBXT CSI300 Energy 3017 HK Equity 27.0 Sector Funds China SH000908 10.08 10.04 9.17 9.7% 3,138 3.375<br />
DBXT CSI300 Utilities 3052 HK Equity 18.3 Sector Funds China SH000917 4.94 4.93 4.48 10.2% 1,692 0.978<br />
DBXT CSI300 Industrials 3005 HK Equity 20.8 Sector Funds China SH000910 7.33 7.32 6.66 10.0% 1,597 1.337<br />
DBXT CSI300 Financials 2844 HK Equity 33.9 Sector Funds China SH000914 11.46 11.44 10.34 10.7% 4,028 5.023<br />
DCI CSI China Consumer 3071 HK Equity 24.5 Sector Funds China SH000942 11.90 11.60 11.07 6.1% 69 0.103<br />
iShares CSI Cons Disc 3001 HK Equity 79.5 Sector Funds China SH000911 20.90 20.75 19.15 8.7% 82 0.208<br />
iShares CSI Cons Staples 2841 HK Equity 82.2 Sector Funds China SH000912 21.25 21.15 19.01 11.5% 103 0.282<br />
Source: Bloomberg. Price and NAV in HKD unless indicated o<strong>the</strong>rwise in ETF column<br />
Page 15
Regional ETF Focus<br />
<strong>Get</strong> <strong>set</strong> <strong>for</strong> a <strong>liquidity</strong> <strong>rally</strong><br />
Singapore – Neutral (Joanne Goh, Group Research compilation)<br />
More upside <strong>for</strong> STI despite 3Q GDP moderation<br />
Fig. 10: Straits Times Index (daily)<br />
Singapore’s 3Q GDP advanced released this Thursday<br />
confirmed a sequential drop in GDP closed to 20% QoQ<br />
saar. Volatility in <strong>the</strong> pharmaceutical sector is <strong>the</strong> major<br />
contributing factor.<br />
We believe investors should take <strong>the</strong> 3Q moderation, and<br />
even a possible “technical recession” in strides as <strong>the</strong><br />
slowdown was widely anticipated after a very strong 1H.<br />
Being <strong>the</strong> strongest growth region in <strong>the</strong> world coupled<br />
with a appreciating currency bias, it should continue to<br />
attract fund flows to drive a re-rating. Meanwhile STI is a<br />
laggard in Asia and has room to ‘catch up’.<br />
Straits Times Index Technical Outlook (Yeo Kee Yan,<br />
<strong>DBS</strong><strong>Vickers</strong>)<br />
We raise STI’s technical objective to 3438. While near-term<br />
resistance remains at 3250, we see minor pullback<br />
supported at <strong>the</strong> 15-day exponential moving average<br />
(currently at 3124) and <strong>the</strong> index should eventually surpass<br />
3250.<br />
We believe <strong>the</strong> <strong>rally</strong> that started from 2900 in end August is<br />
sustainable because: 1) The rise has been accompanied by<br />
healthy market participation from small caps and large caps<br />
2) The rise is accompanied by a rise in volume and value of<br />
shares traded 3) Our economist sees more <strong>liquidity</strong> inflow<br />
into Asia sustaining in <strong>the</strong> months ahead<br />
The rise above <strong>the</strong> 3030 level to make a fresh YTD high<br />
looks ‘impulsive’. Impulse has its implications: 1) The rise is<br />
sustainable 2) Technical oscillators such as <strong>the</strong> 14-day RSI<br />
and <strong>the</strong> daily stochastics can stay around <strong>the</strong> overbought<br />
line <strong>for</strong> weeks or even months. The 14-day RSI currently<br />
reads 66while <strong>the</strong> stochastics is at 69. 3) We can apply<br />
major technical projections to identify upside objective <strong>for</strong><br />
<strong>the</strong> STI.<br />
The chart below shows our preferred wave count. By<br />
projecting <strong>the</strong> amplitude of wave 1 (395pts) above <strong>the</strong> high<br />
of wave 1 (@ STI 3043), we attain a technical objective of<br />
3438. We reference <strong>the</strong> near-term support at <strong>the</strong> 15-day<br />
EMA that has held intact since <strong>the</strong> start pf September. It is<br />
currently at 3124. Major support is at <strong>the</strong> 65-day EMA,<br />
currently near 3030.<br />
Source: <strong>DBS</strong> Research<br />
19% drop in 3Q GDP (Irvin Seah, <strong>DBS</strong> Group Research)<br />
Third quarter advance GDP estimates are within expectation<br />
as <strong>the</strong> economy grew by 10.3% YoY (<strong>DBS</strong>f: 10.4%;<br />
Consensus: 10.8%). But on a sequential basis, <strong>the</strong> economy<br />
contracted sharply by 19.8% QoQ saar (<strong>DBS</strong>f: 17.0%;<br />
Consensus: 15.7%) as an upward revision in 2Q10 GDP<br />
fur<strong>the</strong>r amplify <strong>the</strong> quarterly drop (see table).<br />
Singapore GDP growth<br />
3Q09 4Q09 2009 1Q10 2Q10 3Q10(a)<br />
Overall GDP (%QoQ saar) 11.1 -1.0 - 45.9 27.3 -19.8<br />
Overall GDP (%YoY) 1.8 3.8 -1.3 16.9 19.6 10.3<br />
Manufacturing 7.6 2.2 -4.1 38.1 46.1 12.1<br />
Construction 11.7 11.5 16.2 9.7 11.5 6.7<br />
Services producing -1.1 3.7 -1.4 11.4 11.8 10.2<br />
And as we had mentioned in our earlier article “It’s<br />
payback time” dated 11 Oct10, this is a record sequential<br />
contraction and one that is worse than <strong>the</strong> supposedly<br />
“free-fall” in GDP experienced in <strong>the</strong> recent US financial<br />
crisis, <strong>the</strong> slump during <strong>the</strong> dot.com bust as well as <strong>the</strong><br />
doldrum during <strong>the</strong> Asia financial crisis. Indeed, growth<br />
wouldn’t have fallen by more dramatic fashion than this<br />
considering that we had a record expansion not too long<br />
ago in <strong>the</strong> first quarter. Sharp pullbacks in production from<br />
<strong>the</strong> volatile pharmaceutical segment have brought down<br />
overall industrial production in recent months. And <strong>the</strong><br />
exceptionally high comparison base in 1H10 fur<strong>the</strong>r<br />
amplifies <strong>the</strong> drop.<br />
Page 16
Regional ETF Focus<br />
<strong>Get</strong> <strong>set</strong> <strong>for</strong> a <strong>liquidity</strong> <strong>rally</strong><br />
The worst ever sequential contraction<br />
% QoQ saar<br />
50<br />
40<br />
1Q10: 45.9%<br />
normalization process that is currently underway in Asia will<br />
soon be manifested in Singapore’s economic growth<br />
numbers, except with some doses of volatilities coming from<br />
<strong>the</strong> pharmaceutical industry from time to time. Our full year<br />
GDP growth remains at 15%.<br />
30<br />
GDP growth (%QoQ saar)<br />
Sing NEER policy band steepened and widened<br />
20<br />
10<br />
0<br />
-10<br />
-20<br />
-30<br />
Mfg recession, 85/86<br />
Asian<br />
financial crisis,<br />
Dot.com bust, 2001<br />
US financial crisis, 2008<br />
3Q10 (a): -19.8%<br />
Jun-75 Jun-80 Jun-85 Jun-90 Jun-95 Jun-00 Jun-05 Jun-10<br />
But isolating <strong>the</strong>se volatilities, Singapore’s underlying<br />
growth momentum is slowing and much in line with <strong>the</strong><br />
normalization process in Asia with <strong>the</strong> V-shaped recovery<br />
turning into a square root shape. And more than ever<br />
be<strong>for</strong>e, <strong>the</strong> prospect of <strong>the</strong> Singapore economy is more<br />
closely tied to Asia than anywhere in <strong>the</strong> world. Hence, this<br />
The Monetary Authority of Singapore (MAS) surprised <strong>the</strong><br />
market yet again after <strong>the</strong> “double-barrel” move in April.<br />
This time, <strong>the</strong> MAS has steepened <strong>the</strong> slope of <strong>the</strong> Sing<br />
NEER policy band as well as widened <strong>the</strong> width of <strong>the</strong> band.<br />
While it could reflect <strong>the</strong> general optimism in terms of<br />
growth outlook by <strong>the</strong> authority, it is also a pre-emptive<br />
move to address inflationary concern ahead. That is, <strong>the</strong><br />
focus is on inflation in <strong>the</strong> coming months as external<br />
inflationary pressure is expected to pick up on higher<br />
commodity prices. Moreover, with <strong>the</strong> prospect of ano<strong>the</strong>r<br />
quantitative easing move by <strong>the</strong> US Fed, inflows will be<br />
strong and upward pressure on <strong>the</strong> SGD will be even<br />
greater. The widening of <strong>the</strong> band will in some ways cater<br />
to an anticipated greater volatility in <strong>the</strong> FX market going<br />
<strong>for</strong>ward. We have recently revised our SGD <strong>for</strong>ecast to<br />
reflects fur<strong>the</strong>r appreciation of <strong>the</strong> currency (see “SGD<br />
higher, with or without tightening” dated 7 Oct10).<br />
Fig. 16: Singapore and Hong Kong listed ETFs exposed to <strong>the</strong> Singapore market<br />
ETF Ticker Mkt Cap Style Country/ Underlying Bid NAV/ Premium/ Avg Daily Avg Daily<br />
(US$ m) Region Index Price INAV Discount Volume Value (US$m)<br />
Tracker 15-Oct (latest) (20 day) (20 day)<br />
Singapore listed ETFs<br />
Streetracks STI ETF S$ STTF SP Equity 140 Country Fund Singapore FSSTI 3.03 3.03 -0.5% 160,150 0.329<br />
<strong>DBS</strong> STI ETF S$ <strong>DBS</strong>STI SP Equity 29 Country Fund Singapore FSSTI 3.02 3.02 -0.3% 22,215 0.045<br />
Source: Bloomberg. Notes: HK-listed ETFs - Vol in ‘000s, Price and NAV are in HKD unless o<strong>the</strong>rwise stated. SG-listed ETFs – Actual vol<br />
traded, Price and NAV are in US$ unless o<strong>the</strong>rwise indicated<br />
.<br />
Page 17
Regional ETF Focus<br />
<strong>Get</strong> <strong>set</strong> <strong>for</strong> a <strong>liquidity</strong> <strong>rally</strong><br />
Hong Kong / China (Overweight) (Joanne Goh, joannegohsc@dbs.com)<br />
Near term outlook<br />
The Chinese A-share market recovered from its low of 2477<br />
to 2827 currently. We remain hopeful that <strong>the</strong> market has<br />
passed its worst in terms of policy actions.<br />
With inflation risks returning we believe that market will be<br />
fixated on interest rates. China's 2Q GDP came in at 10.3%<br />
YoY compared to 11.9% in 1Q. GDP in 1H10 grew by<br />
11.1%. 3Q GDP is expected to be 9.5% The numbers<br />
suggest that policies should remain status quo <strong>for</strong> now as<br />
<strong>the</strong> economy returns to a more sustainable path. It won't be<br />
necessary to introduce more fiscal stimulus measures or ease<br />
<strong>the</strong> current monetary policy stance.<br />
We believe that <strong>the</strong> tightening measures in China will be an<br />
on-going process but <strong>the</strong> impact will gradually fade. The<br />
rumoured RRR hike (which was temporary <strong>for</strong> two months<br />
and restricted to six banks) , if true, also signals that more<br />
tightening may be <strong>for</strong>thcoming. Indeed China raised rates<br />
on 19 Oct as one of <strong>the</strong> first steps to stem inflationary<br />
expectations. As complications arise from currency,<br />
domestic demand, social and political pressure we believe<br />
China will tread carefully along <strong>the</strong> tightening path.<br />
Investors are gene<strong>rally</strong> less enthusiastic on <strong>the</strong> Chinese<br />
market on two major concerns - <strong>the</strong> banking and <strong>the</strong><br />
property sectors because of <strong>the</strong> exceptional loan growth last<br />
year. While this year's loan growth has normalized, <strong>the</strong><br />
lingering effect especially on loan quality and capital raising<br />
requirements still haunt. We believe uncertainties will<br />
remain, as <strong>the</strong>re are doubts on <strong>the</strong> data quality emerging<br />
out of <strong>the</strong>se two sectors. In our view <strong>the</strong> promising demand<br />
outlook in China and low valuations justify investors'<br />
position in <strong>the</strong> banking sector.<br />
However <strong>the</strong> China property sector should go through a<br />
longer adjustment process as supply situation, sticky<br />
housing prices, austerity measures, corporates' balance<br />
sheet should continue to weigh on this sector.<br />
We prefer direct beneficiaries of domestic demand like<br />
retail, food and beverage, and industries, which<br />
manufacture <strong>for</strong> China's domestic demand. Companies that<br />
are strong in <strong>the</strong> inner cities should have stronger growths<br />
going <strong>for</strong>ward as economic activities began to shift inwards.<br />
High wage pressures from <strong>the</strong> coastal regions and <strong>the</strong> near<br />
completion of <strong>the</strong> railway transportation should justify <strong>the</strong><br />
economic sense.<br />
The property and <strong>the</strong> banking sector in Hong Kong<br />
meanwhile has a lot to cheer about. Despite <strong>the</strong> austerity<br />
measures delivered by <strong>the</strong> government, property prices<br />
continue to rise. We believe this is because of <strong>the</strong> recent<br />
auctions of “prized” parcels of land in <strong>the</strong> Kowloon area,<br />
which has never been available <strong>for</strong> a long time. Moreover<br />
with abundant <strong>liquidity</strong> from Hong Kong and China as a<br />
result of lower interest rates and cheaper HKD, we continue<br />
to see as<strong>set</strong> price rise in Hong Kong.<br />
The unemployment picture is also looking better. Hong<br />
Kong is perceived as <strong>the</strong> “gateway” to China where<br />
demand growth is strong. Moreover, Hong Kong is <strong>the</strong> only<br />
place in <strong>the</strong> world where onshore CNY can be exchanged<br />
into USD currently. We expect more overseas companies<br />
from all sectors to <strong>set</strong> up offices in Hong Kong, hence<br />
improving <strong>the</strong> employment outlook. (For details, please see<br />
“HK: Hovering at an inflection point”, Chris Leung, 4Q<br />
Economics-Markets-Strategy, 10 Sep 2010).<br />
Meanwhile valuation <strong>for</strong> <strong>the</strong> HSI has risen to 13.3x, but still<br />
below historical average of 14.4x. H-shares trade at 13.5x<br />
above <strong>the</strong> historical mean.<br />
Fig. 22: HSI 12-month <strong>for</strong>ward PER<br />
21<br />
19<br />
17<br />
15<br />
13<br />
11<br />
9<br />
7<br />
5<br />
(x)<br />
02 02 03 03 04 04 05 05 06 06 07 07 08 08 09 09 10 10<br />
Source: Datastream, IBES<br />
'<br />
Page 18
Regional ETF Focus<br />
<strong>Get</strong> <strong>set</strong> <strong>for</strong> a <strong>liquidity</strong> <strong>rally</strong><br />
Fig. 23: China A/H premium index<br />
220<br />
200<br />
180<br />
160<br />
140<br />
fears stoked a sell-off in commodities and emerging<br />
markets. MSCI Asia ex-Japan retraced 25% from its high to<br />
a low in 2004. In <strong>the</strong> scale of things a 25% correction <strong>for</strong> a<br />
market, which had run up 100% is par <strong>for</strong> <strong>the</strong> course. The<br />
upside risk was RMB revaluation which would stoke a <strong>rally</strong><br />
in Asia equities. After <strong>the</strong> correction in 2004, Asian equities<br />
recovered once <strong>the</strong> hard landing fears faded, and as RMB<br />
revaluation speculation powered a strong multi-year <strong>rally</strong>.<br />
120<br />
100<br />
80<br />
2006 2007 2008 2009 2010<br />
Source: Datastream<br />
Back to 2004<br />
Source: DATASTREAM<br />
The A-H premium has also narrowed to historical low,<br />
indicative of value in Chinese A shares. With <strong>the</strong> Chinese 'A'<br />
share index having corrected 18% YTD (lowest at 28%), we<br />
believe <strong>the</strong>re is value in <strong>the</strong> Chinese market.<br />
Fig. 24: HSI per<strong>for</strong>mance<br />
000's<br />
35<br />
30<br />
25<br />
20<br />
15<br />
10<br />
5<br />
(1)<br />
(2)<br />
(3)<br />
(4)<br />
(5)<br />
2003 2004 2005 2006 2007 2008 2009 2010<br />
Source: Datastream<br />
(1)<br />
(2)<br />
(3)<br />
(4)<br />
(5)<br />
Source: DATASTREAM<br />
It is worth noting that next year marks <strong>the</strong> beginning of <strong>the</strong><br />
12th year plan where policy guidelines will be delivered in<br />
4Q10. In view of <strong>the</strong> turbulent past 5 years in <strong>the</strong> global<br />
markets, we expect more directions to address <strong>the</strong> volatility<br />
and measures to protect China’s interest amid <strong>the</strong> volatility.<br />
Whe<strong>the</strong>r HSI will per<strong>for</strong>m like it does during 2005 - 2007<br />
remains to be seen. But <strong>the</strong> Shanghai ‘A’ index surged five<br />
folds in 2006-7, during <strong>the</strong> first two years of <strong>the</strong> 5-year plan.<br />
Conspiracy <strong>the</strong>ory is suggesting that <strong>liquidity</strong> from <strong>the</strong><br />
property will be channelled to <strong>the</strong> stock market, now that<br />
<strong>the</strong> government is tightening its grip on <strong>the</strong> sector.<br />
Drivers:<br />
• We do not hold to a hard-landing scenario <strong>for</strong> China.<br />
Beyond <strong>the</strong> volatility this quarter, we believe China should<br />
be in a good position to showcase its resilience in <strong>the</strong> face<br />
of global uncertainty, considering its strong fiscal muscle<br />
and flexibility in monetary policies.<br />
• The earlier than expected completion of <strong>the</strong> railway<br />
transportation system will expand China's growth into <strong>the</strong><br />
second and third tier cities, thus relieving overheating<br />
pressures on <strong>the</strong> coastal cities and ensuring <strong>the</strong><br />
sustainability of growth.<br />
• Rising wages and policies to build a safety net with<br />
healthcare, education and insurance sectors should<br />
continue to support domestic demand growth.<br />
The current scenario resembles 2004 -<strong>the</strong> year after Asia's<br />
recession from <strong>the</strong> Tech bubble and SARS. China was poised<br />
to raise rates after <strong>the</strong> aggressive easing to support <strong>the</strong><br />
anaemic economic growth. At <strong>the</strong> same time global<br />
economic data was rolling over, and China's hard landing<br />
Risks:<br />
• Rising inflation continues to be a threat with calls <strong>for</strong><br />
policy tightening.<br />
• Uncertainty of <strong>the</strong> impact from property measures raise<br />
risks of deterioration in corporate balance sheets.<br />
Page 19
Regional ETF Focus<br />
<strong>Get</strong> <strong>set</strong> <strong>for</strong> a <strong>liquidity</strong> <strong>rally</strong><br />
Fig. 16: Singapore and Hong Kong listed ETFs exposed to <strong>the</strong> Hong Kong / China market (Hong Kong listed stocks)<br />
ETF Ticker Mkt Cap Style Country/ Underlying Bid NAV/ Premium/ Avg Daily Avg Daily<br />
(US$ m) Region Index Price INAV Discount Volume Value<br />
Tracker 15-Oct (latest) (20 day)<br />
('000)<br />
(20 day)<br />
(US$m)<br />
Hong Kong listed ETFs<br />
Hang Seng H-Share IDX 2828 HK Equity 2908.1 Growth Fund China HSCEI 137.20 137.36 -0.1% 1,839 21.061<br />
Hang Seng FTChina 25 2838 HK Equity 36.2 Country Fund China XIN0I 204.20 205.09 -0.1% 2 0.035<br />
iShares MSCI China 2801 HK Equity 185.4 Country Fund China MXCN 23.50 23.62 -0.3% 194 0.550<br />
DBXT FT Xin China 25 3007 HK Equity 377.2 Country Fund China TXINOU 259.80 261.20 -0.2% 0 0.013<br />
VALUE CHINA ETF 3046 HK Equity 51.3 Country Fund China GPVP002 42.15 42.55 -0.5% 134 0.676<br />
Hang Seng Index ETF 2833 HK Equity 3820.2 Growth Fund HK HSI 240.80 240.97 0.0% 89 0.853<br />
WISE CSI HK Tracker 2825 HK Equity 20.8 Growth Fund HK CSIHHK 20.15 20.36 -0.3% 1 0.004<br />
Tracker Fund of HK 2800 HK Equity 6452.7 Growth Fund HK HSI 24.30 24.33 0.0% 18,137 54.448<br />
C-TRACKS Hang Seng ChinaH 10828 HK Equity N/A Sector Funds China H-FIN N/A 17.45 N/A - N/A<br />
C-TRACKS Hang Seng Property 10829 HK Equity N/A Sector Funds China HSP N/A 2.86 N/A - N/A<br />
Singapore listed ETFs<br />
Lyxor China H ASI SP Equity 80 Country Fund China HSCEI 17.68 17.61 -0.1% 14,451 0.234<br />
DBXT FTChina25 XX25 SP Equity 377 Country Fund China TXINOU 33.44 33.65 -0.6% 9,283 0.302<br />
DBXT MSCI China LG9 SP Equity 6 Country Fund China NDEUCHF 13.34 13.30 -0.1% 8,650 0.109<br />
Lyxor HangSeng HSI SP Equity 26 Country Fund Hong Kong HSI 3.09 3.08 0.0% 10,773 0.032<br />
Source: Bloomberg. Notes: HK-listed ETFs - Vol in ‘000s, Price and NAV are in HKD unless o<strong>the</strong>rwise stated. SG-listed ETFs – Actual vol traded, Price<br />
and NAV are in US$ unless o<strong>the</strong>rwise indicated.<br />
Fig. 17: Singapore and Hong Kong listed ETFs exposed to <strong>the</strong> China ‘A’ share market<br />
ETF Ticker Mkt Cap Style Country/ Underlying Bid NAV/ Premium/ Avg Daily Avg Daily<br />
(US$ m) Region Index Price INAV Discount Volume Value<br />
Tracker 15-Oct (latest) (20 day)<br />
('000)<br />
(20 day)<br />
(US$m)<br />
Hong Kong listed ETFs<br />
iShares A50 China Tracker 2823 HK Equity 8622.7 Country Fund China XIN50 14.22 13.19 7.9% 115,759 192.483<br />
WISE CSI 300 China 2827 HK Equity 912.7 Country Fund China SHSZ300 37.25 33.58 11.1% 2,182 9.840<br />
WISE SSE 50 China 3024 HK Equity 68.0 Country Fund China SSE50 23.40 21.11 11.1% 51 0.136<br />
ISHARES CSI 300 INDEX 2846 HK Equity 203.4 Country Fund China CSIR0300 32.05 31.02 3.5% 768 2.957<br />
CICC-SZSE 100 INDEX TRACKE 3051 HK Equity 23.9 Country Fund China SI100 43.60 40.13 8.8% 1 0.003<br />
DBXT CSI 300 Index 3049 HK Equity 299.2 Country Fund China SHSZ300 8.62 7.83 10.2% 42,756 42.891<br />
Paragon CSI RAFI 50 2818 HK Equity 34.8 Country Fund China SH000925 33.75 29.61 14.5% 12 0.046<br />
iShares CSI Materials 3039 HK Equity 102.1 Sector Funds China CSIR0909 17.56 16.54 6.4% 211 0.410<br />
iShares CSI Financials 2829 HK Equity 164.8 Sector Funds China CSIR0914 13.88 12.71 9.3% 391 0.635<br />
iShares CSI Infra Index 3006 HK Equity 42.7 Sector Funds China CSIR0950 14.38 13.31 8.2% 15 0.026<br />
iShares CSI Energy 3050 HK Equity 67.8 Sector Funds China CSIR0908 15.02 14.05 7.0% 157 0.257<br />
DBXT CSI300 Banks 3061 HK Equity 45.5 Sector Funds China SH000951 10.88 9.80 11.1% 4,533 5.483<br />
DBXT CSI300 Real Estate 2816 HK Equity 44.5 Sector Funds China SH000952 11.28 10.26 10.0% 3,837 4.842<br />
DBXT CSI300 Materials 3062 HK Equity 55.6 Sector Funds China SH000909 9.28 8.36 11.1% 2,860 2.835<br />
DBXT CSI300 Consumer 3025 HK Equity 47.3 Sector Funds China SH000911 10.82 9.79 10.6% 1,718 2.248<br />
DBXT CSI300 Health Care 3057 HK Equity 28.2 Sector Funds China SH000913 15.50 14.00 10.8% 1,947 3.970<br />
DBXT CSI300 Transportation 3063 HK Equity 17.2 Sector Funds China N/A 4.46 4.10 9.0% 2,214 1.132<br />
DBXT CSI300 Energy 3017 HK Equity 27.0 Sector Funds China SH000908 10.04 9.17 9.7% 3,138 3.375<br />
DBXT CSI300 Utilities 3052 HK Equity 18.3 Sector Funds China SH000917 4.93 4.48 10.2% 1,692 0.978<br />
DBXT CSI300 Industrials 3005 HK Equity 20.8 Sector Funds China SH000910 7.32 6.66 10.0% 1,597 1.337<br />
DBXT CSI300 Financials 2844 HK Equity 33.9 Sector Funds China SH000914 11.44 10.34 10.7% 4,028 5.023<br />
DCI CSI China Consumer 3071 HK Equity 24.5 Sector Funds China SH000942 11.60 11.07 6.1% 69 0.103<br />
iShares CSI Cons Disc 3001 HK Equity 79.5 Sector Funds China SH000911 20.75 19.15 8.7% 82 0.208<br />
iShares CSI Cons Staples 2841 HK Equity 82.2 Sector Funds China SH000912 21.15 19.01 11.5% 103 0.282<br />
Singapore listed ETFs<br />
United SSE 50 China S$ USSE50 SP Equity 104 Country Fund China SSE50 2.24 2.00 11.9% 386,320 0.532<br />
DBXT CSI300 Index XCSI SP Equity 37 Country Fund China SHSZ300 11.16 9.77 12.8% 116,015 1.155<br />
Source: Bloomberg. Notes: HK-listed ETFs - Vol in ‘000s, Price and NAV are in HKD unless o<strong>the</strong>rwise stated. SG-listed ETFs – Actual vol traded, Price<br />
and NAV are in US$ unless o<strong>the</strong>rwise indicated.<br />
Page 20
Regional ETF Focus<br />
<strong>Get</strong> <strong>set</strong> <strong>for</strong> a <strong>liquidity</strong> <strong>rally</strong><br />
China outlook (David Carbon, davidcarbon@dbs.com, extracted from report name “<strong>the</strong> kink in <strong>the</strong> curve"<br />
- Economics-Markets-Strategy, 11 Sep 2010)<br />
China is <strong>the</strong> risk but <strong>the</strong> chance of a significant<br />
slowdown is remote<br />
Risks to <strong>the</strong> outlook continue to revolve increasingly around<br />
China, not <strong>the</strong> US and/or <strong>the</strong> G3. That 18% growth in<br />
consumption since 3Q08 translates into $177bn of new<br />
consumption and China is responsible <strong>for</strong> nearly two-thirds<br />
of it. In o<strong>the</strong>r words, China has put $115bn of new<br />
consumer demand on <strong>the</strong> table since 3Q08 compared to a<br />
mere $7bn contribution from <strong>the</strong> US. If <strong>the</strong> risks aren’t<br />
apparent, ask yourself: if you took those contributions to<br />
growth / recovery away, which would hurt more<br />
Incremental consumption growth since 3Q08<br />
USD bn, 3Q08 - 2Q10, seas adj<br />
200<br />
177<br />
175<br />
150<br />
125<br />
100<br />
75<br />
50<br />
22<br />
25<br />
7 6 -20<br />
0<br />
-25<br />
Asia-10 Asia-10 USA Japan EU-16<br />
(ex-CH,<br />
IN, ID)<br />
The good news is, despite <strong>the</strong> recent concerns about a<br />
slowdown in China, demand growth <strong>the</strong>re remains very<br />
strong and <strong>the</strong> risk of fur<strong>the</strong>r slowing seems remote. Take<br />
consumption demand, <strong>for</strong> example, as proxied by retail sales.<br />
Growth today is as fast or faster than it’s been in a decade<br />
in real and / or nominal terms. And it’s accelerating, not<br />
decelerating.<br />
China – retail sales growth<br />
% YoY, 3mma, real sales deflated by CPI<br />
30<br />
25<br />
20<br />
15<br />
10<br />
5<br />
0<br />
98 99 00 01 02 03 04 05 06 07 08 09 10<br />
Fixed as<strong>set</strong> investment It continues to grow at a trend<br />
pace of 26% (chart below), only a point below <strong>the</strong> 27%<br />
rate averaged since 2004 – a rate that everyone used to say<br />
China – fixed as<strong>set</strong> investment<br />
CNY bn / mth, seas adj<br />
2,200<br />
2,000<br />
1,800<br />
1,600<br />
1,400<br />
was “too fast”. h<br />
1,200<br />
The 4Q08 "shock"<br />
drop that brought<br />
<strong>the</strong><br />
government's 1H09<br />
1H09 surge<br />
ends in Aug09<br />
Jan/Feb10:<br />
back on trend<br />
Nominal<br />
1,000<br />
Jan-08 Jul-08 Jan-09 Jul-09 Jan-10 Jul-10<br />
And loan growth Supposedly <strong>the</strong> government has put <strong>the</strong><br />
clamps on – but <strong>the</strong> data say o<strong>the</strong>rwise. Total loan growth<br />
is running at an 18% saar pace (charts at top of next page),<br />
which is indeed lower than <strong>the</strong> 41% saar pace run in 1H09<br />
when everyone was worried about <strong>the</strong> global financial crisis.<br />
But today’s 18% growth rate is still higher than <strong>the</strong> 17%<br />
pace averaged during <strong>the</strong> heydays of 2005-2007 when GDP<br />
was growing 12% - 13% per year.<br />
Real<br />
Jan-Jul growth<br />
runs at 26%<br />
(saar)<br />
And that’s not <strong>the</strong> half of it. With <strong>the</strong> focus now on<br />
building infrastructure, growth in medium- and long-term<br />
loans has not slowed at all – it has accelerated significantly<br />
to a 47% saar pace from <strong>the</strong> 42% pace run in 2009 (chart<br />
top right of next page). That’s more than twice <strong>the</strong> pace<br />
that prevailed during <strong>the</strong> go-go years when GDP growth ran<br />
at 12%-13%.<br />
Page 21
Regional ETF Focus<br />
<strong>Get</strong> <strong>set</strong> <strong>for</strong> a <strong>liquidity</strong> <strong>rally</strong><br />
China Financial institution loans (total)<br />
China Financial institution loans (med & long term)<br />
CNY trn outstanding, seas adj<br />
CNY trn outstanding, sa, med- and long-term<br />
46<br />
18% rate<br />
30<br />
47%<br />
42<br />
Jul10<br />
25<br />
Jul10<br />
38<br />
34<br />
41% rate<br />
Jun09<br />
20<br />
42%<br />
Dec09<br />
30<br />
26<br />
17% rate<br />
Nov08<br />
15<br />
21%<br />
Nov08<br />
22<br />
Jan-07 Jan-08 Jan-09 Jan-10<br />
10<br />
Jan-07 Jan-08 Jan-09 Jan-10<br />
The bottom line is that with this sort of demand growth –<br />
consumption, investment and loans – it is very hard to be<br />
bearish about <strong>the</strong> growth outlook in China or Asia more<br />
gene<strong>rally</strong>. GDP or <strong>the</strong> PMIs can slip <strong>for</strong> a quarter or two<br />
because <strong>the</strong>y are supply-side measures and lots of things<br />
can temporarily interrupt supply. But at <strong>the</strong> end of <strong>the</strong> day,<br />
supply follows demand like a 4-year old follows his mo<strong>the</strong>r.<br />
So long as demand continues to grow as steadily and as<br />
strongly as it appears to be doing, supply / GDP will never<br />
be more than a step or two behind.<br />
Sources:<br />
Data <strong>for</strong> all charts and tables are CEIC and Bloomberg<br />
Page 22
Regional ETF Focus<br />
<strong>Get</strong> <strong>set</strong> <strong>for</strong> a <strong>liquidity</strong> <strong>rally</strong><br />
Chinese yuan (Philip Wee, philipwee@dbs.com, extracted from “Pause first” – Economics Markets<br />
Strategy, 11 Sept 2020)<br />
Moving towards a more flexibility basket<br />
Look <strong>for</strong> <strong>the</strong> Chinese yuan issue to be politicized again into<br />
a culmination of major events in November. Apart from <strong>the</strong><br />
US mid-term elections, <strong>the</strong> G20 summit and <strong>the</strong> IMF fiveyear<br />
review are all scheduled to be held in November. The<br />
US Treasury is also due to release its semiannual Currency<br />
Report in mid-October.<br />
The push on <strong>the</strong> yuan is likely to focus more on carrots than<br />
on sticks this time. To encourage China to fulfil its role as a<br />
responsible major economy, especially now that it has<br />
overtaken Japan as <strong>the</strong> world’s second largest economy.<br />
China’s voting rights in <strong>the</strong> IMF is likely to be increased to<br />
reflect its economic clout. The yuan is, however, unlikely to<br />
be included in <strong>the</strong> Special Drawing Right because <strong>the</strong><br />
exchange rate is still not market-determined and fully<br />
convertible on <strong>the</strong> capital account. The US Treasury may<br />
delay its Currency Report, like it did with <strong>the</strong> previous report,<br />
with pressures from US lawmakers to name China a<br />
currency manipulator. The US may, but to a lesser extent,<br />
<strong>rally</strong> o<strong>the</strong>r emerging countries to pressure China <strong>for</strong> more<br />
yuan gains. We don’t discount China responding with more<br />
flexibility via a wider trading band <strong>for</strong> USD/CNY.<br />
China introduced more yuan flexibility on June 19, one<br />
week be<strong>for</strong>e <strong>the</strong> G20 summit. A “basically stable” yuan<br />
policy was adopted from July 2008 during <strong>the</strong> US-led global<br />
credit crisis into <strong>the</strong> EU sovereign debt crisis this year. Since<br />
PBOC: CNY appreciation pace linked to CA surplus<br />
8<br />
7<br />
6<br />
5<br />
4<br />
3<br />
2<br />
1<br />
0<br />
-1<br />
Current account<br />
% of GDP<br />
CNY vs USD<br />
% YoY<br />
02 03 04 05 06 07 08 09 10<br />
<strong>the</strong> start of <strong>the</strong> year into June 18, USD/CNY traded within a<br />
narrow 0.04% band between 6.8229 and 6.8259. The<br />
currency pair fell to <strong>the</strong> year’s lowest level at 6.7670 on<br />
August 9, achieving only 0.9% gains <strong>for</strong> <strong>the</strong> yuan vs <strong>the</strong><br />
greenback. Since <strong>the</strong>n, USD/CNY has traded back above<br />
6.80, making good <strong>the</strong> government’s pledge to move<br />
towards a two-way exchange rate market.<br />
The People Bank’s of China (PBOC) took on a more visible<br />
role in <strong>set</strong>ting some “ground rules” <strong>for</strong> managing <strong>the</strong><br />
exchange rate. The current account was highlighted as <strong>the</strong><br />
most important factor in determining <strong>the</strong> appropriate<br />
exchange rate (see chart below). A more flexible exchange<br />
rate was also considered as helpful in combating inflation.<br />
Also notable was <strong>the</strong> desire to shift <strong>the</strong> reference of <strong>the</strong><br />
yuan from simply <strong>the</strong> dollar towards a basket of currencies.<br />
Looking beyond <strong>the</strong> current (fourth) quarter, China is likely<br />
to let <strong>the</strong> yuan appreciate more in 2011. The decision to<br />
allow a more flexible yuan probably coincided with <strong>the</strong> full<br />
recovery in exports to pre-crisis levels, which in turn,<br />
augmented prospects <strong>for</strong> <strong>the</strong> trade surplus to widen again.<br />
Ano<strong>the</strong>r notable trend was <strong>the</strong> continued rise in China’s<br />
inflation amidst disinflation in <strong>the</strong> US. We also expect <strong>the</strong> US<br />
dollar to depreciate next year when recovery hopes displace<br />
slowdown worries in <strong>the</strong> global economy. Hence, we remain<br />
com<strong>for</strong>table in our call <strong>for</strong> <strong>the</strong> yuan to appreciate by 3% in<br />
2011.<br />
Trade surplus rising again on export recovery<br />
1600<br />
1400<br />
1200<br />
1000<br />
800<br />
600<br />
400<br />
200<br />
0<br />
USD bn,<br />
12mth rolling sum<br />
Imports<br />
(lhs)<br />
Exports<br />
(lhs)<br />
Trade balance<br />
(rhs)<br />
02 03 04 05 06 07 08 09 10<br />
600<br />
500<br />
400<br />
300<br />
200<br />
100<br />
0<br />
Sources:<br />
Sources <strong>for</strong> all charts and tables are Bloomberg . Forecasts are <strong>DBS</strong> Group Research.<br />
Page 23
Regional ETF Focus<br />
<strong>Get</strong> <strong>set</strong> <strong>for</strong> a <strong>liquidity</strong> <strong>rally</strong><br />
India (Underweight) (Joanne Goh, joannegohsc@dbs.com)<br />
Near term outlook<br />
We are less negative on India compared to <strong>the</strong> last quarter.<br />
Growth seems to be losing steam but we believe it is<br />
normalizing after <strong>the</strong> scorching pace in <strong>the</strong> previous quarter,<br />
notwithstanding <strong>the</strong> higher inflation and rates hikes that<br />
could also possibly dampen demand.<br />
The re<strong>for</strong>m agenda supports a longer-term positive outlook.<br />
It is also enough to support <strong>the</strong> 8% GDP growth target as<br />
well as alleviating <strong>the</strong> high budget deficit and inflation<br />
concerns in <strong>the</strong> near term.<br />
While strong nominal GDP growth could be positive <strong>for</strong><br />
earnings growth in India, we are cognizant of higher<br />
operating costs eating into profits especially after recent fuel<br />
and wage hikes. Inflation at its extreme may also snap<br />
consumer demand and hurt top line growth, in our view.<br />
Valuation in India is expensive and earnings expectations<br />
barely changed throughout <strong>the</strong> year. We suspect Sensex will<br />
continue to rise and thus valuations as well as risk <strong>for</strong> <strong>the</strong><br />
market.<br />
We maintain Underweight on India on valuation grounds.<br />
Drivers:<br />
• The economy is primarily driven by domestic<br />
consumption. Long term infrastructure development and<br />
<strong>the</strong> need to improve living conditions (reduce slum areas,<br />
improve education and reduce poverty) imply long-term<br />
potential growth of 7.5%. The growth rate may be<br />
understated considering <strong>the</strong> huge population and <strong>the</strong><br />
government's recent re<strong>for</strong>m ef<strong>for</strong>ts.<br />
• Post re-election of <strong>the</strong> ruling UPA government last year,<br />
<strong>the</strong> government is expected to step up its re<strong>for</strong>m ef<strong>for</strong>ts<br />
and better quality growth can be achieved.<br />
• We believe growth can surprise on <strong>the</strong> upside following<br />
<strong>the</strong> 2010/11 budget, which is thought to be wellbalanced.<br />
Government <strong>for</strong>ecasts 9% growth this year<br />
and double-digit growth rates in <strong>the</strong> coming years.<br />
• Relaxation in FDI rules and capital flows should encourage<br />
more investor flows into India. Stock market re<strong>for</strong>ms like<br />
privatization and increase in <strong>for</strong>eign ownership will<br />
improve market efficiency.<br />
• A strong domestic savers' pool contributes to <strong>the</strong> longterm<br />
growth potential of <strong>the</strong> market.<br />
Risks:<br />
• India valuations trade towards <strong>the</strong> higher end of <strong>the</strong><br />
range and do not provide enough cushion should risk<br />
aversion persists. The market is more volatile than most<br />
Asian markets.<br />
• Supply constraints as a result of under-investment will<br />
continue to challenge <strong>the</strong> inflation outlook in our view.<br />
Fig. 18: Singapore and Hong Kong listed ETFs exposed to <strong>the</strong> India market<br />
ETF Ticker Mkt Cap Style Country/ Underlying Bid NAV/ Premium/ Avg Daily Avg Daily<br />
(US$ m) Region Index Price INAV Discount Volume Value (US$m)<br />
Tracker 15-Oct (latest) (20 day) (20 day)<br />
Singapore listed ETFs<br />
IS MSCI INDIA INDIA SP Equity 1038 Country Fund India MXIN 8.37 8.35 0.1% 554,305 4.503<br />
Lyxor MS India INR SP Equity 303 Country Fund India MXIN 18.63 18.51 0.6% 863 0.016<br />
DBXT MSCI India LG8 SP Equity 4 Country Fund India NDEUSIA 11.68 11.77 -1.0% 17,386 0.198<br />
DBXT Nifty XNIF SP Equity 534 Country Fund India NIFTY 141.67 141.43 -0.1% 4,508 0.627<br />
Lyxor India Nifty S$ LNFU SP Equity 46 Country Fund India NIFTY 18.30 18.01 0.9% 1,813 0.022<br />
Hong Kong listed ETFs<br />
iShares Sensex Tracker 2836 HK Equity 289.9 Country Fund India SENSEX 20.30 20.25 0.6% 1,234 3.126<br />
Lyxor MSCI India 2810 HK Equity 301.0 Country Fund India MXIN 144.70 143.54 1.0% 6 0.106<br />
DBXT S&P CNX Nifty 3015 HK Equity 534.7 Country Fund India NIFTY 1095.00 1097.47 0.0% 0 0.068<br />
Source: Bloomberg. Notes: HK-listed ETFs - Vol in ‘000s, Price and NAV are in HKD unless o<strong>the</strong>rwise stated. SG-listed ETFs – Actual vol traded, Price<br />
and NAV are in US$ unless o<strong>the</strong>rwise indicated.<br />
Page 24
Regional ETF Focus<br />
<strong>Get</strong> <strong>set</strong> <strong>for</strong> a <strong>liquidity</strong> <strong>rally</strong><br />
India : Overheating or slowing (Ramya Suryanarayanan, ramya@dbs.com, extracted from same<br />
name report)<br />
• The sharp slowdown in June industrial production<br />
growth (in YoY terms) has led to worries about an<br />
imminent slowdown. Only a few months ago, <strong>the</strong><br />
sharp rise in <strong>the</strong> same rate led to worries about<br />
overheating<br />
• The economy nei<strong>the</strong>r went through a phase of<br />
overheating nor slowing, ra<strong>the</strong>r a temporary surge in<br />
demand (owing to pent-up factors such as recovery<br />
from <strong>the</strong> post-Lehman shock) and is now seeing a<br />
phase of normalization that may well include an<br />
“undershoot”<br />
• We continue to <strong>for</strong>ecast 8.8% growth in FY10/11,<br />
slightly above-consensus. We also expect <strong>the</strong> central<br />
bank to continue with rate hikes until at least Mar11.<br />
We <strong>for</strong>ecast ano<strong>the</strong>r 75bps of rate hikes in <strong>the</strong> repo<br />
rate and ano<strong>the</strong>r 100bps of hike in <strong>the</strong> reverse repo<br />
rate by Mar11<br />
• There has been some progress on <strong>the</strong> re<strong>for</strong>m front,<br />
notably on oil pricing and a reduction in government<br />
stakes in public sector companies. We expect progress<br />
on tax re<strong>for</strong>m, land re<strong>for</strong>m and fur<strong>the</strong>r liberalization of<br />
FDI to support investment and growth<br />
Summary<br />
If worries about <strong>the</strong> evolution of <strong>the</strong> European debt crisis<br />
was <strong>the</strong> dominant concern in <strong>the</strong> markets in <strong>the</strong> Apr-Jun<br />
quarter, presently, worries about a double-dip recession in<br />
US and China are <strong>the</strong> risk factors keeping markets edgy. Our<br />
take in <strong>the</strong> Apr-Jun quarter was that a slower Europe<br />
(assuming no full-blown financial crisis) by itself would not<br />
derail global growth since Europe follows global growth,<br />
not leads it. Given our view on <strong>the</strong> importance of China to<br />
global and Asian growth, <strong>the</strong> prevailing uncertainties are<br />
more serious. However, we also believe final consumption<br />
(and investment) demand growth in China remains resilient<br />
and will continue to support growth in China. In fact, we<br />
think growth in <strong>the</strong> second half of 2010 in China would be<br />
better than 2Q. US consumer demand, while weaker than<br />
thought earlier, (following significant backward revisions to<br />
<strong>the</strong> past year’s data) is expected to grind higher at a two<br />
percentage annual pace. As such, we think current mixed<br />
global data trends are only a reflection of normalization in<br />
demand and / or temporary weakness in <strong>the</strong> supply<br />
response. Even as uncertainties hounded <strong>the</strong> global<br />
recovery, we upgraded our FY10/11 (Apr-Mar) GDP <strong>for</strong>ecast<br />
<strong>for</strong> India in late July to 8.8% from 8.3%. Available data so<br />
far, including GDP <strong>for</strong> Apr-June quarter which grew by<br />
8.8% (YoY) support our view. While data out of India has<br />
also been more mixed of late, we do not perceive anything<br />
more than a much necessary normalization in <strong>the</strong> economy<br />
(Chart 1 & 2).<br />
Chart 1: GDP contribution by sector<br />
% YoY<br />
11<br />
8<br />
5<br />
2<br />
-1<br />
Jun-05 Jun-06 Jun-07 Jun-08 Jun-09 Jun-10<br />
Services<br />
Construction<br />
GDP<br />
Latest: Apr-Jun10<br />
Industry<br />
Agri<br />
Chart 2: GDP by expenditure – breakdown unreliable<br />
% QoQ saar, 2qma<br />
15<br />
10<br />
5<br />
0<br />
-5<br />
-10<br />
Mar-07 Mar-08 Mar-09 Mar-10<br />
Consumption<br />
Errors<br />
Nei<strong>the</strong>r overheating nor slipping back<br />
Errors too<br />
large<br />
Investment<br />
GDP<br />
Is <strong>the</strong> Indian economy overheating This was <strong>the</strong> worry in<br />
Apr-May as industrial production growth registered 14%<br />
(YoY) and inflation galloped to double digits. Now with<br />
production growth halving to 7% (YoY) in June, <strong>the</strong> worry is<br />
Page 25
Regional ETF Focus<br />
<strong>Get</strong> <strong>set</strong> <strong>for</strong> a <strong>liquidity</strong> <strong>rally</strong><br />
that <strong>the</strong> economy has lost momentum and inflation and rate<br />
hikes are slowing growth. Our take is India was nei<strong>the</strong>r<br />
overheating nor is slowing now. The year-on-year numbers<br />
are misleading and lagging by definition as it cumulates<br />
monthly growth that took place in <strong>the</strong> past twelve months.<br />
In our reading, what has actually transpired is growth<br />
slowed more than fundamentals dictated in Oct08-Jun09<br />
owing to market panic and from Jul09-Mar10 <strong>the</strong> economy,<br />
especially <strong>the</strong> industrial sector, grew at a scorching pace, to<br />
off<strong>set</strong> <strong>the</strong> earlier weakness. In o<strong>the</strong>r words, <strong>the</strong> economy<br />
was not overheating, but only growing at a temporarily<br />
strong pace (Chart 3). To be sure, this did lead to some<br />
temporary price pressures as capacity constraints were<br />
reached, and this, combined with supply-shocks that pushed<br />
food prices higher, fanned concerns of overheating.<br />
Chart 3: Capital goods – nei<strong>the</strong>r overheating nor<br />
slowing . just normalizing<br />
Index 1993/94=100, SA, 3mma<br />
620<br />
...nor<br />
slowing<br />
570<br />
Nei<strong>the</strong>r<br />
520<br />
overheating..<br />
470<br />
420<br />
370<br />
Latest:<br />
320<br />
May 09 Jun10<br />
270<br />
220<br />
Jan-05 Jan-06 Jan-07 Jan-08 Jan-09 Jan-10 Jan-11<br />
In <strong>the</strong> Apr-June quarter, we witnessed a “slowdown” in<br />
production reflecting what we think is a “normalization” in<br />
demand. Since such production adjustments don’t happen<br />
in a straight line – after all businesses operate with<br />
imperfect in<strong>for</strong>mation in an uncertain world, – <strong>the</strong>re is a<br />
good chance that we have also seen some “undershoot”.<br />
There<strong>for</strong>e, in <strong>the</strong> interim, <strong>the</strong> data may paint a picture of an<br />
economy that has run out of steam. All this is most<br />
dramatically illustrated in <strong>the</strong> most cyclical component of<br />
<strong>the</strong> economy — investment demand (Chart 3, above).<br />
Ra<strong>the</strong>r than extrapolate <strong>the</strong> present “slowdown”, we read<br />
<strong>the</strong> recent data as a normalization to trend, and one that<br />
may lead to some volatility in data <strong>for</strong> a quarter or so. In<br />
fact, not all data even point to a normalization in India.<br />
While industrial production <strong>for</strong> June and core production (a<br />
sub-index) <strong>for</strong> July have slowed, manufacturing and services<br />
PMI, as well as o<strong>the</strong>r indicators such as loan growth and<br />
vehicle sales remain very strong (Chart 4 & 5).<br />
How one interprets <strong>the</strong> data is obviously important as one<br />
projects future growth and inflation. We think <strong>the</strong><br />
“undershoot” in some sectors points to a stronger quarterly<br />
pace of growth in <strong>the</strong> current Jul-Sep quarter (in QoQ saar<br />
terms) and <strong>the</strong>n a return to potential growth rates of 8%<br />
(QoQ, saar) following that. We expect rate hikes and<br />
inflation to temper <strong>the</strong> growth momentum but not kill<br />
growth.<br />
Inflation - headline to moderate, core to pick up<br />
We expect core inflation pressures to rise with <strong>the</strong> renewed<br />
growth momentum and this clearly requires a normalization<br />
in policy interest rates. However, <strong>the</strong> current double-digit<br />
headline inflation rates (in YoY terms) clearly overstates <strong>the</strong><br />
pressures as it is distorted by higher food prices and a low<br />
base of comparison. Additionally, faced with a sudden surge<br />
in demand (which was partly due to pent-up <strong>for</strong>ces), supply<br />
could not respond especially when capacity constraints were<br />
reached. All <strong>the</strong>se factors led to upward pressure on prices.<br />
As such, by Mar-11, we expect headline inflation to ease to<br />
under-5% (Chart 6), even as core inflation picks up. The<br />
inflation <strong>for</strong>ecast assumes <strong>the</strong> central bank hikes interest<br />
rates in line with our <strong>for</strong>ecast. We project <strong>the</strong> repo rate at<br />
6.50% by Mar-11. At next week’s policy meeting, we<br />
expect <strong>the</strong> central bank to raise <strong>the</strong> reverse repo rates by<br />
25bps to 4.75% but leave <strong>the</strong> repo rate unchanged at<br />
5.75%.<br />
Renewed push <strong>for</strong> re<strong>for</strong>m to support growth<br />
So what’s holding up demand The firming up of <strong>the</strong> labour<br />
market, resilience in software exports and <strong>the</strong> renewed push<br />
<strong>for</strong> economic re<strong>for</strong>m all help to support domestic demand<br />
growth. The government has already taken some steps on<br />
<strong>the</strong> oil price re<strong>for</strong>m front in late June liberalizing <strong>the</strong> pricing<br />
of petrol, raising <strong>the</strong> price of kerosene and LPG sharply and<br />
promising to free diesel pricing too. Disinvestment and tax<br />
re<strong>for</strong>m are o<strong>the</strong>r policies seeing some progress. This should<br />
support investor sentiment, key to energise investment<br />
spending and support <strong>the</strong> 8% growth rate. We have also<br />
seen improvement in rural infrastructure as well as rural<br />
employment opportunities and safety-nets. These ef<strong>for</strong>ts<br />
and steps help support rural demand and agriculture (even<br />
as it is dwarfed by <strong>the</strong> challenges <strong>the</strong> rural economy and<br />
agriculture sector face).<br />
The re<strong>for</strong>m agenda includes ambitious direct and indirect<br />
tax re<strong>for</strong>m, oil price re<strong>for</strong>m, lifting of FDI limits in sectors<br />
such as insurance, retail, education, divestment of<br />
government stakes in public sector companies, introduction<br />
of new and fair land rehabilitation laws, introduction of<br />
biometric unique identity cards (<strong>the</strong>re is no nationwide<br />
Page 26
Regional ETF Focus<br />
<strong>Get</strong> <strong>set</strong> <strong>for</strong> a <strong>liquidity</strong> <strong>rally</strong><br />
identity card at present) and pursuit of fur<strong>the</strong>r openness and<br />
trade liberalization. While we do not expect <strong>the</strong> government<br />
to deliver on all <strong>the</strong>se fronts in <strong>the</strong> near-term, concrete<br />
progress on even some of <strong>the</strong>se in a multi-year time frame<br />
will go a long way to support consumer and investment<br />
demand. It would be a mistake to doubt <strong>the</strong> sustainability of<br />
India’s growth on <strong>the</strong> basis of <strong>the</strong> progress (or <strong>the</strong> lack<br />
<strong>the</strong>reof) on re<strong>for</strong>m thus far. It is clear to successive<br />
governments that political success depends on delivering<br />
high and inclusive growth. The government will never be<br />
able to do all it has to do to support growth (<strong>the</strong> ruling<br />
coalition is fractured and only enjoys a slim majority) or be<br />
ahead of <strong>the</strong> curve in galvanising growth. But it is more<br />
than keen to ensure GDP growth stays above 8% and<br />
moves fur<strong>the</strong>r up to 9% and above in <strong>the</strong> medium-term.<br />
Risks<br />
One of <strong>the</strong> main risks facing <strong>the</strong> economy arises from <strong>the</strong><br />
higher fiscal deficit and <strong>the</strong> supply-constrained nature of <strong>the</strong><br />
economy (both not unrelated). Despite collecting three<br />
times as much money as <strong>the</strong> targeted INR 300bn in thirdgeneration<br />
telecom auction licences this year, <strong>the</strong><br />
government has said that <strong>the</strong> fiscal deficit would not be<br />
lower than initially planned. The government’s strategy is to<br />
use all money possible on social spending. That is fine if it<br />
were mainly education and health. However, <strong>the</strong><br />
government continues to spend significant amounts on<br />
wasteful and ill-directed subsidies that do not reach <strong>the</strong><br />
targeted recipients (<strong>the</strong> latest addition are planned increase<br />
to food subsidies). There is a legitimate place <strong>for</strong> food<br />
subsidies, and such would also help halt <strong>the</strong> erosion of<br />
political capital (and hence re<strong>for</strong>m momentum) from higher<br />
inflation. However, <strong>the</strong> larger fact is short-term and<br />
demand-side policy management continues to dominate <strong>the</strong><br />
government’s strategy at <strong>the</strong> expense of sustainable supply<br />
side re<strong>for</strong>m (infrastructure, education spending, agriculture<br />
investment). The risk <strong>the</strong>n is not as much slow growth as it<br />
is that inflation (and fiscal deficit) will not be as low as it<br />
could o<strong>the</strong>rwise be.<br />
Sources <strong>for</strong> charts and tables are CEIC, Bloomberg and <strong>DBS</strong> Research (<strong>for</strong>ecasts and data trans<strong>for</strong>mations)<br />
Page 27
Regional ETF Focus<br />
<strong>Get</strong> <strong>set</strong> <strong>for</strong> a <strong>liquidity</strong> <strong>rally</strong><br />
Korea (Overweight) (Joanne Goh, joannegohsc@dbs.com<br />
Near term outlook<br />
The outlook <strong>for</strong> KOSPI is positive given its competitive<br />
valuations and currency. Its domestic economy is poised to<br />
pick up after exceptional corporate profits and continuous<br />
fiscal support from <strong>the</strong> government.<br />
Korea is emerging from <strong>the</strong> European crisis as an<br />
unexpected beneficiary. The cheaper Won and <strong>the</strong> stimulus<br />
programs by <strong>the</strong> government played an important role in<br />
exports recovery last year. The fear of unwinding stimulus<br />
and policy actions created an overhang in <strong>the</strong> market earlier<br />
in <strong>the</strong> year when global recovery ga<strong>the</strong>red pace. With rising<br />
global uncertainties, <strong>the</strong> Korean government continued with<br />
<strong>the</strong> fiscal expansion, including maintaining a cheaper won.<br />
Drivers:<br />
• The Korean market remains largely a macro story on <strong>the</strong><br />
direction of interest rates, exit strategies and Won<br />
direction. Positive surprises can come in <strong>the</strong> <strong>for</strong>m of a<br />
delay in rate hikes, a stable Won, and <strong>the</strong> extension of <strong>the</strong><br />
pro-growth strategies. These look likely now in view of<br />
<strong>the</strong> European crisis raising external risks.<br />
• 3Q financial results are expected to be strong, as <strong>the</strong><br />
Korean won remains fairly stable. The outlook should be<br />
positive given Japanese Yen's strength against Korean<br />
Won.<br />
Risks:<br />
• Stimulus exit strategy can potentially derail growth, which<br />
should o<strong>the</strong>rwise benefit from a synchronized global<br />
upturn. Government stimulus has been higher than most<br />
Asian countries.<br />
• SMEs are always a major concern in Korea as <strong>the</strong><br />
government assistance in this sector is substantial. The<br />
sector holds <strong>the</strong> key to social and economic stability as it<br />
hires a big labour <strong>for</strong>ce and <strong>the</strong> banks are highly<br />
leveraged to this sector. SME re<strong>for</strong>m has been slow and<br />
remains a sensitive issue to banks' NPLs and <strong>the</strong> labour<br />
unions. The Korean discount will be <strong>the</strong>re as long as <strong>the</strong><br />
overhang remains and SMEs re<strong>for</strong>m is delayed.<br />
• Government's intervention in <strong>the</strong> private sector is large<br />
when compared to o<strong>the</strong>r countries. This could be due to<br />
<strong>the</strong> country having been hit hard by several crises in <strong>the</strong><br />
past decade.<br />
• Sentiments are affected by political tensions in <strong>the</strong> North<br />
Korea Peninsular.<br />
• Local investors hold a big portion of Korean equities<br />
through mutual funds and savings scheme. Korea is<br />
considered expensive from a historical perspective.<br />
Redemption pressure will cap market upside when <strong>the</strong><br />
market starts moving up, unless <strong>for</strong>eign investors buy in a<br />
big way.<br />
• Korea valuations are deemed cheap on a regional basis.<br />
Foreign investors will continue to be attracted to <strong>the</strong><br />
cheaper valuations vis-a-vis o<strong>the</strong>r markets.<br />
• Leading indicators <strong>for</strong> <strong>the</strong> Korean economy are turning<br />
southwards. There is a risk that recovery could be stalled.<br />
Fig. 19: Singapore and Hong Kong listed ETFs exposed to South Korea market<br />
ETF Ticker Mkt Cap Style Country/ Underlying Bid NAV/ Premium/ Avg Daily Avg Daily<br />
(US$ m) Region Index Price INAV Discount Volume Value (US$m)<br />
Tracker 15-Oct (latest) (20 day) (20 day)<br />
Singapore listed ETFs<br />
Lyxor Korea KRW SP Equity 66 Country Fund South Korea MXKR 4.79 4.78 -0.1% 54,066 0.245<br />
DBXT MSCI Korea XMKO SP Equity 247 Country Fund South Korea MXKR 54.05 54.00 -0.2% 8,397 0.428<br />
Hong Kong listed ETFs<br />
Lyxor MSCI Korea 2813 HK Equity 66 Country Fund S. Korea MXKR 36.85 37.08 -0.3% 62 0.282<br />
DBXT MSCI Korea 2848 HK Equity 248 Country Fund S. Korea MXKR 418.40 418.93 0.0% 0 0.017<br />
Source: Bloomberg. Notes: HK-listed ETFs - Vol in ‘000s, Price and NAV are in HKD unless o<strong>the</strong>rwise stated. SG-listed ETFs – Actual vol traded, Price<br />
and NAV are in US$ unless o<strong>the</strong>rwise indicated.<br />
Page 28
Regional ETF Focus<br />
<strong>Get</strong> <strong>set</strong> <strong>for</strong> a <strong>liquidity</strong> <strong>rally</strong><br />
Korea : Currency stimulus at work (Ma Tieying, matieying@dbs.com, extracted from same name<br />
report, 11 September 2010)<br />
• Despite widespread expectations <strong>for</strong> slower global<br />
growth, a weak won and a strong yen are helping<br />
Korean exports, hence growth. The current account is<br />
natu<strong>rally</strong> benefiting too<br />
• A weak property market has been a drag on <strong>the</strong><br />
domestic sector. Whilst <strong>the</strong> government eased<br />
regulations on mortgage lending, <strong>the</strong> central bank has<br />
been hiking interest rates. Subpar consumption growth<br />
will continue<br />
Export engine remains intact<br />
Korea’s real GDP growth recorded 6.0% (QoQ saar) in 2Q,<br />
slightly lower than 8.8% in 1Q. Growth was largely driven<br />
by exports (32.1%), facilities investment (41.9%) and<br />
inventory rebuilding. By contrast, private consumption<br />
stayed slightly below <strong>the</strong> long-run growth rate of 4% <strong>for</strong><br />
<strong>the</strong> third consecutive quarter (3.4% in 2Q). And<br />
construction investment fell significantly by -13.7% owing<br />
to <strong>the</strong> sluggishness in <strong>the</strong> residential property market.<br />
Going <strong>for</strong>ward we remain constructive on Korea’s export<br />
outlook, despite widespread market expectations of a<br />
Chart 1: Korean exporters gaining market shares overseas<br />
12<br />
10<br />
8<br />
% in China's imports US EU<br />
9.9 10.1<br />
slowdown in global economic growth. Amid <strong>the</strong> post-crisis<br />
global recovery starting from early-2009, Korea has<br />
demonstrated its export strength relative to <strong>the</strong> regional<br />
competitors especially Japan. Korean exporters have gained<br />
market shares in major overseas markets including <strong>the</strong> US (a<br />
share of 2.5% of US total imports in 2009-1H10, up from<br />
2.3% in 2008), EU (2.7%, up from 2.5%) and also China<br />
(10.1%, up from 9.9%, Chart 1). A weak won is<br />
undoubtedly an important stimulus <strong>for</strong> Korean exports and<br />
this stimulus remains intact in <strong>the</strong> near term, given that <strong>the</strong><br />
won stays almost 20% cheaper than its pre-crisis level of<br />
1000, while <strong>the</strong> yen has recently appreciated to a 15 year<br />
high of 84 (Chart 3). Meanwhile, <strong>the</strong> non-price<br />
competitiveness of Korean exports is also strong thanks to<br />
technology advantages and brand recognition. Note that<br />
during 2004-2007 when <strong>the</strong> won appreciated a cumulative<br />
25% against <strong>the</strong> yen within four years, Korea’s export<br />
volume growth still outper<strong>for</strong>med Japan persistently (Chart<br />
4). Strong technology gains are reflected in growth of labor<br />
productivity. Korea’s manufacturing labor productivity rose<br />
by 9.3% YoY on average during 2004-2007, in sharp<br />
contrast with <strong>the</strong> 2.7% gains in Japan.<br />
Chart 2: Japan losing market shares<br />
16<br />
14<br />
12<br />
10<br />
13.3<br />
% in China's imports US EU<br />
12.5<br />
6<br />
4<br />
2<br />
0<br />
2.3 2.5 2.5 2.7<br />
2008 2009 1H10<br />
8<br />
6<br />
4<br />
2<br />
0<br />
6.6<br />
6.2<br />
4.8 4.5<br />
2008 2009 1H10<br />
Chart 3: The won weakening against <strong>the</strong> yen<br />
16<br />
1500<br />
15<br />
14<br />
13<br />
JPY/KRW (LHS)<br />
USD/KRW (RHS)<br />
1400<br />
1300<br />
12<br />
Latest: Aug10<br />
1200<br />
11<br />
10<br />
1100<br />
9<br />
1000<br />
8<br />
7<br />
900<br />
6<br />
800<br />
Jan-04 Jan-06 Jan-08 Jan-10<br />
Chart 4: Korea’s exports outper<strong>for</strong>med Japan’s even<br />
be<strong>for</strong>e <strong>the</strong> crisis<br />
% YoY, 3mma<br />
50<br />
40<br />
Latest: Jun/Jul10<br />
30<br />
20<br />
10<br />
0<br />
-10<br />
-20<br />
-30<br />
Export volume: KR<br />
-40<br />
JP<br />
-50<br />
Jan-04 Jan-06 Jan-08 Jan-10<br />
Page 29
Regional ETF Focus<br />
<strong>Get</strong> <strong>set</strong> <strong>for</strong> a <strong>liquidity</strong> <strong>rally</strong><br />
On <strong>the</strong> domestic front, <strong>the</strong> drag from <strong>the</strong> property market<br />
weakness is unlikely to fade soon. Since <strong>the</strong> authorities<br />
tightened regulations on financial institutions’ mortgage<br />
lending in 2H09 to preempt <strong>the</strong> risks of property bubbles<br />
and household over-leveraging (via <strong>the</strong> debt-to-income ratio<br />
and loan-to-value ratio), <strong>the</strong> volumes of residential property<br />
transactions have fallen significantly from <strong>the</strong> peak seen in<br />
mid-09 (Chart 5), and housing prices have slipped monthon-month<br />
recently in 3Q10. In end-August <strong>the</strong> government<br />
decided to ease <strong>the</strong> debt-to-income requirement <strong>for</strong> firsttime<br />
homebuyers and owners of one residence. This would<br />
help avoid penalizing genuine homebuyers without relaxing<br />
its guard against property bubbles. The decision of partially<br />
relaxing <strong>the</strong> lending rules also came after <strong>the</strong> central bank’s<br />
rate hike in July, as interest costs <strong>for</strong> household borrowers<br />
are already on <strong>the</strong> rise. The Bank of Korea (BOK) has raised<br />
<strong>the</strong> benchmark 7-day repo rate by 25bps in July from 2.0%<br />
to 2.25%. Although <strong>the</strong> BOK held rate steady in August-<br />
September, it left <strong>the</strong> door open <strong>for</strong> more hikes, as hinted in<br />
<strong>the</strong> latest policy statement on Sep.9. The BOK<br />
acknowledged external risks stemming from US slowdown<br />
and fiscal woes in Europe, but maintained a view that <strong>the</strong><br />
Korean economy will register “solid growth” in <strong>the</strong> coming<br />
months, and inflation will accelerate as “<strong>the</strong> demand-side<br />
pressures increase”. We expect <strong>the</strong> BOK to continue<br />
normalizing interest rates step by step towards a neutral<br />
level of 4-5%. We don’t expect a double-dip recession in<br />
<strong>the</strong> global economy. A slower-than-expected global growth<br />
could slow <strong>the</strong> pace of policy normalization in Korea, but<br />
will unlikely alter <strong>the</strong> direction of higher interest rates. We<br />
project that <strong>the</strong> policy rate will go up to 2.75% by <strong>the</strong> end<br />
of 2010, and 4.0% by <strong>the</strong> end of 2011.<br />
Chart 5 : The property market has cooled<br />
Unit, th<br />
160<br />
140<br />
120<br />
100<br />
80<br />
Apartment<br />
transactions volume<br />
Seoul (RHS)<br />
'<br />
Latest: Jul10<br />
Unit, th<br />
30<br />
25<br />
20<br />
15<br />
Macro stability improving<br />
The macro stability has improved somewhat in Korea. The<br />
current account registered a larger-than-expected surplus of<br />
USD 17.5bn in <strong>the</strong> first seven months of this year (1.8% of<br />
annual GDP), already hitting our whole-year <strong>for</strong>ecast <strong>for</strong> <strong>the</strong><br />
current account balance (Chart 6). Aside from <strong>the</strong> strength<br />
in exports and weakness in <strong>the</strong> won as we elaborated<br />
above, <strong>the</strong> slower-than-expected rises in international oil<br />
prices have also saved costs <strong>for</strong> Korean importers.<br />
Accordingly, we have lifted <strong>for</strong>ecast <strong>for</strong> <strong>the</strong> current account<br />
in 2010, to USD 28bn or 2.9% of nominal GDP.<br />
Meanwhile, <strong>the</strong> government’s fiscal balance is improving<br />
continuously. In <strong>the</strong> first half of this year <strong>the</strong> central<br />
government’s total revenue grew 7.5% YoY, compared to<br />
<strong>the</strong> -4% reduction in expenditures, which left <strong>the</strong><br />
consolidated fiscal balance at a small deficit of KRW 11.4trn,<br />
or 1% of annual GDP. The government well understands<br />
<strong>the</strong> importance of maintaining fiscal disciplines and<br />
protecting fiscal sustainability. Whilst <strong>the</strong> finance ministry<br />
proposed a tax revision plan in August to offer tax incentives<br />
<strong>for</strong> companies to create jobs and support <strong>the</strong> low-income<br />
class, it also removed o<strong>the</strong>r <strong>for</strong>ms of unneeded tax<br />
exemptions. The official projections show that <strong>the</strong> net<br />
impact on overall tax revenue will still be positive, at KRW<br />
1.9trn over <strong>the</strong> next five years.<br />
In addition, <strong>the</strong> upward tendency in <strong>the</strong> country’s gross<br />
external debt has been checked recently in 2Q. External<br />
debt as a percentage of external as<strong>set</strong>s (or <strong>for</strong>eign reserves)<br />
is falling or at least, stabilizing (Chart 7). This is partly owing<br />
to reduced risk appetite in global financial markets amid <strong>the</strong><br />
worsening of European debt crisis in 2Q. The Korean<br />
financial regulator has also intervened in June to tighten FX<br />
regulations (such as capping FX derivatives trading of both<br />
local and <strong>for</strong>eign banks, rein<strong>for</strong>cing rules on companies’ use<br />
of FX loans). Whilst <strong>the</strong>se controls would dampen capital<br />
inflows and slow <strong>the</strong> recovery in <strong>the</strong> Korean won, reducing<br />
banks and companies’ dependence on external financing<br />
especially short-term borrowings should bode well <strong>for</strong> <strong>the</strong><br />
stability in <strong>the</strong> financial system and also <strong>the</strong> overall<br />
economy.<br />
60<br />
40<br />
20<br />
0<br />
Jan-06 Jan-07 Jan-08 Jan-09 Jan-10<br />
10<br />
5<br />
0<br />
Page 30
Regional ETF Focus<br />
<strong>Get</strong> <strong>set</strong> <strong>for</strong> a <strong>liquidity</strong> <strong>rally</strong><br />
Chart 6: Current account maintained strong surplus<br />
USD bn<br />
8<br />
6<br />
4<br />
2<br />
0<br />
-2<br />
Goods<br />
Services<br />
Total<br />
-4<br />
Latest: Jul10<br />
-6<br />
Jan-06 Jan-07 Jan-08 Jan-09 Jan-10<br />
Chart 7: External debt stabilized<br />
%<br />
120<br />
100<br />
80<br />
60<br />
40<br />
20<br />
External debt / External<br />
as<strong>set</strong>s<br />
ST external debt/Foreign<br />
reserves<br />
Latest:<br />
2Q10<br />
0<br />
1Q01 2Q02 3Q03 4Q04 1Q06 2Q07 3Q08 4Q09<br />
Sources <strong>for</strong> charts and tables are CEIC, Bloomberg and <strong>DBS</strong> Research (<strong>for</strong>ecasts and data trans<strong>for</strong>mations)<br />
Page 31
Regional ETF Focus<br />
<strong>Get</strong> <strong>set</strong> <strong>for</strong> a <strong>liquidity</strong> <strong>rally</strong><br />
Taiwan (Underweight) (Joanne Goh, joannegohsc@dbs.com)<br />
Near term outlook<br />
We expect Taiwan market to be affected by a downshift in<br />
economic activities in 4Q brought about by <strong>the</strong> weakened<br />
external environment. Export orders going into <strong>the</strong> 4Q is<br />
showing signs of flattening, which signals a peaking in<br />
industrial activities by <strong>the</strong> end of <strong>the</strong> year. Unless <strong>the</strong> US and<br />
China surprise o<strong>the</strong>rwise, <strong>the</strong>re are concerns that <strong>the</strong> strong<br />
tech upswing may have run its course.<br />
Domestic demand is expected to pick up following <strong>the</strong><br />
conclusion of ECFA (Economic Cooperation Framework<br />
Agreement) in June. The benefiting sectors are <strong>the</strong> retail,<br />
hospitality and tourism sectors. However <strong>the</strong> impact on<br />
domestic demand could be overstated following <strong>the</strong> initial<br />
surge in tourist arrivals from mainland.<br />
We expect China-Taiwan relationship to stall <strong>for</strong> <strong>the</strong><br />
moment be<strong>for</strong>e <strong>the</strong> Taiwan municipality elections on<br />
November 27. It may not be wise <strong>for</strong> Ma Ying-Jeou to play<br />
<strong>the</strong> China cards as his pro-China policies may have affected<br />
his popularity. China may also want to wait <strong>for</strong> <strong>the</strong><br />
elections results, which is an indication of Ma Ying-Jeou’s<br />
winning chance in <strong>the</strong> 2012 presidential elections. All said<br />
<strong>the</strong> focus in <strong>the</strong> 4Q will be <strong>the</strong> elections.<br />
Taiwan is much at risk if <strong>the</strong> US slowdown accelerates.<br />
Likewise our underweight on Taiwan could be at risk if<br />
things actually turned out to be better. That said with <strong>the</strong><br />
leading indicator already peaking, we expect <strong>the</strong> index to<br />
consolidate at current levels, pending on any clarity on <strong>the</strong><br />
outlook.<br />
Drivers:<br />
• Domestic demand is poised to pick up following <strong>the</strong><br />
improved economic conditions after ECFA.<br />
• Positive news flows from <strong>the</strong> financial MOU and ECFA.<br />
• Favorable interest rate environment and positive pre<br />
election market sentiment.<br />
Risks:<br />
• Domestic political noise could slow down <strong>the</strong> progress of<br />
Ma Ying-Jeou's economic re<strong>for</strong>m process.<br />
• High leverage on G3's growth if growth recovery<br />
disappoints.<br />
Fig. 25: Taiwan index vs leading indicator<br />
11000<br />
10000<br />
9000<br />
8000<br />
7000<br />
6000<br />
5000<br />
4000<br />
3000<br />
2000<br />
01 02 03 04 05 06 07 08 09 10<br />
TWI (L)<br />
Source: Datastream<br />
Fig. 21: Singapore and Hong Kong listed ETFs exposed to Taiwan market<br />
Leading indicator (R)<br />
ETF Ticker Mkt Cap Style Country/ Underlying Bid NAV/ Premium/ Avg Daily Avg Daily<br />
(US$ m) Region Index Price INAV Discount Volume Value (US$m)<br />
Tracker 15-Oct (latest) (20 day) (20 day)<br />
Singapore listed ETFs<br />
DBXT MSTaiwan XMTW SP Equity 160 Country Fund Taiwan NDEUSTW 17.48 17.47 -0.3% 15,347 0.265<br />
Lyxor Taiwan TWN SP Equity 62 Country Fund Taiwan TAMSCI 0.97 0.98 -1.0% 87,010 0.084<br />
Hong Kong listed ETFs<br />
Lyxor MSCI Taiwan 2837 HK Equity 62.6 Country Fund Taiwan TAMSCI 7.51 7.60 -1.0% 160 0.153<br />
DBXT MSCI Taiwan 3036 HK Equity 161.6 Country Fund Taiwan NDEUSTW 135.20 135.52 0.1% 1 0.010<br />
POLARIS TAIWAN TOP50 3002 HK Equity 25.9 Country Fund Taiwan TW50 12.18 12.43 -1.9% 40 0.062<br />
C-TRACKS Bldg/ Constr. 10800 HK Equity 0.1 Sector Funds China TWSECON N/A 3.25 N/A - N/A<br />
C-TRACKS TAIEX Electron10801 HK Equity 0.0 Sector Funds Taiwan TWSEELEC N/A 3.39 N/A - N/A<br />
C-TRACKS TAIEX Finance10802 HK Equity 0.1 Sector Funds Taiwan TWSEBKI 9.50 8.85 0.08 - N/A<br />
Source: Bloomberg. Notes: HK-listed ETFs - Vol in ‘000s, Price and NAV are in HKD unless o<strong>the</strong>rwise stated. SG-listed ETFs – Actual vol traded, Price<br />
and NAV are in US$ unless o<strong>the</strong>rwise indicated.<br />
130<br />
120<br />
110<br />
100<br />
90<br />
80<br />
70<br />
60<br />
Page 32
Regional ETF Focus<br />
<strong>Get</strong> <strong>set</strong> <strong>for</strong> a <strong>liquidity</strong> <strong>rally</strong><br />
Taiwan: Slower, more balanced growth (Tieying Ma, matieying@dbs.com, extracted from<br />
same name report, 11 September 2010)<br />
• Growth is expected to slow and to come more evenly<br />
from exports and domestic demand. Exports are<br />
flattening; <strong>the</strong> domestic outlook is improving<br />
• As<strong>set</strong> inflation is a concern. Interest rates are far below<br />
neutral and <strong>the</strong> banking system is flush with <strong>liquidity</strong> as<br />
a result of strong external surplus, continued FX<br />
intervention and incomplete sterilization. The central<br />
bank has so far hiked rates only in baby steps (12.5bps<br />
per quarter). Bigger steps will be on <strong>the</strong> horizon<br />
Slower exports, improving domestic outlook<br />
Taiwan’s real GDP growth decelerated to 7.2% QoQ saar in<br />
2Q from 10.9% in 1Q, mainly because of slower growth in<br />
exports and inventories. Exports, as <strong>the</strong> <strong>for</strong>emost factor<br />
affecting Taiwan’s near-term economic trend, are likely to<br />
continue softening ahead in light of a less favorable global<br />
environment (inflation challenges in emerging markets and<br />
fiscal constraints in advanced economies). Taiwan’s export<br />
orders, as a leading indicator <strong>for</strong> actual exports in <strong>the</strong> next<br />
1-3 months, have exhibited a flattening trend in <strong>the</strong> entire<br />
second quarter and in July (Chart 1). Having said that, we<br />
also need to point out <strong>the</strong> resilience of <strong>the</strong> industrial sector.<br />
Manufacturing inventory remains lean, with <strong>the</strong> inventoryto-shipment<br />
ratio staying subpar at only 0.87 as of June<br />
(Chart 2). Manufacturers are reluctant to expand production<br />
and accumulate inventories in anticipation of weaker sales<br />
outlook in <strong>the</strong> overseas markets. Should <strong>the</strong> per<strong>for</strong>mance of<br />
final demand turn out to be better than expected, industrial<br />
output can bounce back resiliently.<br />
Chart 1: Export demand cooling off<br />
volume, sa, 2006=100<br />
150<br />
140<br />
130<br />
120<br />
110<br />
100<br />
90<br />
80<br />
Export orders (LHS)<br />
Exports (RHS)<br />
value, sa, USDbn<br />
Latest:<br />
Jul/Aug10<br />
Jan-08 Jul-08 Jan-09 Jul-09 Jan-10 Jul-10<br />
30<br />
26<br />
22<br />
18<br />
14<br />
10<br />
Chart 2: Inventory remaining at low levels<br />
% 3m/3m saar Ratio<br />
90<br />
0.4<br />
70<br />
50<br />
30<br />
10<br />
-10<br />
-30<br />
-50<br />
-70<br />
-90<br />
Jan-05 Jan-06 Jan-07 Jan-08 Jan-09 Jan-10<br />
The domestic growth outlook is improving on <strong>the</strong> o<strong>the</strong>r<br />
hand. The cross-strait Economic Cooperation Framework<br />
Agreement was signed successfully in June, and approved<br />
by <strong>the</strong> Taiwanese legislation in August. Effective beginning<br />
next year, China will lower tariffs <strong>for</strong> Taiwanese exporters<br />
on 539 goods items (16% of China’s total imports from<br />
Taiwan) and ease market entry conditions <strong>for</strong> Taiwanese<br />
services suppliers in 11 sectors (such as financial, medical,<br />
computer and R&D). The ECFA should streng<strong>the</strong>n Taiwan’s<br />
trade competitiveness over time and boost investment and<br />
hiring activities in <strong>the</strong> corporate sector. The near-term<br />
effects are reflected in sentiments. Consumer confidence<br />
has climbed to a 6-year high on <strong>the</strong> back of stronger<br />
expectations about general economic climate and<br />
employment opportunities (Chart 3). This is in contrast with<br />
<strong>the</strong> regional phenomenon of slipping confidence and<br />
growing worries about global slowdown.<br />
Chart 3: Consumption growth holding up<br />
points<br />
85<br />
80<br />
75<br />
70<br />
65<br />
60<br />
55<br />
50<br />
45<br />
40<br />
Inventory-shipment ratio:<br />
manufacturing (RHS)<br />
Industrial production<br />
(LHS)<br />
Latest: Jun/Jul10<br />
Latest: Jul/Aug10<br />
Consumer<br />
confidence (LHS)<br />
Retail sales (RHS)<br />
Jan-05 Jan-06 Jan-07 Jan-08 Jan-09 Jan-10<br />
0.6<br />
0.8<br />
1.0<br />
1.2<br />
1.4<br />
1.6<br />
1.8<br />
2006=100, sa, real<br />
112<br />
108<br />
104<br />
100<br />
96<br />
92<br />
88<br />
84<br />
Page 33
Regional ETF Focus<br />
<strong>Get</strong> <strong>set</strong> <strong>for</strong> a <strong>liquidity</strong> <strong>rally</strong><br />
Meanwhile, deregulation of <strong>the</strong> cross-strait direct<br />
transportation and tourism (since 2H08) may be yielding<br />
positive return. Though it is not easy to identify whe<strong>the</strong>r <strong>the</strong><br />
growth in Taiwan’s services industry is cyclical or structural<br />
because of <strong>the</strong> sharp swing in global economic cycle as a<br />
result of <strong>the</strong> financial crisis, one interesting observation is<br />
that services employment recovered ahead of<br />
manufacturing employment, particularly in <strong>the</strong> sub-sectors<br />
of accommodation and food services (Chart 4). This is<br />
probably a sign demonstrating <strong>the</strong> benefits realized from<br />
cross-strait links of tourism and transportation.<br />
Chart 4: Services employment vs, manufacturing<br />
persons, th<br />
6250<br />
6150<br />
6050<br />
5950<br />
5850<br />
5750<br />
5650<br />
Latest: Jul10<br />
Services (LHS)<br />
Manufacturing (RHS)<br />
persons, th<br />
3000<br />
2950<br />
2900<br />
2850<br />
2800<br />
2750<br />
2700<br />
2650<br />
The risks to as<strong>set</strong> inflation are still on <strong>the</strong> upside, as <strong>the</strong><br />
current monetary policy remains highly accommodative and<br />
interest rate levels are far below neutral. Although <strong>the</strong><br />
central bank raised <strong>the</strong> benchmark discount rate <strong>for</strong> <strong>the</strong> first<br />
time since crisis, by 12.5bps in June, <strong>the</strong> hike has had little<br />
impact on market rates (Chart 6). This is because of<br />
abundant market <strong>liquidity</strong> resulting from still-strong external<br />
surplus, continued FX intervention and incomplete<br />
sterilization, as well as competition amongst <strong>the</strong> banks.<br />
Note that official <strong>for</strong>eign reserves increased by USD 9.7bn in<br />
<strong>the</strong> Jul-Aug period to a new record high of USD 372bn, and<br />
base money growth has reached double-digit rate on <strong>the</strong><br />
sequential basis (15.8%.3M/3M saar as of July). Moreover,<br />
Taiwan’s central bank schedules monetary policy meeting<br />
only once every three months. The process of interest rates<br />
normalization will natu<strong>rally</strong> take longer than many regional<br />
peers (and increase upside risks to as<strong>set</strong> inflation) should <strong>the</strong><br />
central bank continue raising rates in baby steps of 12.5bps<br />
each meeting.<br />
Chart 6: Interest rates at ultra-low levels<br />
% pa<br />
7.5<br />
6.0<br />
Policy discount rate<br />
New loans rate<br />
O/N interbank rate<br />
5550<br />
Jan-05 Jan-06 Jan-07 Jan-08 Jan-09 Jan-10<br />
2600<br />
4.5<br />
Latest: Jul10<br />
As<strong>set</strong> inflation is a concern<br />
As<strong>set</strong> inflation is a concern in Taiwan. Residential property<br />
prices have continued to rise sharply, with <strong>the</strong> Sinyi price<br />
index (<strong>for</strong> existing home sales) registering a 12.7% YoY rise<br />
during 2Q, and <strong>the</strong> Cathay index (<strong>for</strong> new home sales)<br />
gaining 9.1% YoY (Chart 5). This is despite <strong>the</strong> central<br />
bank’s attempt to cool <strong>the</strong> property market through<br />
mortgage regulations and moral suasions in <strong>the</strong> second<br />
quarter.<br />
Chart 5: Housing prices continued risisng<br />
Index<br />
170<br />
150<br />
130<br />
110<br />
90<br />
Sinyi Housing Price:<br />
Mar91=100<br />
Cathay Housing Price:<br />
2006-2008=100<br />
3.0<br />
1.5<br />
0.0<br />
Jan-00 Jan-02 Jan-04 Jan-06 Jan-08 Jan-10<br />
Policymakers will have to be cautious about <strong>the</strong> impacts of<br />
low interest rates on as<strong>set</strong> markets and overall financial<br />
stability. Lesson learnt from <strong>the</strong> 2008 global financial crisis is<br />
that loose monetary policy can fuel as<strong>set</strong> bubbles and<br />
excessive leveraging. We think <strong>the</strong> central bank would have<br />
to accelerate <strong>the</strong> pace of monetary policy normalization<br />
sooner or later. In our interest rate <strong>for</strong>ecast, we have<br />
penciled in a 12.5bps hike at <strong>the</strong> upcoming policy meeting<br />
in end-September, followed by 25bps hike per quarter from<br />
4Q onwards till end 2011. The risks to our <strong>for</strong>ecast mainly<br />
stem from external factors such as weaker-than-expected<br />
growth per<strong>for</strong>mance in <strong>the</strong> US and China.<br />
70<br />
Latest: Jun10<br />
50<br />
Mar-98 Mar-01 Mar-04 Mar-07 Mar-10<br />
Page 34
Regional ETF Focus<br />
<strong>Get</strong> <strong>set</strong> <strong>for</strong> a <strong>liquidity</strong> <strong>rally</strong><br />
Fiscal concerns subsided<br />
Market concerns about Taiwan’s fiscal deterioration have<br />
subsided, because of <strong>the</strong> resilient recovery in <strong>the</strong> real<br />
economy and improvement in government revenue. During<br />
<strong>the</strong> first seven months of this year, <strong>the</strong> general<br />
government’s tax revenue increased a solid 5.3% YoY. In<br />
June rating agency S&P revised Taiwan’s sovereign credit<br />
rating outlook to “stable”, withdrawing its “negative” call<br />
during global financial crisis.<br />
The government is also gradually removing stimulus along<br />
with <strong>the</strong> recovery. According to <strong>the</strong> 2011 budget of <strong>the</strong><br />
central government proposed in August, <strong>the</strong> spending level<br />
<strong>for</strong> next year will only stay unchanged as compared to this<br />
year (combining <strong>the</strong> general budget and special budget <strong>for</strong><br />
public construction). Considering <strong>the</strong> link between expected<br />
growth in government revenue and nominal GDP, we<br />
reckon that fiscal deficit will narrow fur<strong>the</strong>r to 1.6% of GDP<br />
in 2011 from 2.1% in 2010, and public debt-to-GDP ratio<br />
will stabilize below 40%.<br />
Sources <strong>for</strong> charts and tables are CEIC, Bloomberg and <strong>DBS</strong> Research (<strong>for</strong>ecasts and data trans<strong>for</strong>mations)<br />
Page 35
Regional ETF Focus<br />
<strong>Get</strong> <strong>set</strong> <strong>for</strong> a <strong>liquidity</strong> <strong>rally</strong><br />
Indonesia (Overweight) (Joanne Goh, joannegohsc@dbs.com)<br />
Near term outlook<br />
We believe risks are rising in Indonesia in <strong>the</strong> near term. The<br />
market is pricing in a lot of positives in our view. These<br />
include an investment ratings upgrade, <strong>the</strong> belief that<br />
interest rate will continue to stay low, and that Rupiah will<br />
continue to streng<strong>the</strong>n. While we believe <strong>the</strong>se are all highly<br />
possible, <strong>the</strong>y are not going to happen overnight.<br />
Foreign investors' participation in <strong>the</strong> stock market is a lot<br />
higher now than be<strong>for</strong>e, which means that <strong>for</strong>eign flows<br />
have a bigger impact on <strong>the</strong> market ra<strong>the</strong>r than domestic<br />
investors. Hence <strong>the</strong> re-rating in <strong>the</strong> past cannot continue as<br />
<strong>for</strong>eigners are making regional comparisons on valuations,<br />
risks, and sectors. There is a general fear that global<br />
investors will turn away upon rising valuations and global<br />
risk factors.<br />
We need to see stronger domestic <strong>liquidity</strong> to overcome this<br />
apprehension. With rising inflationary pressure, <strong>the</strong> fear has<br />
been that <strong>the</strong> central bank will tighten <strong>liquidity</strong>. Last week<br />
<strong>the</strong> central bank raised <strong>the</strong> RRR from 5% to 8% to mop up<br />
excess <strong>liquidity</strong>, meanwhile keeping <strong>the</strong> interest rate at<br />
current low levels. The core CPI basket was also revised.<br />
Earlier on, <strong>the</strong> loan-to-deposit target was <strong>set</strong> at 78-100%.<br />
Recent BI actions seem to have shaken investors’ confidence<br />
on <strong>the</strong> central bank’s creditability, as some of <strong>the</strong> measures<br />
are perceived to be contradictory in controlling <strong>liquidity</strong> and<br />
inflation, and expanding loan growth. At this stage when<br />
both BI governor and <strong>the</strong> Finance Minister are new, we<br />
think it is important that BI manage expectations in a<br />
credible manner, which is more important than <strong>the</strong> impact<br />
of <strong>the</strong> actions <strong>the</strong>mselves.<br />
In our view, <strong>the</strong>re are no contradictions in <strong>the</strong>se policy<br />
actions. The 300bps hike in RRR will freeze rupiah <strong>liquidity</strong><br />
by about IDR 53trn (USD 5.9bn) among commercial banks<br />
according to our calculation. This is still a moderate amount,<br />
given that banks have excess reserves of IDR 52trn placed in<br />
<strong>the</strong> central bank, and banks’ holdings of central bank<br />
certificates (near IDR 270trn) are also liquid. Total excess<br />
<strong>liquidity</strong> in <strong>the</strong> banking sector is more than IDR 300trn. As<br />
such, <strong>the</strong> RRR move may help ease <strong>the</strong> urgency to raise<br />
interest rates in <strong>the</strong> next couple of months.<br />
Meanwhile, BI stipulated that banks must maintain <strong>the</strong> loanto-deposit<br />
ratio in <strong>the</strong> range of 78%-100%, starting from<br />
March 2011. Banks that fail to meet <strong>the</strong> LDR requirement<br />
will be penalized with additional reserve requirements. As<br />
<strong>the</strong> current LDR level in <strong>the</strong> banking system averages at<br />
78%, <strong>the</strong> new LDR regulation clearly targets at higher credit<br />
growth. The LDR measure should be viewed as a mediumto-long<br />
term strategy to improve <strong>the</strong> banking sector’s<br />
intermediation function and enhance <strong>the</strong> economy’s growth<br />
potential. The RRR hike represents <strong>the</strong> near-term policy<br />
stance of tightening.<br />
Fig. 20: Indonesia - CPI, lending, deposit and policy<br />
rates<br />
20<br />
18<br />
16<br />
14<br />
12<br />
10<br />
8<br />
6<br />
4<br />
2<br />
%<br />
01 02 03 04 05 06 07 08 09 10<br />
Source: Datastream<br />
3M dep. Rate<br />
BI policy rate<br />
Min. lending rate<br />
CPI inflation<br />
<strong>DBS</strong> Economics now expects <strong>the</strong> first rate hike to be in<br />
December. We do not expect domestic demand to be<br />
affected by rate hikes. Lending rate is still at a wide spread<br />
to policy rate and has been coming off. Banks are also<br />
encouraged to lend as funds parked overnight with BI are<br />
penalized. We continue to see a lower lending rate to<br />
support loan demand.<br />
Our economist views <strong>the</strong> investment upgrade as highly likely<br />
but it remains to be seen whe<strong>the</strong>r it will bring an immediate<br />
positive impact on <strong>the</strong> economy. (See "Indonesia: upgrading<br />
expectations" by Tieying Ma included in this report.) <strong>DBS</strong>'<br />
Fixed income strategist believes that Indonesia's bond yield<br />
should rise if <strong>the</strong> economic outlook is good and that <strong>the</strong><br />
yield curve will have to rise once BI starts hiking rates. In<br />
Page 36
Regional ETF Focus<br />
<strong>Get</strong> <strong>set</strong> <strong>for</strong> a <strong>liquidity</strong> <strong>rally</strong><br />
short we do not think that <strong>the</strong> long-term bond yield has<br />
room to fall from current levels even with an investment<br />
upgrade.<br />
Near term we believe Indonesia equities market will trade<br />
within a volatile range. We recommend adding positions on<br />
any significant pull back as Indonesia has consistently<br />
offered <strong>the</strong> best risk-return reward.<br />
Drivers:<br />
• Indonesia's president SBY, now in his second term, has<br />
successfully pushed his re<strong>for</strong>m agenda on economic<br />
policies and anti-corruption drive. This has translated to<br />
higher FDI flows, improving balance of payments, and<br />
strong private consumption growth.<br />
• Indonesia has also been able to ride on <strong>the</strong> positive<br />
commodity cycle. With <strong>the</strong> mining re<strong>for</strong>m in place, FDI<br />
inflows have helped with capacity expansion. The<br />
potential challenges under <strong>the</strong> current environment<br />
would be weaker growth and USD, which may drive<br />
commodity prices lower. However, we expect <strong>the</strong><br />
continuous improvement in FDI to lift income levels and<br />
hence private consumption growth. Indonesia is one of<br />
<strong>the</strong> few countries that did not suffer a recession during<br />
<strong>the</strong> US financial crisis because of <strong>the</strong> high component of<br />
domestic demand in GDP growth.<br />
to improve market's breadth and a higher potential GDP<br />
growth from re<strong>for</strong>m ef<strong>for</strong>ts.<br />
Risks:<br />
• There is always a fear of capital flight considering<br />
Indonesia's large <strong>for</strong>eign bond holdings. Attractive<br />
interest rate spreads between US and IDR also make<br />
Indonesian bonds and bills very attractive carry play.<br />
Hence, volatility in <strong>the</strong> equities market are closely linked<br />
to volatility in <strong>the</strong> Rupiah.<br />
• This is SBY's last term in <strong>the</strong> office and hence, <strong>the</strong> crucial<br />
leadership succession will be in play. Political risks in<br />
Indonesia have eased over <strong>the</strong> last few years under SBY's<br />
leadership but <strong>the</strong> struggle between <strong>the</strong> re<strong>for</strong>mists and<br />
powerful vested interests is ongoing. The conflict<br />
emerged early this year when SBY was <strong>for</strong>ced to let go of<br />
his important right hand man and that his VP was being<br />
investigated <strong>for</strong> a bank bailout case during <strong>the</strong> US<br />
financial crisis. This would slow <strong>the</strong> pace of re<strong>for</strong>m.<br />
• Foreign flows have a bigger impact on <strong>the</strong> market ra<strong>the</strong>r<br />
than domestic investors. This means that re-rating in <strong>the</strong><br />
past cannot continue as <strong>for</strong>eigners are making regional<br />
comparisons on valuations, risks, and sectors. It also<br />
suggests that Indonesia market will be more open to<br />
external global factors, just like <strong>the</strong> US subprime and <strong>the</strong><br />
Eurozone crisis.<br />
• With <strong>the</strong> ASEAN/China FTA, 90% of products between<br />
China and Indonesia are tariff-free. As Indonesia has <strong>the</strong><br />
advantage of being more cost competitive than China, we<br />
expect manufacturing activities to pick up in Indonesia,<br />
<strong>the</strong>reby improving income levels.<br />
• Indonesia is still enjoying higher loan growth rates amid<br />
rising investment and consumption. However, tight<br />
banking regulations prevent banks from lending more. A<br />
"shadow" banking system fills <strong>the</strong> gap <strong>for</strong> now. We<br />
expect relaxation in banking regulations to improve loan<br />
growth going <strong>for</strong>ward.<br />
• On this end BI has encouraged bank lending by <strong>set</strong>ting a<br />
higher L/D ratio and higher penalty overnight rates. We<br />
continue to see loan growth to improve. YTD bank loan is<br />
9% but seasonal effects should boost loan growth in <strong>the</strong><br />
second half.<br />
• As <strong>the</strong> only Asian country with a significant commodities<br />
exports sector, Indonesia has become an important<br />
portfolio in emerging market funds and comparison was<br />
made <strong>for</strong> its similarities to <strong>the</strong> "BRIC"s countries. While<br />
lacking size at <strong>the</strong> moment, we expect more IPO listings<br />
Page 37
Regional ETF Focus<br />
<strong>Get</strong> <strong>set</strong> <strong>for</strong> a <strong>liquidity</strong> <strong>rally</strong><br />
Indonesia: inflows & monetary policy (Tieying Ma, matieying@dbs.com, re-published from same<br />
name report, 13 October 2010)<br />
Foreign inflows have been strong, across financial as<strong>set</strong>s<br />
including bonds, equities and money market instruments<br />
Inflows have not inflated <strong>the</strong> real economy thus far<br />
• Going <strong>for</strong>ward inflows will continue to rise, due to looser<br />
monetary conditions in <strong>the</strong> advanced economies and<br />
rising sentiment toward Indonesia. Policymakers will face<br />
growing challenges of managing inflows<br />
• The most likely policy option BI will choose is to rein<strong>for</strong>ce<br />
quantitative measures to absorb <strong>liquidity</strong> (RRR and OMO).<br />
Raising interest rates will also become unavoidable when<br />
inflation pressures increase<br />
• Accelerating currency appreciation is not expected. And<br />
<strong>the</strong> authorities’ stance on capital controls seems to be<br />
cautious<br />
Rising inflows<br />
Foreign capital inflows have been strong ever since <strong>the</strong><br />
beginning of global recovery early last year, attracted by <strong>the</strong><br />
country’s promising economic prospects, a positive<br />
sovereign rating outlook and high yields. From April 2009 to<br />
September 2010, <strong>for</strong>eign holdings of Indonesian<br />
government bonds increased a cumulative USD 13.5bn. As a<br />
percentage of <strong>the</strong> total amount of tradable rupiah<br />
government bonds, <strong>for</strong>eign ownership has risen to a record<br />
high of 28%, up sharply from 15% in Apr09. Meanwhile,<br />
<strong>for</strong>eign net purchases of equities registered a positive USD<br />
3.6bn over <strong>the</strong> past 18 months and <strong>for</strong>eign holdings of<br />
central bank certificates (SBI) increased by USD 4.7bn (Chart<br />
1, 2). In total, <strong>for</strong>eign inflows into Indonesia’s bond, equity<br />
and SBI markets have reached USD 22bn.<br />
Inflows have not inflated <strong>the</strong> real economy<br />
Inflows into Indonesia are not that large if compared to <strong>the</strong><br />
country’s economic size, however. Measured by <strong>the</strong><br />
increases in <strong>for</strong>eign reserves (USD 32bn since Apr09), net<br />
inflows are equivalent to 4.5% of <strong>the</strong> country’s annual GDP.<br />
This compares to 13% on average <strong>for</strong> all <strong>the</strong> Asian 10<br />
economies, and more than 15% in small economies like<br />
Hong Kong, Singapore, Taiwan and Thailand (Chart 3). This<br />
helps explain why Indonesia’s money supply growth remains<br />
benign at 12-13% YoY, and core inflation stays close to <strong>the</strong><br />
lower end of <strong>the</strong> central bank target of 4-6%. There are no<br />
overheating problems yet in <strong>the</strong> real economy. The<br />
inflationary phenomenon is chiefly reflected in equity and<br />
bond prices at this moment.<br />
Chart 1: Bond and equity inflowd surging<br />
USD bn<br />
2.5 Govt bond<br />
2.0<br />
JCI<br />
1.5<br />
1.0<br />
0.5<br />
0.0<br />
-0.5<br />
-1.0<br />
-1.5<br />
2010<br />
2008<br />
-2.0 Latest: Sep10<br />
European<br />
global crisis<br />
-2.5<br />
crisis<br />
-3.0<br />
Jan-06 Jan-07 Jan-08 Jan-09 Jan-10<br />
Chart 2: Foreign inflows into SBIs also rebounding<br />
USD bn<br />
3<br />
2<br />
1<br />
-1<br />
-2<br />
-3<br />
-4<br />
-5<br />
-6<br />
Latest: Aug10<br />
2010<br />
European<br />
crisis<br />
Mar-09 Jun-09 Sep-09 Dec-09 Mar-10 Jun-10<br />
Page 38
Regional ETF Focus<br />
<strong>Get</strong> <strong>set</strong> <strong>for</strong> a <strong>liquidity</strong> <strong>rally</strong><br />
Chart 3: Inflows to Indonesia not large if compared to<br />
economic size<br />
%<br />
35<br />
30<br />
25<br />
20<br />
15<br />
10<br />
5<br />
Changes in Foreign<br />
Reserves (Apr09-Sep10)<br />
/ Nominal GDP<br />
<strong>liquidity</strong> supply. Base money still expanded by IDR 119trn<br />
(USD 13.2bn) from Apr09 to Sep10 (Chart 4). The year-onyear<br />
growth in base money has been advancing at 20%<br />
YoY ever since end-09, surpassing <strong>the</strong> trend growth in<br />
nominal GDP of 18.7% (averages in 2004-2009). Banks’<br />
credit expansion has accelerated too, also reaching <strong>the</strong> 20%<br />
growth rate recently from Jul10. It may not take very long<br />
<strong>for</strong> broad money supply growth to catch up, in principle.<br />
Historically, when M2 growth approached 20%, CPI<br />
inflation (both headline and core) stayed sticky above 6%,<br />
including <strong>the</strong> periods without <strong>the</strong> disruption impacts on<br />
inflation from fuel price hikes (Chart 5).<br />
Chart 4: Base money expanding<br />
0<br />
HK SG TW TH CN KR MY ID IN<br />
But <strong>the</strong> risks are growing<br />
IDR trn<br />
440<br />
Latest: Sep10<br />
Going <strong>for</strong>ward however, inflows will likely continue to<br />
increase. With Japan recently having adopted fur<strong>the</strong>r<br />
quantitative easing and <strong>the</strong> US Fed widely expected to<br />
follow soon, capital movement from advanced economies<br />
into emerging Asia is expected to intensify. The outsized<br />
returns from Indonesia’s financial as<strong>set</strong>s year-to-date will<br />
keep it a key investment destination in Asia.<br />
400<br />
360<br />
320<br />
IDR 119trn<br />
Importantly, inflows into Indonesia are largely in <strong>the</strong> <strong>for</strong>m of<br />
portfolio flows (ra<strong>the</strong>r than FDI) which can be sensitive to<br />
shocks to confidence and risk aversion. The potential<br />
destabilization risks in <strong>the</strong> financial markets can not be<br />
ignored. How to manage inflows to prevent <strong>the</strong>m from<br />
inflating <strong>the</strong> real economy and how to minimize <strong>the</strong><br />
volatility of flows are becoming challenges <strong>for</strong> policymakers.<br />
The current policy mix<br />
The current policy reaction from Bank Indonesia includes<br />
tolerating certain appreciation in <strong>the</strong> rupiah, increasing open<br />
market operations and hiking reserve requirement ratio to<br />
sterilize <strong>liquidity</strong>, as well as taking prudential regulation<br />
measures to directly guide inflows. Specifically, 1) <strong>the</strong><br />
dollar/rupiah rate has been allowed to dip below 9000, 2)<br />
open market operations have been increased by IDR 62trn<br />
(USD 6.9bn) from Apr09 to Sep10, 3) banks’ primary reserve<br />
requirement ratio was raised by 300bps in Sep10, 4) a onemonth<br />
minimum holding period was imposed <strong>for</strong> <strong>for</strong>eign<br />
investment in SBI (Jun10).<br />
280<br />
Jan-08 Jul-08 Jan-09 Jul-09 Jan-10 Jul-10<br />
Chart 5: Money supply vs. inflation<br />
% YoY<br />
20<br />
18<br />
16<br />
14<br />
12<br />
10<br />
8<br />
6<br />
4<br />
2<br />
0<br />
Latest:<br />
Aug/Sep10<br />
M2 CPI Core CPI<br />
Jan-03 Jan-05 Jan-07 Jan-09<br />
This policy mix has not been sufficient to prevent capital<br />
inflows from translating into an expansion in domestic<br />
Page 39
Regional ETF Focus<br />
<strong>Get</strong> <strong>set</strong> <strong>for</strong> a <strong>liquidity</strong> <strong>rally</strong><br />
Future policies<br />
With inflows expected to persist, what will be <strong>the</strong> key policy<br />
responses in <strong>the</strong> future Accelerating IDR appreciation is not<br />
expected. The USD/IDR rate has already recovered to <strong>the</strong><br />
2008 level, and <strong>the</strong> IDR REER currently is about only 12%<br />
below <strong>the</strong> historical peak reached just be<strong>for</strong>e <strong>the</strong> 1997-98<br />
Asian financial crisis. A strong rupiah may not damage <strong>the</strong><br />
competitiveness of Indonesian exports, which are primarily<br />
comprised of commodities goods with relatively inelastic<br />
demand in global markets. The concerns are that a strong<br />
rupiah boosts imports and erodes trade and current account<br />
balance, exposing <strong>the</strong> balance of payments to volatility of<br />
capital flows. The current account surplus is already falling<br />
and <strong>the</strong> World Bank predicts a small deficit of USD 1.2bn<br />
next year. This is not to mention that Indonesia’s<br />
outstanding amount of gross external debt is still 2.4 times<br />
of <strong>for</strong>eign reserves. BI could find it necessary to accumulate<br />
reserves and support current account balance so as to<br />
reduce <strong>the</strong> destabilization effects stemming from a reversal<br />
in capital movement one day in future.<br />
In terms of capital controls, <strong>the</strong> Indonesian authorities have<br />
been maintaining a careful stance. An impetuous move<br />
could damage <strong>for</strong>eign investors’ confidence and cause<br />
unwanted distortions and side-effects, undermining <strong>the</strong><br />
official aim of attaining an investment grade sovereign<br />
rating as early as next year. The SBI regulation measure in<br />
June was applied to both <strong>for</strong>eign and domestic investors<br />
with no discrimination, and BI had been signaling <strong>the</strong> move<br />
<strong>for</strong> several months be<strong>for</strong>e its implementation. A heavy <strong>for</strong>m<br />
of price/quantity controls on capital movement, such as<br />
taxes on <strong>for</strong>eign portfolio investment and unremunerated<br />
reserve requirement, does not seem to be on <strong>the</strong> policy<br />
agenda.<br />
The increases in capital inflows, an open capital account and<br />
greater FX intervention by <strong>the</strong> central bank should lead to a<br />
faster expansion in domestic money supply, exerting upward<br />
pressures on inflation. In response to such risks, quantitative<br />
measures to tighten <strong>liquidity</strong> (RRR hikes and OMO that have<br />
been used) will likely be rein<strong>for</strong>ced fur<strong>the</strong>r. BI has been<br />
reluctant to directly raise interest rates thus far. The<br />
benchmark rate level of 6.5% in Indonesia is among <strong>the</strong><br />
highest in <strong>the</strong> region. There are understandable concerns<br />
that a widening differential with <strong>for</strong>eign rates will invite<br />
even more inflows. Rate hikes will become unavoidable<br />
when inflation escalates and economic overheating<br />
problems emerge, however. Rate hikes could also lower<br />
investors’ expectations on economic growth and as<strong>set</strong> price<br />
returns. We continue to expect BI to raise rates from 6.5%<br />
to a neutral 8.0% next year (in accordance with our 2011<br />
inflation <strong>for</strong>ecast of 6.5%), although we have revised <strong>the</strong><br />
timing of <strong>the</strong> first hike to Feb11 from Dec10 to reflect BI’s<br />
preference of quantitative tightening in <strong>the</strong> near term.<br />
Sources <strong>for</strong> charts and tables are CEIC, Bloomberg and <strong>DBS</strong> Research (<strong>for</strong>ecasts and data trans<strong>for</strong>mations)<br />
Page 40
Regional ETF Focus<br />
<strong>Get</strong> <strong>set</strong> <strong>for</strong> a <strong>liquidity</strong> <strong>rally</strong><br />
Indonesia interest rate strategy: inflows drown fundamentals (Jens Lauschke,<br />
jens.lauschke@dbs.com, re-published from same name report, 8 October 2010)<br />
•<br />
Capital flows have been strong <strong>for</strong> <strong>the</strong> past four months<br />
and market per<strong>for</strong>mance has been impressive<br />
• But as<strong>set</strong> prices are now overstating fundamentals. This is<br />
a problem<br />
• Government bond yields mask inflation and rate hike risks<br />
and <strong>the</strong> equity market has outper<strong>for</strong>med regional peers<br />
by a wide margin<br />
• Policy makers still think that <strong>the</strong> risk of being too early in<br />
interest rate policy tightening outweighs <strong>the</strong> risk of being<br />
too late, but given <strong>the</strong> strength of credit and domestic<br />
demand growth and inflationary pressure, policy makers<br />
cannot sit on <strong>the</strong> sidelines much longer<br />
• Investors should prepare <strong>for</strong> a more decisive response<br />
from policy makers<br />
Markets have delivered impressive returns<br />
Capital flows have been strong <strong>for</strong> <strong>the</strong> past four months<br />
and market per<strong>for</strong>mance, in both <strong>the</strong> equity space and bond<br />
space, has been impressive. Despite <strong>the</strong> global financial<br />
crisis, broad-market equity total return benchmarks are up<br />
more than 30% since Dec-2007 and bond benchmarks<br />
trade more than 50%.<br />
Foreign flows into Indonesia stocks & bonds<br />
IDR trillion<br />
25<br />
20<br />
15<br />
10<br />
5<br />
0<br />
-5<br />
-10<br />
Bonds<br />
Stocks<br />
Jun-09 Dec-09 Jun-10 Dec-10<br />
But too much of a good thing is not a good thing and as<strong>set</strong><br />
prices now overstate fundamentals. Government bond<br />
yields have already fallen to levels that mask inflation and<br />
rate hike risks and <strong>the</strong> Jakarta Composite has outper<strong>for</strong>med<br />
regional peers by a wide.<br />
Comparative returns<br />
%, cumulative from 12/31/2007<br />
80<br />
60<br />
40<br />
20<br />
0<br />
-20<br />
-40<br />
-60<br />
-80<br />
Bonds (iBoxx Total Return Index)<br />
Stocks (MSCI Total Return Index)<br />
Dec-07 Jun-08 Dec-08 Jun-09 Dec-09 Jun-10<br />
This is not all good. First, while attracted by positive longterm<br />
fundamentals, it is likely that some of <strong>the</strong> gene<strong>rally</strong><br />
welcome <strong>for</strong>eign capital inflows during <strong>the</strong> next period of<br />
risk aversion in global markets turn into outflows. Second,<br />
local markets are small (<strong>the</strong> government bond market is<br />
about 15% of GDP and <strong>the</strong> corporate bond market about<br />
1.6% of GDP, <strong>the</strong> equity market capitalization is about 50%<br />
of GDP) and large capital flows boosts domestic <strong>liquidity</strong><br />
and makes <strong>the</strong> conduct of monetary policy more difficult.<br />
Third, <strong>the</strong> more markets move away from fundamentals, <strong>the</strong><br />
more likely it is that <strong>the</strong> eventual correction has an impact<br />
on <strong>the</strong> real economy.<br />
Moreover, excess <strong>liquidity</strong> is considerable, credit growth is<br />
strong, and consumer prices are up 5.8% from a year ago.<br />
These trends are likely to continue and with commodity<br />
prices rising, <strong>the</strong> risk to <strong>the</strong> inflation outlook is now to <strong>the</strong><br />
upside. It is quite plausible that annual inflation rises above<br />
6% in 2011 (year-on-year changes in CPI inflation have<br />
averaged 8% over <strong>the</strong> past eight years).<br />
Bank Indonesia needs to be more proactive<br />
Judging from <strong>the</strong> inaction on policy interest rates, policy<br />
makers still think that <strong>the</strong> risk of being too early in policy<br />
rate tightening outweighs <strong>the</strong> risk of being too late.<br />
Governor Nasution said in early September that “as long as<br />
we can still manage our monetary variables by o<strong>the</strong>r<br />
instruments, we will try to avoid changing <strong>the</strong> interest rate.”<br />
Bottom line, policy makers are reluctant to use interest rates<br />
proactively to anchor inflation expectations and reduce <strong>the</strong><br />
volatility in price trends. While <strong>the</strong>y are becoming more<br />
Page 41
Regional ETF Focus<br />
<strong>Get</strong> <strong>set</strong> <strong>for</strong> a <strong>liquidity</strong> <strong>rally</strong><br />
concerned about <strong>the</strong> inflation outlook, hey continue to<br />
reiterate <strong>the</strong> importance of supporting credit expansion and<br />
overall economic growth.<br />
As long as this is <strong>the</strong> prevailing perception among market<br />
participants and risk appetite remains healthy, both <strong>the</strong><br />
equity market and <strong>the</strong> bond market will do well. As <strong>for</strong>eign<br />
entities continue to absorb all of <strong>the</strong> net supply of bonds to<br />
<strong>the</strong> market, <strong>the</strong> rich trading levels of and low yields on<br />
Indonesian government bonds will continue to mask<br />
inflation and rate hike risks and trade well below fair value.<br />
Eventually, <strong>the</strong> policy rate will have to be raised from <strong>the</strong><br />
current record low level of 6.5% and that point is probably<br />
not as far away as investors hope. Given <strong>the</strong> strength of<br />
credit growth and domestic demand growth, inflationary<br />
pressures, capital inflows, market developments and<br />
international pressure, it is unlikely that <strong>the</strong> market will have<br />
policy makers on its side much longer.<br />
We think <strong>the</strong> first rate hike from Bank Indonesia could come<br />
as early as this quarter. The hike in <strong>the</strong> primary reserve<br />
requirement ratio in September already signals that policy<br />
makers feel <strong>the</strong> need to act. So far, <strong>the</strong>y have merely<br />
restored banking system <strong>liquidity</strong> conditions to pre-crisis<br />
levels and more needs to be done to anchor inflation<br />
expectations and ensure healthy economic growth. Investors<br />
have to prepare <strong>the</strong>mselves <strong>for</strong> a more decisive response<br />
from policy makers to current trends in <strong>the</strong> economy and<br />
markets.<br />
Consumer price inflation<br />
Index, 2007=100<br />
MoM % changes<br />
Sep-10 Sep-10 6M Avg 12M Avg<br />
CPI 123.2 CPI 0.44 0.70 0.47<br />
Food 142.5 Food 0.4 1.6 0.9<br />
Prep Food 130.9 Prep Food 0.5 0.5 0.6<br />
Clothing 122.2 Clothing 1.1 0.6 0.4<br />
Transport 106.4 Transport 0.6 0.4 0.2<br />
Housing 118.8 Housing 0.3 0.4 0.3<br />
Education 117.2 Education 0.3 0.4 0.3<br />
Health 115.3 Health 0.2 0.2 0.2<br />
Headline CPI inflation & 10Y Bond yield<br />
%<br />
20<br />
18<br />
16<br />
14<br />
12<br />
10<br />
8<br />
6<br />
4<br />
2<br />
0<br />
CPI<br />
(%YoY)<br />
10Y Yield<br />
(%pa)<br />
Jul-03 Jul-05 Jul-07 Jul-09<br />
Conclusion<br />
As long as <strong>the</strong>re is <strong>the</strong> perception that a) interest rate policy<br />
in Indonesia will be reactive ra<strong>the</strong>r than proactive with<br />
regard to inflation and b) policy remains focused on<br />
supporting credit expansion and overall economic growth,<br />
<strong>the</strong> music is playing and <strong>the</strong> party goes on - both in <strong>the</strong><br />
equity as well as in <strong>the</strong> bond market. But no party goes on<br />
<strong>for</strong>ever. With inflation risks to <strong>the</strong> upside investors have to<br />
prepare <strong>the</strong>mselves <strong>for</strong> policy makers removing <strong>the</strong> punch<br />
bowl. Bank Indonesia has already demonstrated that it is<br />
willing to act and interest rate hikes will soon be used to<br />
change market perceptions that monetary policy conditions<br />
will remain accommodative. Bond yields will rise when that<br />
happens.<br />
Sources <strong>for</strong> charts and tables are CEIC, Bloomberg and <strong>DBS</strong> Research (<strong>for</strong>ecasts and data trans<strong>for</strong>mations)<br />
Page 42
Regional ETF Focus<br />
<strong>Get</strong> <strong>set</strong> <strong>for</strong> a <strong>liquidity</strong> <strong>rally</strong><br />
Thailand (Overweight) (<strong>DBS</strong><strong>Vickers</strong> Thai Research team)<br />
Near term outlook<br />
Near-term correction likely. History suggests a negative<br />
correlation between interest rates and market PE. With (i)<br />
policy rates rising <strong>for</strong> two consecutive months by 25bps<br />
each from 1.25% to 1.75% now, (ii) expectations <strong>for</strong> two<br />
more 25bps rate hikes, and (ii) many stock prices rising<br />
sharply YTD, we expect a near-term price correction,<br />
particularly small-mid cap stocks which prices have surged<br />
beyond <strong>the</strong>ir fundamentals. None<strong>the</strong>less, given that such<br />
interest rate hikes are considered a normalization policy<br />
ra<strong>the</strong>r than tightening, market correction should be minor<br />
this time.<br />
Upward trend should continue. With economic recovery on<br />
track, local political tension easing, and market earnings<br />
growth still strong at 23% in 2010F and 14% in 2011F,<br />
Thailand will continue to attract <strong>for</strong>eign funds flow back<br />
into <strong>the</strong> country.<br />
Our 12-month SET Index target is still 1100. Despite <strong>the</strong><br />
<strong>rally</strong>, <strong>the</strong> market remains cheap at 12x 2011 PE, still below<br />
its historical average of 13x. We remain positive and revised<br />
our 12-month SET Index target to 1,100 based on bottom<br />
up approach (implying 13.5x 2011F PE), which suggests<br />
13% upside from current levels.<br />
Switch to large-cap plays in Banks, Energy, and<br />
Petrochemicals. We recommend investors take profit on<br />
small/mid cap stocks which share prices have rallied ahead<br />
of fundamentals, and switch to larger-caps in Banks, Energy,<br />
and Petrochemicals in <strong>the</strong> near term. Banks should be prime<br />
beneficiaries of <strong>the</strong> recovering economy. We have turned<br />
more positive on <strong>the</strong> Energy sector following <strong>the</strong> resolution<br />
of <strong>the</strong> Map Ta Phut case. The sector, having been a major<br />
laggard YTD, should also benefit from rebounding oil prices.<br />
Politics<br />
Emergency Decree lifted in ano<strong>the</strong>r three provinces. On 30<br />
Sep 2010, Prime Minister Abhisit Vejjajiva lifted <strong>the</strong><br />
emergency decree in three more provinces - Khon Kaen,<br />
Udon Thani, and Nakhon Rachasima. The decision came as<br />
situation in those areas had improved such that government<br />
officers would be able to prevent and resolve problems,<br />
should <strong>the</strong>y occur, using normal measures. The emergency<br />
decree remains in effect in four provinces, namely, Bangkok,<br />
Nonthaburi, Samut Prakan and Pathumthani.<br />
Constitutional amendments. The Constitutional Re<strong>for</strong>m<br />
Committee, chaired by Dr. Sombat Thamrongthanyawong,<br />
has reached a conclusion. The Committee proposed<br />
changes to four of <strong>the</strong> six issues, as follows:<br />
1) Parliamentary approval <strong>for</strong> treaties (Article 190): It<br />
proposed that an organic law be drafted pursuant to this<br />
article to specify <strong>the</strong> type of treaties that require<br />
parliamentary approval and make clear <strong>the</strong> relevant<br />
procedures that must be followed;<br />
2) Election of members of House of Representatives (Articles<br />
93 and 94): It proposed that changes be made to <strong>the</strong><br />
proportion of constituency-based and party-list<br />
representatives from 400:80 to 375:125. As such, <strong>the</strong> total<br />
number of House members will be increased from 480 to<br />
500. It also proposed to revert to <strong>the</strong> election system under<br />
<strong>the</strong> 1997 Constitution, namely, single member<br />
constituencies instead of <strong>the</strong> current multi-member<br />
constituencies.<br />
3) Appointment/election of members of <strong>the</strong> Senate (Articles<br />
111-113): It proposed that <strong>the</strong> composition of <strong>the</strong> selection<br />
committee that appoints senators be adjusted in terms of<br />
increasing and diversifying its membership.<br />
4) Dissolution of political parties (Article 237): It proposed<br />
that in <strong>the</strong> case of election fraud, <strong>the</strong> political party involved<br />
should not be dissolved, but <strong>the</strong> political ban on <strong>the</strong> leader<br />
and <strong>the</strong> executive board members who are found guilty be<br />
raised from 5 years to 15 and 10 years, respectively.<br />
The Committee is currently conducting public consultations<br />
on its proposals, which could result in fur<strong>the</strong>r adjustments.<br />
When finalized, <strong>the</strong> proposal will be <strong>for</strong>warded to <strong>the</strong><br />
Government <strong>for</strong> consideration by end Oct or early Nov<br />
2010.<br />
Economy<br />
Thailand relaxes regulations on capital outflow. This is a<br />
continuation of its policy to reduce <strong>the</strong> excess of inflows<br />
over outflows, and to curb <strong>the</strong> appreciation of <strong>the</strong> baht.<br />
Some of <strong>the</strong> key measures include:<br />
Page 43
Regional ETF Focus<br />
<strong>Get</strong> <strong>set</strong> <strong>for</strong> a <strong>liquidity</strong> <strong>rally</strong><br />
1) Thai residents and companies can now hold up to<br />
USD500,000 in <strong>for</strong>eign currency accounts in Thailand<br />
(previous: USD300,000 <strong>for</strong> companies and USD100,000<br />
<strong>for</strong> individuals).<br />
2) A yearly USD200 million ceiling on Thai firms investing<br />
in or lending to affiliated companies overseas has been<br />
scrapped. Lending to non-affiliated companies is now<br />
permitted up to an annual limit of USD50 million.<br />
3) Purchase of overseas property is now allowed up to an<br />
annual limit of USD10 million (previous: USD5 million).<br />
4) Transactions in equity derivatives by non-residents with<br />
no physical <strong>set</strong>tlement – where <strong>the</strong>re is no exchange of<br />
underlying shares – must be <strong>set</strong>tled in <strong>for</strong>eign currency.<br />
Our initial thoughts are that <strong>the</strong>se measures will not alter<br />
balance of payments significantly. In general, it is difficult<br />
<strong>for</strong> emerging market central banks to reduce net inflows<br />
by easing restrictions on outflows. After all, <strong>the</strong><br />
favourable growth and interest rate differential in<br />
emerging markets against developed countries imply less<br />
incentive <strong>for</strong> Thai residents to invest or lend abroad.<br />
Fur<strong>the</strong>rmore, <strong>the</strong> quantum of investible savings or wealth<br />
in developed countries would be larger than in developing<br />
countries. This is why it would be difficult <strong>for</strong> <strong>the</strong> central<br />
bank to avoid some <strong>for</strong>m of control or tax on capital<br />
inflows. This could take <strong>the</strong> <strong>for</strong>m of unremunerated<br />
reserve requirement or tobin tax, but we continue to<br />
emphasize that <strong>the</strong> authority will be extremely careful not<br />
to close <strong>the</strong> tap completely or send <strong>the</strong> wrong signal to<br />
<strong>for</strong>eign investors (like in Dec 2006).<br />
We maintain Thai GDP <strong>for</strong>ecast <strong>for</strong> 2010 at 9%. The<br />
stronger-than-expected 2Q10 growth points to 9% full-year<br />
growth, which is far higher than consensus expectation of<br />
7.0%. Growth will be driven by both domestic demand and<br />
exports. In 2011, we expect <strong>the</strong> economy to normalize at<br />
4.0% growth. And from 2011 onwards, <strong>the</strong>re is a good<br />
chance that private investment will accelerate (relative to<br />
2006-08) despite political uncertainties. This is simply<br />
because investments have not seen a cyclical upswing since<br />
2005, when political uncertainties peaked.<br />
We expect 2010 inflation at 3.0%. Inflation is unlikely to be<br />
a major concern in this part of <strong>the</strong> cycle, but a low base and<br />
removal of subsidies are bound to keep prices firm in 2010<br />
and 2011, and inflation is likely to rise to 3.0% in 2010 and<br />
2.8% in 2011. There<strong>for</strong>e, timely rate normalization is<br />
critical.<br />
Expect two more 25bps rate hikes in 4Q10. The central bank<br />
also commented on <strong>the</strong> appropriate level of interest rates,<br />
noting that real interest rates were still negative and that<br />
rates still needed to normalize. This affirms our (aboveconsensus)<br />
expectation <strong>for</strong> two more 25bps rate hikes in<br />
4Q10. Note that <strong>the</strong> Monetary Policy Committee (MPC) will<br />
have two more meetings this year to decide on policy rates<br />
on 20 Oct and 1 Dec 2010. By mid-2011, we expect rates<br />
to have risen to 3.00% from 1.75% currently.<br />
Page 44
Regional ETF Focus<br />
<strong>Get</strong> <strong>set</strong> <strong>for</strong> a <strong>liquidity</strong> <strong>rally</strong><br />
Malaysia (Neutral) (Wong Ming Tek and Malaysia Team, mingtek@hwangdbsvickers.com.my)<br />
Near term outlook<br />
We <strong>for</strong>esee positive domestic factors <strong>for</strong> Malaysia such as<br />
<strong>the</strong> country's trans<strong>for</strong>mation program, push to improve<br />
public transportation in <strong>the</strong> 10th Malaysian Plan,<br />
redevelopment of government land and measures to<br />
improve <strong>the</strong> market's investability.<br />
We raised our year-end KLCI target to 1,520. For 2011, our<br />
year-end target is 1,650, based on 14x <strong>for</strong>ward earnings.<br />
target <strong>the</strong> KLCI to reach 1,500 points (14x 2011 earnings)<br />
by end-2010.<br />
Private sector friendly<br />
PM Datuk Seri Najib Tun Razak announced budget <strong>for</strong> 2011<br />
on 13 October. Budget 2011 emphasized measures to<br />
encourage private sector to drive growth. The PM<br />
reaffirmed commitment to <strong>the</strong> RM40bn high impact MRT<br />
project that will start in 2011. We believe its successful<br />
completion will be instrumental in trans<strong>for</strong>ming Malaysia to<br />
a high income nation.<br />
The federal government has targeted to bring <strong>the</strong> fiscal<br />
deficit down to below 3% by 2015. And reducing <strong>the</strong><br />
budget deficit by just 0.2%-pt this time round could ei<strong>the</strong>r<br />
suggest more aggressive consolidation going <strong>for</strong>ward or a<br />
lack of motivation in its fiscal target. Not withstanding <strong>the</strong><br />
toll of its costly subsidy programme, <strong>the</strong>re is a strong need<br />
<strong>for</strong> alternative revenue source as <strong>the</strong> sustainability of <strong>the</strong><br />
fiscal position has been over-reliant on direct taxes and <strong>the</strong><br />
oil revenue. Dividend payouts from Petronas account <strong>for</strong><br />
about 35% of <strong>the</strong> country’s direct tax revenue in 2009<br />
Fig. 21: Malaysia GDP per capita<br />
'000 MYR<br />
40<br />
35<br />
30<br />
25<br />
20<br />
15<br />
There was no increase in property tax or measure to reduce<br />
loan-to-value ratio. Positively, <strong>the</strong>re were incentives to<br />
promote home ownership. There was also no additional tax<br />
on gaming companies or brewers. The government had<br />
recently postponed <strong>the</strong> implementation of <strong>the</strong> Goods &<br />
Services Tax (GST). There will be no toll rate increases <strong>for</strong><br />
PLUS projects over next 5 years. These signals could fuel<br />
expectations of an early election.<br />
O<strong>the</strong>r than <strong>the</strong> RM40bn Mass Rapid Transit (MRT) project<br />
which will be implemented in 2011, <strong>the</strong>re were also several<br />
initiatives <strong>for</strong> public-private partnerships including six new<br />
highway projects including <strong>the</strong> West Coast Highway. O<strong>the</strong>r<br />
mega projects also include RM26bn financial district to start<br />
in 2011, PNB's RM5bn 100-storey tower.<br />
More fiscal consolidation needed<br />
The federal government has managed to meet its original<br />
fiscal deficit target of 5.6% of nominal GDP in FY 2010 as<br />
higher than expected expenditure was met with strong<br />
revenue collection due to robust economic growth and<br />
stable oil prices. And <strong>for</strong> 2011, <strong>the</strong> official fiscal deficit<br />
target has been lowered to 5.4% although we think that an<br />
anticipated rise in oil prices going <strong>for</strong>ward could bring about<br />
higher oil revenue and deliver a lower final deficit of 5.2%<br />
of GDP.<br />
10<br />
5<br />
0<br />
91 93 95 97 99 01 03 05 07 09 11 13 15<br />
Source: Datastream, <strong>DBS</strong><br />
Drivers:<br />
In our view, <strong>the</strong> approach and ideas/initiatives of <strong>the</strong><br />
program inspire optimism. If implemented successfully, <strong>the</strong>se<br />
programs could help fundamentally trans<strong>for</strong>m <strong>the</strong> country<br />
and attract major investments to stimulate growth.<br />
10MP boost. The 10th Malaysia Plan (10MP) outlines <strong>the</strong><br />
macroeconomic framework and strategies <strong>for</strong> 2011-2015.<br />
The government intends to facilitate greater private sector<br />
participation to drive economic growth over <strong>the</strong> next 5<br />
years. Several contracts have since been awarded where<br />
contractors are also responsible <strong>for</strong> financing - easing <strong>the</strong><br />
pressure on government's finances.<br />
The plan increased its emphasis on improving public<br />
transportation systems with projects such as LRT extensions<br />
and MRT. In our view, <strong>the</strong> construction sector has more<br />
upside with <strong>the</strong> award of <strong>the</strong>se projects. The MRT could<br />
double Gamuda's order book and triple MMC's.<br />
Page 45
Regional ETF Focus<br />
<strong>Get</strong> <strong>set</strong> <strong>for</strong> a <strong>liquidity</strong> <strong>rally</strong><br />
We understand <strong>the</strong>re has been a pick-up in <strong>the</strong> number of<br />
construction and infrastructure tenders. Although<br />
competition remains keen, we see more positive project<br />
news flow <strong>for</strong> <strong>the</strong> sector in <strong>the</strong> coming months.<br />
Government land sales. Apart from <strong>the</strong> construction and<br />
infrastructure projects, we are optimistic over <strong>the</strong> valueenhancement<br />
opportunities from <strong>the</strong> redevelopment of<br />
strategic government land. We expect MRCB's appointment<br />
as master developer of <strong>the</strong> Rubber Research Institute<br />
Malaysia (RRIM) land to be a key catalyst <strong>for</strong> <strong>the</strong> stock.<br />
Government linked companies (GLCs) and players with<br />
strong balance sheets could be winners <strong>for</strong> such projects.<br />
Resilient domestic demand. Following <strong>the</strong> strong 2Q10 GDP<br />
growth of 8.9% YoY, we expect 2H10 growth to moderate<br />
- due to <strong>the</strong> erosion of <strong>the</strong> low base coupled with a general<br />
slowdown in global growth momentum. Despite <strong>the</strong><br />
projected moderation in 2H10, full year growth is expected<br />
to be a solid 8% and healthy 5.5% in 2011, on <strong>the</strong> back of<br />
resilient domestic demand. The resilient domestic demand<br />
bodes well <strong>for</strong> banks, as positive sentiment would drive<br />
demand <strong>for</strong> consumer and business loans. O<strong>the</strong>r<br />
beneficiaries are Tenaga and aviation-related plays such as<br />
AirAsia and Malaysia Airports. We also believe it could boost<br />
demand <strong>for</strong> big-ticket items (such as property; our sector<br />
picks: SP Setia, E&O, Bolton).<br />
Improve investability. We expect fur<strong>the</strong>r divestments in<br />
government linked company (GLC) stakes, privatizations and<br />
M&A to increase free float, <strong>liquidity</strong> and valuations. This<br />
toge<strong>the</strong>r should help attract <strong>for</strong>eign interests - which remain<br />
at relatively low levels (c.21%).<br />
Risks:<br />
Delays in execution of <strong>the</strong> trans<strong>for</strong>mation program or rollout<br />
of infrastructure projects. There will definitely be major<br />
challenges and resistance. Implementation is a key test <strong>for</strong><br />
<strong>the</strong> government and economic trans<strong>for</strong>mation.<br />
Fig. 25: Singapore and Hong Kong listed ETFs exposed to Thailand / Indonesia / Malaysia / Vietnam markets<br />
ETF Ticker Mkt Cap Style Exchange Underlying Ccy Bid NAV/ Premium/ Avg Daily Avg Daily<br />
(US$ m) Index Price INAV Discount Volume Value (US$m)<br />
Tracker 15-Oct (latest) (20 day) (20 day)<br />
ETFs exposed to Malaysia<br />
Lyxor Malaysia MAL SP Equity 31 Country Fund Malaysia MXMY U$ 9.04 8.96 0.4% 108,764 0.946<br />
DBXT MSCI Malaysia LG6 SP Equity 4 Country Fund Malaysia NDDUMAF S$ 12.32 12.32 -0.4% 3,905 0.047<br />
FTSE Bursa Malaysia KLCI FBM30 MK Equit 1.6 Growth Malaysia FBMKLCI M$ 1.49 1.50 -0.4% 630.6 0.3<br />
MYETF DJ Islamic Titans 2DJIM25 MK Equit 202.5 Sector Funds Malaysia DJMY25 M$ 0.92 0.91 0.9% 3,610.4 1.0<br />
ETFs exposed to Indonesia<br />
DBXT MSCI Indonesia XMIN SP Equity 96 Country Fund Indonesia NDEUINF U$ 14.60 14.41 0.8% 202,166 2.900<br />
ETFs exposed to Thailand<br />
DBXT MSCI Thailand LG7 SP Equity 25 Country Fund Thailand NDEUTHF U$ 15.86 15.84 -0.2% 28,493 0.429<br />
ThaiDEX SET50 ETF TDEX TB Equity 80.0 Country Fund Thailand SET50 TB 6.93 6.93 0.1% 1,801.3 0.402<br />
ThaiDEX FTSE SET Large CTFTSE TB Equity 4.0 Country Fund Thailand FSTHL TB 11.93 11.96 0.1% 1.9 0.001<br />
Mtrack Energy ETF ENGY TB Equity 7.9 Group Funds Thailand N/A TB 5.04 4.98 1.2% 160.3 0.026<br />
ETFs exposed to Vietnam<br />
DBXT FTSE Vietnam XFVT SP Equity 248 Country Fund Vietnam FVTTE U$ 37.37 36.64 2.0% 30,746 1.128<br />
DBXT FTSE Vietnam 3087 HK Equity 248 Country Fund Vietnam FVTTE K$ 289.80 284.55 2.0% 30 1.124<br />
Source: Bloomberg. Notes: HK-listed ETFs - Vol in ‘000s, Price and NAV are in HKD unless o<strong>the</strong>rwise stated. SG-listed ETFs – Actual vol traded, Price<br />
and NAV are in US$ unless o<strong>the</strong>rwise indicated.<br />
Page 46
Regional ETF Focus<br />
<strong>Get</strong> <strong>set</strong> <strong>for</strong> a <strong>liquidity</strong> <strong>rally</strong><br />
Disclaimer:<br />
The in<strong>for</strong>mation herein is published by <strong>DBS</strong> Bank Ltd (<strong>the</strong> “Company”). It is based on in<strong>for</strong>mation obtained from sources<br />
believed to be reliable, but <strong>the</strong> Company does not make any representation or warranty, express or implied, as to its accuracy,<br />
completeness, timeliness or correctness <strong>for</strong> any particular purpose. Opinions expressed are subject to change without notice.<br />
Any recommendation contained herein does not have regard to <strong>the</strong> specific investment objectives, financial situation and <strong>the</strong><br />
particular needs of any specific addressee. The in<strong>for</strong>mation herein is published <strong>for</strong> <strong>the</strong> in<strong>for</strong>mation of addressees only and is<br />
not to be taken in substitution <strong>for</strong> <strong>the</strong> exercise of judgement by addressees, who should obtain separate legal or financial<br />
advice. The Company, or any of its related companies or any individuals connected with <strong>the</strong> group accepts no liability <strong>for</strong> any<br />
direct, special, indirect, consequential, incidental damages or any o<strong>the</strong>r loss or damages of any kind arising from any use of<br />
<strong>the</strong> in<strong>for</strong>mation herein (including any error, omission or misstatement herein, negligent or o<strong>the</strong>rwise) or fur<strong>the</strong>r<br />
communication <strong>the</strong>reof, even if <strong>the</strong> Company or any o<strong>the</strong>r person has been advised of <strong>the</strong> possibility <strong>the</strong>reof. The<br />
in<strong>for</strong>mation herein is not to be construed as an offer or a solicitation of an offer to buy or sell any securities, futures, options<br />
or o<strong>the</strong>r financial instruments or to provide any investment advice or services. The Company and its associates, <strong>the</strong>ir directors,<br />
officers and/or employees may have positions or o<strong>the</strong>r interests in, and may effect transactions in securities mentioned herein<br />
and may also per<strong>for</strong>m or seek to per<strong>for</strong>m broking, investment banking and o<strong>the</strong>r banking or financial services <strong>for</strong> <strong>the</strong>se<br />
companies. The in<strong>for</strong>mation herein is not intended <strong>for</strong> distribution to, or use by, any person or entity in any jurisdiction or<br />
country where such distribution or use would be contrary to law or regulation.<br />
Licence No.: MICA (P) 073/11/2009<br />
Page 47


