Motion Graphs Practice
Motion Graphs Practice
Motion Graphs Practice
- No tags were found...

You also want an ePaper? Increase the reach of your titles
YUMPU automatically turns print PDFs into web optimized ePapers that Google loves.
A<br />
Name ____________________________<br />
Date _________________________<br />
Regents Physics Linear <strong>Motion</strong> WS #4<br />
Period _______<br />
Mrs. Libretto<br />
(18 pts)<br />
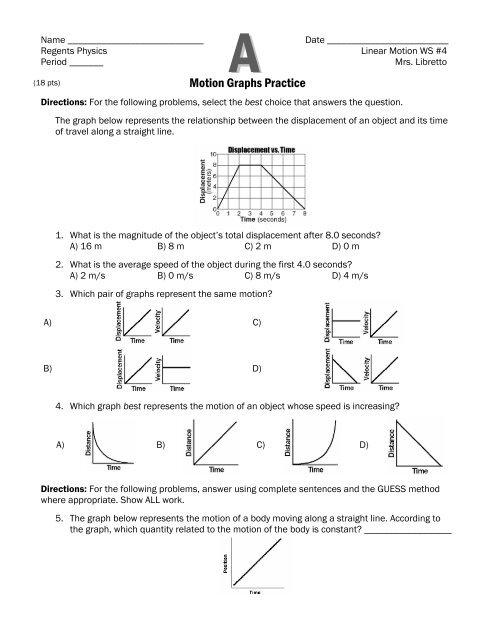
<strong>Motion</strong> <strong>Graphs</strong> <strong>Practice</strong><br />
Directions: For the following problems, select the best choice that answers the question.<br />
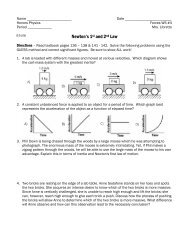
The graph below represents the relationship between the displacement of an object and its time<br />
of travel along a straight line.<br />
1. What is the magnitude of the object’s total displacement after 8.0 seconds<br />
A) 16 m B) 8 m C) 2 m D) 0 m<br />
2. What is the average speed of the object during the first 4.0 seconds<br />
A) 2 m/s B) 0 m/s C) 8 m/s D) 4 m/s<br />
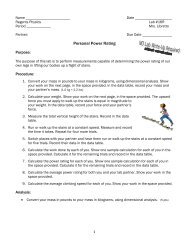
3. Which pair of graphs represent the same motion<br />
A) C)<br />
B) D)<br />
4. Which graph best represents the motion of an object whose speed is increasing<br />
A) B) C) D)<br />
Directions: For the following problems, answer using complete sentences and the GUESS method<br />
where appropriate. Show ALL work.<br />
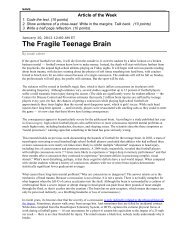
5. The graph below represents the motion of a body moving along a straight line. According to<br />
the graph, which quantity related to the motion of the body is constant __________________
Linear <strong>Motion</strong> WS #4 (page 2)<br />
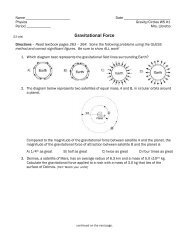
6. The graph below represents the relationship between distance and time for an object. What is<br />
the instantaneous speed of the object at t = 5.0 seconds<br />
7. The diagram below shows a worker moving a 50.0 kilogram safe up a ramp by applying a<br />
constant force of 300. Newtons parallel to the ramp. The data table shows the position of the<br />
safe as a function of time.<br />
a. Using the information in the data<br />
table, construct a line graph. Plot<br />
the data points and draw the<br />
best-fit line.<br />
b. Calculate the slope of the best fit<br />
line. Show ALL work using the<br />
GUESS method.<br />
c. Using one or more complete sentences, explain the physical significance of the slope<br />
of the graph.