Dingee Reservoir Final Seismic Report - East Bay Municipal Utility ...
Dingee Reservoir Final Seismic Report - East Bay Municipal Utility ...
Dingee Reservoir Final Seismic Report - East Bay Municipal Utility ...
- No tags were found...

Create successful ePaper yourself
Turn your PDF publications into a flip-book with our unique Google optimized e-Paper software.
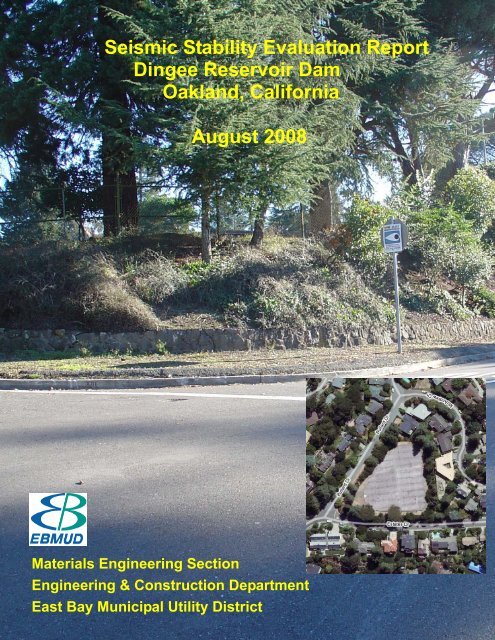
<strong>Seismic</strong> Stability Evaluation <strong>Report</strong><br />
<strong>Dingee</strong> <strong>Reservoir</strong> Dam<br />
Oakland, California<br />
August 2008<br />
Materials Engineering Section<br />
Engineering & Construction Department<br />
<strong>East</strong> <strong>Bay</strong> <strong>Municipal</strong> <strong>Utility</strong> District
<strong>Seismic</strong> Stability Evaluation <strong>Report</strong><br />
<strong>Dingee</strong> <strong>Reservoir</strong> Dam<br />
Oakland, California<br />
August 2008<br />
Materials Engineering Section<br />
Engineering & Construction Department<br />
<strong>East</strong> <strong>Bay</strong> <strong>Municipal</strong> <strong>Utility</strong> District<br />
Yogesh Prashar, P.E., G.E.<br />
Associate Civil Engineer<br />
Atta B. Yiadom, P.E.<br />
Senior Civil Engineer
<strong>Seismic</strong> Stability Evaluation <strong>Report</strong><br />
<strong>Dingee</strong> <strong>Reservoir</strong> Dam<br />
Oakland, California<br />
Table of Contents<br />
EXECUTIVE SUMMARY...........................................................................................................................................1<br />
1.0 INTRODUCTION....................................................................................................................................- 1 -<br />
1.1 BACKGROUND........................................................................................................................................ - 1 -<br />
1.2 SCOPE OF WORK .................................................................................................................................... - 1 -<br />
1.3 PROJECT AUTHORIZATION...................................................................................................................... - 1 -<br />
1.4 PROJECT TEAM....................................................................................................................................... - 1 -<br />
1.4.1 District Staff......................................................................................................................................- 1 -<br />
1.4.2 Consultants .......................................................................................................................................- 2 -<br />
2.0 PROJECT DESCRIPTION.....................................................................................................................- 3 -<br />
2.1 SITE SETTING ......................................................................................................................................... - 3 -<br />
2.2 DESCRIPTION OF RESERVOIR AND DAM ................................................................................................. - 3 -<br />
2.3 RESERVOIR OUTLET AND DRAINAGE ..................................................................................................... - 4 -<br />
2.3.1 Emergency Spillway Structure..........................................................................................................- 4 -<br />
2.3.2 <strong>Reservoir</strong> Lining ...............................................................................................................................- 4 -<br />
2.3.3 Surface Drainage Facilities..............................................................................................................- 4 -<br />
3.0 GEOTECHNICAL EXPLORATION AND LABORATORY TESTING...........................................- 5 -<br />
3.1 REVIEW OF EXISTING INFORMATION...................................................................................................... - 5 -<br />
3.2 FIELD EXPLORATION PROGRAM ............................................................................................................. - 5 -<br />
3.2.1 Previous Investigations.....................................................................................................................- 5 -<br />
3.2.2 Subsurface Investigation for This Study............................................................................................- 6 -<br />
3.2.3 Dam Surveillance Instrumentation ...................................................................................................- 7 -<br />
3.3 LABORATORY TESTING .......................................................................................................................... - 9 -<br />
4.0 GEOLOGIC AND GROUND MOTIONS STUDIES .........................................................................- 10 -<br />
4.1 GEOLOGIC STUDY ................................................................................................................................-10-<br />
4.2 GROUND MOTION STUDY..................................................................................................................... - 10 -<br />
5.0 SUBSURFACE CONDITIONS.............................................................................................................- 11 -<br />
6.0 DAM MATERIAL PROPERTIES.......................................................................................................- 12 -<br />
6.1 GENERAL.............................................................................................................................................. - 12 -<br />
6.2 CLASSIFICATION AND INDEX TESTS ..................................................................................................... - 12 -<br />
6.3 LIQUEFACTION POTENTIAL/LOSS OF SHEAR STRENGTH....................................................................... - 13 -<br />
6.4 SHEAR STRENGTH ................................................................................................................................-14-<br />
6.4.1 Effective Shear Strength Failure Envelope.....................................................................................- 14 -<br />
6.4.2 Total Shear Strength Failure Envelope ..........................................................................................- 14 -<br />
7.0 STABILITY EVALUATIONS..............................................................................................................- 16 -<br />
7.1 GENERAL APPROACH TO EVALUATION ................................................................................................ - 16 -<br />
7.2 DAM PROFILE AND CROSS-SECTION..................................................................................................... - 16 -<br />
7.3 LONG-TERM STATIC STABILITY ........................................................................................................... - 17 -<br />
7.4 SHORT-TERM SEISMIC STABILITY ........................................................................................................ - 17 -<br />
7.4.1 Yield Acceleration Evaluation ........................................................................................................- 18 -<br />
7.4.2 Earthquake-Induced Newmark Displacements...............................................................................- 19 -<br />
7.5 SHORT-TERM RAPID DRAWDOWN STABILITY...................................................................................... - 20 -<br />
8.0 CONCLUSIONS AND SUMMARY OF DAM PERFORMANCE....................................................- 21 -<br />
REFERENCES .....................................................................................................................................................- 22 -<br />
<strong>Seismic</strong> Stability Evaluation <strong>Report</strong> - i -<br />
<strong>Dingee</strong> <strong>Reservoir</strong> Dam August 2008
<strong>Seismic</strong> Stability Evaluation <strong>Report</strong><br />
<strong>Dingee</strong> <strong>Reservoir</strong> Dam<br />
Oakland, California<br />
Tables<br />
Table 1 Boring Logs Summary Data Table<br />
Table 2A Laboratory Index Tests and Results Location<br />
Table 2B Laboratory Shear Strength Tests and Results Location<br />
Table 3 Average of the Index Test Results<br />
Table 4A Effective Shear Strength Parameters<br />
Table 4B Total Shear Strength Parameters<br />
Table 5 Long-Term Static Slope Stability Analysis Results – Factors of Safety<br />
Table 6 <strong>Seismic</strong> Slope Stability Analysis Results (Water El = 768 ft) Factor of Safety<br />
Table 7 <strong>Seismic</strong> Slope Stability Analysis Results (Water El = 772 ft) Factor of Safety<br />
Table 8 <strong>Seismic</strong> Slope Stability - Yield Coefficients (FS ~1.0)<br />
Table 9 Newmark Slope Displacement Estimates – Average of 3 Earthquakes<br />
Table 10 Rapid Drawdown Slope Stability Analysis Results<br />
Plates<br />
Plate 1 Site Vicinity Map and Air Photo<br />
Plate 2 Dam and Boring Location Map & Site Photograph<br />
Plate 3 Generalized Soil Profile @ Centerline of Main Dam Roadway – Profile A-A’<br />
Plate 4 Section B-B’ @ Station 1+11<br />
Plate 5 <strong>Reservoir</strong> Storage, Piezometer Levels, and Precipitation History<br />
Plate 6A <strong>Reservoir</strong> Storage, Horizontal Movement, and Precipitation History<br />
Plate 6B <strong>Reservoir</strong> Storage, Vertical Movement, and Precipitation History<br />
Plate 7 Atterberg Limits of Cohesive Soils – Fill & Native Material<br />
Plate 8 Moisture Content Versus Elevation<br />
Plate 9 Total Density Versus Elevation<br />
Plate 10 Dry Density Versus Elevation<br />
Plate 11 Void Ratio Versus Elevation<br />
Plate 12 Effective Stress Strength Envelope – Fill Material<br />
Plate 13 Effective Stress Strength Envelope – Native Materials<br />
Plate 14 Effective Stress Strength Envelopes – Sandstone Bedrock<br />
Plate 15 Total Stress Strength Envelope – Fill Material<br />
Plate 16 Total Stress Strength Envelope – Native Materials<br />
Plate 17 Total Stress Strength Envelope – Sandstone Bedrock<br />
Plate 18 Upstream - Long Term Slope Stability Analysis – WSL = 768’<br />
Plate 19 Downstream - Long Term Slope Stability Analysis – WSL = 768’<br />
Plate 20 Downstream - Long Term Slope Stability Analysis – WSL = 768’<br />
Plate 21 Upstream – Pseudo-Dynamic Slope Stability Analysis – WSL = 768’<br />
Plate 22 Downstream - Pseudo-Dynamic Slope Stability Analysis – WSL = 768’<br />
Plate 23 Rapid Drawdown Slope Stability Analysis – Res. Elev. = 768’<br />
Plate 24 Rapid Drawdown Slope Stability Analysis – Res. Elev. = 755.9’<br />
Plate 25 Newmark Displacement Analysis – Kobe, Kocaeli, and Landers Earthquake<br />
<strong>Seismic</strong> Stability Evaluation <strong>Report</strong> - ii -<br />
<strong>Dingee</strong> <strong>Reservoir</strong> Dam August 2008
<strong>Seismic</strong> Stability Evaluation <strong>Report</strong><br />
<strong>Dingee</strong> <strong>Reservoir</strong> Dam<br />
Oakland, California<br />
APPENDIX A<br />
Logs of Borings<br />
Appendices<br />
APPENDIX B<br />
APPENDIX C<br />
APPENDIX D<br />
APPENDIX E<br />
Laboratory Test Results<br />
Reference Drawings<br />
Geologic Evaluation <strong>Report</strong> – Joyce Associates (Subcontractor to Alan<br />
Kropp and Associates)<br />
Ground Motion Studies – Pacific Engineering & Analysis, (Subcontractor<br />
to Alan Kropp and Associates)<br />
<strong>Seismic</strong> Stability Evaluation <strong>Report</strong> - iii -<br />
<strong>Dingee</strong> <strong>Reservoir</strong> Dam August 2008
Executive Summary<br />
<strong>Seismic</strong> Stability Evaluation <strong>Report</strong><br />
<strong>Dingee</strong> <strong>Reservoir</strong> Dam<br />
Oakland, California<br />
This report presents the results of a seismic stability evaluation of the <strong>Dingee</strong> <strong>Reservoir</strong> Dam,<br />
located in Oakland, California. This study is part of an ongoing dam safety program by the <strong>East</strong><br />
<strong>Bay</strong> <strong>Municipal</strong> <strong>Utility</strong> District (District) to assess the static and seismic performance of its dams.<br />
<strong>Dingee</strong> <strong>Reservoir</strong> is a 4.2-million gallon (MG) open-cut reservoir and is located south of the<br />
intersection of Estates Drive and Bullard Drive in Oakland, California. The reservoir is bound<br />
by Estates Drive to the west and Bullard Drive to the north.<br />
The reservoir was originally constructed in 1894 and was modified twice, once in 1931 for the<br />
construction of a new roof and lining, and again in 1939 for the construction of a new west curb,<br />
that parallels Estates Drive. The embankment fill was constructed using the excavated on-site<br />
native soils and Franciscan Sandstone and Shale materials. The Hayward Fault zone lies about<br />
1100 feet east of the reservoir (dam).<br />
The objective of the study is to evaluate the performance of the dam during the Maximum<br />
Credible Earthquake (MCE) on the Hayward Fault, the controlling seismic source for the site.<br />
Although the dam is not under the jurisdiction of the State of California Division of Safety of<br />
Dams (DSOD), similar evaluation standards were used for this dam as are used for jurisdictional<br />
dams. The performance goal is to ensure that the dam withstands the MCE without an<br />
uncontrolled release of reservoir water.<br />
To evaluate the performance of the dam, we conducted field investigations including drilling and<br />
logging of exploratory borings, and installation of an inclinometer. Laboratory testing included<br />
identification, index and strength tests. Using this information, we performed engineering<br />
analyses to estimate potential deformation of the dam when subjected to the controlling seismic<br />
event.<br />
No known active fault trace is present at the site; thus earthquake-induced ground rupture is not<br />
anticipated. The embankment and foundation materials of the dam are stiff and clayey in nature<br />
and are not likely to liquefy or undergo significant strength loss, due to a seismic event.<br />
We conclude from the investigations and analyses that the fill and foundation materials of the<br />
dam will perform satisfactorily when subjected to ground shaking from the MCE of magnitude<br />
7.25 on the Hayward Fault. The results of the seismic analyses indicate less than one foot of<br />
crest settlement under this scenario. Since the reservoir is operated with the average water level<br />
at least four to five feet below the spillway level, uncontrolled release of water due to<br />
overtopping is not expected.<br />
The Dam is also deemed to be stable under rapid drawdown conditions, which would occur if the<br />
reservoir needed to be lowered in case of natural or operational emergencies.<br />
<strong>Seismic</strong> Stability Evaluation <strong>Report</strong><br />
<strong>Dingee</strong> <strong>Reservoir</strong> Dam<br />
1<br />
August 2008
1.0 Introduction<br />
1.1 Background<br />
This report presents the results of a seismic stability evaluation of the <strong>Dingee</strong> <strong>Reservoir</strong> Dam,<br />
located in Oakland, California (see Plate 1, Site Vicinity Map and Air Photo). This study is part<br />
of an ongoing dam safety program by the <strong>East</strong> <strong>Bay</strong> <strong>Municipal</strong> <strong>Utility</strong> District (District) to assess<br />
the static and seismic performance of its dams.<br />
1.2 Scope of Work<br />
The objectives of this study are to evaluate the performance of the Dam during the Maximum<br />
Credible Earthquake (MCE) on the controlling seismic source, to ensure that the dam withstands<br />
the MCE without an uncontrolled release of reservoir water, and to maintain the ability to drain<br />
the reservoir in an emergency. An additional goal of the District is to have a functioning<br />
reservoir system that could be relied on to serve its customers after the MCE event.<br />
In order to accomplish the objectives and goals of the study, the following tasks were performed:<br />
<br />
<br />
<br />
<br />
<br />
<br />
<br />
Collected and reviewed available geotechnical reports and construction data.<br />
Performed geotechnical field explorations including rotary wash drilling, soil and rock<br />
sampling, and an inclinometer installation.<br />
Performed laboratory testing including identification, index, and shear strength tests. The<br />
District’s Materials Testing Laboratory performed these tests.<br />
Performed a geological evaluation of the site and developed earthquake ground motions.<br />
Developed representative dam cross-sections and corresponding phreatic surfaces.<br />
Evaluated the stability of the reservoir Dam for static, seismic, and rapid drawdown<br />
conditions.<br />
Prepared an engineering report documenting the results of the field exploration,<br />
engineering analyses, and conclusions regarding the performance of the dam.<br />
1.3 Project Authorization<br />
This project was approved in August 2006 and is funded under the District’s Dam Safety<br />
Program.<br />
1.4 Project Team<br />
1.4.1 District Staff<br />
Several individuals participated in the successful completion of this project. Mr. Robert<br />
Winterer conducted and managed a majority of the field investigations. Mr. Bill Lew performed<br />
the in-house laboratory testing program. Mr. Hon Fung Chan compiled the entire field and<br />
laboratory testing results, and Ms. Ginger Zhang performed the computer runs for the slope<br />
stability analyses. Mr. Yogesh Prashar performed the seismic slope deformation estimates. Mr.<br />
<strong>Seismic</strong> Stability Evaluation <strong>Report</strong><br />
<strong>Dingee</strong> <strong>Reservoir</strong> Dam<br />
1<br />
August 2008
Yogesh Prashar is principal investigator and project manager and is responsible for the analyses<br />
and the report, which was completed under the supervision of Mr. Atta Yiadom.<br />
1.4.2 Consultants<br />
Mr. Wayne Magnusen and Ms. Dona Mann of Alan Kropp and Associates (AKA) were the<br />
overall consultant project managers for the study and provided geotechnical peer review services<br />
for the project. Mr. James Joyce, of Joyce and Associates, performed the engineering geologic<br />
services, and was a sub-consultant to AKA. Dr. Walt Silva of Pacific Engineering and Analysis<br />
was also a sub-consultant to AKA and developed earthquake ground motions which were used in<br />
the deformation analysis.<br />
The consultant scope of work consisted of reviewing existing information; providing<br />
geotechnical, geologic, and seismologic data. The consultant review comments have been<br />
incorporated into the final report and they have found the approach, the analysis, and conclusions<br />
of this report to be satisfactory.<br />
<strong>Seismic</strong> Stability Evaluation <strong>Report</strong><br />
<strong>Dingee</strong> <strong>Reservoir</strong> Dam<br />
2<br />
August 2008
2.0 Project Description<br />
2.1 Site Setting<br />
The aerial photo of the reservoir is shown below and the general layout of the reservoir and the<br />
site location map are shown on Plate 1. The site is located southeast of the intersection of<br />
Estates Drive and Bullard Drive in Oakland, California. The reservoir is bound by Estates Drive<br />
to the west, Bullard Drive to the north, and McAndrews Drive to the south. The site is<br />
surrounded by residences. The site is accessible to foot and vehicular traffic via a gated entrance<br />
on Bullard Drive near the intersection of Estates Drive and Bullard Drive.<br />
N<br />
Site Aerial Photo<br />
2.2 Description of <strong>Reservoir</strong> and Dam<br />
<strong>Dingee</strong> <strong>Reservoir</strong> was originally constructed in 1894 by the Oakland Water Company (owned by<br />
William J. <strong>Dingee</strong>), a company that pre-dated the formation of <strong>East</strong> <strong>Bay</strong> <strong>Municipal</strong> <strong>Utility</strong><br />
District (District) in 1923. The reservoir has been modified twice: once in 1931 for the<br />
construction of a new roof and lining, and once in 1939 for the construction of a new west curb<br />
and other improvements. Estates <strong>Reservoir</strong> is located about 1500 feet southeast of this reservoir.<br />
<strong>Seismic</strong> Stability Evaluation <strong>Report</strong><br />
<strong>Dingee</strong> <strong>Reservoir</strong> Dam<br />
3<br />
August 2008
The Dam has a crest level at approximately Elevation 773.5 feet above Mean Sea Level (MSL)<br />
(National Geodetic Vertical Datum, 1929) with a crest width of 15 feet, a maximum height of<br />
about 18 feet, and a storage capacity of approximately 4.2 million gallons at the overflow<br />
elevation of 772 feet. The dam fill materials consist of excavated material from Franciscan<br />
Sandstone and Shale. The upstream slope of the dam embankment has a slope of about 2<br />
Horizontal to 1 Vertical. The maximum downstream slope of the dam embankment has a slope<br />
of about 1.3 Horizontal to 1 Vertical. The reservoir basin floor is at Elevation 755.9 feet. The<br />
maximum depth of the reservoir is approximately 16 feet.<br />
2.3 <strong>Reservoir</strong> Outlet and Drainage<br />
Since 1999, the reservoir has been operated with the water surface typically ranging from<br />
Elevation 764 feet to 768 feet. In 2007, an additional drain valve was installed on Estates Drive<br />
to allow periodic drain valve exercises. Reference drawing 6318-G in Appendix C shows the<br />
overflow and drain system improvements.<br />
2.3.1 Emergency Spillway Structure<br />
The spillway structure is located near the southwest corner of the reservoir close to the left<br />
abutment of the dam. The spillway consists of a 1-foot by 2-foot drop-inlet-box. This structure<br />
is designed to discharge water in emergencies into a 10-inch wrought iron pipe, which leads to<br />
the old 10-inch outlet pipe. Spillway flow is transferred through a 12-inch cast iron pipe to a<br />
catch basin, and eventually drains into the storm drain. The 1939 construction improvements<br />
included a new location for the overflow, and the old 10-inch outlet line was converted for use as<br />
a drain-overflow pipe. The time required to drain the reservoir is approximately 13 hours.<br />
2.3.2 <strong>Reservoir</strong> Lining<br />
In 1931, a new lining was placed over the old lining. The 1931 lining consisted of a 3-inch<br />
gunite lining reinforced with 4-inch x 4-inch #10 mesh overlying approximately 2 feet of<br />
pneumatically tamped fill, which separates the old and new linings.<br />
2.3.3 Surface Drainage Facilities<br />
The surface drainage facilities, which primarily collect rainfall runoff from the reservoir roof,<br />
consist of V-Ditches with drop inlets and storm drain pipes around the reservoir perimeter.<br />
Rainfall on the roof runs off either east or west to the paved perimeter access road. The runoff<br />
flows across the access road to the V-Ditches and enters the drop inlets and the storm drain pipes<br />
which are connected to the City of Oakland storm drain system. Reference drawing 5553-G in<br />
Appendix C shows the drainage improvements, which included installation of perimeter V-<br />
Ditches and drop inlets that were made to the site in 1969.<br />
<strong>Seismic</strong> Stability Evaluation <strong>Report</strong><br />
<strong>Dingee</strong> <strong>Reservoir</strong> Dam<br />
4<br />
August 2008
3.0 Geotechnical Exploration and Laboratory Testing<br />
The geotechnical exploration program consisted of exploratory borings for subsurface<br />
investigation and installation of a new inclinometer. The laboratory testing program consisted of<br />
index and strength tests on the subsurface materials.<br />
3.1 Review of Existing Information<br />
To develop the field exploration program, we reviewed available geotechnical data from the<br />
following reports and documents:<br />
U.S. Geological Survey Geologic Map published in 1969.<br />
U.S. Geological Survey Landslide Map published in 1975.<br />
Alquist-Priolo Special Studies Zones Map published in 1982.<br />
1971 District piezometer boring logs and laboratory testing.<br />
3.2 Field Exploration Program<br />
3.2.1 Previous Investigations<br />
In 1971, the District drilled several geotechnical borings in and around the dam. Open standpipe<br />
piezometers were constructed at boring locations XV-1, 2, 3, and 8 upon completion of the<br />
borings. Plate 5808-G-2 in Appendix C, shows the locations of the previous borings/piezometers<br />
installed by District staff. Plate 5808-G-3 shows the stick logs of the borings.<br />
Analysis performed by the District in 1971 concluded that the reservoir is stable under long-term<br />
(static) and short term (earthquake and rapid drawdown) loading conditions. In 1991, Alan<br />
Kropp & Associates performed an investigation at 6045 Estates Drive, west of the dam fill.<br />
Laboratory index test results preformed for the previous investigations included: in-situ moisture<br />
contents and dry unit weights of the dam fill and of the foundation materials. The test results<br />
from these investigations are summarized on Table B-1 in Appendix B.<br />
Shear strength tests, including Unconfined Compression (UC) and Consolidated Undrained<br />
Triaxial Compression (TXCU) tests, were also performed for the previous investigations. The<br />
results of the previous shear strength tests are summarized on Plates B-3 and B-4 in Appendix B.<br />
<strong>Seismic</strong> Stability Evaluation <strong>Report</strong><br />
<strong>Dingee</strong> <strong>Reservoir</strong> Dam<br />
5<br />
August 2008
3.2.2 Subsurface Investigation for This Study<br />
The site investigation for this current study was conducted in the vicinity of the Dam in 2006.<br />
Three test borings were drilled along the crest (XV-11, XV-12, and XV-13), and two borings<br />
were drilled along the east curb of<br />
Estates Drive (XV-14 and XV-15) to<br />
obtain soil and rock samples for visual<br />
examination and laboratory testing.<br />
After we completed logging Boring<br />
XV-13, we installed a 3-inch diameter<br />
inclinometer casing and backfilled the<br />
hole with cement grout. All these<br />
borings were drilled and logged by<br />
District staff. Table 1 below shows a<br />
summary of the borings performed at<br />
the site along with depth, dates, tip<br />
elevations, type of drilling method<br />
used, etc. Plate 2 shows the dam and<br />
boring location map.<br />
No.<br />
Boring<br />
No.<br />
Photograph looking North along Dam Roadway<br />
Table 1: Boring Logs Summary Data Table<br />
Surface Depth to<br />
Elevation, Top Elevation,<br />
Elevation at Date of<br />
Elevation Bottom of<br />
of Sandstone Bottom of Fill<br />
Bottom (ft) Drilling<br />
(ft) Boring (ft) (ft) (ft)<br />
Type of Drilling<br />
1 XV-1 772.7 25.1 747.6 1971 755 758 Hollow Stem Auger<br />
2 XV-2 772.8 25.2 747.6 1971 Hollow Stem Auger<br />
3 XV-3 773.1 25.3 747.8 1971 758 761 Hollow Stem Auger<br />
4 XV-8 754.7 28.8 725.9 1971 733 736 Hollow Stem Auger<br />
5 XV-10 754 30 724 1971 725 730 Hollow Stem Auger<br />
6 XV-11 772.7 40.3 732.4 3/6/2006 755.7 758.2 Hollow Stem Auger<br />
7 XV-12 772.2 40.3 731.9 3/6/2006 744.2 750.2 Rotary Wash<br />
8 XV-13 773.2 50 723.2 3/7/2006 736.2 741.2 Hollow Stem Auger<br />
9 XV-14 754.2 30.7 723.5 3/8/2006 729.2 735.2 Rotary Wash<br />
10 XV-15 754.5 23.4 731.1 3/8/2006 741.5 744.5 Hollow Stem Auger<br />
Prior to drilling the borings, we performed the following pre-drilling activities:<br />
Identified and marked the proposed boring locations on site with white paint;<br />
Contacted Underground Service Alert (USA) Network. USA in turn alerted the various<br />
utility companies that a subsurface investigation was to be conducted near their utilities;<br />
Contacted the necessary District service centers and shops to clear any underground<br />
utilities within the reservoir;<br />
Contacted and notified the representatives of the District’s Workplace Health and Safety<br />
and Community Affairs groups; and<br />
Notified the neighbors of the proposed drilling schedule and other pertinent information.<br />
The borings were drilled with either CME-850 or B-53 Mobile Drill rig operated by Gregg<br />
Drilling and Testing Inc., of Martinez, California. Borings XV-11 and XV-13 were both<br />
<strong>Seismic</strong> Stability Evaluation <strong>Report</strong><br />
<strong>Dingee</strong> <strong>Reservoir</strong> Dam<br />
6<br />
August 2008
advanced using a hollow stem auger. Borings XV-12 and XV-14 were advanced using rotary<br />
wash drilling to reduce sample disturbance and stabilize the boreholes. The borings were drilled<br />
to a maximum depth of 50 feet below the existing ground surface through the dam fill and into<br />
the foundation materials.<br />
The subsurface materials were logged in the field by a District Materials Testing Technician,<br />
under the review and direction of the project manager. Samples for visual classification and<br />
laboratory index testing were obtained using a California (CAL) split-barrel sampler (3-inch<br />
outside diameter and 2.44-inch inside diameter). The CAL sampler was used in accordance with<br />
the American Society for Testing and Materials (ASTM) Method D 1586. The CAL sampler<br />
was driven 18 inches into the subsurface materials with a 140-pound automatic hammer falling<br />
30 inches. The penetration resistance (blow counts), measured in number of hammer blows to<br />
advance the sampler the final 12 inches (or a fraction thereof) of the 18-inch drive, were added<br />
and shown on the boring logs at the appropriate sample depth.<br />
Relatively undisturbed samples were obtained by using 36-inch long, thin-walled Pitcher tubes<br />
coated with resin (3-inch outside diameter with 0.065-inch wall thickness). The Pitcher tubes<br />
were used in accordance with the ASTM Method D 1587. The Pitcher tubes were advanced by<br />
steadily applying both hydraulic pressure and by rotary drilling appropriate to the resistance of<br />
the soil and rock.<br />
After careful withdrawal from the ground, the samples were visually inspected. Selected<br />
samples for index testing obtained with the CAL sampler were capped, taped, labeled, and<br />
transported in a padded box. The Pitcher tube samples were carefully placed upright, sealed with<br />
plastic caps, taped, and cleaned of disturbed soil at the ends of each tube.<br />
Field data and laboratory test results were used to classify the subsurface materials and to<br />
prepare boring logs that are presented in Appendix A. The boring logs include a visual<br />
classification of the soils based on the Unified Soil Classification System; an estimate of the<br />
relative density of cohesionless soils or consistency of fine-grained soils based on the blow<br />
counts; color, plasticity and moisture content. The laboratory test results for density, moisture<br />
content, Atterberg limits, fines content, clay content, specific gravity and triaxial compression,<br />
are included on the boring logs at the appropriate sample depth. The complete summary of the<br />
laboratory test results is included in Appendix B.<br />
At the completion of each borehole, the hole was backfilled with five-sack cement grout using a<br />
tremie pipe. The field technician observed the grouting process. Drill cuttings and fluids<br />
generated during drilling were temporarily stored on site in 55-gallon drums which were later<br />
delivered to Republic Services Inc. in Livermore, California for disposal according to applicable<br />
local, state, and federal regulations.<br />
3.2.3 Dam Surveillance Instrumentation<br />
Existing Piezometers<br />
The existing piezometers at the project dam site are the open well type, and are monitored<br />
monthly. No new piezometers were installed at the site during this investigation. The most<br />
<strong>Seismic</strong> Stability Evaluation <strong>Report</strong><br />
<strong>Dingee</strong> <strong>Reservoir</strong> Dam<br />
7<br />
August 2008
ecent data shows the piezometers continue to follow established trends, with XV-1, XV-2, XV-3<br />
and XV-8 all showing seasonal fluctuations with rainfall. Plate 5 shows the variation of the<br />
piezometers from 1972 to date. We have also plotted variation of precipitation, cumulative<br />
precipitation, and reservoir elevation along the same time axis for comparison and to draw<br />
correlations. Reference drawing 5808-G-2, which shows the piezometer locations, has also been<br />
included in Appendix C.<br />
Survey Monuments<br />
On a semi-annual basis, the District monitors the vertical and horizontal movements of the dam<br />
crest at various locations, based on six vertical monuments and six horizontal monuments that<br />
were previously installed along the dam crest. Locations of these survey monuments are shown<br />
in Reference drawing 5808-G-1 in Appendix C. The most recent data show that the monuments<br />
continue to follow established trends, with minor fluctuations (about 0.02 feet) from year to year.<br />
Monument D-2 has settled on average about 1.3 inches since April 1999. Monuments D-3 and<br />
D-4 have also settled 0.5 inches and 1.1 inches, respectively, over the same time span.<br />
Monument D-6 has shown downstream movement of about 1.3 inches since October 1998.<br />
Survey monuments continue to be monitored and assessed on a semi-annual basis by our<br />
surveyors. Plates 6A and 6B show plots of the horizontal and vertical movements of the survey<br />
monuments since 1972 to date. The reservoir storage and precipitation history has also been<br />
plotted along the same time axis for correlation purposes. Reference drawing 5808-G-1, which<br />
shows the surveillance monument locations, has also been included in Appendix C.<br />
Inclinometer XV-13-I<br />
As a part of the 2006 site investigation, we installed a 3-inch diameter inclinometer casing in<br />
boring XV-13 upon its completion. We have been reading this inclinometer every six months to<br />
observe any movement within the fill or bedrock materials. We have read this inclinometer 4<br />
times since its installation and will continue to read it at 6-month intervals or as deemed<br />
necessary. We have not observed movement of any significance in this inclinometer to date.<br />
Seepage and Drainage<br />
There is no underdrain installed at this reservoir; therefore, we have no measurement of seepage<br />
through the dam.<br />
Observations after 1989 Loma Prieta Earthquake<br />
The Loma Prieta Earthquake occurred on October 17, 1989. The epicenter was about 60 miles<br />
south of the site. This was a moment magnitude 6.9 earthquake and resulted in moderate ground<br />
shaking at the site. Based on the inspections performed at the site after the earthquakes (both<br />
main and aftershocks), no significant noticeable damage was observed. The estimated range of<br />
peak ground accelerations at the site was 0.2 to 0.25g (http://www.strongmotioncenter.org/).<br />
The dam survey monuments, piezometers, and toe drains were monitored after the earthquake.<br />
No significant changes were observed to the piezometer data around and after the event. During<br />
this type of monitoring, District staff pays close attention to changes to monument movement,<br />
and piezometer levels to ensure proper performance of the dam. <strong>Dingee</strong> Dam performed<br />
satisfactorily during and after this earthquake.<br />
<strong>Seismic</strong> Stability Evaluation <strong>Report</strong><br />
<strong>Dingee</strong> <strong>Reservoir</strong> Dam<br />
8<br />
August 2008
3.3 Laboratory Testing<br />
Soil and rock samples obtained from the subsurface investigation were carefully packaged and<br />
sealed to prevent disturbance and to reduce moisture loss. The soil and rock samples were<br />
carefully inspected and reviewed for verification of the field classification by an engineer from<br />
the Materials Engineering Section before representative samples from the various strata were<br />
selected for laboratory testing. Appropriate tests were selected to assist in subsequent evaluation<br />
of material properties for use in the stability evaluation. The tests performed are listed in Table<br />
2A and 2B along with their ASTM designations.<br />
Table 2A: Laboratory Index Tests and Results Location<br />
Test Description ASTM Designation Results Location<br />
In-situ moisture-density ASTM D2216, D2937 Plate B-1 & B-2 {App. B}<br />
Sieve analysis ASTM D422 Plate B-1 & B-2 {App. B}<br />
Hydrometer analysis ASTM D422 Plate B-1 & B-2 {App. B}<br />
Atterberg limits ASTM D4318 Plate 7 & Plate B-2 {App. B}<br />
Index tests were performed on all samples that were tested for shear strength determination. The<br />
results of these index tests are also summarized together with the strength test results. All testing<br />
was performed at the District’s Materials Testing Laboratory. The laboratory tests were<br />
performed in general accordance with the noted ASTM standards. Consolidation pressures for<br />
the Isotropically Consolidated Undrained (ICU) tests were selected based on the estimated<br />
overburden pressure at each sample depth. Abbreviated test results for each sample are also<br />
included in the boring logs at the appropriate depth. Plates 8, 9, 10, and 11 provide a summary<br />
of the in-situ moisture contents, total and dry unit weights, and estimated void ratios for the<br />
samples from borings XV-1 to XV-15.<br />
Table 2B: Laboratory Shear Strength Tests and Results Location<br />
ASTM<br />
Test Description<br />
Results on<br />
Designation<br />
Isotropically consolidated undrained<br />
(ICU) triaxial compression test with<br />
pore pressure measurements<br />
Unconsolidated consolidated (UU)<br />
triaxial compression test<br />
Direct Shear Test (DS)<br />
ASTM D2166<br />
ASTM D2166<br />
ASTM D3080<br />
Plates B-3<br />
& Appendix B<br />
Plates B-4<br />
& Appendix B<br />
Plate B-5<br />
& Appendix B<br />
The results from the 1971 investigation program are included in Plates 8 through 11. As shown<br />
on these plates, the in-situ moisture contents, unit weights, and void ratios (1971 lab data vs.<br />
2006 lab data) are comparable. Table B-2 in Appendix B, provides a summary of the Atterberg<br />
Limits tests for fine-grained soils and fine-grained fraction of coarse-grained soils. The<br />
interpretation of the laboratory data is presented in Sections 5 and 6 of this report.<br />
<strong>Seismic</strong> Stability Evaluation <strong>Report</strong><br />
<strong>Dingee</strong> <strong>Reservoir</strong> Dam<br />
9<br />
August 2008
4.0 Geologic and Ground Motions Studies<br />
4.1 Geologic Study<br />
A site-specific geologic evaluation study was prepared for the District by Mr. James M. Joyce,<br />
PG, CEG, of Joyce Associates, who performed the work as a subcontractor for the prime review<br />
consultant for this project, Alan Kropp & Associates. This geologic study is included in<br />
Appendix D of this report. The purpose of the geologic study is to provide pertinent regional and<br />
local geologic information for use in the seismic stability evaluation of the embankment.<br />
The geologic report states that the seismic activity within the northern Coast Ranges is generally<br />
associated with active faults of the San Andreas system, including major active faults both east<br />
and west of the site. The principal active fault in the region is the Hayward Fault, the main trace<br />
of which is approximately 1,100 feet east of the fill embankment. In the year 2002, the U.S.<br />
Geological Survey estimated there was a 62 percent or higher chance of a large earthquake<br />
occurring in the San Francisco <strong>Bay</strong> Region by the year 2032.<br />
The geologic study found that within the region, many valleys have been partially filled with<br />
unconsolidated sedimentary deposits of Quaternary age. These deposits, which include alluvium<br />
and colluvium, underlie the gently sloping valley bottoms and hillside swales, and consist of<br />
clay, silt, and gravel. The regional evaluation found that the site is principally underlain by<br />
sandstone bedrock throughout the reservoir area. The western side of the reservoir consists of a<br />
fill embankment consisting mainly of silty clay. The fill overlies a layer of native soil consisting<br />
principally of sandy to silty clay.<br />
The geologic evaluation found no evidence of landsliding around the reservoir, and found no<br />
evidence of creep or movement within the fill embankment along the west side of the reservoir.<br />
Additionally, the study found no indications that active faults cross or project towards the site<br />
and conclude that the risk of fault-related ground rupture in the reservoir area is very low.<br />
4.2 Ground Motion Study<br />
The site-specific ground motion study was developed by Dr. Walt Silva of Pacific Engineering,<br />
who was a subcontractor to AKA. The study is included in Appendix E of this report. The<br />
purpose of this study was to develop the design response spectrum, and three spectra matched<br />
time histories for the <strong>Dingee</strong> site. The design response spectrum was based on the 84 th<br />
percentile, fault average component of ground motion level. Three time histories were<br />
developed and were matched to the target spectrum. The three time histories were developed<br />
from the 1) Kobe, 2) Kocaeli, and 3) Landers earthquakes. The time histories were used to<br />
estimate the earthquake-induced slope displacements which are presented in Section 7.4.2.<br />
<strong>Seismic</strong> Stability Evaluation <strong>Report</strong><br />
<strong>Dingee</strong> <strong>Reservoir</strong> Dam<br />
10<br />
August 2008
5.0 Subsurface Conditions<br />
Based on the materials encountered in the borings, the site consists of dam fill overlying a 2-to 5-<br />
foot-thick layer of native surficial soils and material that transition from 2 to 3 feet of completely<br />
to moderately weathered bedrock. Underlying bedrock is composed of a moderately weathered<br />
siltstone/sandstone of the Franciscan Assemblage. The dam fill materials generally consist of 15<br />
to 22 feet of medium dense to dense clayey gravelly sand and stiff to very stiff sandy silty clay<br />
with gravel. The native soils consist of medium dense clayey sand and stiff to very stiff sandy<br />
clay.<br />
Groundwater was not recorded for this study within the rotary wash borings and was also not<br />
encountered in the hollow stem auger borings. All borings were grouted at the end of drilling.<br />
Based on our review of the historic piezometer data obtained in the Dam area, as well as the<br />
index properties (moisture content and degree of saturation) of samples retrieved from this<br />
investigation, we conclude that groundwater is located about 9 feet below the crest roadway<br />
elevation. Plate 4 shows the approximate phreatic surface which is based on more recent<br />
piezometric data (See Plate 5).<br />
We observed that the in-situ moisture content of the samples tested above the phreatic surface<br />
were around 90 percent, and therefore for our stability analysis we assumed the materials to<br />
behave in an undrained manner under short term loading conditions.<br />
<strong>Seismic</strong> Stability Evaluation <strong>Report</strong><br />
<strong>Dingee</strong> <strong>Reservoir</strong> Dam<br />
11<br />
August 2008
6.0 Dam Material Properties<br />
6.1 General<br />
The dam and its foundation soils consist primarily of three types of materials:<br />
1. Dam Fill<br />
2. Native Material<br />
3. Sandstone Bedrock<br />
Plates 2, 3, and 4 show the site plan, profile, and cross-section of the dam along with the subsurface<br />
stratigraphy. The dam fill materials consist of interbedded medium dense to dense<br />
clayey sand and stiff to very stiff lean clay and sandy clay. As mentioned; this dam was built in<br />
1894, making it 114 years old. Because the dam was constructed by the Oakland Water<br />
Company, the District does not have plans or specifications used for the construction of this dam.<br />
The dam fill materials were likely obtained from the native on-site materials.<br />
Table 3 provides the average moisture contents, densities, void ratio, and saturation values for<br />
the fill, native material, and sandstone. Based on these average material parameters, the degree<br />
of compaction of the Dam fill materials is estimated to be 85 percent. Although considered low<br />
for current state of practice (90 percent or higher), the relative compaction of the dam fills was<br />
typical for construction performed in the late 1890's. The actual soil properties were used in the<br />
analyses so that a determination of adequacy could be made. Shear strength results are presented<br />
in 6.4 of this report.<br />
6.2 Classification and Index Tests<br />
Grain size distribution and Atterberg limits determinations were performed on numerous samples<br />
of the dam fill, native material, and sandstone bedrock in both previous and present studies. The<br />
results indicate that the dam fill materials predominantly consist of medium dense to dense<br />
clayey gravelly sand and stiff to very stiff sandy silty clay. The native material deposits<br />
represent both alluvial deposits as well as residual soils that have been weathered in place.<br />
Distinguishing the two is practically not feasible at the site, and therefore, the alluvial soils and<br />
residual soils have been combined and are referred to as native materials. The term native<br />
material is also consistent with the term used by the consultants AKA for projects they have done<br />
in the vicinity. These native materials have a moisture content that is slightly higher than the fill<br />
materials and an in-situ unit weight that is lower than the Sandstone Bedrock. Index properties<br />
of the three materials are described below.<br />
Dam Fill Material<br />
The in-situ moisture contents of the dam fill varied from 9.2% to 27.6%, with an average of<br />
19.7% and a standard deviation of 4.5%. In-place dry unit weights of the dam fill ranged from<br />
96.6 to 117.5 pounds per cubic foot (pcf), with an average of 106.9 pcf and a standard deviation<br />
of 5.6 pcf. The average void ratio and degree of saturation are 0.6 and 90.2 %, respectively.<br />
<strong>Seismic</strong> Stability Evaluation <strong>Report</strong><br />
<strong>Dingee</strong> <strong>Reservoir</strong> Dam<br />
12<br />
August 2008
Native Material<br />
The in-situ moisture contents of the native materials varied from 15.3% to 28.9%, with an<br />
average of 19.3% and standard deviation of 3.1%. In-place dry unit weights of the native<br />
materials ranged from 97.3 to 117.5 pcf, with an average of 109.9 pcf and standard deviation of<br />
5.0 pcf. The average void ratio and degree of saturation are 0.5 and 95.3 %, respectively.<br />
Sandstone Bedrock / Franciscan Assemblage<br />
The in-situ moisture contents of the Sandstone Bedrock / Franciscan Assemblage varied from<br />
15.2% to 34.6%, with an average of 27.4% and a standard deviation of 5.9%. In-place dry unit<br />
weights of the Formation ranged from 83.8 to 120.0 pcf, with an average of 97.1 pcf and a<br />
standard deviation of 10.2 pcf. The average void ratio and degree of saturation are 0.8 and 99%,<br />
respectively. Table 3 below summarizes these averaged properties.<br />
Table 3: Average of the Index Test Results<br />
MC %<br />
Total<br />
Density<br />
(PCF)<br />
Dry Density<br />
(PCF)<br />
Void Ratio<br />
Saturation<br />
(%)<br />
Specific<br />
Gravity<br />
Dam Fill 18.7 126.8 106.8 0.55 90.5 2.65<br />
Native Materials 21.2 127.3 105.0 0.60 94.7 2.70<br />
Sandstone<br />
Bedrock<br />
18.0 132.2 112.0 0.49 98.6 2.67<br />
Based upon review of the laboratory testing results, the native materials are expected to exhibit<br />
shear strength properties lower than the dam fill materials. Plates 8 through 11 show the<br />
variation of moisture content and total unit weight of the materials encountered in the borings<br />
XV-1 through XV-15.<br />
6.3 Liquefaction Potential/Loss of Shear Strength<br />
Plate 7 and Plate B-2 in Appendix B show the results of the Atterberg limits tests. Data points<br />
shown on this plate indicate that the materials fall under the CL (lean clay) and CH (fat clay)<br />
classification. Table B-2 in Appendix B includes results of the Atterberg limits tests and the insitu<br />
moisture content of the samples tested. The plasticity chart also shows three zones: A, B,<br />
and C. According to Seed (2003), soils in these zones are defined as follows:<br />
Zone A:<br />
Zone B:<br />
Zone C:<br />
Considered potentially susceptible to classic cyclically induced liquefaction.<br />
In some cases, can be susceptible to liquefaction (especially if their in-situ water<br />
content is greater than about 85 % of their liquid limit).<br />
Generally not susceptible to cyclically induced liquefaction.<br />
Table B-2 in Appendix B includes results of the Atterberg limits tests and the in-situ moisture<br />
content of the sample tested. Boring number, sample number, and elevation of the sample have<br />
also been provided. As the table indicates, of all the samples tested, none are susceptible to<br />
liquefaction.<br />
<strong>Seismic</strong> Stability Evaluation <strong>Report</strong><br />
<strong>Dingee</strong> <strong>Reservoir</strong> Dam<br />
13<br />
August 2008
Based on our above evaluations of the Dam fill and native materials, we do not anticipate that the<br />
onsite materials will undergo liquefaction or significant strength loss during seismic loading.<br />
6.4 Shear Strength<br />
To estimate the shear strength of fill, native, and sandstone bedrock materials, three types of<br />
testing were conducted:<br />
1. Isotropically consolidated undrained (ICU) triaxial compression test with pore pressure<br />
measurement.<br />
2. Unconsolidated consolidated (UU) triaxial compression test.<br />
3. Direct Shear Test (DS).<br />
In general, the results of the ICU tests provided the most appropriate results and were most<br />
suitable for use in the analysis. UU and DS tests were also considered; however, due to the<br />
larger scatter in the results, these were not used. Direct shear test results were conducted mostly<br />
on the fill materials. Results from the ICU tests were used in developing shear strength<br />
parameters for the fill, native materials, and sandstone bedrock.<br />
6.4.1 Effective Shear Strength Failure Envelope<br />
The static shear strengths of the dam fill and foundation materials were estimated using<br />
Isotropically Consolidated Undrained (ICU) Triaxial Compression tests with pore water pressure<br />
measurements. Plates 12, 13, and 14 show the effective strength failure envelope for the dam<br />
fill, native material, and sandstone bedrock, respectively. The effective material strength<br />
parameters used in the analysis are shown in Table 4A.<br />
Material<br />
Table 4A: Effective Shear Strength Parameters<br />
Moist<br />
Unit<br />
Weight m<br />
(pcf)<br />
Cohesion<br />
Intercept c’<br />
(psf)<br />
Friction<br />
Angle’<br />
(degree)<br />
Ref. Plate<br />
No.<br />
Dam Fill 126.8 172 29.0 12<br />
Native Materials 127.3 616 13.0 13<br />
Sandstone Bedrock 132.2 1223 19.9 14<br />
6.4.2 Total Shear Strength Failure Envelope<br />
For the seismic (pseudo-dynamic) analysis, undrained shear strength was used. For this study,<br />
we used the static total strength parameters from the ICU tests. Plates 15, 16, and 17 show the<br />
total strength failure envelope for the dam fills materials, native materials, and weathered<br />
bedrock, respectively. The total material strength parameters used in the analysis are shown in<br />
Table 4B. Results of the ICU triaxial tests are summarized in Table B-3 in Appendix B.<br />
<strong>Seismic</strong> Stability Evaluation <strong>Report</strong><br />
<strong>Dingee</strong> <strong>Reservoir</strong> Dam<br />
14<br />
August 2008
For slope stability analyses, both the effective and total strength parameters derived from the<br />
“best fit” line were used. Table 4B summarizes the “best fit” material total strength parameters.<br />
Clayey soils exhibit an increase in shear strength during rapid or seismic loading cases. The<br />
phenomenon of increase in strength for clayey materials has been well-documented by previous<br />
studies and is a generally accepted standard of practice (Duncan and Wright, 2005). Typically, a<br />
shear strength increase of 20 percent or greater can be used for earthquake loading conditions for<br />
clayey soils. In this report, we took a more conservative approach, and did not apply any shear<br />
strength increase due to the size of the embankment and the anticipated embankment<br />
deformations. Stability analyses were performed using no strength increase and are presented in<br />
Section 7.<br />
Material<br />
Table 4B: Total Shear Strength Parameters<br />
Moist<br />
Unit<br />
Weight m<br />
(pcf)<br />
Cohesion<br />
Intercept c<br />
(psf)<br />
Friction<br />
Angle<br />
(degree)<br />
Ref. Plate<br />
No.<br />
Dam Fill 126.8 416 16.0 15<br />
Native Materials 127.3 806 6.9 16<br />
Sandstone Bedrock 132.2 851 19.9 17<br />
<strong>Seismic</strong> Stability Evaluation <strong>Report</strong><br />
<strong>Dingee</strong> <strong>Reservoir</strong> Dam<br />
15<br />
August 2008
7.0 Stability Evaluations<br />
7.1 General Approach to Evaluation<br />
Conventional limit equilibrium slope stability and earthquake-induced deformation methods<br />
were used to assess the performance of the dam. Static and pseudo-dynamic stability evaluations<br />
were carried out for both the upstream and downstream slopes of the dam. Effective shear<br />
strength parameters were used in the static stability analysis. Undrained shear strength<br />
parameters, developed as described in Section 6.4.2, were used in the pseudo-dynamic stability<br />
analysis.<br />
Slope stability analyses were performed using the computer program SLOPE/W, Version 5<br />
(GEO-SLOPE International, 2002). The program uses two-dimensional limit equilibrium<br />
technique and the method of slices, and allows the user to select various methods including<br />
simplified Bishop, simplified Janbu, Spencer, Morgenstern-Price, etc., to calculate the minimum<br />
factors of safety for both circular and block failure surfaces. The results presented for the<br />
upstream and downstream cases represent the surface type yielding the least factor of safety.<br />
Slope stability analyses presented in this report were performed using the Spencer Method. In<br />
the Spencer Method, compatibility of both moment and force equilibrium is enforced, which<br />
provides a higher level of reliability than methods that compute moment or force equilibrium<br />
separately.<br />
7.2 Dam Profile and Cross-Section<br />
A representative dam profile and cross-section was chosen to best represent the surface and<br />
subsurface conditions over the entire site. Plates 3, 4, and 5, respectively, show the plan, profile<br />
and cross-section for the dam. The cross-section analyzed and shown in Plate 5 is considered to<br />
represent the most critical and maximum height of the embankment.<br />
Based on our review of the historic reservoir surface elevations and piezometric levels, two<br />
different water surfaces and corresponding phreatic surfaces were evaluated: Elevation 772 feet<br />
and 768 feet. High water storage elevation of 768 is more representative of the storage levels for<br />
the past 8 years, or since about year 2000. Prior to year 2000, high water storage levels were<br />
around 772 feet. The high water storage level of 768 was selected since this level represents the<br />
upper bound elevation of the reservoir, in the more recent past, present, and most likely and<br />
anticipated future use. The phreatic surface was developed by reviewing the piezometric levels<br />
shown in Plate 5. The piezometric levels fluctuate directly with the reservoir storage levels. The<br />
data shows that piezometric levels were higher prior to year 2000, when the upper bound of<br />
reservoir storage level was around 772 feet, and then decreased after year 2000 as the reservoir<br />
storage levels decreased to upper bound of 768 feet.<br />
The limit equilibrium stability evaluations presented in Section 7.2 were performed using these<br />
two possible water storage and corresponding phreatic surfaces. The plates only contain the<br />
graphical results corresponding to reservoir storage elevation of 768 feet, and not for 772 feet.<br />
<strong>Seismic</strong> Stability Evaluation <strong>Report</strong><br />
<strong>Dingee</strong> <strong>Reservoir</strong> Dam<br />
16<br />
August 2008
We have tabulated the results for both reservoir surface levels in this section. For estimating the<br />
long-term and current and future seismic stability, we have elected to use storage elevation of<br />
768 feet.<br />
7.3 Long-Term Static Stability<br />
For long-term static stability, a drained analysis with steady state seepage was analyzed for both<br />
upstream and downstream slopes of the dam. For each slope condition, both deep and shallow<br />
failure conditions were evaluated. The analyses were performed using unit weights and effective<br />
strength parameters of the materials shown in Table 4A and 4B, an assumed phreatic line based<br />
on maximum recorded data (since year 2000) of the existing piezometers, and an average-high<br />
reservoir water level (at Elevation +768 feet).<br />
The results of the long-term static stability analysis are shown in Plate 18 for the upstream and<br />
Plate 19 for the downstream slopes. The lowest factors of safety against long-term static stability<br />
for the upstream and downstream slopes are presented in Table 5 below.<br />
Table 5: Long-Term Static Slope Stability Analysis Results – Factors of Safety<br />
Section Upstream Downstream<br />
A-A’ (Water EL = 772 ft) 2.74 1.45<br />
A-A’ (Water EL =768 ft)<br />
1.57<br />
2.31<br />
Block Surface<br />
(See Plate 18)<br />
(See Plate 19)<br />
A-A’ (Water EL =768 ft) NA<br />
1.67<br />
Circular Surface<br />
(See Plate 20)<br />
7.4 Short-Term <strong>Seismic</strong> Stability<br />
A pseudo-dynamic approach was utilized for evaluation of slope stability under seismic<br />
conditions. In this approach, earthquake forces are represented by an equivalent dynamic<br />
horizontal force which consists of the estimated effective horizontal ground acceleration<br />
multiplied by the mass of the potential slide material. For earthquake loading conditions, the<br />
analyses were performed using static total strength parameters as the undrained shear strength for<br />
the materials as shown in Table 4B. No phreatic line was used in these undrained loading<br />
analyses.<br />
Based on the in-situ blow-counts and strength test results, the dam fill materials, native materials,<br />
and the sandstone bedrock are not anticipated to undergo strength loss during cyclic or seismic<br />
loading. As mentioned previously, typical strength increases for rapid loading can be 20 percent<br />
or greater; however, a conservative approach of no strength increase was used for this project.<br />
In the pseudo-dynamic stability analysis, the result is the yield acceleration, K y , an effective<br />
horizontal ground acceleration at which a potential sliding surface would develop a factor of<br />
safety equal to unity. The results of the pseudo-dynamic stability analysis are shown on Plates<br />
<strong>Seismic</strong> Stability Evaluation <strong>Report</strong><br />
<strong>Dingee</strong> <strong>Reservoir</strong> Dam<br />
17<br />
August 2008
21 and 22 for the upstream and downstream slopes, respectively. The yield acceleration under<br />
seismic conditions is 0.45g for upstream slope and 0.15g for the downstream slopes. Tables 6<br />
and 7 provide a summary of the upstream and down stream factor of safety and its variation with<br />
applied horizontal seismic coefficient.<br />
Table 6: <strong>Seismic</strong> Slope Stability Analysis Results<br />
(Water El = 768 ft) Factor of Safety<br />
Downstream Upstream<br />
<strong>Seismic</strong> Coefficient<br />
0.10 1.12 2.22<br />
0.15 1.00 1.83<br />
0.20 0.92 1.75<br />
Table 7: <strong>Seismic</strong> Slope Stability Analysis Results<br />
(Water El = 772 ft) Factor of Safety<br />
Downstream Upstream<br />
<strong>Seismic</strong> Coefficient<br />
0.10 1.04 2.35<br />
0.15 0.92 2.00<br />
0.20 0.83 1.70<br />
It should be noted that on the two plates, the failure plane has an average slope of about 0.5.<br />
This slope will be discussed in Section 7.4.2, where vertical deformation estimates are made for<br />
the slope deformation estimates. Typically this would imply the vertical component of<br />
deformation is about ½ of the estimated horizontal component.<br />
7.4.1 Yield Acceleration Evaluation<br />
The yield acceleration, K y , for a slope is defined as the value of estimated effective horizontal<br />
ground acceleration at which a potential sliding surface would develop a factor of safety equal to<br />
unity. This value is the minimum pseudo-static acceleration required to produce instability and<br />
any earthquake-induced deformation of the slope.<br />
The yield accelerations for the various scenarios were calculated from pseudo-static slope<br />
stability analyses. Initially, the potential sliding surface searches were performed without any<br />
earthquake forces to find the sliding mass with the minimum factor of safety. Then earthquake<br />
forces, represented by equivalent static horizontal force, were applied incrementally to the<br />
sliding mass until a minimum factor of safety of unity was obtained. The critical slip section<br />
associated with the minimum factor of safety of unity and the corresponding yield acceleration<br />
for each section are shown on Plates 22 and 21 for downstream and upstream slopes,<br />
respectively. Table 8 summarizes the results of the yield acceleration for the critical section for<br />
downstream and upstream slopes.<br />
<strong>Seismic</strong> Stability Evaluation <strong>Report</strong><br />
<strong>Dingee</strong> <strong>Reservoir</strong> Dam<br />
18<br />
August 2008
Table 8<br />
<strong>Seismic</strong> Slope Stability Analysis Results<br />
Yield Coefficients (FS ~1.0)<br />
Section Downstream, K y Upstream, K y<br />
A-A’ 0.15 g 0.45 g<br />
7.4.2 Earthquake-Induced Newmark Displacements<br />
The seismic slope deformations were evaluated using a simplified Newmark sliding block<br />
analysis (1965). The method is based on the assumption of rigid-perfectly plastic stress-strain<br />
behavior and potential failure surface using a sliding-block type approach. In the sliding-block<br />
approach, a slope is idealized as a rigid mass above a plane of sliding with specified yield<br />
acceleration. If design acceleration levels of the block are lower than the yield acceleration, no<br />
movement will occur along the sliding plane. If the design accelerations are higher than the<br />
yield acceleration, there will be net movement between the block and the base, i.e.<br />
displacements. The horizontal displacements of the sliding block are calculated by double<br />
integrating the difference between the earthquake-induced average acceleration of the slide mass<br />
and its yield acceleration with respect to time.<br />
These time histories were then double integrated using the computer program SHAKE2000 to<br />
develop the displacement time history for a yield coefficient of 0.15g. Plate 25 shows a plot of<br />
the estimated deformation on the downstream slope of the dam for the three time histories<br />
considered for both normal and reverse polarity cases that can be either the maximum or<br />
minimum.<br />
Table 9: Newmark Slope Displacement Estimates<br />
Average of 3 Earthquakes<br />
Yield Accel. Max Average Min<br />
0.10 4.01 3.45 2.90<br />
0.15 2.23 1.82 1.40<br />
0.20 1.28 1.05 0.82<br />
0.25 0.73 0.63 0.52<br />
0.30 0.40 0.37 0.34<br />
The figure below and Table 9 summarize the results of the Newmark slope deformation<br />
estimates for the downstream slope verses different values of yield acceleration. The minimum,<br />
maximum, and arithmetic average values of displacements are shown in Table 9. The maximum<br />
refers to the higher of the normal or reverse polarity values from the site specific time history. A<br />
conservative best estimate for the yield acceleration for the downstream slope from our stability<br />
evaluations was 0.15g. We calculated the range for the average horizontal deformations to be<br />
1.4 to 2.2 feet. We computed the average horizontal displacement to be about 3½ feet and the<br />
corresponding crest settlement to be less than 2 feet for the historic high reservoir storage levels<br />
of 772-feet.<br />
<strong>Seismic</strong> Stability Evaluation <strong>Report</strong><br />
<strong>Dingee</strong> <strong>Reservoir</strong> Dam<br />
19<br />
August 2008
84TH % - Fault Average Component<br />
Horizontal Displacment (ft)<br />
4.5<br />
4.0<br />
3.5<br />
3.0<br />
2.5<br />
2.0<br />
1.5<br />
1.0<br />
2.2’<br />
1.4’<br />
Maximum<br />
Average<br />
Minimum<br />
0.5<br />
0.0<br />
0.00 0.05 0.10 0.15 0.20 0.25 0.30 0.35<br />
Yield Acceleration (g's)<br />
Newmark Deformation versus Yield Acceleration<br />
7.5 Short-Term Rapid Drawdown Stability<br />
Total shear strength parameters were used in evaluation of the rapid drawdown stability using<br />
SLOPE/W. The analysis was carried out by changing the position of the phreatic surface in the<br />
cross-section to model the change or removal of the reservoir water level. The total strength<br />
parameters as the undrained shear strength for the materials as shown in Table 4B were used.<br />
The results of the rapid drawdown stability analysis for the upstream slopes for reservoir water<br />
levels of 755.9 feet or fully drained is shown on Plates 23 and 24 and is also summarized in<br />
Table 10 below. As shown in Table 10, the minimum temporary factors of safety are above 1.2<br />
which is typically the minimum required factor of safety (USACOE, Slope Stability Manual,<br />
2003). It should be noted that the material parameters used in the seismic stability evaluations<br />
were used in this analysis, i.e. a no strength increase was applied to the Dam fill and alluvial<br />
deposits.<br />
Table 10: Rapid Drawdown Slope Stability Analysis Results<br />
<strong>Reservoir</strong> Water Level<br />
Elevation (ft)<br />
Min. Factor of<br />
Safety<br />
Ref. Plate<br />
No.<br />
772.0 3.37 No Plate<br />
768.0 2.75 23<br />
755.9 1.86 24<br />
<strong>Seismic</strong> Stability Evaluation <strong>Report</strong><br />
<strong>Dingee</strong> <strong>Reservoir</strong> Dam August 2008<br />
20
8.0 Conclusions and Summary of Dam Performance<br />
The dam fill materials consist of medium dense to dense clayey gravelly sand and stiff to very<br />
stiff sandy silty clay with gravel. Based on our material characterization and liquefaction<br />
potential evaluations, the dam fill materials and native materials within the Dam are not likely to<br />
liquefy and will not undergo significant strength loss due to a seismic event.<br />
The survey monument data at the site indicate some movement of survey monuments D-2, D-3,<br />
and D-4. Some of the piezometer water level readings have increased over time. So far, the<br />
changes in the survey monuments and piezometer levels are within tolerable levels. These<br />
instruments are being monitored and evaluated as part of the District’s routine dam inspection<br />
program.<br />
No known active fault trace is present at the site, thus earthquake-induced ground rupture is not<br />
anticipated. Landslide maps do not indicate any areas of instability at the site, nor were any<br />
observed. Minimum factors of safety for long-term steady state conditions range from 2.3 and<br />
above for the upstream slope to 1.45 to 1.57 for the downstream slope.<br />
The results of the seismic stability analyses show that the dam will perform satisfactorily when<br />
subjected to ground shaking from the maximum credible earthquake of magnitude 7.25 on the<br />
Hayward Fault. The results also indicate about 2-feet of slope deformation and less than 1 foot<br />
of crest settlement. The reservoir is operated about (El. =768’) 5.5 feet below the dam crest<br />
elevation (El. 773.5 feet). Uncontrolled release of water is not expected from a major seismic<br />
event. Crest settlements of less than 2 feet could occur for water storage elevations of 772 feet.<br />
The reservoir water storage is typically held to Elevation 768 feet due to operational needs.<br />
The results of rapid drawdown stability analyses also indicate satisfactory performance of the<br />
upstream slope of the Dam in case of rapid reservoir drainage. Minimum factors of safety for the<br />
short-term rapid drawdown condition range from 3.4 and 2.8 when the reservoir water level is<br />
dropped from Elevation 772 to 768 feet to a factor of safety of 1.9 when the reservoir is fully<br />
drained to elevation 755.9 feet.<br />
<strong>Seismic</strong> Stability Evaluation <strong>Report</strong><br />
<strong>Dingee</strong> <strong>Reservoir</strong> Dam<br />
21<br />
August 2008
References<br />
1. Alquist-Priolo Special Studies Zone Map (1982).<br />
2. ASTM (2003). Annual Book of ASTM Standards, Section 4 – Construction, Volume<br />
04.08: Soil and Rock (I): D 420 – D 5611, American Society for Testing and<br />
Materials, West Conshohocken, Pennsylvania.<br />
3. Duncan, J.M. and Buchignani, A.L. and DeWet, M. (1987). An Engineering Manual<br />
for Slope Stability Studies, Virginia Tech Center for Geotechnical Practice and<br />
Research, Department of Civil Engineering.<br />
4. Duncan, J.M. and Wright, S.G. (2005). Soil Strength and Slope Stability, John Wiley<br />
& Sons, Inc., Hoboken, New Jersey.<br />
5. Duncan, J.M., Wright, S.G., and Wong, K.S. (1990). “Slope Stability during Rapid<br />
Drawdown,” Proceedings, H. Bolton Seed Memorial Symposium, University of<br />
California, Berkeley.<br />
6. FHWA-IF-02-034 (2002). Geotechnical Engineering Circular No.5: Evaluation of<br />
Soil and Rock Properties, Federal Highway Administration, U.S. Department of<br />
Transportation.<br />
7. GEO-SLOPE International (2002). User’s Guide – SLOPE/W for Slope Stability<br />
Analysis, Calgary, Alberta, Canada.<br />
8. Ghram, J., Crooks, J.H.A., and Bell, A.L. (1983). “Time Effects on the Stress Strain<br />
Behavior of Natural Soft Clays”, Geotechnique, Vol. 35, N.3, September 1983, pp.<br />
327-340.<br />
9. Holtz, R.D. and Kovacs, W.D. (1981). An Introduction to Geotechnical Engineering,<br />
Prentice Hall, Englewood Cliffs, New Jersey.<br />
10. Kramer, S.L. (1996). Geotechnical Earthquake Engineering, Prentice Hall, Upper<br />
Saddle River, New Jersey.<br />
11. Makdisi, F.I. and Seed, H.B. (1978). “Simplified Procedure for Estimating Dam and<br />
Embankment Earthquake-Induced Deformations,” Journal of Geotechnical<br />
Engineering Division, ASCE, Vol. 104, No. GT7, Proceedings Paper 13, pp. 898, pp.<br />
849-867.<br />
12. Newmark, N.M. (1965). “Effects of Earthquakes on Dams and Embankments,”<br />
Geotechnique, Institute of Civil Engineers, London, England, Vol. XV, No.2.<br />
13. Ordonez, G.A. (2005). User’s Manual – SHAKE 2000: A Computer Program for the<br />
1-D Analysis of Geotechnical Earthquake Engineering Problems, revised April 2005.<br />
14. Seed, R. B., et. al., (2003). Recent Advances in Soil Liquefaction Engineering: a<br />
unified and consistent framework, <strong>Report</strong> No. EERC 2003-06, EERI, University of<br />
California, Berkeley, June.<br />
15. Southern California Earthquake Center (2002). Recommended Procedures for<br />
Implementation of DMG Special Publication 117: Guidelines for Analyzing and<br />
<strong>Seismic</strong> Stability Evaluation <strong>Report</strong><br />
<strong>Dingee</strong> <strong>Reservoir</strong> Dam<br />
22<br />
August 2008
Mitigating Liquefaction Hazards in California, Southern California Earthquake<br />
Center.<br />
16. Stark, T.D., Eid, H.T. (1998). “Performance of Three-Dimensional Slope Stability<br />
Methods in Practice,” Journal of Geotechnical Engineering Division, ASCE, Vol.<br />
124, No. 11, p. 1049.<br />
17. U.S. Army Corps of Engineers (2003). Engineering and Design: Slope Stability<br />
Engineering Manual, Department of the Army, Corps of Engineers, EM 1110-2-1902,<br />
Washington DC, October.<br />
18. U.S. Geological Survey Landslide Map (1975).<br />
19. U.S. Geological Survey Geologic Map (1969).<br />
20. Wong, K.S., Duncan, J.M., and Seed, H.B. (1983). “Comparison of Methods of<br />
Rapid Drawdown Stability Analysis,” <strong>Report</strong> No. UCB/GT/82-05, Department of<br />
Civil Engineering, University of California, Berkeley, December 1982, revised July,<br />
1983.<br />
<strong>Seismic</strong> Stability Evaluation <strong>Report</strong><br />
<strong>Dingee</strong> <strong>Reservoir</strong> Dam<br />
23<br />
August 2008
N<br />
DINGEE RESERVOIR DAM SEISMIC STABILITY EVAL. Date: June 2008<br />
Site Vicinity Map and Air Photo<br />
PLATE 1
<strong>Reservoir</strong> Roof<br />
B<br />
A A’<br />
XV-11<br />
(Sta. 1+86)<br />
XV-12<br />
(Sta. 1+49)<br />
XV-13-I<br />
(Sta. 0+81)<br />
1:1 Slope<br />
Stone Retaining Wall<br />
XV-14<br />
(Sta. 1+11)<br />
Sidewalk/Curb<br />
XV-15<br />
(Sta. 0+36)<br />
XV-10<br />
(Sta. 1+17)<br />
B-1<br />
(Sta. 0+66)<br />
1971 Piezometer Borings<br />
(XV-1, 2, 3, 8, 10)<br />
90’ (From curb edge<br />
on Estates Dr.)<br />
2006 Borings<br />
(XV-11, 12, 14, 15)<br />
1991 Borings (B-1 and B-2)<br />
B’<br />
2006 Borings & Inclinometer<br />
(XV-13-I)<br />
B-2 (Sta. 0+90)<br />
Photograph View due North on Estates Dr. SCALE: 1”=20’<br />
DINGEE RESERVOIR DAM SEISMIC STABILITY EVALUATION<br />
Dam and Boring Location Map & Site Photograph<br />
Date: June 2008<br />
PLATE 2
A A’<br />
780<br />
780<br />
760<br />
740<br />
720<br />
760<br />
740<br />
720<br />
Elevation (feet)<br />
XV-11<br />
XV-1<br />
XV-12<br />
XV-10 (Toe)<br />
XV-2<br />
XV-8 & 14 (Toe)<br />
XV-13<br />
XV-15 (Toe)<br />
XV-3<br />
Ground Surface<br />
Phreatic Line<br />
Native Materials<br />
Dam Fill<br />
Sandstone Bedrock<br />
220 200 180 160 140 120 100 80 60 40 20 0<br />
Horizontal Distance (feet)<br />
Notes:<br />
1. Refer to Plate 2 for Monument Line and <strong>Dingee</strong> <strong>Reservoir</strong> Baseline for station location.<br />
2. Phreatic Line shown is representative of levels at centerline of Dam crest roadway and<br />
corresponds to reservoir storage elevation level of 768’ SCALE: 1”=20’<br />
DINGEE RESERVOIR DAM SEISMIC STABILITY EVALUATION<br />
Generalized Profile @ Centerline of Main Dam Roadway –Profile A-A’<br />
Date: June 2008<br />
PLATE 3
DINGEE RESERVOIR DAM SEISMIC STABILITY EVALUATION<br />
Section B-B’ @ Station 1+11<br />
Date: June 2008<br />
PLATE 4<br />
XV-2 & 12<br />
XV-8 & 14<br />
XV-10<br />
B-1 (AKA)<br />
B-2 (AKA)<br />
Estates Dr.<br />
WSL = 768’<br />
Phreatic Surface (WSL = 768’)
Elevation (Feet)<br />
Elevation (Feet)<br />
780<br />
770<br />
760<br />
750<br />
780<br />
770<br />
760<br />
750<br />
<strong>Reservoir</strong> Water Level<br />
XV-1A<br />
Elevation (Feet)<br />
780<br />
770<br />
760<br />
750<br />
XV-2A<br />
Elevation (Feet)<br />
780<br />
770<br />
760<br />
750<br />
XV-3A<br />
Elevation (Feet)<br />
760<br />
750<br />
740<br />
730<br />
XV-8A<br />
Precipitation<br />
(Inches)<br />
5<br />
4<br />
3<br />
2<br />
1<br />
0<br />
Precipitation Data<br />
50<br />
40<br />
30<br />
20<br />
10<br />
0<br />
Annual<br />
Cum. Precip. (in.)<br />
1/1/72<br />
1/1/73<br />
1/1/74<br />
1/1/75<br />
1/1/76<br />
1/1/77<br />
1/1/78<br />
1/1/79<br />
1/1/80<br />
1/1/81<br />
1/1/82<br />
1/1/83<br />
1/1/84<br />
1/1/85<br />
1/1/86<br />
1/1/87<br />
1/1/88<br />
1/1/89<br />
1/1/90<br />
1/1/91<br />
Date<br />
1/1/92<br />
1/1/93<br />
1/1/94<br />
1/1/95<br />
1/1/96<br />
1/1/97<br />
1/1/98<br />
1/1/99<br />
1/1/00<br />
1/1/01<br />
1/1/02<br />
1/1/03<br />
1/1/04<br />
1/1/05<br />
1/1/06<br />
1/1/07<br />
1/1/08<br />
DINGEE RESERVOIR DAM SEISMIC STABILITY EVAL. Date: June 2008<br />
<strong>Reservoir</strong> Storage, Piezometer Levels<br />
and Precipitation History<br />
PLATE 5
Elevation (Feet)<br />
780<br />
770<br />
760<br />
750<br />
<strong>Reservoir</strong> Water Level<br />
0.05<br />
Horizontal Movement<br />
0.00<br />
-0.05<br />
Horizontal Movement (Feet)<br />
-0.10<br />
-0.15<br />
-0.20<br />
-0.25<br />
-0.30<br />
D-1H<br />
D-2H<br />
D-3H<br />
D-4H<br />
D-5H<br />
D-6H<br />
Precipitation<br />
(Inches)<br />
5<br />
4<br />
3<br />
2<br />
1<br />
0<br />
Precipitation Data<br />
50<br />
40<br />
30<br />
20<br />
10<br />
0<br />
Annual<br />
Cum. Precip. (in.)<br />
1/1/72<br />
1/1/73<br />
1/1/74<br />
1/1/75<br />
1/1/76<br />
1/1/77<br />
1/1/78<br />
1/1/79<br />
1/1/80<br />
1/1/81<br />
1/1/82<br />
1/1/83<br />
1/1/84<br />
1/1/85<br />
1/1/86<br />
1/1/87<br />
1/1/88<br />
1/1/89<br />
1/1/90<br />
1/1/91<br />
1/1/92<br />
1/1/93<br />
1/1/94<br />
Date<br />
1/1/95<br />
1/1/96<br />
1/1/97<br />
1/1/98<br />
1/1/99<br />
1/1/00<br />
1/1/01<br />
1/1/02<br />
1/1/03<br />
1/1/04<br />
1/1/05<br />
1/1/06<br />
1/1/07<br />
1/1/08<br />
DINGEE RESERVOIR DAM SEISMIC STABILITY EVAL. Date: June 2008<br />
<strong>Reservoir</strong> Storage, Horizontal<br />
Movement, and Precipitation History<br />
PLATE 6A
Elevation (Feet)<br />
780<br />
770<br />
760<br />
750<br />
<strong>Reservoir</strong> Water Level<br />
0.05<br />
Vertical Movement<br />
0.00<br />
-0.05<br />
Vertical Movement (Feet)<br />
-0.10<br />
-0.15<br />
-0.20<br />
-0.25<br />
-0.30<br />
D-1V<br />
D-2V<br />
D-3V<br />
D-4V<br />
D-5V<br />
D-6V<br />
Precipitation<br />
(Inches)<br />
5<br />
4<br />
3<br />
2<br />
1<br />
0<br />
Precipitation Data<br />
50<br />
40<br />
30<br />
20<br />
10<br />
0<br />
Annual<br />
Cum. Precip. (in.)<br />
1/1/72<br />
1/1/73<br />
1/1/74<br />
1/1/75<br />
1/1/76<br />
1/1/77<br />
1/1/78<br />
1/1/79<br />
1/1/80<br />
1/1/81<br />
1/1/82<br />
1/1/83<br />
1/1/84<br />
1/1/85<br />
1/1/86<br />
1/1/87<br />
1/1/88<br />
1/1/89<br />
1/1/90<br />
1/1/91<br />
1/1/92<br />
1/1/93<br />
1/1/94<br />
1/1/95<br />
1/1/96<br />
1/1/97<br />
1/1/98<br />
1/1/99<br />
1/1/00<br />
1/1/01<br />
1/1/02<br />
1/1/03<br />
1/1/04<br />
1/1/05<br />
1/1/06<br />
1/1/07<br />
1/1/08<br />
Date<br />
DINGEE RESERVOIR DAM SEISMIC STABILITY EVAL. Date: June 2008<br />
<strong>Reservoir</strong> Storage, Vertical Movement,<br />
and Precipitation History<br />
PLATE 6B
U-Line: PI =0.9*(LL-8)<br />
60<br />
50<br />
40<br />
30<br />
20<br />
10<br />
0<br />
ML - Silt<br />
MH - Elastic Silt<br />
CL - Lean Clay<br />
CH - Fat Clay<br />
CL-ML - Silty Clay<br />
OL or OH - Organic Soils<br />
XV-11 @ 769.7<br />
A-Line: PI = 0.73*(LL-20)<br />
CL - ML<br />
CL<br />
ML<br />
CH<br />
MH<br />
XV-11 @ 761.7<br />
XV-12 @ 766.7<br />
XV-12 @ 761.7<br />
XV-12 @ 759.2<br />
XV-12 @ 756.7<br />
XV-13 @ 759.7<br />
XV-13 @ 755.2<br />
XV-13 @ 745.7<br />
XV-14 @ 733.8<br />
XV-15 @ 749.5<br />
XV-15 @ 748.5<br />
XV-15 @ 744.5<br />
0 10 20 30 40 50 60 70 80 90 100<br />
Liquid Limit (%)<br />
EAST BAY MUNICIPAL UTILITY DISTRICT<br />
OAKLAND CALIFORNIA<br />
DINGEE RESERVOIR DAM SEISMIC STABILITY EVALUATION Date: June 2008<br />
Atterberg Limits of Cohesive Soils – Fill & Native Material<br />
PLATE 7<br />
Plasticity Index, PI
Moisture Content (%)<br />
5.0 10.0 15.0 20.0 25.0 30.0 35.0<br />
775.0<br />
XV-1<br />
XV-2<br />
770.0 XV-3<br />
XV-4<br />
XV-5<br />
765.0 XV-6<br />
XV-7<br />
XV-8<br />
760.0<br />
XV-9<br />
XV-10<br />
755.0<br />
XV-11<br />
XV-12<br />
XV-13<br />
750.0 XV-14<br />
XV-15<br />
Elevation (ft)<br />
745.0<br />
740.0<br />
735.0<br />
730.0<br />
725.0<br />
720.0<br />
715.0<br />
710.0<br />
DINGEE RESERVOIR DAM SEISMIC STABILITY EVAL. Date: June 2008<br />
Moisture Content Versus Elevation<br />
PLATE 8
Total Density (PCF)<br />
775.0<br />
770.0<br />
765.0<br />
760.0<br />
755.0<br />
750.0<br />
100.0 110.0 120.0 130.0 140.0 150.0 160.0<br />
XV-1<br />
XV-2<br />
XV-3<br />
XV-4<br />
XV-5<br />
XV-6<br />
XV-7<br />
XV-8<br />
XV-9<br />
XV-10<br />
XV-11<br />
XV-12<br />
XV-13<br />
XV-14<br />
XV-15<br />
Elevation (ft)<br />
745.0<br />
740.0<br />
735.0<br />
730.0<br />
725.0<br />
720.0<br />
715.0<br />
710.0<br />
DINGEE RESERVOIR DAM SEISMIC STABILITY EVAL. Date: June 2008<br />
Total Density Versus Elevation<br />
PLATE 9
Dry Density (PCF)<br />
70.0 80.0 90.0 100.0 110.0 120.0 130.0 140.0<br />
775.0<br />
XV-1<br />
XV-2<br />
770.0 XV-3<br />
XV-4<br />
XV-5<br />
765.0<br />
XV-6<br />
XV-7<br />
XV-8<br />
760.0<br />
XV-9<br />
XV-10<br />
755.0<br />
XV-11<br />
XV-12<br />
XV-13<br />
750.0 XV-14<br />
XV-15<br />
Elevation (ft)<br />
745.0<br />
740.0<br />
735.0<br />
730.0<br />
725.0<br />
720.0<br />
715.0<br />
710.0<br />
DINGEE RESERVOIR DAM SEISMIC STABILITY EVAL. Date: June 2008<br />
Dry Density Versus Elevation<br />
PLATE 10
0.200 0.300 0.400 0.500 0.600 0.700 0.800 0.900 1.000<br />
775.0<br />
XV-1<br />
770.0<br />
765.0<br />
760.0<br />
755.0<br />
750.0<br />
XV-2<br />
XV-3<br />
XV-4<br />
XV-5<br />
XV-6<br />
XV-7<br />
XV-8<br />
XV-9<br />
XV-10<br />
XV-11<br />
XV-12<br />
XV-13<br />
XV-14<br />
XV-15<br />
Void Ratio<br />
Elevation (ft)<br />
745.0<br />
740.0<br />
735.0<br />
730.0<br />
725.0<br />
720.0<br />
715.0<br />
710.0<br />
DINGEE RESERVOIR DAM SEISMIC STABILITY EVAL. Date: June 2008<br />
Void Ratio Versus Elevation<br />
PLATE 11
5000.0<br />
4500.0<br />
4000.0<br />
3500.0<br />
3000.0<br />
2500.0<br />
2000.0<br />
1500.0<br />
1000.0<br />
500.0<br />
0.0<br />
Effective Stress Strength Envelope<br />
’= Q-Prime 29-deg (PSF)<br />
c’ = 172-psf<br />
0.0 1000.0 2000.0 3000.0 4000.0 5000.0 6000.0 7000.0 8000.0 9000.0 10000.0<br />
p', psf<br />
DINGEE RESERVOIR DAM SEISMIC STABILITY EVALUATION Date: June 2008<br />
Effective Stress Strength Envelope – Fill Material<br />
PLATE 12<br />
q, (psf)
5000.0<br />
4500.0<br />
4000.0<br />
3500.0<br />
3000.0<br />
2500.0<br />
2000.0<br />
1500.0<br />
1000.0<br />
500.0<br />
0.0<br />
Effective Stress Strength Envelope<br />
’= Q-Prime 13.0-deg<br />
(PSF)<br />
c’ = 616-psf<br />
0.0 1000.0 2000.0 3000.0 4000.0 5000.0 6000.0 7000.0 8000.0 9000.0 10000.0<br />
p', psf<br />
DINGEE RESERVOIR DAM SEISMIC STABILITY EVALUATION Date: June 2008<br />
Effective Stress Strength Envelope – Native Materials<br />
PLATE 13<br />
q, (psf)
5000.0<br />
4500.0<br />
4000.0<br />
3500.0<br />
3000.0<br />
2500.0<br />
2000.0<br />
1500.0<br />
1000.0<br />
500.0<br />
0.0<br />
Effective Stress Strength Envelope<br />
’= Q-Prime 19.9-deg<br />
(PSF)<br />
c’ = 1223-psf<br />
0.0 1000.0 2000.0 3000.0 4000.0 5000.0 6000.0 7000.0 8000.0 9000.0 10000.0<br />
p', psf<br />
DINGEE RESERVOIR DAM SEISMIC STABILITY EVALUATION Date: June 2008<br />
Effective Stress Strength Envelope – Sandstone Bedrock<br />
PLATE 14<br />
q, (psf)
5000.0<br />
4500.0<br />
4000.0<br />
3500.0<br />
3000.0<br />
2500.0<br />
2000.0<br />
1500.0<br />
1000.0<br />
500.0<br />
0.0<br />
Total Stress Strength Envelope<br />
Q-TOT (PSF)<br />
= 16.0-deg<br />
c T = 416-psf<br />
0.0 1000.0 2000.0 3000.0 4000.0 5000.0 6000.0 7000.0 8000.0 9000.0 10000.0<br />
p, psf<br />
DINGEE RESERVOIR DAM SEISMIC STABILITY EVALUATION Date: June 2008<br />
Total Stress Strength Envelope – Fill Material<br />
PLATE 15<br />
q, (psf)
5000.0<br />
4500.0<br />
4000.0<br />
3500.0<br />
3000.0<br />
2500.0<br />
2000.0<br />
1500.0<br />
1000.0<br />
500.0<br />
0.0<br />
Total Stress Strength Envelope<br />
= Q-TOT 6.9-deg (PSF)<br />
c T = 806-psf<br />
0.0 1000.0 2000.0 3000.0 4000.0 5000.0 6000.0 7000.0 8000.0 9000.0 10000.0<br />
p, psf<br />
DINGEE RESERVOIR DAM SEISMIC STABILITY EVALUATION Date: June 2008<br />
Total Stress Strength Envelope – Native Materials<br />
PLATE 16<br />
q, (psf)
5000.0<br />
4500.0<br />
4000.0<br />
3500.0<br />
3000.0<br />
2500.0<br />
2000.0<br />
1500.0<br />
1000.0<br />
500.0<br />
0.0<br />
Total Stress Strength Envelope<br />
= Q-TOT 19.9-deg<br />
(PSF)<br />
c T = 851-psf<br />
0.0 1000.0 2000.0 3000.0 4000.0 5000.0 6000.0 7000.0 8000.0 9000.0 10000.0<br />
p, psf<br />
DINGEE RESERVOIR DAM SEISMIC STABILITY EVALUATION Date: June 2008<br />
Total Stress Strength Envelope – Sandstone Bedrock<br />
PLATE 17<br />
q, (psf)
Material m<br />
(pcf) sat<br />
(pcf) c’ (psf) ’ (degree)<br />
Dam Fill 126.8 128.8 172 29.0<br />
FSmin = 2.31<br />
Native<br />
Materials<br />
Sandstone<br />
Bedrock<br />
127.3<br />
132.2<br />
128.7<br />
132.3<br />
616<br />
1223<br />
13.0<br />
19.9<br />
DINGEE RESERVOIR DAM SEISMIC STABILITY EVALUATION Date: June 2008<br />
Upstream - Long Term Slope Stability Analysis -<br />
WSL = 768’<br />
PLATE 18
Material m<br />
(pcf)<br />
Dam Fill 126.8<br />
Native<br />
Materials<br />
127.3<br />
FSmin = 1.57<br />
Sandstone<br />
Bedrock<br />
132.2<br />
DINGEE RESERVOIR DAM SEISMIC STABILITY EVALUATION<br />
Downstream - Long Term Slope Stability Analysis -<br />
WSL = 768’<br />
sat<br />
(pcf)<br />
128.8<br />
128.7<br />
132.3<br />
c’ (psf) ’ (degree)<br />
172 29.0<br />
616<br />
13.0<br />
1223<br />
19.9<br />
Date: June 2008<br />
PLATE 19
Material<br />
m<br />
(pcf)<br />
Dam Fill<br />
126.8<br />
FSmin = 1.67<br />
Native<br />
Materials<br />
Sandstone<br />
Bedrock<br />
127.3<br />
132.2<br />
DINGEE RESERVOIR DAM SEISMIC STABILITY EVALUATION<br />
Downstream - Long Term Slope Stability Analysis -<br />
WSL = 768’<br />
sat<br />
(pcf)<br />
128.8<br />
128.7<br />
132.3<br />
c’ (psf)<br />
’ (degree)<br />
172<br />
29.0<br />
616<br />
13.0<br />
1223<br />
19.9<br />
Date: June 2008<br />
PLATE 20
Material m<br />
(pcf) sat<br />
(pcf) c (psf) (degree)<br />
Dam Fill 126.8 128.8 416<br />
16.0<br />
Native<br />
Materials<br />
127.3<br />
128.7<br />
806<br />
6.9<br />
Sandstone<br />
Bedrock<br />
132.2<br />
132.3<br />
851<br />
19.9<br />
Ky = 0.45 FS=1.09<br />
DINGEE RESERVOIR DAM SEISMIC STABILITY EVALUATION<br />
Upstream – Pseudo-Dynamic Slope Stability Analysis -<br />
WSL = 768’<br />
* (degree)<br />
18.9<br />
5.9<br />
--<br />
Date: June 2008<br />
PLATE 21
Material m<br />
(pcf) sat<br />
(pcf) c (psf) (degree) * (degree)<br />
Dam Fill 126.8 128.8 416<br />
16.0<br />
18.9<br />
Native<br />
Materials<br />
127.3<br />
128.7<br />
806<br />
6.9<br />
5.9<br />
Sandstone<br />
Bedrock<br />
132.2<br />
132.3<br />
851<br />
19.9<br />
--<br />
Ky = 0.15 FS=1.00<br />
DINGEE RESERVOIR DAM SEISMIC STABILITY EVALUATION Date: June 2008<br />
Downstream – Pseudo-Dynamic Slope Stability Analysis -<br />
WSL = 768’<br />
PLATE 22
Material m<br />
(pcf) sat<br />
(pcf) C T (psf) T (degree) T (degree)<br />
Dam Fill 126.8 128.8 416 16.0 18.9<br />
Native<br />
Materials<br />
127.3<br />
128.7<br />
806<br />
6.9<br />
5.9<br />
Sandstone<br />
Bedrock<br />
132.2<br />
132.3<br />
851<br />
19.9<br />
--<br />
FSmin = 2.75<br />
DINGEE RESERVOIR DAM SEISMIC STABILITY EVALUATION<br />
Date: June 2008<br />
Rapid Drawdown Slope Stability Analysis – Res. Elev. = 768’<br />
PLATE 23
850<br />
830<br />
810<br />
790<br />
770<br />
750<br />
730<br />
710<br />
690<br />
670<br />
650<br />
Material m<br />
(pcf) sat<br />
(pcf) C T (psf) T (degree) T (degree)<br />
Dam Fill 126.8 128.8 416 16.0 18.9<br />
Native<br />
Materials<br />
127.3<br />
128.7<br />
806<br />
6.9<br />
5.9<br />
Sandstone<br />
Bedrock<br />
132.2<br />
132.3<br />
851<br />
19.9<br />
--<br />
FSmin = 1.86<br />
1.859<br />
Dam Fill<br />
Native Materials<br />
Sandstone Bedrock<br />
-200 -180 -160 -140 -120 -100 -80 -60 -40 -20 0 20 40 60 80 100 120 140 160 180 200 220 240 260 280 300<br />
Horizontal Distance (ft)<br />
DINGEE RESERVOIR DAM SEISMIC STABILITY EVALUATION<br />
Date: June 2008<br />
Rapid Drawdown Slope Stability Analysis – Res. Elev. = 755.9’<br />
PLATE 24<br />
Elevation (ft)
1.5<br />
Displacement<br />
(ft)<br />
1.0<br />
0.5<br />
Kobe Normal Polarity<br />
0.0<br />
0 20 40 60 80 100<br />
1.5<br />
Time (sec)<br />
Displacement<br />
(ft)<br />
1.0<br />
0.5<br />
Kobe Reverse Polarity<br />
0.0<br />
0 20 40 60 80 100<br />
Time (sec)<br />
2.0<br />
Displacement<br />
(ft)<br />
1.5<br />
1.0<br />
0.5<br />
Kocaeli Normal Polarity<br />
0.0<br />
0 10 20 30 40 50<br />
1.5<br />
Time (sec)<br />
Displacement<br />
(ft)<br />
1.0<br />
0.5<br />
Kocaeli Reverse Polarity<br />
0.0<br />
0 10 20 30 40 50<br />
Time (sec)<br />
2.0<br />
Displacement<br />
(ft)<br />
Displacement<br />
(ft)<br />
1.5<br />
1.0<br />
0.5<br />
0.0<br />
0 20 40 60 80 100<br />
4<br />
Time (sec)<br />
3<br />
2<br />
1<br />
Landers Normal Polarity<br />
Landers Reverse Polarity<br />
0<br />
0 20 40 60 80 100<br />
Time (sec)<br />
DINGEE RESERVOIR DAM SEISMIC STABILITY EVAL. Date: June 2008<br />
Newmark Displacement Analysis<br />
Kobe, Kocaeli , and Landers Earthquake<br />
PLATE 25
Appendix A<br />
Logs of Borings<br />
LIST OF PLATES<br />
Plate A-0A<br />
Plate A-0B<br />
Plate A-1<br />
Plates A-2 to A-7<br />
Soil Classification Properties Legend<br />
Formational Material Description, Legend for <strong>Report</strong> Boring Logs<br />
Site Plan and Boring Locations<br />
Logs of Borings (XV-11 through XV-15)<br />
<strong>Seismic</strong> Stability Evaluation <strong>Report</strong><br />
<strong>Dingee</strong> <strong>Reservoir</strong> Dam August 2008
Appendix B<br />
Laboratory Test Results<br />
LIST OF TABLES<br />
Table No.<br />
Title<br />
B-1 Summary of Laboratory Index Test Results<br />
B-2 Summary of Index Tests – Previous Borings<br />
B-3 Summary of Consolidated Undrained Triaxial Compression Test Results<br />
B-4 Specific Gravity Test Result<br />
Group Particle Size Distribution <strong>Report</strong>s<br />
Group Direct Shear Test Results<br />
Group Unconsolidated Undrained Test<br />
<strong>Seismic</strong> Stability Evaluation <strong>Report</strong><br />
<strong>Dingee</strong> <strong>Reservoir</strong> Dam August 2008
9<br />
10<br />
11<br />
12<br />
13<br />
14<br />
15<br />
16<br />
17<br />
18<br />
19<br />
20<br />
21<br />
22<br />
23<br />
24<br />
25<br />
26<br />
27<br />
28<br />
29<br />
30<br />
31<br />
32<br />
33<br />
34<br />
35<br />
36<br />
37<br />
38<br />
39<br />
40<br />
41<br />
42<br />
43<br />
44<br />
45<br />
46<br />
47<br />
48<br />
49<br />
50<br />
51<br />
52<br />
53<br />
54<br />
55<br />
56<br />
57<br />
58<br />
59<br />
60<br />
61<br />
2<br />
3<br />
4<br />
5<br />
6<br />
7<br />
8<br />
TABLE B-1<br />
SUMMARY OF LABORATORY TEST RESULTS<br />
A B C D E F G H I J K L<br />
Lab No Boring<br />
Surface<br />
Elevation (FT)<br />
Sample No Elevation (FT) Depth(FT) MC %<br />
Total Density<br />
(PCF)<br />
Dry<br />
Density<br />
(PCF)<br />
Void Ratio Saturation<br />
(%)<br />
57397 XV-1 772.7 1-III 769.7 3.0 18.4 134.0 113.2 0.505 99.5 2.73<br />
57398 XV-1 772.7 1-II 769.4 3.3 18.2 122.0 103.2 0.651 76.4 2.73<br />
57399 XV-1 772.7 1-I 769.0 3.7 20.3 132.0 109.7 0.553 100.2 2.73<br />
57400 XV-1 772.7 2-III 765.7 7.0 23.6 129.0 104.4 0.632 102.0 2.73<br />
57401 XV-1 772.7 2-II 765.4 7.3 21.0 129.0 106.6 0.598 95.9 2.73<br />
57402 XV-1 772.7 2-I 765.0 7.7 16.6 129.0 110.6 0.540 83.9 2.73<br />
57403 XV-1 772.7 3-II 761.4 11.3 19.3 131.0 109.8 0.551 95.5 2.73<br />
57404 XV-1 772.7 3-I 761.0 11.7 22.6 125.1 102.0 0.670 92.1 2.73<br />
57405 XV-1 772.7 5-II 755.4 17.3 17.2 131.0 111.8 0.524 89.7 2.73<br />
57406 XV-1 772.7 5-I 755.0 17.7 14.2 140.0 122.6 0.389 99.5 2.73<br />
57408 XV-1 772.7 6-I 752.2 20.5 9.7 150.0 136.7 0.232 112.7 2.7<br />
57377 XV-2 754.5 1-II 751.2 3.3 16.4 71.0 61.0 1.762 25.1 2.7<br />
57378 XV-2 754.5 1-I 750.8 3.7 14.4 94.0 82.2 1.050 37.0 2.7<br />
57379 XV-2 754.5 2-II 747.2 7.3 22.7 85.0 69.3 1.431 42.8 2.7<br />
57380 XV-2 754.5 2-I 746.8 7.7 22.8 85.0 69.2 1.435 42.9 2.7<br />
57382 XV-2 754.5 3-I 744.8 9.7 20.5 94.0 78.0 1.160 47.7 2.7<br />
57384 XV-2 754.5 4-II 743.2 11.3 19.7 83.0 69.3 1.431 37.2 2.7<br />
57385 XV-2 754.5 4-I 742.8 11.7 20.4 89.0 73.9 1.280 43.0 2.7<br />
57386 XV-2 754.5 5-III 739.5 15.0 17.4 86.1 73.3 1.298 36.2 2.7<br />
57387 XV-2 754.5 5-II 739.2 15.3 18.6 88.1 74.3 1.268 39.6 2.7<br />
57388 XV-2 754.5 5-I 738.8 15.7 23.1 92.0 74.7 1.255 49.7 2.7<br />
57389 XV-2 754.5 6-IV 735.8 18.7 22.6 87.0 71.0 1.373 44.4 2.7<br />
57390 XV-2 754.5 6-III 735.5 19.0 19.3 90.0 75.4 1.234 42.2 2.7<br />
57391 XV-2 754.5 6-II 735.2 19.3 20.8 91.0 75.3 1.237 45.4 2.7<br />
57392 XV-2 754.5 6-I 734.8 19.7 22.2 94.9 77.7 1.168 51.3 2.7<br />
57393 XV-2 754.5 7-IV 730.8 23.7 20.2 125.0 104.0 0.620 88.0 2.7<br />
57394 XV-2 754.5 7-III 730.5 24.0 20.7 126.0 104.4 0.614 91.1 2.7<br />
57395 XV-2 754.5 7-II 730.2 24.3 25.4 121.0 96.5 0.746 91.9 2.7<br />
57396 XV-2 754.5 7-I 729.8 24.7 25.0 122.0 97.6 0.726 92.9 2.7<br />
57364 XV-3 754.5 1-II 751.2 3.3 18.4 122.9 103.8 0.623 79.7 2.7<br />
57365 XV-3 754.5 1-I 750.8 3.7 14.3 127.9 111.9 0.506 76.4 2.7<br />
57366 XV-3 754.5 2-III 747.5 7.0 20.1 129.0 107.4 0.569 95.4 2.7<br />
57367 XV-3 754.5 2-II 747.2 7.3 22.3 123.9 101.3 0.663 90.8 2.7<br />
57368 XV-3 754.5 2-I 746.8 7.7 18.1 135.9 115.1 0.464 105.4 2.7<br />
75370 XV-3 754.5 3-I 742.7 11.8 19.7 128.3 107.2 0.572 93.0 2.7<br />
57371 XV-3 754.5 4-III 740.0 14.5 15.5 129.9 112.5 0.498 84.1 2.7<br />
57372 XV-3 754.5 4-II 739.7 14.8 15.8 140.9 121.7 0.384 111.0 2.7<br />
57373 XV-3 754.5 4-I 739.3 15.2 16.6 151.0 129.5 0.301 148.9 2.7<br />
57997 XV-4 754.5 1-VNF 750.2 4.3 12.5 2.7<br />
57998 XV-4 754.5 1-IV 749.8 4.7 10.8 2.7<br />
57999 XV-4 754.5 1-III 749.5 5.0 14.3 130.3 114.0 0.478 80.8 2.7<br />
58000 XV-4 754.5 1-II 749.2 5.3 11.4 123.7 111.0 0.518 59.4 2.7<br />
58001 XV-4 754.5 1-I 748.8 5.7 11.6 133.9 120.0 0.404 77.5 2.7<br />
58002 XV-4 754.5 2-III 743.5 11.0 15.1 108.2 94.0 0.792 51.5 2.7<br />
58003 XV-4 754.5 2-II 743.2 11.3 22.3 128.4 105.0 0.605 99.6 2.7<br />
58004 XV-4 754.5 2-I 742.8 11.7 22.0 131.8 108.0 0.560 106.1 2.7<br />
58005 XV-4 754.5 3-IIINF 737.5 17.0 20.9 2.7<br />
58006 XV-4 754.5 3-II 737.2 17.3 23.0 127.9 104.0 0.620 100.2 2.7<br />
58007 XV-4 754.5 3-I 736.8 17.7 20.0 129.6 108.0 0.560 96.4 2.7<br />
58008 XV-4 754.5 4-II 731.2 23.3 21.9 123.1 101.0 0.668 88.5 2.7<br />
58009 XV-4 754.5 4-I 725.8 28.7 24.7 118.5 95.0 0.773 86.2 2.7<br />
58010 XV-4 754.5 5-IV 725.5 29.0 26.5 116.4 92.0 0.831 86.1 2.7<br />
58011 XV-4 754.5 5-III 725.2 29.3 31.2 118.1 90.0 0.872 96.6 2.7<br />
58012 XV-4 754.5 5-II 724.8 29.7 28.6 123.5 96.0 0.755 102.3 2.7<br />
58013 XV-4 754.5 5-I 720.2 34.3 24.2 130.4 105.0 0.605 108.1 2.7<br />
58014 XV-4 754.5 6-VNF 719.8 34.7 19.4 2.7<br />
58015 XV-4 754.5 6-IV 719.5 35.0 18.4 127.9 108.0 0.560 88.7 2.7<br />
58016 XV-4 754.5 6-III 719.2 35.3 17.6 139.9 119.0 0.416 114.3 2.7<br />
58017 XV-4 754.5 6-II 718.8 35.7 16.9 128.6 110.0 0.532 85.8 2.7<br />
Specific<br />
Gravity<br />
W:\WORKGRP\DATA\Yprashar\Projects\<strong>Dingee</strong>\Lab_Data\MAIN_<strong>Dingee</strong> <strong>Reservoir</strong> - Summary for Laboratory Testing Program.xls 7/30/2008
2<br />
62<br />
63<br />
64<br />
65<br />
66<br />
67<br />
68<br />
69<br />
70<br />
71<br />
72<br />
73<br />
74<br />
75<br />
76<br />
77<br />
78<br />
79<br />
80<br />
81<br />
82<br />
83<br />
84<br />
85<br />
86<br />
87<br />
88<br />
89<br />
90<br />
91<br />
92<br />
93<br />
94<br />
95<br />
96<br />
97<br />
98<br />
99<br />
100<br />
101<br />
102<br />
103<br />
104<br />
105<br />
106<br />
107<br />
108<br />
109<br />
110<br />
111<br />
112<br />
113<br />
114<br />
115<br />
116<br />
117<br />
118<br />
TABLE B-1<br />
SUMMARY OF LABORATORY TEST RESULTS<br />
A B C D E F G H I J K L<br />
Lab No Boring<br />
Surface<br />
Elevation (FT)<br />
Sample No Elevation (FT) Depth(FT) MC %<br />
Total Density<br />
(PCF)<br />
Dry<br />
Density<br />
(PCF)<br />
Void Ratio Saturation<br />
(%)<br />
58018 XV-4 754.5 6-I 718.8 35.7 16.3 139.6 120.0 0.404 108.9 2.7<br />
58019 XV-4 754.5 7-IIINF 713.5 41.0 11.2 2.7<br />
58020 XV-4 754.5 7-II 713.2 41.3 13.7 139.9 123.0 0.370 100.0 2.7<br />
58021 XV-4 754.5 7-I 712.8 41.7 10.1 146.4 133.0 0.267 102.2 2.7<br />
58092 XV-5 754.5 1-V 750.2 4.3 13.6 121.6 107.0 0.575 63.9 2.7<br />
58093 XV-5 754.5 1-IV 749.8 4.7 11.3 120.2 108.0 0.560 54.5 2.7<br />
58094 XV-5 754.5 1-III 749.5 5.0 7.5 121.5 113.0 0.491 41.2 2.7<br />
58095 XV-5 754.5 1-II 749.2 5.3 12.5 126.0 112.0 0.504 66.9 2.7<br />
58096 XV-5 754.5 1-I 748.8 5.7 15.9 127.5 110.0 0.532 80.8 2.7<br />
58097 XV-5 754.5 2-IIINF 743.5 11.0 21.2 2.7<br />
58098 XV-5 754.5 2-II 743.2 11.3 20.1 108.1 90.0 0.872 62.2 2.7<br />
58099 XV-5 754.5 2-I 742.8 11.7 21.1 112.6 93.0 0.812 70.2 2.7<br />
58100 XV-5 754.5 3-III 737.5 17.0 23.1 109.6 89.0 0.893 69.8 2.7<br />
58101 XV-5 754.5 3-II 737.2 17.3 22.6 121.4 99.0 0.702 86.9 2.7<br />
58102 XV-5 754.5 3-INF 736.8 17.7 20.3 2.7<br />
58103 XV-5 754.5 4-III 731.5 23.0 20.4 106.0 88.0 0.915 60.2 2.7<br />
58104 XV-5 754.5 4-II 731.2 23.3 21.3 120.1 99.0 0.702 81.9 2.7<br />
58105 XV-5 754.5 4-I 730.8 23.7 22.6 130.0 106.0 0.589 103.5 2.7<br />
58106 XV-5 754.5 5-III 725.5 29.0 23.4 116.0 94.0 0.792 79.7 2.7<br />
58107 XV-5 754.5 5-IINF 725.2 29.3 22.9 2.7<br />
58108 XV-5 754.5 6-IV 719.8 34.7 24.7 117.2 94.0 0.792 84.2 2.7<br />
58109 XV-5 754.5 6-III 719.5 35.0 18.9 128.4 108.0 0.560 91.1 2.7<br />
58110 XV-5 754.5 6-II 719.2 35.3 18.4 136.2 115.0 0.465 106.8 2.7<br />
58111 XV-5 754.5 6-I 718.8 35.7 17.6 132.9 113.0 0.491 96.8 2.7<br />
58112 XV-5 754.5 7-IINF 714.3 40.2 18.3 130.1 110.0 0.532 92.9 2.7<br />
58062 XV-6 754.5 1-IV 747.8 6.7 13.8 115.1 101.1 0.666 55.9 2.7<br />
58063 XV-6 754.5 1-III 747.5 7.0 17.0 123.0 105.1 0.603 76.1 2.7<br />
58064 XV-6 754.5 1-II 747.2 7.3 22.9 126.0 102.5 0.644 96.1 2.7<br />
58065 XV-6 754.5 1-I 746.8 7.7 26.7 124.0 97.9 0.721 100.0 2.7<br />
58066 XV-6 754.5 2-III 741.5 13.0 28.9 124.0 96.2 0.751 103.9 2.7<br />
58067 XV-6 754.5 2-II 741.2 13.3 19.1 129.0 108.3 0.556 92.8 2.7<br />
58069 XV-6 754.5 3-III 735.5 19.0 22.4 124.0 101.3 0.663 91.2 2.7<br />
58070 XV-6 754.5 3-II 735.2 19.3 21.9 123.0 100.9 0.670 88.3 2.7<br />
58071 XV-6 754.5 3-I 734.8 19.7 22.3 121.0 98.9 0.704 85.6 2.7<br />
58073 XV-6 754.5 4-II 731.2 23.3 18.8 124.0 104.4 0.614 82.7 2.7<br />
58074 XV-6 754.5 4-I 730.8 23.7 20.3 124.0 103.1 0.634 86.4 2.7<br />
58076 XV-6 754.5 5-I 726.0 28.5 10.7 140.0 126.5 0.332 87.1 2.7<br />
58077 XV-6 754.5 6-III 720.3 34.2 13.2 138.0 121.9 0.382 93.3 2.7<br />
58078 XV-6 754.5 6-II 720.0 34.5 9.8 132.0 120.2 0.402 65.9 2.7<br />
58079 XV-6 754.5 6-I 719.7 34.8 13.6 143.0 125.9 0.338 108.6 2.7<br />
58090 XV-7 754.5 1-III 749.5 5.0 17.7 123.0 104.5 0.612 78.1 2.7<br />
58091 XV-7 754.5 1-II 749.2 5.3 29.0 124.0 96.1 0.753 104.0 2.7<br />
58047 XV-7 754.5 I-I 748.8 5.7 20.9 130.0 107.5 0.567 99.5 2.7<br />
58049 XV-7 754.5 2-II 743.2 11.3 20.8 123.0 101.8 0.655 85.7 2.7<br />
58050 XV-7 754.5 2-I 742.8 11.7 18.0 128.0 108.5 0.553 87.9 2.7<br />
58051 XV-7 754.5 3-IV 737.8 16.7 22.3 123.0 100.6 0.675 89.2 2.7<br />
58052 XV-7 754.5 3-III 737.5 17.0 20.9 130.0 107.5 0.567 99.5 2.7<br />
58053 XV-7 754.5 3-II 737.2 17.3 18.8 134.0 112.8 0.494 102.8 2.7<br />
58054 XV-7 754.5 3-I 736.8 17.7 16.8 134.0 114.7 0.469 96.7 2.7<br />
58055 XV-7 754.5 4-V 732.2 22.3 20.5 133.0 110.4 0.526 105.2 2.7<br />
58056 XV-7 754.5 4-IV 731.8 22.7 22.7 129.0 105.1 0.603 101.6 2.7<br />
58057 XV-7 754.5 4-III 731.5 23.0 17.6 133.9 113.9 0.479 99.2 2.7<br />
58058 XV-7 754.5 4-II 731.2 23.3 18.5 132.0 111.4 0.512 97.5 2.7<br />
58092 XV-8 754.5 1-III 747.5 7.0 23.6 129.0 104.4 0.614 103.8 2.7<br />
58093 XV-8 754.5 1-II 747.2 7.3 27.7 118.9 93.1 0.810 92.4 2.7<br />
58094 XV-8 754.5 1-I 746.8 7.7 27.0 121.0 95.3 0.768 94.9 2.7<br />
58098 XV-8 754.5 3-IV 742.2 12.3 23.4 128.0 103.7 0.625 101.1 2.7<br />
Specific<br />
Gravity<br />
W:\WORKGRP\DATA\Yprashar\Projects\<strong>Dingee</strong>\Lab_Data\MAIN_<strong>Dingee</strong> <strong>Reservoir</strong> - Summary for Laboratory Testing Program.xls 7/30/2008
2<br />
119<br />
120<br />
121<br />
122<br />
123<br />
124<br />
125<br />
126<br />
127<br />
128<br />
129<br />
130<br />
131<br />
132<br />
133<br />
134<br />
135<br />
136<br />
137<br />
138<br />
139<br />
140<br />
141<br />
142<br />
143<br />
144<br />
145<br />
146<br />
147<br />
148<br />
149<br />
150<br />
151<br />
152<br />
153<br />
154<br />
155<br />
156<br />
157<br />
158<br />
159<br />
160<br />
161<br />
162<br />
163<br />
164<br />
165<br />
166<br />
167<br />
168<br />
169<br />
170<br />
171<br />
172<br />
173<br />
174<br />
175<br />
176<br />
177<br />
TABLE B-1<br />
SUMMARY OF LABORATORY TEST RESULTS<br />
A B C D E F G H I J K L<br />
Lab No Boring<br />
Surface<br />
Elevation (FT)<br />
Sample No Elevation (FT) Depth(FT) MC %<br />
Total Density<br />
(PCF)<br />
Dry<br />
Density<br />
(PCF)<br />
Void Ratio Saturation<br />
(%)<br />
58095 XV-8 754.5 2-III 741.5 13.0 20.5 118.0 97.9 0.721 76.8 2.7<br />
58096 XV-8 754.5 2-II 741.2 13.3 20.2 122.0 101.5 0.660 82.6 2.7<br />
58097 XV-8 754.5 2-I 740.8 13.7 19.9 122.1 101.8 0.655 82.0 2.7<br />
57374 XV-8 754.5 5-I 736.3 18.2 10.4 158.0 143.1 0.177 158.3 2.7<br />
58099 XV-8 754.5 3-III 735.5 19.0 23.7 128.0 103.5 0.628 101.9 2.7<br />
58100 XV-8 754.5 3-II 735.2 19.3 25.2 123.9 99.0 0.702 96.9 2.7<br />
58101 XV-8 754.5 3-I 734.8 19.7 25.0 123.0 98.4 0.712 94.8 2.7<br />
58103 XV-8 754.5 5-I 724.3 30.2 11.6 139.9 125.4 0.344 91.2 2.7<br />
58080 XV-9 754.5 1-III 749.5 5.0 24.4 126.0 101.3 0.663 99.3 2.7<br />
58081 XV-9 754.5 1-II 749.2 5.3 23.2 126.0 102.3 0.647 96.8 2.7<br />
58082 XV-9 754.5 1-I 748.8 5.7 24.6 126.0 101.1 0.666 99.7 2.7<br />
58083 XV-9 754.5 2-IV 743.8 10.7 21.1 125.9 104.0 0.620 91.9 2.7<br />
58084 XV-9 754.5 2-III 743.5 11.0 23.4 125.0 101.3 0.663 95.3 2.7<br />
58085 XV-9 754.5 2-II 743.2 11.3 22.4 131.9 107.8 0.563 107.4 2.7<br />
58086 XV-9 754.5 2-I 742.8 11.7 26.3 126.0 99.8 0.688 103.2 2.7<br />
58088 XV-9 754.5 3-I 737.8 16.7 10.9 140.0 126.2 0.335 87.8 2.7<br />
58089 XV-9 754.5 4-I 732.3 22.2 11.5 131.0 117.5 0.434 71.6 2.7<br />
58104 XV-10 754 1-III 749.0 5.0 9.1 121.0 110.9 0.519 47.3 2.7<br />
58105 XV-10 754 1-II 748.7 5.3 9.4 137.0 125.2 0.346 73.4 2.7<br />
58106 XV-10 754 1-I 748.3 5.7 8.0 131.0 121.3 0.389 55.5 2.7<br />
58107 XV-10 754 3-II 736.7 17.3 16.4 133.0 114.3 0.474 93.4 2.7<br />
58108 XV-10 754 3-I 736.3 17.7 16.7 117.1 100.3 0.680 66.3 2.7<br />
58109 XV-10 754 4-IV 731.3 22.7 20.0 129.0 107.5 0.567 95.2 2.7<br />
58110 XV-10 754 4-III 731.0 23.0 19.1 132.0 110.8 0.521 99.1 2.7<br />
58111 XV-10 754 4-II 730.7 23.3 18.3 131.0 110.7 0.522 94.7 2.7<br />
58112 XV-10 754 4-I 730.3 23.7 19.0 133.0 111.8 0.507 101.2 2.7<br />
58113 XV-10 754 5-V 725.7 28.3 17.3 134.0 114.2 0.475 98.3 2.7<br />
58114 XV-10 754 5-IV 725.3 28.7 15.4 137.0 118.7 0.419 99.1 2.7<br />
58115 XV-10 754 5-III 725.0 29.0 16.8 136.0 116.4 0.447 101.4 2.7<br />
58116 XV-10 754 5-II 724.7 29.3 19.0 137.0 115.1 0.464 110.6 2.7<br />
58117 XV-10 754 5-I 724.3 29.7 12.2 134.0 119.4 0.411 80.1 2.7<br />
2007 XV-11 772.7 MC-1-I 769.7 3.0 17.1 123.3 105.3 0.600 77.0 2.7<br />
2007 XV-11 772.7 MC-2-I 767.2 5.5 15.0 - - - - 2.7<br />
2007 XV-11 772.7 MC-3-I 764.7 8.0 15.0 126.6 110.1 0.530 76.4 2.7<br />
2007 XV-11 772.7 MC-4-II 762.2 10.5 20.8 125.1 103.6 0.626 89.7 2.7<br />
2007 XV-11 772.7 MC-4-I 761.7 11.0 22.3 124.3 101.6 0.658 91.5 2.7<br />
2007 XV-11 772.7 MC-5-I 759.2 13.5 21.8 125.8 103.3 0.631 93.3 2.7<br />
2007 XV-11 772.7 MC-6-I 756.7 16.0 12.8 137.6 122.0 0.381 90.7 2.7<br />
2007 XV-11 772.7 MC-7-I 754.7 18.0 8.2 140.2 129.6 0.300 73.8 2.7<br />
2007 XV-11 772.7 MC-8-I 752.2 20.5 6.4 122.1 114.8 0.468 37.0 2.7<br />
2007 XV-11 772.7 MC-9-I 746.7 26.0 8.0 141.3 130.8 0.288 75.0 2.7<br />
2007 XV-12 772.2 MC-1-1 768.9 3.3 15.2 136.3 118.3 0.424 96.8 2.7<br />
2007 XV-12 772.2 MC-2-I 766.7 5.5 16.4 134.2 115.3 0.461 96.0 2.7<br />
2007 XV-12 772.2 MC-3-I 764.2 8.0 15.0 136.9 119.0 0.416 97.4 2.7<br />
2007 XV-12 772.2 MC-4-I 761.7 10.5 15.1 135.0 117.3 0.436 93.4 2.7<br />
2007 XV-12 772.2 PT-5 760.7 11.5 18.9 126.6 106.5 0.582 87.7 2.7<br />
2007 XV-12 772.2 PT-6 759.2 13.0 21.1 129.6 107.0 0.575 99.2 2.7<br />
2007 XV-12 772.2 PT-6 758.7 13.5 17.2 134.9 115.1 0.464 100.1 2.7<br />
2007 XV-12 772.2 PT-6 758.2 14.0 19.6 130.8 109.4 0.540 98.0 2.7<br />
2007 XV-12 772.2 PT-7 756.7 15.5 21.1 130.9 108.1 0.559 102.0 2.7<br />
2007 XV-12 772.2 752.2 20.0 20.1 129.9 108.2 0.557 97.4 2.7<br />
2007 XV-12 772.2 PT-9 749.7 22.5 20.9 131.1 108.4 0.554 101.8 2.7<br />
2007 XV-12 772.2 PT-9 749.5 22.7 20.9 130.6 108 0.560 100.8 2.7<br />
2007 XV-12 772.2 PT-9 749.2 23.0 19.0 132.3 111.2 0.515 99.6 2.7<br />
2007 XV-12 772.2 PT-10 747.2 25.0 13.8 139.3 122.4 0.376 99.0 2.7<br />
2007 XV-12 772.2 PT-10 747.0 25.2 21.5 130.0 107.0 0.575 101.0 2.7<br />
2007 XV-12 772.2 PT-10 746.8 25.4 17.4 134.8 114.8 0.468 100.5 2.7<br />
2007 XV-12 772.2 PT-10 746.7 25.5 16.7 135.0 115.7 0.456 98.8 2.7<br />
2007 XV-12 772.2 MC-13-I 741.7 30.5 8.7 149.1 137.2 0.228 103.0 2.7<br />
Specific<br />
Gravity<br />
W:\WORKGRP\DATA\Yprashar\Projects\<strong>Dingee</strong>\Lab_Data\MAIN_<strong>Dingee</strong> <strong>Reservoir</strong> - Summary for Laboratory Testing Program.xls 7/30/2008
TABLE B-1<br />
SUMMARY OF LABORATORY TEST RESULTS<br />
2<br />
178<br />
179<br />
180<br />
181<br />
182<br />
183<br />
184<br />
185<br />
186<br />
187<br />
188<br />
189<br />
190<br />
191<br />
192<br />
193<br />
194<br />
195<br />
196<br />
197<br />
198<br />
199<br />
200<br />
201<br />
202<br />
203<br />
204<br />
205<br />
206<br />
207<br />
208<br />
209<br />
210<br />
211<br />
212<br />
213<br />
214<br />
215<br />
216<br />
217<br />
218<br />
219<br />
220<br />
221<br />
222<br />
223<br />
224<br />
225<br />
226<br />
227<br />
228<br />
229<br />
230<br />
A B C D E F G H I J K L<br />
Lab No Boring<br />
Surface<br />
Elevation (FT)<br />
Sample No Elevation (FT) Depth(FT) MC %<br />
Total Density<br />
(PCF)<br />
Dry<br />
Density<br />
(PCF)<br />
Void Ratio Saturation<br />
(%)<br />
2007 XV-12 772.2 MC-14-I 736.7 35.5 10.9 145.2 130.9 0.287 102.5 2.7<br />
2007 XV-12 772.2 MC-15-I 732.2 40.0 9.9 147.3 134 0.257 103.9 2.7<br />
2007 XV-13 773.2 MC-1-I 767.2 6.0 19.8 123.5 103.1 0.634 84.3 2.7<br />
2007 XV-13 773.2 MC-2-I 762.7 10.5 18.0 127.7 108.2 0.557 87.2 2.7<br />
2007 XV-13 773.2 MC-3-II 760.2 13.0 23.3 124.5 101 0.668 94.2 2.7<br />
2007 XV-13 773.2 MC-3-I 759.7 13.5 23.0 154.6 125.7 0.340 182.5 2.7<br />
2007 XV-13 773.2 MC-4 758.2 15.0 22.5 128.6 105.0 0.605 100.5 2.7<br />
2007 XV-13 773.2 MC-4 757.7 15.5 21.3 130.0 107.2 0.572 100.6 2.7<br />
2007 XV-13 773.2 MC-4-I 757.7 15.5 21.3 130.0 107.2 0.572 100.6 2.7<br />
2007 XV-13 773.2 MC-5 755.7 17.5 22.0 130.4 106.9 0.576 103.1 2.7<br />
2007 XV-13 773.2 MC-5-II 755.7 17.5 22.9 129.5 105.4 0.598 103.3 2.7<br />
2007 XV-13 773.2 MC-5 755.5 17.7 23.8 128.6 103.9 0.622 103.4 2.7<br />
2007 XV-13 773.2 MC-5-I 755.2 18.0 20.3 129.7 107.8 0.563 97.4 2.7<br />
2007 XV-13 773.2 MC-7 749.4 23.8 21.3 131.5 108.4 0.554 103.8 2.7<br />
2007 XV-13 773.2 MC-7 749.2 24.0 22.8 126.0 102.6 0.642 95.9 2.7<br />
2007 XV-13 773.2 MC-7 749.0 24.2 20.1 133.6 111.2 0.515 105.4 2.7<br />
2007 XV-13 773.2 MC-7 748.8 24.4 22.8 129.4 105.4 0.598 102.9 2.7<br />
2007 XV-13 773.2 MC-8-I 747.2 26.0 24.7 121.8 97.7 0.724 92.1 2.7<br />
2007 XV-13 773.2 MC-9-III 745.7 27.5 21.3 123.5 101.8 0.655 87.8 2.7<br />
2007 XV-13 773.2 MC-9-II 745.2 28.0 19.8 127.1 106.1 0.588 90.9 2.7<br />
2007 XV-13 773.2 MC-10 742.2 31.0 21.3 130.4 107.5 0.567 101.4 2.7<br />
2007 XV-13 773.2 MC-10 742.0 31.2 21.9 127.9 104.9 0.606 97.6 2.7<br />
2007 XV-13 773.2 MC-10 741.8 31.4 21.1 129.9 107.3 0.570 99.9 2.7<br />
2007 XV-13 773.2 MC-11-II 737.8 35.4 21.4 128.7 106.0 0.589 98.0 2.7<br />
2007 XV-13 773.2 MC-12-I 734.2 39.0 11.6 135.3 121.2 0.390 80.3 2.7<br />
2007 XV-13 773.2 MC-13-I 730.7 42.5 10.3 138.0 125.1 0.347 80.2 2.7<br />
2007 XV-14 754.2 MC-1-I 749.7 4.5 20.1 130.3 108.5 0.553 98.2 2.7<br />
2007 XV-14 754.2 SH-2 747.7 6.5 27.0 119.4 94.0 0.792 92.0 2.7<br />
2007 XV-14 754.2 SH-2 747.7 6.5 27.0 119.4 94.0 0.792 92.0 2.7<br />
2007 XV-14 754.2 SH-2 747.5 6.7 27.9 120.0 93.8 0.796 94.6 2.7<br />
2007 XV-14 754.2 SH-4 742.2 12.0 20.7 130.6 108.2 0.557 100.3 2.7<br />
2007 XV-14 754.2 SH-4 741.7 12.5 19.6 131.3 109.8 0.534 99.0 2.7<br />
2007 XV-14 754.2 MC-5-I 736.7 17.5 18.8 133.5 112.4 0.499 101.7 2.7<br />
2007 XV-14 754.2 MC-5-I 736.7 17.5 18.8 133.5 112.4 0.499 101.7 2.7<br />
2007 XV-14 754.2 SH-6 733.8 20.4 22.1 129.2 105.8 0.592 100.7 2.7<br />
2007 XV-14 754.2 SH-6 733.2 21 23.5 127.1 102.9 0.637 99.6 2.7<br />
2007 XV-14 754.2 SH-7 731.2 23.0 19.8 131.3 109.6 0.537 99.5 2.7<br />
2007 XV-14 754.2 SH-7 731.0 23.2 18.3 132.0 111.6 0.510 96.9 2.7<br />
2007 XV-14 754.2 SH-7 730.8 23.4 19.2 131.6 110.4 0.526 98.5 2.7<br />
2007 XV-14 754.2 SH-7 730.7 23.5 18.3 133.0 112.4 0.499 99.0 2.7<br />
2007 XV-15 754.5 MC-1-III 749.5 5.0 21.5 121.6 100.1 0.683 85.0 2.7<br />
2007 XV-15 754.5 MC-1-II 749.0 5.5 25.8 122.3 97.2 0.733 95.0 2.7<br />
2007 XV-15 754.5 MC-1-II 748.8 5.7 21.5 128.3 105.6 0.595 97.5 2.7<br />
2007 XV-15 754.5 MC-1-II 748.6 5.9 24.4 125.0 100.5 0.676 97.4 2.7<br />
2007 XV-15 754.5 MC-1-I 748.5 6.0 17.2 133.3 113.7 0.482 96.4 2.7<br />
2007 XV-15 754.5 MC-2-II 745.0 9.5 17.2 135.5 115.6 0.457 101.5 2.7<br />
2007 XV-15 754.5 MC-2-II 744.8 9.7 23.5 126.5 102.4 0.645 98.3 2.7<br />
2007 XV-15 754.5 MC-2-II 744.6 9.9 25.0 127.0 101.6 0.658 102.5 2.7<br />
2007 XV-15 754.5 MC-2-I 744.5 10.0 24 125.7 101.4 0.662 98.0 2.7<br />
2007 XV-15 754.5 MC-3-II 742.0 12.5 7.8 134.1 124.4 0.354 59.4 2.7<br />
2007 XV-15 754.5 MC-3-I 741.5 13.0 15.2 137.4 119.3 0.412 99.6 2.7<br />
2007 XV-15 754.5 MC-4-I 739.0 15.5 8.4 133.5 123.2 0.368 61.7 2.7<br />
2007 XV-15 754.5 SPT-6 731.5 23.0 9.0 - - - - 2.7<br />
Specific<br />
Gravity<br />
W:\WORKGRP\DATA\Yprashar\Projects\<strong>Dingee</strong>\Lab_Data\MAIN_<strong>Dingee</strong> <strong>Reservoir</strong> - Summary for Laboratory Testing Program.xls 7/30/2008
TABLE B-2<br />
SUMMARY OF ATTERBERG LIMIT TEST RESULTS<br />
Lab No Boring LED<br />
Surface<br />
Elevation (FT)<br />
Sample No Elevation (FT) Depth(FT) MC %<br />
Total Density<br />
(PCF)<br />
Dry<br />
Density<br />
(PCF)<br />
Void Ratio Saturation<br />
(%)<br />
Specific<br />
Gravity<br />
Passing #200<br />
Sieve (%)<br />
2007 XV-11 @ 772.7 MC-1-I 769.7 3.0 17.1 123.3 105.3 0.600 77.0 2.7 62.5 40 19 21<br />
2007 XV-11 @ 772.7 MC-2-I 767.2 5.5 15.0 - - - - 2.7 45.3 - - -<br />
2007 XV-11 @ 772.7 MC-4-II 762.2 10.5 20.8 125.1 103.6 0.626 89.7 2.7 63.0 - - -<br />
2007 XV-11 @ 772.7 MC-4-I 761.7 11.0 22.3 124.3 101.6 0.658 91.5 2.7 65.8 47 22 25<br />
2007 XV-12 @ 772.2 MC-1-1 768.9 3.3 15.2 136.3 118.3 0.424 96.8 2.7 48.1 - - -<br />
2007 XV-12 @ 772.2 MC-2-I 766.7 5.5 16.4 134.2 115.3 0.461 96.0 2.7 45.4 34 18 16<br />
2007 XV-12 @ 772.2 MC-4-I 761.7 10.5 15.1 135.0 117.3 0.436 93.4 2.7 66.5 48 21 27<br />
2007 XV-12 @ 772.2 PT-6 759.2 13.0 21.1 129.6 107.0 0.575 99.2 2.7 63.2 36 19 17<br />
2007 XV-12 @ 772.2 PT-6 758.7 13.5 17.2 134.9 115.1 0.464 100.1 2.7 47.7 - - -<br />
2007 XV-12 @ 772.2 PT-6 758.2 14.0 19.6 130.8 109.4 0.540 98.0 2.7 65.3 - - -<br />
2007 XV-12 @ 772.2 PT-7 756.7 15.5 21.1 130.9 108.1 0.559 102.0 2.7 65.3 37 19 18<br />
2007 XV-12 @ 772.2 PT-9 749.2 23.0 19.0 132.3 111.2 0.515 99.6 2.7 70.5 - - -<br />
2007 XV-13 @ 773.2 MC-1-I 767.2 6.0 19.8 123.5 103.1 0.634 84.3 2.7 64.0 - - -<br />
2007 XV-13 @ 773.2 MC-3-I 759.7 13.5 23.0 154.6 125.7 0.340 182.5 2.7 61.8 29 17 12<br />
2007 XV-13 @ 773.2 MC-5-I 755.2 18.0 20.3 129.7 107.8 0.563 97.4 2.7 67.6 40 20 20<br />
2007 XV-13 @ 773.2 MC-8-I 747.2 26.0 24.7 121.8 97.7 0.724 92.1 2.7 72.4 - - -<br />
2007 XV-13 @ 773.2 MC-9-III 745.7 27.5 21.3 123.5 101.8 0.655 87.8 2.7 64.4 31 20 11<br />
2007 XV-14 @ 754.2 SH-4 741.7 12.5 19.6 131.3 109.8 0.534 99.0 2.7 60.4 - - -<br />
2007 XV-14 @ 754.2 SH-6 733.8 20.4 22.1 129.2 105.8 0.592 100.7 2.7 78.8 45 21 24<br />
2007 XV-14 @ 754.2 SH-6 733.2 21 23.5 127.1 102.9 0.637 99.6 2.7 81.3 - - -<br />
2007 XV-14 @ 754.2 SH-7 730.7 23.5 18.3 133.0 112.4 0.499 99.0 2.7 62.5 - - -<br />
2007 XV-15 @ 754.5 MC-1-III 749.5 5.0 21.5 121.6 100.1 0.683 85.0 2.7 59.5 29 18 11<br />
2007 XV-15 @ 754.5 MC-1-I 748.5 6.0 17.2 133.3 113.7 0.482 96.4 2.7 57.5 27 17 10<br />
2007 XV-15 @ 754.5 MC-2-I 744.5 10.0 24 125.7 101.4 0.662 98.0 2.7 80.3 53 22 31<br />
2007 XV-15 @ 754.5 MC-3-I 741.5 13.0 15.2 137.4 119.3 0.412 99.6 2.7 67.1 - - -<br />
Liquid<br />
Limit<br />
(%)<br />
Plastic<br />
Limit (%)<br />
Plasticity<br />
Index<br />
W:\WORKGRP\DATA\Yprashar\Projects\<strong>Dingee</strong>\Lab_Data\MAIN_<strong>Dingee</strong> <strong>Reservoir</strong> - Summary for Laboratory Testing Program.xls<br />
TALBE B-2 - PI 7/30/2008
TABLE B-3<br />
SUMMARY OF CONSOLIDATED UNDRAINED TRIAXIAL COMPRESSION TEST RESULTS<br />
Boring Led Elevation Sample Surface Elevation Depth Test Soil Unit<br />
Fill or<br />
Bedrock<br />
Soil Symbol MC %<br />
Total<br />
Density<br />
(PCF)<br />
Dry<br />
Density<br />
(PCF)<br />
Void<br />
Ratio<br />
Saturatio<br />
n (%)<br />
Specific<br />
Gravity<br />
Sigma 3<br />
(PSF)<br />
Deviator<br />
Stress<br />
(psf)<br />
Delta U<br />
(psf)<br />
Sigma 1<br />
(psf)<br />
Sig1/<br />
Sig3<br />
Strain Eff. sig1 Eff. sig3<br />
XV-12 @ 766.5 MC-2-I 772.2 766.5 5.8 TXCU-I Clayey Sand w/ gravel _Fill CL 16.4 134.2 115.3 0.46 96.0 2.70 1500.0 2200.0 780.0 3700.0 4.06 2.90 2920.0 720.0 1820.0 1100.0 2600.0 1100.0<br />
XV-12 @ 759.0 PT-6 772.2 759.0 13.3 TXCU-I Br. Sandy lean clay _Fill CL 21.1 129.6 107.0 0.57 99.2 2.70 2000.0 2410.0 930.0 4410.0 3.25 5.00 3480.0 1070.0 2275.0 1205.0 3205.0 1205.0<br />
XV-12 @ 758.5 PT-6 772.2 758.5 13.8 TXCU-I Br and gr sandy clay _Fill CL 19.6 130.8 109.4 0.54 98.0 2.70 4500.0 4410.0 2510.0 8910.0 3.22 4.50 6400.0 1990.0 4195.0 2205.0 6705.0 2205.0<br />
XV-12 @ 758.2 PT-6 772.2 758.2 14.0 TXCU-I Br. Sandy lean clay _Fill CL 17.2 135.0 115.2 0.46 100.4 2.70 3500.0 3850.0 2120.0 7350.0 3.79 5.40 5230.0 1380.0 3305.0 1925.0 5425.0 1925.0<br />
XV-12 @ 751.9 PT-8 772.2 751.9 20.3 TXCU-I Olv sandy lean clay _Fill CL 20.1 129.9 108.2 0.56 97.4 2.70 4000.0 4010.0 2620.0 8010.0 3.91 3.90 5390.0 1380.0 3385.0 2005.0 6005.0 2005.0<br />
XV-13 @ 759.5 MC-3-I 773.2 759.5 13.8 TXCU-I Sandy lean clay _Fill CL 19.6 125.7 105.1 0.60 87.8 2.70 3000.0 8000.0 1850.0 11000.0 7.96 2.64 9150.0 1150.0 5150.0 4000.0 7000.0 4000.0<br />
XV-13 @ 745.5 MC-9-III 773.2 745.5 27.8 TXCU-I Sandy lean clay _Fill CL 21.3 123.5 101.8 0.66 87.8 2.70 6000.0 4700.0 4420.0 10700.0 3.97 4.79 6280.0 1580.0 3930.0 2350.0 8350.0 2350.0<br />
XV-13 @ 747.5 MC-8-II 773.2 747.5 25.8 TXCU-I lean clay w/ sand _Fill CL 20.1 131.3 109.3 0.54 100.2 2.70 2500.0 5600.0 1570.0 8100.0 7.02 2.72 6530.0 930.0 3730.0 2800.0 5300.0 2800.0<br />
XV-13 @ 748.0 MC-8-III 773.2 748.0 25.3 TXCU-I lean clay w/ sand _Fill CL 23.4 125.7 101.9 0.65 96.7 2.70 5000.0 6700.0 3270.0 11700.0 4.87 4.22 8430.0 1730.0 5080.0 3350.0 8350.0 3350.0<br />
XV-14 @ 742.0 SH-4 754.2 742.0 12.3 TXCU-I Sandy lean clay _Fill CL 20.7 130.6 108.2 0.56 100.3 2.70 3600.0 5900.0 2470.0 9500.0 6.22 3.15 7030.0 1130.0 4080.0 2950.0 6550.0 2950.0<br />
XV-14 @ 741.5 SH-4 754.2 741.5 12.8 TXCU-I Sandy lean clay _Fill CL 19.6 131.3 109.8 0.53 99.0 2.70 1800.0 3400.0 1080.0 5200.0 5.72 2.03 4120.0 720.0 2420.0 1700.0 3500.0 1700.0<br />
XV-1 @ 765.7 2-III 772.7 765.7 7 TXCU-I Gravelly clay, some sand _Fill CL 22.0 130.3 106.8 0.58 102.9 2.70 432.0 1046.9 216.0 1478.9 5.88 10.60 216.0 1262.9 739.4 523.4 955.4 523.4<br />
XV-1 @ 765.4 2-II 772.7 765.4 7.3 TXCU-I Gravelly clay, some sand _Fill CL 19.3 132.9 111.4 0.51 101.7 2.70 1008.0 1873.4 216.0 2881.4 3.37 10.70 792.0 2665.4 1728.7 936.7 1944.7 936.7<br />
XV-1 @ 765.0 2-I 772.7 765.0 7.7 TXCU-I Gravelly clay, some sand _Fill CL 19.6 131.0 109.5 0.54 98.2 2.70 1584.0 2285.3 288.0 3869.3 2.76 10.20 1296.0 3581.3 2438.6 1142.6 2726.6 1142.6<br />
XV-2 @ 757.8 5-III 772.8 757.8 15 TXCU-I Gravelly clay, some sand _Fill CL 18.0 131.0 111.0 0.52 93.9 2.70 432.0 1146.2 144.0 1578.2 4.98 9.60 288.0 1434.2 861.1 573.1 1005.1 573.1<br />
XV-2 @ 757.5 5-II 772.8 757.5 15.3 TXCU-I Gravelly clay, some sand _Fill CL 18.1 130.3 110.3 0.53 92.6 2.70 1152.0 1902.2 288.0 3054.2 3.20 9.70 864.0 2766.2 1815.1 951.1 2103.1 951.1<br />
XV-2 @ 757.1 5-I 772.8 757.1 15.7 TXCU-I Sandy clay _Fill CL 19.5 130.3 109.0 0.55 96.5 2.70 1872.0 3065.8 216.0 4937.8 2.85 11.00 1656.0 4721.8 3188.9 1532.9 3404.9 1532.9<br />
XV-2 @ 749.1 7-IV 772.8 749.1 23.7 TXCU-I Sandy clay _Fill CL 22.0 127.9 104.8 0.61 97.8 2.70 1152.0 1882.1 504.0 3034.1 3.90 10.60 648.0 2530.1 1589.0 941.0 2093.0 941.0<br />
XV-2 @ 748.8 7-III 772.8 748.8 24 TXCU-I Sandy clay _Fill CL 21.3 129.3 106.6 0.58 99.1 2.70 1728.0 2861.3 144.0 4589.3 2.81 10.60 1584.0 4445.3 3014.6 1430.6 3158.6 1430.6<br />
XV-2 @ 748.5 7-II 772.8 748.5 24.3 TXCU-I Sandy clay _Fill CL 22.6 121.3 98.9 0.70 86.7 2.70 2304.0 2786.4 1008.0 5090.4 3.15 10.00 1296.0 4082.4 2689.2 1393.2 3697.2 1393.2<br />
XV-3 @ 766.1 2-III 773.1 766.1 7 TXCU-I Sandy silty clay, sm. grav. _Fill CL 17.8 132.9 112.8 0.49 97.4 2.70 432.0 1418.4 216.0 1850.4 7.57 9.20 216.0 1634.4 925.2 709.2 1141.2 709.2<br />
XV-3 @ 765.8 2-II 773.1 765.8 7.3 TXCU-I Sandy silty clay, sm. grav. _Fill CL 20.2 125.2 104.2 0.62 88.4 2.70 1008.0 1749.6 648.0 2757.6 5.86 10.60 360.0 2109.6 1234.8 874.8 1882.8 874.8<br />
XV-3 @ 765.4 2-I 773.1 765.4 7.7 TXCU-I Sandy gravelly clay _Fill CL 16.4 133.3 114.5 0.47 93.9 2.70 1584.0 3598.6 504.0 5182.6 4.33 10.60 1080.0 4678.6 2879.3 1799.3 3383.3 1799.3<br />
XV-8 @ 736.4 3-IV 754.7 736.4 18.33 TXCU-I Silty clay _Fill CL 19.9 131.8 109.9 0.53 100.8 2.70 1440.0 3582.7 576.0 5022.7 5.15 10.00 864.0 4446.7 2655.4 1791.4 3231.4 1791.4<br />
XV-8 @ 736.0 3-III 754.7 736.0 18.67 TXCU-I Silty clay _Fill CL 22.7 129.1 105.2 0.60 101.9 2.70 2160.0 4390.6 864.0 6550.6 4.39 10.40 1296.0 5686.6 3491.3 2195.3 4355.3 2195.3<br />
XV-8 @ 735.4 3-II 754.7 735.4 19.33 TXCU-I Silty sand _Fill SM 25.5 125.9 100.3 0.68 101.3 2.70 2880.0 4001.8 864.0 6881.8 2.99 9.20 2016.0 6017.8 4016.9 2000.9 4880.9 2000.9<br />
XV-8 @ 735.0 3-I 754.7 735.0 19.67 TXCU-I Silty clay _Fill CL 24.6 127.0 101.9 0.65 101.7 2.70 2880.0 4875.8 864.0 7755.8 3.42 10.00 2016.0 6891.8 4453.9 2437.9 5317.9 2437.9<br />
XV-10 @ 731.3 4-IV 754.0 731.3 22.7 TXCU-I Sandy clay _Fill CL 19.2 131.8 110.6 0.52 99.1 2.70 1440.0 3700.8 720.0 5140.8 6.14 9.20 720.0 4420.8 2570.4 1850.4 3290.4 1850.4<br />
XV-10 @ 731.0 4-III 754.0 731.0 23 TXCU-I Sandy clay _Fill CL 18.8 133.3 112.2 0.50 101.2 2.70 2880.0 5749.9 1008.0 8629.9 4.07 10.00 1872.0 7621.9 4747.0 2875.0 5755.0 2875.0<br />
XV-10 @ 730.7 4-II 754.0 730.7 23.3 TXCU-I Sandy clay _Fill CL 18.5 133.5 112.7 0.49 100.9 2.70 4320.0 7323.8 1296.0 11643.8 3.42 10.00 3024.0 10347.8 6685.9 3661.9 7981.9 3661.9<br />
XV-12 @ 748.9 PT-9 772.2 748.9 23.3 TXCU-I Olv gry lean clay w/ sand Native CL/CH 19.0 132.3 111.2 0.52 99.6 2.70 3000.0 2400.0 1280.0 5400.0 2.40 4.80 4120.0 1720.0 2920.0 1200.0 4200.0 1200.0<br />
XV-12 @ 746.5 PT-10 772.2 746.5 25.8 TXCU-I Lean to Fat Clay with Sand Native CL/CH 16.7 135.0 115.7 0.46 98.8 2.70 5950.0 3500.0 2420.0 9450.0 1.99 7.92 7030.0 3530.0 5280.0 1750.0 7700.0 1750.0<br />
XV-14 @ 733.5 SH-6 754.2 733.5 20.8 TXCU-I Lean to Fat Clay with Sand Native CL/CH 22.1 129.2 105.8 0.59 100.7 2.70 2500.0 2900.0 1180.0 5400.0 3.20 3.35 4220.0 1320.0 2770.0 1450.0 3950.0 1450.0<br />
XV-14 @ 733.0 SH-6 754.2 733.0 21.3 TXCU-I Lean to Fat Clay with Sand Native CL/CH 23.5 127.1 102.9 0.64 99.6 2.70 5000.0 2700.0 1930.0 7700.0 1.88 4.91 5770.0 3070.0 4420.0 1350.0 6350.0 1350.0<br />
XV-14 @ 730.5 SH-7 754.2 730.5 23.8 TXCU-I Lean to Fat Clay with Sand Native CL/CH 18.3 133.0 112.4 0.50 99.0 2.70 8000.0 4000.0 3720.0 12000.0 1.93 7.78 8280.0 4280.0 6280.0 2000.0 10000.0 2000.0<br />
XV-15 @ 744.3 MC-2-I 754.5 744.3 10.3 TXCU-I Lean to Fat Clay with Sand Native CL/CH 24.0 125.7 101.4 0.66 98.0 2.70 2500.0 3700.0 500.0 6200.0 2.85 3.13 5700.0 2000.0 3850.0 1850.0 4350.0 1850.0<br />
XV-15 @ 741.3 MC-3-I 754.5 741.3 13.3 TXCU-I Lean to Fat Clay with Sand Native CL/CH 15.2 137.4 119.3 0.41 99.6 2.70 4000.0 3200.0 1600.0 7200.0 2.33 6.02 5600.0 2400.0 4000.0 1600.0 5600.0 1600.0<br />
XV-7 @ 750.3 4-IV 773.0 750.3 22.7 TXCU-I Lean to Fat Clay with Sand Native CL/CH 21.8 129.8 106.6 0.58 101.4 2.70 1440.0 2103.8 360.0 3543.8 2.95 9.00 1080.0 3183.8 2131.9 1051.9 2491.9 1051.9<br />
XV-5 @ 738.3 6-IV 773.0 738.3 34.7 TXCU-I Moderately Weathered BR Sandstone SS 19.5 132.6 111.0 0.52 101.7 2.70 2160.0 5446.1 1152.0 7606.1 6.40 10.60 1008.0 6454.1 3731.0 2723.0 4883.0 2723.0<br />
XV-5 @ 738.0 6-III 773.0 738.0 35 TXCU-I Moderately Weathered BR Sandstone SS 19.3 132.4 111.0 0.52 100.6 2.70 3600.0 6701.8 1368.0 10301.8 4.00 10.50 2232.0 8933.8 5582.9 3350.9 6950.9 3350.9<br />
XV-5 @ 737.7 6-II 773.0 737.7 35.3 TXCU-I Moderately Weathered BR Sandstone SS 18.0 134.4 113.9 0.48 101.4 2.70 5040.0 8402.4 1152.0 13442.4 3.16 10.40 3888.0 12290.4 8089.2 4201.2 9241.2 4201.2<br />
XV-5 @ 737.3 6-I 773.0 737.3 35.7 TXCU-I Moderately Weathered BR Sandstone SS 17.8 135.2 114.8 0.47 102.8 2.70 5040.0 8455.7 864.0 13495.7 3.02 10.70 4176.0 12631.7 8403.8 4227.8 9267.8 4227.8<br />
XV-7 @ 750.7 4-V 773.0 750.7 22.3 TXCU-I Moderately Weathered BR Sandstone SS 18.1 135.5 114.7 0.47 104.2 2.70 2880.0 5906.9 1152.0 8786.9 4.42 10.00 1728.0 7634.9 4681.4 2953.4 5833.4 2953.4<br />
XV-7 @ 750.0 4-III 773.0 750.0 23 TXCU-I Moderately Weathered BR Sandstone SS 17.8 134.6 114.3 0.47 101.4 2.70 2880.0 5833.4 864.0 8713.4 3.89 10.00 2016.0 7849.4 4932.7 2916.7 5796.7 2916.7<br />
XV-7 @ 749.7 4-II 773.0 749.7 23.3 TXCU-I Moderately Weathered BR Sandstone SS 18.0 134.6 114.1 0.48 102.0 2.70 4320.0 5977.4 936.0 10297.4 2.77 10.00 3384.0 9361.4 6372.7 2988.7 7308.7 2988.7<br />
P-Prime<br />
(PSF)<br />
Q-Prime<br />
(PSF)<br />
P-TOT<br />
(PSF)<br />
Q-TOT<br />
(PSF)<br />
PT Pitcher Tube Sampler<br />
MC Modifyed California Sampler<br />
SH Shelby Tube Sampler<br />
TXCU-I Triaxial Test - Consolidated Undrained (Isotropic)<br />
W:\WORKGRP\DATA\Yprashar\Projects\<strong>Dingee</strong>\Lab_Data\SHEAR STRENGTH_Results_1.xls<br />
TABLE B-3 TXCU-I<br />
7/30/2008<br />
3:39 PM
TABLE B-4<br />
UNCONFINED COMRESSION TEST RESULTS<br />
Lab No Boring Led Elevation Sample<br />
Fill or<br />
Bedrock<br />
Soil<br />
Symbol<br />
MC %<br />
Total<br />
Density<br />
(PCF)<br />
Dry<br />
Density<br />
(PCF)<br />
Void<br />
Ratio<br />
Saturatio<br />
n (%)<br />
Specific<br />
Gravity<br />
Sigma 3<br />
(PSF)<br />
Deviator<br />
Stress<br />
(psf)<br />
Sigma 1<br />
(psf)<br />
Strain P-TOT<br />
(PSF)<br />
NA XV-11 @ 762.2 MC-4-II Fill 20.8 125.1 103.6 0.63 89.7 2.70 2000.0 950.0 2950.0 5.00 2475.0 475.0 475<br />
NA XV-11 @ 761.7 MC-4-I Fill 22.3 124.3 101.6 0.66 91.5 2.70 1500.0 1200.0 2700.0 5.00 2100.0 600.0 600<br />
NA XV-11 @ 756.7 MC-6-I Native 12.8 137.6 122.0 0.38 90.7 2.70 5000.0 7500.0 12500.0 5.00 8750.0 3750.0 3750<br />
NA XV-12 @ 764.2 MC-3-I Fill 15.0 136.9 119.0 0.42 97.4 2.70 1500.0 3600.0 5100.0 5.00 3300.0 1800.0 1800<br />
NA XV-12 @ 760.7 PT-5 Fill 18.9 126.6 106.5 0.58 87.7 2.70 2510.0 2000.0 4510.0 5.00 3510.0 1000.0 1000<br />
NA XV-13 @ 760.2 MC-3-II Fill 23.3 124.5 101.0 0.67 94.2 2.70 3000.0 1600.0 4600.0 5.00 3800.0 800.0 800<br />
NA XV-13 @ 747.2 MC-8-I Fill 24.7 121.8 97.7 0.72 92.1 2.70 5000.0 1950.0 6950.0 5.00 5975.0 975.0 975<br />
NA XV-13 @ 745.2 MC-9-II Native 19.8 127.1 106.1 0.59 90.9 2.70 6000.0 2800.0 8800.0 5.00 7400.0 1400.0 1400<br />
NA XV-12 @ 733.2 MC-12-I Sandstone 11.6 135.3 121.2 0.39 80.3 2.70 8000.0 5400.0 13400.0 1.90 10700.0 2700.0 2700<br />
NA XV-14 @ 736.7 MC-5-I Fill 18.8 133.5 112.4 0.50 101.7 2.70 2000.0 3150.0 5150.0 5.00 3575.0 1575.0 1575<br />
NA XV-15 @ 749.5 MC-1-III Fill 21.5 121.6 100.1 0.68 85.0 2.70 990.0 700.0 1690.0 5.00 1340.0 350.0 350<br />
NA XV-15 @ 742.0 MC-3-II Sandstone 7.8 134.1 124.4 0.35 59.4 2.70 3000.0 5400.0 8400.0 5.00 5700.0 2700.0 2700<br />
Q-TOT<br />
(PSF)<br />
Shear<br />
Strength<br />
(PSF)<br />
W:\WORKGRP\DATA\Yprashar\Projects\<strong>Dingee</strong>\Lab_Data\SHEAR STRENGTH_Results_1.xls<br />
TABLE B-4 - UU TEST<br />
7/30/2008<br />
3:40 PM
TABLE B-5<br />
DIRECT SHEAR TEST RESULTS<br />
Lab No Boring Led Elevation Sample Surface Elevation Depth Test<br />
Fill or<br />
Bedrock<br />
Soil<br />
Symbol<br />
NA XV-13 @ 757.7 MC-4-I 773.2 757.7 15.5 DS Fill 21.3 130.0 107.2 0.57 100.6 2.70 4.0 1.8 4000 1830<br />
NA XV-13 @ 758.2 MC-4-II 773.2 758.2 15.0 DS Fill 22.5 128.6 105.0 0.60 100.5 2.70 1.6 0.9 1600 900<br />
NA XV-13 @ 755.7 MC-5-II 773.2 755.7 17.5 DS Fill 22.0 130.4 106.9 0.58 103.1 2.70 3.0 1.7 3000 1710<br />
NA XV-13 @ 755.7 MC-5-II 773.2 755.7 17.5 DS Fill 23.8 128.6 103.9 0.62 103.4 2.70 8.0 2.0 8000 2000<br />
NA XV-13 @ 748.9 MC-7-I 773.2 748.9 24.3 DS Fill 22.8 129.4 105.4 0.60 102.9 2.70 5.5 1.8 5500 1780<br />
NA XV-13 @ 749.4 MC-7-II 773.2 749.4 23.8 DS Fill 21.3 131.5 108.4 0.55 103.8 2.70 5.5 2.3 5500 2250<br />
NA XV-13 @ 749.4 MC-7-II 773.2 749.4 23.8 DS Fill 22.8 126.0 102.6 0.64 95.9 2.70 3.0 1.7 3000 1730<br />
NA XV-13 @ 749.4 MC-7-II 773.2 749.4 23.8 DS Fill 20.1 133.6 111.2 0.52 105.4 2.70 8.0 3.0 8000 3020<br />
NA XV-14 @ 747.7 SH-2 754.2 747.7 6.5 DS Fill 27.0 119.4 94.0 0.79 92.0 2.70 1.0 0.9 1000 940<br />
NA XV-14 @ 747.7 SH-2 754.2 747.7 6.5 DS Fill 27.9 120.0 93.8 0.80 94.6 2.70 4.0 2.0 4000 2020<br />
NA XV-15 @ 749.0 MC-1-II 754.5 749.0 5.5 DS Fill 25.8 122.3 97.2 0.73 95.0 2.70 0.6 0.6 550 550<br />
NA XV-15 @ 749.0 MC-1-II 754.5 749.0 5.5 DS Fill 21.5 128.3 105.6 0.60 97.5 2.70 1.0 0.9 1000 850<br />
NA XV-15 @ 749.0 MC-1-II 754.5 749.0 5.5 DS Fill 24.4 125.0 100.5 0.68 97.4 2.70 2.0 1.3 2000 1330<br />
MC %<br />
Total<br />
Density<br />
(PCF)<br />
Dry<br />
Density<br />
(PCF)<br />
Void<br />
Ratio<br />
Saturatio<br />
n (%)<br />
Specific<br />
Gravity<br />
Normal<br />
Stress<br />
(ksf)<br />
Failure<br />
Stress<br />
(ksf)<br />
Normal<br />
Stress<br />
(PSF)<br />
Failure<br />
Stress<br />
(PSF)<br />
W:\WORKGRP\DATA\Yprashar\Projects\<strong>Dingee</strong>\Lab_Data\SHEAR STRENGTH_Results_1.xls<br />
TABLE B-5 - DIRECT SHEAR<br />
7/30/2008<br />
3:42 PM
Appendix C<br />
Reference Drawings:<br />
LIST OF PLATES<br />
Plate 5808-G-01<br />
Plate 5808-G-02<br />
Plate 5808-G-03<br />
Plate 5553-G<br />
Plate 6318-G<br />
1503B488<br />
Surveillance Monument Locations<br />
Piezometer Location<br />
Piezometer Boring Logs<br />
Site Drainage Improvements<br />
Overflow and Drain System Improvements, Plan, Profile & Details.<br />
<strong>Dingee</strong> <strong>Reservoir</strong> - B-Maps<br />
<strong>Seismic</strong> Stability Evaluation <strong>Report</strong><br />
<strong>Dingee</strong> <strong>Reservoir</strong> Dam August 2008
Appendix D<br />
Geologic Evaluation <strong>Report</strong>:<br />
Joyce Associates<br />
(Subcontractor to Alan Kropp and Associates)<br />
<strong>Seismic</strong> Stability Evaluation <strong>Report</strong><br />
<strong>Dingee</strong> <strong>Reservoir</strong> Dam August 2008
Appendix E<br />
Ground Motion Studies<br />
Pacific Engineering & Analysis<br />
Subcontractor to Alan Kropp and Associates<br />
<strong>Seismic</strong> Stability Evaluation <strong>Report</strong><br />
<strong>Dingee</strong> <strong>Reservoir</strong> Dam August 2008
856 Seaview Drive PACIFIC ENGINEERING and ANALYSIS<br />
El Cerrito, CA 94530<br />
(510) 528-2821<br />
Fax 528-2135<br />
pacificengineering@juno.com<br />
August 1, 2008<br />
Dona Mann, C.E.<br />
Senior Engineer<br />
Alan Kropp & Associates<br />
2140 Shattuck Ave.,<br />
Berkeley, CA 94704<br />
RE: DINGEE Project<br />
Dear Miss Mann,<br />
Following your request we have developed a horizontal component deterministic design response<br />
spectrum (5% damped) at the 84 th percentile and three spectrally matched time histories for<br />
embankment analyses at the <strong>Dingee</strong> Dam. The <strong>Dingee</strong> <strong>Reservoir</strong> is located in Piedmont, California<br />
(37.8295 o , -122.2176) 0.3 km west of the Hayward fault and over 20 km east of the San Andreas fault.<br />
To assess controlling earthquake sources, since the <strong>Dingee</strong> Dam is quite small with an average height of<br />
about 20 ft, the deaggregation of the recent USGS National Hazard Maps was examined at peak<br />
acceleration (e.g. about 30 Hz) as well as 1.0 Hz.<br />
This frequency range was taken to cover the<br />
frequency range of dominant response of the dam and clearly showed the Hayward fault as the<br />
controlling source. The deterministic MCE is considered to rupture the entire Hayward - Rogers Creek<br />
system with a magnitude of M 7.25 (Hanks and Bakun, 2002).<br />
<strong>Dingee</strong> Dam rests on a few feet of native soils overlying sandstone bedrock. For the planned analyses<br />
of the embankment, ground motions were computed for a soft rock outcrop site. Based on an analysis<br />
of values at rock sites which have recorded strong ground motions, a typical V<br />
S<br />
(30m) value for soft<br />
rock is about 600m/sec (Silva et al., 1999). While measured shear-wave velocities at the site were not<br />
available, nearby Estates Dam, about 0.25 km (800 ft) southeast from <strong>Dingee</strong> Dam, had suspension log<br />
profiles from two boreholes that penetrate into shallow bedrock (URS, 2006). Based on these<br />
suspension surveys, depth to 1 km/sec material is estimated to occur at about 5m (15 ft) at the <strong>Dingee</strong><br />
Dam site.<br />
1
The next Generation Attenuation relations (NGA, 2008) developed by Abrahamson and Silva, Boore<br />
and Atkinson, Campbell and Bozorgnia, and Chiou and Youngs were used to compute estimates of<br />
median plus 1-sigma ground motions. These four relations were selected as they have characterized site<br />
conditions in terms of V<br />
S<br />
(30m) in a consistent manner. Additionally, several of the relations have<br />
included depth to 1 km/sec (or 2.5 km/sec) material as independent variables to more accurately<br />
characterize strong ground motions at sites with shallow depths to bedrock materials, as occurs at<br />
<strong>Dingee</strong> Dam. The NGA relations (NGA, 2008) provide median as well as median plus 1 standard<br />
deviation estimates of 5% damped pseudo absolute response spectra over the period range of 0.01 sec to<br />
10.00 sec. The estimates are for an average horizontal component termed GM roti which was developed<br />
to be independent of orientation of the horizontal component (NGA, 2008) and very closely reflects a<br />
geometrical average horizontal component. Figure 1 compares median plus 1 sigma estimates<br />
computed with the four selected relations for M 7.25 at a rupture distance of 0.3 km, a V<br />
S<br />
(30m) of 600<br />
m/sec, and depth to 1 km/sec material of 5m. Also shown is the weighted average (log average)<br />
spectrum (Table 1), assuming equal weights. It should be noted the range in 84 th percentile estimate<br />
(epistemic variability) is not large and may be underestimated as a result of the close cooperation<br />
between the NGA developers. This consideration typically does not impact deterministic assessments<br />
of 84 th percentile motions as it is usually neglected in the averaging process. For probabilistic hazard<br />
analyses, the lack of adequate epistemic variability for source and site location conditions poorly<br />
reflected in the strong motion database can result in motions at a higher exceedence frequency than<br />
desired. In computing the average (log) median plus 1 sigma spectrum shown in Figure 1, the epistemic<br />
variability (differences between the four estimates of the 84 th percentiles) has been included. This<br />
process results in an average 84 th percentile motion that includes both aleatory (randomness defined by<br />
the standard deviation of each ground motion relation) and epistemic variability.<br />
To develop time histories, the spectral matching criteria prescribed in ASCE 43-05 (2005) was<br />
followed. Input (basis) time histories (Table 2) were selected which displayed strong forward<br />
directivity pulses, considered appropriate for 84 th percentile motions. The spectral matching used a<br />
frequency<br />
PACIFIC ENGINEERING and ANALYSIS 2
Reference:<br />
American Society of Civil Engineers (2005). “<strong>Seismic</strong> design criteria for structures, systems, and<br />
components in nuclear facilities.” ASCE/SEI-4305.<br />
Hanks, T.C., and W.H. Bakun. (2002). “A bilinear source-scaling model for M-log A observations<br />
of Continental earthquakes.” Bull. Seismol. Soc. Am., 92(5), 1841-1846.<br />
NGA (2008) “Special Issue On The Next Generation Attenuation Project” Earthquake Spectra,<br />
24(1), Technical editors: J. Stewart, R. Archuleta, and M. Power.<br />
Silva, W. J.,S. Li, B. Darragh, and N. Gregor (1999). "Surface Geology Based Strong Motion<br />
Amplification Factors for the San Francisco <strong>Bay</strong> and Los Angeles Areas."A PEARL report to<br />
PG&E/CEC/Caltrans, Award No. SA2120-59652.<br />
Silva, W.J., Lee, K. (1987) "WES RASCAL code for synthesizing earthquake ground motions"<br />
State-of-the-Art for Assessing Earthquake Hazards in the United States, <strong>Report</strong> 24, U.S.<br />
Army Engineers Waterways Experiment Station, Misc. Paper S-73-1.<br />
URS Corporation (2006) “Dynamic stability analysis of Estates Dam.” Prepared for <strong>East</strong> <strong>Bay</strong><br />
<strong>Municipal</strong> <strong>Utility</strong> District, <strong>Final</strong> <strong>Report</strong>, volume 1: Main <strong>Report</strong>.<br />
PACIFIC ENGINEERING and ANALYSIS 4
Table 1<br />
Target Response Spectrum: Average Horizontal Component, 84 th percentile<br />
Frequency (Hz)<br />
84th<br />
.10000 .05357<br />
.13333 .09307<br />
.20000 .16393<br />
.25000 .20520<br />
.33333 .28713<br />
.50000 .45474<br />
.66667 .62946<br />
1.00000 .92656<br />
1.33333 1.19524<br />
1.66667 1.41412<br />
2.00000 1.62141<br />
2.50000 1.87789<br />
3.33333 2.13510<br />
5.00000 2.27501<br />
6.66667 2.18103<br />
10.00000 1.83484<br />
13.33333 1.57392<br />
20.00000 1.26975<br />
33.33333 1.06524<br />
100.00000 .96089<br />
PACIFIC ENGINEERING and ANALYSIS 5
Earthquak<br />
e<br />
Table 2<br />
Basis Time Histories<br />
Year M Rupture Site<br />
Mechanism<br />
Rupture<br />
Dist.(km)<br />
V<br />
S<br />
(30m)<br />
(m/sec)<br />
Component<br />
Landers 1992 7.3 SS* Lucerne 2.2 684.9 260<br />
Kobe 1995 6.9 SS Takarazuk 0.3 312.0 090<br />
a<br />
Kocaeli 1999 7.5 SS Arcelik 13.5 297.0 090<br />
* Strike slip<br />
PACIFIC ENGINEERING and ANALYSIS 6
Figure 1. Median plus 1-sigma response spectra (5% damping) computed for M 7.25 at<br />
a rupture distance of 0.3 km using four recent empirical relations (NGA, 2008) and the<br />
weighted average. V<br />
S<br />
(30m) is taken as 600m/sec with depth to 1 km/sec material as<br />
5m.<br />
PACIFIC ENGINEERING and ANALYSIS 7
Figure Set 2. Spectrally matched acceleration, velocity, and displacement time histories<br />
using the M 7.3, 1992 Landers earthquake site Lucerne (Table 1) as a basis time history.<br />
The following Figures show the spectral match (linear and logarithmic axes) as well as the<br />
spectral match-to-target ratios.<br />
PACIFIC ENGINEERING and ANALYSIS 8
Figure Set 2 (cont.)<br />
PACIFIC ENGINEERING and ANALYSIS 9
Figure Set 2 (cont.)<br />
PACIFIC ENGINEERING and ANALYSIS 10
Figure Set 2 (cont.)<br />
PACIFIC ENGINEERING and ANALYSIS 11
Figure Set 3. Spectrally matched acceleration, velocity, and displacement time histories<br />
using the M 7.5, 1999 Kocaeli, Turkey earthquake site Arcelik (Table 1) as a basis time<br />
history. The following Figures show the spectral match (linear and logarithmic axes) as<br />
well as the spectral match-to-target ratios.<br />
PACIFIC ENGINEERING and ANALYSIS 12
Figure Set 3 (cont.)<br />
PACIFIC ENGINEERING and ANALYSIS 13
Figure Set 3 (cont.)<br />
PACIFIC ENGINEERING and ANALYSIS 14
Figure Set 3 (cont.)<br />
PACIFIC ENGINEERING and ANALYSIS 15
Figure Set 4. Spectrally matched acceleration, velocity, and displacement time histories<br />
using the M 6.9, 1995 Kobe earthquake site Takarazuka (Table 1) as a basis time history.<br />
The following Figures show the spectral match (linear and logarithmic axes) as well as the<br />
spectral match-to-target ratios.<br />
PACIFIC ENGINEERING and ANALYSIS 16
Figure Set 4 (cont.)<br />
PACIFIC ENGINEERING and ANALYSIS 17
Figure Set 4 (cont.)<br />
PACIFIC ENGINEERING and ANALYSIS 18
Figure Set 4 (cont.)<br />
PACIFIC ENGINEERING and ANALYSIS 19