BIOINFORMATICS - Segal Lab - Weizmann Institute of Science
BIOINFORMATICS - Segal Lab - Weizmann Institute of Science
BIOINFORMATICS - Segal Lab - Weizmann Institute of Science

Create successful ePaper yourself
Turn your PDF publications into a flip-book with our unique Google optimized e-Paper software.
<strong>BIOINFORMATICS</strong><br />
Vol. 25 ISMB 2009, pages i348–i355<br />
doi:10.1093/bioinformatics/btp216<br />
Modeling interactions between adjacent nucleosomes improves<br />
genome-wide predictions <strong>of</strong> nucleosome occupancy<br />
Shai Lubliner 1 and Eran <strong>Segal</strong> 1,2,∗<br />
1 Department <strong>of</strong> Computer <strong>Science</strong> and Applied Mathematics and 2 Department <strong>of</strong> Molecular Cell Biology,<br />
<strong>Weizmann</strong> <strong>Institute</strong> <strong>of</strong> <strong>Science</strong>, Rehovot, Israel<br />
ABSTRACT<br />
Motivation: Understanding the mechanisms that govern<br />
nucleosome positioning over genomes in vivo is essential for<br />
unraveling the role <strong>of</strong> chromatin organization in transcriptional<br />
regulation. Until now, models for predicting genome-wide<br />
nucleosome occupancy have assumed that the DNA associations<br />
<strong>of</strong> neighboring nucleosomes on the genome are independent. We<br />
present a new model that relaxes this independence assumption by<br />
modeling interactions between adjacent nucleosomes.<br />
Results: We show that modeling interactions between adjacent<br />
nucleosomes improves genome-wide nucleosome occupancy<br />
predictions in an in vitro system that includes only nucleosomes<br />
and purified DNA, where the resulting model has a preference<br />
for short spacings (linkers) <strong>of</strong> less than 20 bp in length between<br />
neighboring nucleosomes. Since nucleosome occupancy in vitro<br />
depends only on properties intrinsic to nucleosomes, these results<br />
suggest that the interactions we find are intrinsic to nucleosomes<br />
and do not depend on other factors, such as transcription factors<br />
and chromatin remodelers. We also show that modeling these<br />
intrinsic interactions significantly improves genome-wide predictions<br />
<strong>of</strong> nucleosome occupancy in vivo.<br />
Contact: eran.segal@weizmann.ac.il<br />
Supplementary information: Supplementary data are available at<br />
Bioinformatics online.<br />
1 INTRODUCTION<br />
Eukaryotic DNA is highly compacted within the cell nucleus by<br />
the wrapping <strong>of</strong> 147-bp-long DNA stretches around histone protein<br />
octamers, forming nucleosomes (Kornberg and Lorch, 1999).<br />
Adjacent nucleosomes are separated by short DNA sequences, called<br />
linkers. The positioning <strong>of</strong> nucleosomes along genomic DNA is the<br />
first order <strong>of</strong> chromatin organization. Past analyses <strong>of</strong> nucleosomal<br />
DNA and linker sequences have revealed specific sequences that<br />
are enriched within the nucleosome or within linkers (Ioshikhes<br />
et al., 1996; Kaplan et al., 2009; Lee et al., 2007; Satchwell et al.,<br />
1986; <strong>Segal</strong> et al., 2006; Yuan and Liu, 2008). Based on these<br />
nucleosome sequence preferences, several models for predicting<br />
nucleosome occupancy were suggested (Ioshikhes et al., 2006;<br />
Kaplan et al., 2009; Lee et al., 2007; Peckham et al., 2007; <strong>Segal</strong><br />
et al., 2006; Yuan and Liu, 2008). Two <strong>of</strong> these were incorporated<br />
into a thermodynamic model (Kaplan et al., 2009; <strong>Segal</strong> et al.,<br />
2006) that was shown to predict in vitro and in vivo genome-wide<br />
nucleosome occupancy with high accuracy.<br />
∗ To whom correspondence should be addressed.<br />
The thermodynamic model assigns a statistical weight for each<br />
possible configuration <strong>of</strong> nucleosomes that are placed along a<br />
genomic sequence, such that no two nucleosomes overlap. In<br />
this model, the association <strong>of</strong> each nucleosome to a 147-bplong<br />
sub-sequence within a configuration is weighted according<br />
to the nucleosome sequence preferences, and is independent<br />
<strong>of</strong> associations <strong>of</strong> other nucleosomes elsewhere on the DNA.<br />
However, given the several factors that are known to affect<br />
chromatin folding and higher order chromatin organization, this<br />
independence assumption does not hold. First, different linker<br />
lengths allow different relative conformations between neighboring<br />
nucleosomes, resulting from steric hindrance constraints and the<br />
helical turns <strong>of</strong> the DNA (Schalch et al., 2005; Widom 1992).<br />
Second, many experiments and analyses have suggested that linker<br />
length distributions demonstrate a preference for quantized length<br />
patterns, <strong>of</strong> the form d + r ·n, where n is a running integer, r is<br />
a repeat length, and d is a length <strong>of</strong>fset (d < r) (Cohanim et al.,<br />
2006; Kato et al., 2003; Wang et al., 2008). In most cases, r was<br />
found to be ∼10, in accordance with the DNA helical repeat, while<br />
the value <strong>of</strong> d varied. Third, the binding <strong>of</strong> the linker histone H1<br />
to linker DNA greatly affects chromatin folding and condensation.<br />
Long linker lengths enable H1 binding, giving condensed chromatin,<br />
while short ones disable H1 binding, resulting in open chromatin<br />
(Routh et al., 2008). Finally, electrostatic interactions may occur<br />
between two nucleosomes that are spatially close (Chodaparambil<br />
et al., 2007; Dorigo et al., 2004; Luger et al., 1997), and may<br />
contribute to chromatin folding.<br />
Here, we model interactions between adjacent nucleosomes using<br />
a nucleosome cooperativity function (NCF), resulting in a new<br />
thermodynamic model for predicting nucleosome occupancy. We<br />
consider several types <strong>of</strong> functions as NCF candidates, based on an<br />
analysis <strong>of</strong> in vivo linker length distributions in yeast, and devise<br />
an algorithm to estimate these functions from data measurements <strong>of</strong><br />
nucleosome occupancy. All <strong>of</strong> the functions we consider are simple<br />
and defined by a small number <strong>of</strong> parameters (between two and five<br />
parameters). When applied to synthetic data, we show that our model<br />
can accurately reconstruct NCF parameters, even in the presence <strong>of</strong><br />
large degrees <strong>of</strong> noise in the input data.<br />
Our results suggest that reported preferences for quantized<br />
linker lengths result from the previously observed periodic<br />
sequence preferences <strong>of</strong> the single nucleosome (Satchwell et al.,<br />
1986; <strong>Segal</strong> et al., 2006). We show that modeling interactions<br />
between adjacent nucleosomes significantly improves nucleosome<br />
occupancy predictions in an in vitro system consisting <strong>of</strong> purified<br />
histones assembled on naked yeast genomic DNA, demonstrating<br />
that the preferred interactions that we find are intrinsic to<br />
nucleosome-DNA associations. The interactions that we learn<br />
© 2009 The Author(s)<br />
This is an Open Access article distributed under the terms <strong>of</strong> the Creative Commons Attribution Non-Commercial License (http://creativecommons.org/licenses/<br />
by-nc/2.0/uk/) which permits unrestricted non-commercial use, distribution, and reproduction in any medium, provided the original work is properly cited.
Modeling interactions between adjacent nucleosomes<br />
introduce a preference for short linkers <strong>of</strong> less than 20 bp in length.<br />
Finally, modeling these intrinsic interactions also significantly<br />
improves predictions <strong>of</strong> nucleosome occupancy in vivo in both yeast<br />
and in Caenorhabditis elegans, showing that they also play a role<br />
in nucleosome positioning in vivo, and suggesting that they may be<br />
universal to all eukaryotes.<br />
2 METHODS<br />
2.1 New thermodynamic model for predicting<br />
nucleosome occupancy<br />
A thermodynamic model for the genome-wide prediction <strong>of</strong> nucleosome<br />
occupancy has been published by our lab (Field et al., 2008; <strong>Segal</strong> et al.,<br />
2006). This model assigns a statistical weight for each possible configuration<br />
<strong>of</strong> nucleosomes that are placed along a genomic sequence. The association<br />
<strong>of</strong> each nucleosome to a 147 bp long sub-sequence within a configuration is<br />
weighted by a probabilistic model that represents the nucleosome sequence<br />
preferences, assigning different statistical weights to different 147 bp long<br />
sequences. The association <strong>of</strong> a nucleosome to DNA at a certain genomic<br />
region is independent <strong>of</strong> the associations <strong>of</strong> other nucleosomes elsewhere,<br />
other than the fact that no two nucleosomes can overlap in the same<br />
configuration.<br />
Our new thermodynamic model relaxes the above independence<br />
assumption and models interactions between adjacent nucleosomes by<br />
incorporating a nucleosome cooperativity function (NCF). An NCF, denoted<br />
L(x), is a positive function that assigns different statistical weights to different<br />
linker lengths. These weights are used as multiplicative factors, with 1 being<br />
a neutral weight. In the Results section we refer to the actual types <strong>of</strong><br />
functions selected to represent NCFs. The probabilistic model that we use<br />
to describe the nucleosome sequence preferences was learned from in vitro<br />
bound sequences that we previously published (Kaplan et al., 2009). We will<br />
denote this model <strong>of</strong> single nucleosome sequence preferences by Nuc, where<br />
Nuc(i) is the statistical weight that the Nuc model assigns to a nucleosome<br />
being positioned on the input sequence, S, starting at position i. ByS i,j we<br />
denote the sub-sequence <strong>of</strong> S starting at position i and ending at position j.By<br />
Bg(i,j) we denote the statistical weight given by a background model to an<br />
unoccupied sub-sequence S i,j . Since the Nuc model includes a background<br />
component that is used to normalize statistical weights, we used a simple<br />
uniform 0-order Markov model (i.e. P(A) = P(C) = P(G) = P(T) = 0.25) as the<br />
Bg model. Using the above definitions, we compute the distribution over<br />
nucleosome configurations on an input sequence S <strong>of</strong> length N. We take the<br />
partition function to be the space <strong>of</strong> all legal nucleosome configurations on S,<br />
denoted by C. A legal configuration c∈C is defined by a set <strong>of</strong> nucleosome<br />
start positions on S, c[1], …, c[k], such that no two nucleosomes overlap.<br />
Assuming thermodynamic equilibrium, its statistical weight (its Boltzmann<br />
factor) is:<br />
(<br />
W c [S]=Bg(1,c[1]−1)·<br />
)<br />
k−1 ∏<br />
τ ·(Nuc(c[i])) β ·Bg(c[i]+147, c[i+1]−1)·L(c[i+1]−c[i]−147) ·<br />
i=1<br />
·τ ·(Nuc(c[k]) β ·Bg(c[k]+147,N),<br />
where τ represents an apparent nucleosome concentration, and β is a<br />
temperature parameter. For conciseness <strong>of</strong> representation, we assume that<br />
if i > j then Bg(i,j) =1.<br />
The probability <strong>of</strong> configuration c is given by:<br />
P(c)=<br />
W c[s]<br />
∑<br />
W c ′[s] ,<br />
c ′ ∈C<br />
where c ′ traverses over the space C <strong>of</strong> all legal configurations.<br />
The probability <strong>of</strong> placing a nucleosome at start position i on S, denoted<br />
P(i), can be computed as follows:<br />
∑<br />
P(i)= ∑<br />
W c ′′[s]<br />
c<br />
P(c)=<br />
′′ ∈C<br />
∑ i<br />
W<br />
c ′′ c ′[s] ,<br />
∈C i c ′ ∈C i<br />
where c" traverses over the space C i <strong>of</strong> all legal configurations in which a<br />
nucleosome starts at position i. To efficiently compute P(i) for all positions<br />
i on S we employ a dynamic programming procedure (Rabiner, 1989). This<br />
demands that we limit the effect <strong>of</strong> any NCF to a window <strong>of</strong> reasonable<br />
length M L , such that its contribution will only be added for linker lengths<br />
shorter than M L . In this work we used M L =100. For any NCF L this is<br />
equivalent to transforming L to a new function L ′ such that:<br />
{<br />
L ′ L(x) c≤M L<br />
(x)=<br />
1 x >M L .<br />
The first part <strong>of</strong> our dynamic program is a forward step, in which we compute<br />
two sets <strong>of</strong> random variables: {Fi<br />
Nuc } and {F Bg<br />
i }(1i N). Fi<br />
Nuc represents<br />
the sum <strong>of</strong> the statistical weight <strong>of</strong> all legal configurations over the prefix<br />
S 1 ,…,S i <strong>of</strong> S, that end with a nucleosome (the last nucleosome end position is<br />
i). F Bg<br />
i is similarly defined, where position i is not covered by a nucleosome.<br />
The forward step computation is as follows:<br />
⎧<br />
⎪⎨ 0 i N+1, and by defining: Bg(i,i−1)=1.<br />
i349
S.Lubliner and E.<strong>Segal</strong><br />
Having computed the above, we can now compute P(i) for any position i<br />
in S:<br />
∑<br />
W c ′′[s]<br />
c<br />
P(i)=<br />
′′ ∈C<br />
∑ i<br />
W c ′[s] = FNuc i+146 ·RNuc i+147<br />
F Bg<br />
c ′ N +FNuc N<br />
∈C i<br />
The probability <strong>of</strong> position i in S being covered by a nucleosome, also referred<br />
to as the average nucleosome occupancy over position i, is predicted by our<br />
model to be:<br />
i∑<br />
¯P(i)= P(j)<br />
j=i−146<br />
2.2 Learning the parameters <strong>of</strong> a nucleosome<br />
cooperativity function<br />
Having chosen a type <strong>of</strong> function as our NCF, we want to learn an<br />
optimal choice <strong>of</strong> its parameter values. Our model produces a vector P =<br />
(P(1),...,P(N) <strong>of</strong> predicted average nucleosome occupancy, per position <strong>of</strong><br />
an input sequence S. Therefore, for the purpose <strong>of</strong> learning NCF parameters,<br />
we require as input a vector O=(O(1),...,O(N) <strong>of</strong> the measured cell<br />
population average nucleosome occupancy per position <strong>of</strong> S. O and P after<br />
normalization (by subtracting the mean and dividing by the SD) to mean 0<br />
and SD 1 are denoted Ô and ˆP, respectively. We define our objective function<br />
to be the L 2 -distance between Ô and ˆP:<br />
N∑<br />
2<br />
L 2 (Ô, ˆP)=<br />
(Ô(i)− ˆP(i))<br />
i=1<br />
and our learning algorithm searches for NCF parameters assignments for<br />
which the model generates a prediction P that minimizes L 2 (Ô, ˆP). We chose<br />
the (Nelder-Mead) simplex method for the function optimization task at hand,<br />
since it requires only the computation <strong>of</strong> the objective function at each point<br />
in the space <strong>of</strong> NCF parameter values. We refrained from using methods,<br />
such as conjugate gradient, that require computing the partial derivatives <strong>of</strong><br />
the objective function according to the NCF parameters (see Supplementary<br />
Methods), as such computations are quite costly, and as they limit the choices<br />
<strong>of</strong> NCFs to differentiable ones.<br />
3 RESULTS<br />
Previous approaches for predicting nucleosome occupancy<br />
(Ioshikhes et al., 2006; Kaplan et al., 2009; Lee et al., 2007;<br />
Peckham et al., 2007; <strong>Segal</strong> et al., 2006; Yuan and Liu, 2008)<br />
relied on modeling the nucleosome sequence preferences, and used<br />
them to generate nucleosome occupancy predictions assuming that<br />
the association <strong>of</strong> one nucleosome to the DNA is independent <strong>of</strong><br />
the associations <strong>of</strong> other nucleosomes. We relax this independence<br />
assumption by modeling interactions between adjacent nucleosomes<br />
through a nucleosome cooperativity function (NCF). In the previous<br />
section we presented how an NCF is incorporated into our model,<br />
and how we can learn its parameters. In this section we use our<br />
model to learn NCFs from synthetic data, as well as in vitro and<br />
in vivo measurements <strong>of</strong> nucleosome occupancy.<br />
3.1 Selecting the types <strong>of</strong> nucleosome cooperativity<br />
functions<br />
A good candidate for an NCF would be the organism’s linker<br />
lengths distribution. This distribution can be easily derived from<br />
single cell data <strong>of</strong> mono-nucleosome sequences that are uniquely<br />
mapped to the organism’s genome, as linker lengths are simply the<br />
distances between any two mapped nucleosomes. However, existing<br />
experimental methods cannot measure genome-wide nucleosomes<br />
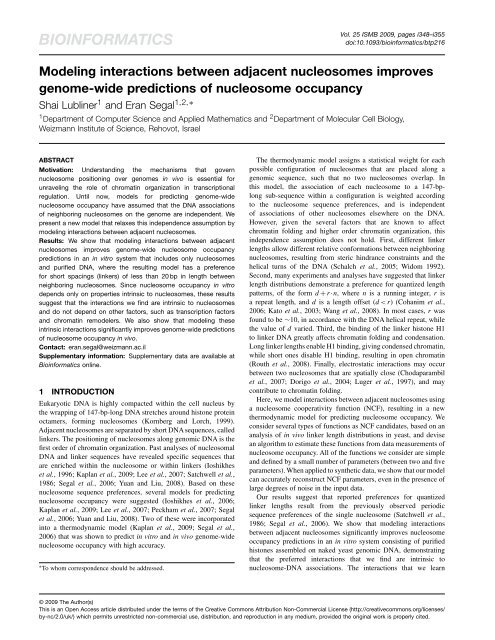
Fig. 1. Linker lengths distributions derived from mono-nucleosome<br />
genome-wide positioning data, extracted from in vivo yeast cell populations.<br />
The data includes five different replicates, all for wild-type yeasts grown in<br />
rich medium. For each replicate, the distribution <strong>of</strong> linker lengths in the range<br />
0–100 is shown (divided by its mean value), along with an exponential curve<br />
(dashed line) that was fit to its decaying part (starting at the main peak).<br />
from single cells. Rather, existing nucleosome data comes from<br />
cell populations. We therefore resort to an approximation <strong>of</strong> the<br />
linker lengths distribution, derived from cell population data <strong>of</strong><br />
mapped nucleosome sequence reads, similar to that used in (Valouev<br />
et al., 2008). Instead <strong>of</strong> counting appearances <strong>of</strong> true linker lengths,<br />
we count appearances <strong>of</strong> putative linker lengths. For any pair <strong>of</strong><br />
nucleosomes that are d bps apart, such that d < 100, we count a<br />
single occurrence <strong>of</strong> a (putative) linker <strong>of</strong> length d. We smooth the<br />
resulting linker lengths distribution with a moving average window<br />
<strong>of</strong> 5 bps. Using this procedure, whenever we encounter a pair <strong>of</strong><br />
nucleosomes that were adjacent within a single cell then we count<br />
a true linker length appearance. In all other cases, we falsely add<br />
appearance counts, adding noise to the distribution.<br />
We used in vivo mono-nucleosome data, extracted from wildtype<br />
S. cerevisiae that were grown in rich medium and uniquely<br />
mapped to the S. cerevisiae genome (Kaplan et al., 2009). The<br />
linker lengths distributions that we computed from cell population<br />
data <strong>of</strong> five different experiment replicates are shown in Figure 1.<br />
These five distributions are highly similar, and share several main<br />
features. First, they all exhibit an apparent disfavoring <strong>of</strong> linker<br />
lengths shorter than ∼15 bps. Second, a single prominent peak<br />
exists at 11–16 bp, and seems to decay exponentially at longer<br />
linker lengths (see exponential fits in Fig. 1). Third, with this<br />
dominant decaying pattern, a periodic pattern <strong>of</strong> subtle peaks that<br />
are approximately 10 bps apart is combined. This pattern concurs<br />
with past analyses that revealed a preferentially quantized linker<br />
lengths pattern in yeast (Cohanim et al., 2006; Wang et al.,<br />
2008). The above linker lengths distributions derived from yeast<br />
cell populations are approximations <strong>of</strong> the unknown true linker<br />
lengths distribution in yeast. We assume that the above three<br />
features that appear in the approximate distributions reflect features<br />
<strong>of</strong> the true one. This suggests that biologically relevant NCFs<br />
will also include them. We therefore selected simple functions<br />
that represent at least one <strong>of</strong> the above three features, and are<br />
defined by a small number (between 2 and 5) <strong>of</strong> parameters.<br />
These functions are: an exponentially decaying function (Exp, two<br />
i350
Modeling interactions between adjacent nucleosomes<br />
Fig. 2. Nucleosome cooperativity functions and their linker length distributions. The figure is organized in a table-like fashion, with columns per NCF and<br />
rows per graph type. In the first row are the NCFs, along with their formulas (after parameters were assigned). In the second row are the sampled linker<br />
lengths distributions derived from sampled nucleosome configurations that represent data at single cell resolution. In the third row are the sampled linker<br />
lengths distributions derived from sampled mono-nucleosome data that represents data at cell population resolution.<br />
parameters), a right-shifted exponentially decaying function (S-Exp,<br />
three parameters), a right-shifted exponentially decaying sinusoid<br />
(S-ES, five parameters) and a step function (Step, two parameters,<br />
may represent both an Off Step or an On Step). The function formulas<br />
are presented in the Supplementary Data section. All functions<br />
have a parameter assignment for which they are equivalent to<br />
the constant 1 function (No Coop) that represents no nucleosome<br />
cooperating interactions. Examples <strong>of</strong> the selected functions for<br />
specific parameter assignments are shown in Figure 2.<br />
3.2 Using the model to explore linker length<br />
preferences in yeast<br />
Having selected the types <strong>of</strong> NCFs to examine, we sought to<br />
compare the in vivo linker length distributions to linker length<br />
distributions that are sampled using our model with each <strong>of</strong><br />
the chosen NCF types. For this purpose, we selected particular<br />
parameter assignments for each NCF type (see Supplementary<br />
Data). The resulting NCFs are plotted in Figure 2. For each NCF,<br />
we sampled 5000 nucleosome configurations over a 500 000 bp long<br />
sub-sequence <strong>of</strong> yeast chromosome 4 using our model with that<br />
NCF (denoted Model NCF ), with the temperature and nucleosome<br />
concentration parameters set to 1. Each sampled configuration<br />
represents sampled nucleosome positioning data in single cell<br />
resolution. Thus, by counting linker lengths appearances in the<br />
5000 sampled configurations we derived the sampled linker lengths<br />
distribution, plotted in Figure 2. Next, we collected all mononucleosome<br />
reads out <strong>of</strong> the sampled configurations, generating the<br />
sampled mono-nucleosome positioning data <strong>of</strong> the cell population.<br />
Following the same procedure described in Section 3.1 we further<br />
produced the sampled linker lengths distribution derived from cell<br />
population data, also plotted in Figure 2. Examining properties <strong>of</strong><br />
the sampled linker lengths distributions, we find a high similarity<br />
between the shape <strong>of</strong> the NCF functions themselves (Fig. 2, top row)<br />
and their respective sampled single cell linker lengths distributions<br />
(Fig. 2, middle row). Similarities are also evident between the<br />
shape <strong>of</strong> the NCFs and their respective sampled cell population<br />
linker lengths distributions (Fig. 2, bottom row). This supports our<br />
approach in Section 3.1 <strong>of</strong> selecting NCF types reflecting features<br />
that appear in the yeast in vivo cell population linker lengths<br />
distributions. Second, all sampled linker lengths distributions (Fig. 2,<br />
middle row) show an exponential decay as linker lengths get longer,<br />
even for NCFs that do not represent such a decay, in particular<br />
the No Coop NCF. Thus, any sampled linker lengths distribution<br />
can be decomposed to an exponentially decaying component that<br />
is NCF-independent, and other components that depend on the<br />
particular NCF type. Third, all sampled cell population linker<br />
lengths distributions (Fig. 2, bottom row), except in the S-ES case,<br />
demonstrate a periodic pattern <strong>of</strong> subtle peaks. In the S-ES case,<br />
a periodic pattern <strong>of</strong> high peaks appears, concurring with the 10n<br />
(n = 1, 2, …) peak pattern <strong>of</strong> the S-ES NCF. The periodic pattern <strong>of</strong><br />
subtle peaks apparent in all other cases starts around linker length 5,<br />
with a period slightly longer than 10 bp.<br />
The periodic pattern <strong>of</strong> subtle peaks observed in the sampled cell<br />
population linker lengths distributions is similar in all NCF cases<br />
except S-ES, and does not depend on the NCF type. Therefore, other<br />
elements that the model accounts for produced this periodic pattern.<br />
Genomic sequences are known to encode periodic signals (Cohanim<br />
et al., 2005, 2006; Widom, 1996) that follow a ∼10-bp periodic<br />
pattern. One possibility is that the periodic pattern <strong>of</strong> subtle peaks is<br />
mainly a result <strong>of</strong> these periodic signals. Alternatively, these peaks<br />
may result from the nucleosome sequence preferences, since aligned<br />
nucleosome sequences exhibit a ∼10bp periodic dinucleotide pattern<br />
(Ioshikhes et al., 1996; Satchwell et al., 1986; <strong>Segal</strong> et al., 2006),<br />
and since the model we use (the Nuc model, see Section 2.1) includes<br />
these periodic dinucleotide preferences.<br />
i351
S.Lubliner and E.<strong>Segal</strong><br />
Fig. 3. A comparison <strong>of</strong> sampled linker lengths distributions derived from<br />
cell population data that was sampled by one <strong>of</strong> two models: a model<br />
that recognizes nucleosome periodic sequence preferences (using the Nuc<br />
model, solid line) and a model that does not (using the Nuc U model, dashed<br />
line). The comparison was performed for four different NCFs. For each<br />
NCF, the distribution was similar in both cases, but the preference for<br />
quantized linker lengths was abolished when periodic nucleosome sequence<br />
preferences were removed. This demonstrates that preferentially quantized<br />
linker lengths distributions are mainly the result <strong>of</strong> the periodic sequence<br />
preferences <strong>of</strong> the nucleosome itself.<br />
If the latter possibility is true, then using a non-uniform and<br />
non-periodic model <strong>of</strong> nucleosome sequence preferences would<br />
not produce a periodic pattern <strong>of</strong> subtle peaks. To examine this,<br />
we created an alternative model <strong>of</strong> the nucleosome sequence<br />
preferences, denoted Nuc U , which replaces the Nuc model (see<br />
Section 2.1), with a model in which the periodic dinucleotide<br />
preferences are removed (see Supplementary Methods). We repeated<br />
the above process <strong>of</strong> generating sampled linker lengths distributions<br />
from cell population data for several <strong>of</strong> the above NCFs using<br />
the Nuc U model, and compared them with the ones generated<br />
using the Nuc model. The results <strong>of</strong> this comparison appear in<br />
Figure 3, where for each NCF we present both sampled cell<br />
population linker lengths distributions, with the original Nuc<br />
model (solid line), and with the Nuc U model (dashed line).<br />
Notably, whereas the general theme <strong>of</strong> the distribution is similar<br />
for both cases, the periodic pattern <strong>of</strong> subtle peaks is abolished<br />
as a result <strong>of</strong> the removal <strong>of</strong> the periodic component <strong>of</strong> the<br />
nucleosome sequence preferences model. This demonstrates that<br />
the periodic subtle peaks pattern is mainly a result <strong>of</strong> the<br />
periodicity <strong>of</strong> the nucleosome sequence preferences. This suggests<br />
that the previously reported preferentially quantized linker lengths<br />
distribution (Cohanim et al., 2006; Wang et al., 2008) results mainly<br />
from the periodic sequence preferences <strong>of</strong> the nucleosome itself,<br />
rather than from periodicity <strong>of</strong> certain signals encoded in genomic<br />
sequences.<br />
3.3 Learning nucleosome cooperativity functions from<br />
synthetic data<br />
Before trying to learn NCFs from real nucleosome positioning data,<br />
we sought to test our ability to learn NCFs from the controlled<br />
setting <strong>of</strong> synthetic data. For each <strong>of</strong> the six NCFs presented<br />
in Figure 2 we used the sampled mono-nucleosome reads cell<br />
population data described in Section 3.2 as six synthetic data<br />
sets. Due to experimental limitations <strong>of</strong> the nucleosome mapping<br />
experiments, in the real yeast data that we use, each nucleosome<br />
read is mapped to the genome with an estimated inaccuracy <strong>of</strong> up to<br />
20 bp shifts from its true location. To reflect that in the synthetic<br />
setting, we randomly shifted the location <strong>of</strong> each sampled read<br />
by a number <strong>of</strong> P noise bp, sampled from a Normal distribution <strong>of</strong><br />
mean 0 and SD Std noise (we varied Std noise between 0, 10, 20,<br />
50 and 100). After adding noise to the sets, we counted for each<br />
position on the sequence the number <strong>of</strong> sampled reads that cover it.<br />
The vector <strong>of</strong> counts per position was normalized to have mean 0<br />
and SD 1, resulting in the normalized nucleosome occupancy data<br />
required for learning NCF parameters (the Ô vector, see Section<br />
2.2). For each <strong>of</strong> the 30 synthetic sets (five noise levels for each<br />
<strong>of</strong> the six NCFs that we use), we partitioned the data into training<br />
data and test data, in a 5-fold cross validation (CV) manner. For<br />
each <strong>of</strong> the five CV groups, we tried to learn parameters for the<br />
Exp, S-Exp, S-ES, Step and No Coop NCFs that minimize the L 2 -<br />
distance between the normalized training data and the normalized<br />
model predictions (see Section 2.2).Along with the NCF parameters,<br />
we learned the model’s temperature and nucleosome concentration<br />
parameters. For the No Coop NCF we learned only the last two.<br />
In all cases, a small number <strong>of</strong> parameters were learned (between<br />
2 and 7). In the Supplementary Methods we address the issue <strong>of</strong><br />
choosing an initial parameters assignment. Let ˆP L be the normalized<br />
nucleosome average occupancy predicted by the model with a<br />
learned NCF L over the sequence positions that correspond to the<br />
normalized test data Ô. We use the R 2 statistic as a test <strong>of</strong> the<br />
learned NCF L:<br />
R 2 (L)=1− L 2(Ô, ˆP L )<br />
|Ô| 2 =<br />
∑<br />
(Ô(i))− ˆP L (i)) 2<br />
i<br />
|Ô| 2 .<br />
This measure quantifies the fraction <strong>of</strong> the variance in the test data<br />
that the model learned from the training data explains. The same<br />
score can be applied on the training data itself to produce a training<br />
score.<br />
The results over the different synthetic sets appear in Figure 4.<br />
In all cases, when no noise is introduced, we are able to reconstruct<br />
the original model (when learning parameters <strong>of</strong> an NCF <strong>of</strong> the<br />
same type that was used to sample the data) with high accuracy.<br />
One exception is in the S-Exp* synthetic case, where we do<br />
not reconstruct the exact “shift” <strong>of</strong> the function. At high noise<br />
levels (Std noise 50 and 100), using the original model yields worse<br />
results than other models with learned NCFs, showing that the<br />
task <strong>of</strong> learning the ‘true’ NCF parameters is hard. However, at<br />
noise levels that correspond to the estimated noise in the real<br />
yeast data that we use (when Std noise is up to 20, see above)<br />
we are still able to learn models that fit the data well. In the<br />
S-Exp* and S-ES* synthetic cases, as more noise is introduced,<br />
learning the parameters that determine the ‘shift’ (<strong>of</strong> S-Exp and<br />
S-ES) and the ‘preferred quantized lengths’ (<strong>of</strong> S-ES) becomes<br />
harder, and the Exp and Step functions yield better results. This<br />
shows that if an Exp or a Step function scores slightly better<br />
than an S-Exp or an S-ES function on real noisy data, we cannot<br />
rule out the possibility that the ‘true’ function is one <strong>of</strong> the latter<br />
two. Taken together, we conclude that we are able to learn NCFs<br />
i352
Modeling interactions between adjacent nucleosomes<br />
Fig. 4. A summary <strong>of</strong> results <strong>of</strong> learning NCFs from synthetic datasets. Synthetic sets were sampled over a 500 000-bp-long sub-sequence <strong>of</strong> yeast<br />
chromosome 4, using the model with each <strong>of</strong> the NCFs: Exp*, S-Exp*, S-ES*, Off Step*, On Step* and No Coop* (shown in Fig. 2). To each sampled<br />
set different levels <strong>of</strong> noise (different SDs for Gaussian perturbations <strong>of</strong> sampled nucleosome locations, denoted Std noise ) were introduced. On each resulting<br />
synthetic set, parameters <strong>of</strong> five types <strong>of</strong> NCFs were learned (Exp, S-Exp, S-ES, Step and No Coop), together with the model’s temperature and nucleosome<br />
concentration parameters, in a 5-fold cross validation manner. The results are organized in a table-like fashion, with rows per synthetic data type and columns<br />
per noise level introduced into the synthetic set. Each cell shows results attained for each <strong>of</strong> the learned NCFs, along with results attained for the original<br />
NCF (with original temperature and nucleosome concentration) used for sampling the synthetic data. Results per learned NCF are color coded according toa<br />
color legend appearing in the left part <strong>of</strong> the respective row. For each learned NCF shown are: in the bar plot, the cross validation mean (bar) and SD (blue<br />
error bar) <strong>of</strong> the test R 2 statistic (quantifying the fraction <strong>of</strong> the variance in the test data that is explained by the model with the learned NCF), as well as<br />
the cross validation mean and SD <strong>of</strong> the train R 2 statistic (light green error bar). In the graphs plot, shown are the cross validation mean and SD (per linker<br />
length) <strong>of</strong> the linker lengths distribution (over linker lengths 0–50) sampled using the model with the learned NCF.<br />
in a synthetic setting, even when a realistic level <strong>of</strong> noise is<br />
introduced.<br />
3.4 Learning nucleosome cooperativity functions from<br />
yeast in vitro and in vivo data<br />
We now turn to learning NCFs from real data. First, we learned<br />
NCFs from yeast nucleosome mapping data taken from two in vitro<br />
experiment replicates that we previously measured (Kaplan et al.,<br />
2009). Since in vitro there are only purified histones and naked DNA,<br />
NCFs learned from this data can represent only interactions that are<br />
intrinsic to the association <strong>of</strong> nucleosomes and DNA, and that do not<br />
depend on other factors such as transcription factors and chromatin<br />
remodeleres that are present in living cells. From the in vitro data, we<br />
produced in vitro normalized nucleosome occupancy over the yeast<br />
genome (see Supplementary Methods). We randomly chose a 1M bp<br />
i353
S.Lubliner and E.<strong>Segal</strong><br />
Fig. 5. (A) Parameters <strong>of</strong> five NCF types (together with the model’s<br />
temperature and nucleosome concentration parameters) were learned from<br />
yeast in vitro data <strong>of</strong> nucleosome mapping over a 1M-bp-long sub-sequence<br />
<strong>of</strong> chromosome 4, in a 5-fold cross validation manner. Results for each NCF<br />
type are color coded according to a color legend that appears at the center<br />
<strong>of</strong> the figure. For each learned NCF shown are: in the top bar plot, the<br />
cross validation mean (bar) and SD (blue error bar) <strong>of</strong> the test R 2 statistic<br />
(quantifying the fraction <strong>of</strong> the variance in the test data that is explained by<br />
the model with the learned NCF), as well as the cross validation mean and SD<br />
<strong>of</strong> the train R 2 statistic (light green error bar). In the bottom bar plot, shown<br />
is the cross validation mean (bar) and SD (blue error bar) <strong>of</strong> the correlation<br />
between the test data and the model predicted average occupancy. In the<br />
graphs plot, shown is the cross validation mean and SD (per linker length)<br />
<strong>of</strong> the linker lengths distribution (over linker lengths 0–50) sampled using the<br />
model with the learned NCF. (B) Same as in (A), for yeast chromosome 7.<br />
(C) Same as in (A), for yeast chromosome 12. (D–F) Same as in (A–C),<br />
respectively, for yeast in vivo data. (G) Same as (A), for in vivo data <strong>of</strong><br />
C.elegans chromosome I. (H) Same as (G), for C.elegans chromosome II.<br />
(I) Same as (G), for C.elegans chromosome III.<br />
long sub-sequence <strong>of</strong> yeast chromosome 4 and used the normalized<br />
nucleosome occupancy data over it in a 5-fold CV manner, similar<br />
to the synthetic cases in Section 3.3, learning parameters <strong>of</strong> the<br />
Exp, S-Exp, S-ES, Step and No Coop NCFs. We repeated this<br />
procedure twice more over randomly chosen 1M bp long subsequences<br />
<strong>of</strong> yeast chromosomes 7 and 12. The results are presented<br />
in Figure 5A–C, and are similar for all three chromosomes. We find<br />
that the learned Model Exp and Model Step models explain ∼74%<br />
<strong>of</strong> the variance in the test data, significantly better (Wilcoxon<br />
signed-rank test P-values 6 × 10 −5 and 3 × 10 −4 , respectively)<br />
than the learned Model NoCoop model that explains ∼69.5% <strong>of</strong> the<br />
variance in the test data. This result demonstrates that modeling<br />
intrinsic interactions between adjacent nucleosomes improves the<br />
accuracy <strong>of</strong> yeast in vitro nucleosome occupancy predictions.<br />
The learned intrinsic interactions display a preference for short<br />
linkers, evident in the linker lengths distributions sampled by the<br />
Model Exp and Model Step models. The Model S−Exp and Model S−ES<br />
models that were learned were highly similar, and explained ∼66.5%<br />
<strong>of</strong> the variance in the test data, significantly worse (each with a<br />
Wilcoxon signed-rank test P-value 6 × 10 −5 ) than the Model NoCoop<br />
model. The reason for this may be that the learned S-Exp and S-ES<br />
NCFs show a very strong disfavoring <strong>of</strong> linkers longer than 10 bp<br />
that may be too extreme.<br />
Next, we examined whether interactions between adjacent<br />
nucleosomes play a similar role in vivo. We repeated the above<br />
procedure for learning NCFs over the same three sub-sequences <strong>of</strong><br />
chromosomes 4, 7 and 12, this time using the yeast in vivo data that<br />
was analyzed in Section 3.1. From this data we produced in vivo<br />
normalized nucleosome occupancy over the yeast genome (see<br />
Supplementary Methods). The results are presented in Figure 5D–F,<br />
and are again similar for all three chromosomes. The learned<br />
Model Exp , Model Step , Model S−ES and Model S−Exp models explain<br />
∼37.5%, ∼37%, ∼34.5% and ∼34% <strong>of</strong> the variance in the test<br />
data, respectively, all significantly better (Wilcoxon signed-rank test<br />
P-values 6 × 10 −5 ,6× 10 −5 ,10 −3 and 10 −3 , respectively) than the<br />
learned Model NoCoop model that explained ∼30.5% <strong>of</strong> the variance<br />
in the test data. Importantly, the linker lengths distributions sampled<br />
using all these models are highly similar to those sampled using the<br />
models that were learned from the in vitro data, with the exception<br />
that in the in vivo case the learned S-Exp and S-ES NCFs show<br />
a weaker disfavoring <strong>of</strong> linkers longer than 10 bp. Thus, we find<br />
that modeling intrinsic interactions between adjacent nucleosomes<br />
also improves the accuracy <strong>of</strong> yeast in vivo nucleosome occupancy<br />
predictions.<br />
3.5 Learning nucleosome cooperativity functions from<br />
c.elegans in vivo data<br />
To examine whether the intrinsic interactions between adjacent<br />
nucleosomes that we find in yeast play similar roles in higher<br />
eukaryotes, we applied our approach for learning parameters <strong>of</strong><br />
the Exp and No Coop NCFs from in vivo nucleosome positioning<br />
data <strong>of</strong> C.elegans. We randomly chose 1M bp long sub-sequences<br />
<strong>of</strong> C.elegans chromosomes I, II and III, and used published<br />
in vivo nucleosome occupancy data over these sub-sequences<br />
(Valouev et al., 2008). The results are presented in Figure 5G–I.<br />
The results are qualitatively similar over the three chromosomes. The<br />
Model Exp model explained ∼13% more <strong>of</strong> the variance in the test<br />
data than the Model NoCoop model, and this improvement was<br />
significant (Wilcoxon signed-rank test P-value 6×10 −5 ). Moreover,<br />
the resulting linker length distributions sampled by the two models<br />
are highly similar to those sampled for yeast, with the one sampled<br />
using the learned Exp NCF demonstrating the same preference<br />
for short linkers. This shows that, as in yeast, modeling intrinsic<br />
i354
Modeling interactions between adjacent nucleosomes<br />
interactions between adjacent nucleosomes improves the accuracy<br />
<strong>of</strong> nucleosome occupancy predictions <strong>of</strong> C.elegans in vivo.<br />
4 DISCUSSION<br />
We presented a new thermodynamic model for genome-wide<br />
prediction <strong>of</strong> nucleosome occupancy, extending a model previously<br />
published by our lab (Field et al., 2008; <strong>Segal</strong> et al., 2006). The<br />
model assigns a statistical weight for each possible configuration<br />
<strong>of</strong> nucleosomes that are placed along a genomic sequence, such<br />
that no two nucleosomes overlap. The previous model assumed<br />
that the association <strong>of</strong> a nucleosome to the DNA at one place is<br />
independent <strong>of</strong> the associations <strong>of</strong> other nucleosomes elsewhere.<br />
Our new model relaxes this independence assumption by modeling<br />
interactions between adjacent nucleosomes through a nucleosome<br />
cooperativity function (NCF).<br />
Based on an analysis that involves our model we suggest that the<br />
previously reported preference for quantized linker lengths in yeast<br />
(Cohanim et al., 2006; Wang et al., 2008) results mainly from the<br />
periodic sequence preferences <strong>of</strong> the nucleosome itself.<br />
Our results show that by modeling interactions between adjacent<br />
nucleosomes, such that short linkers (less than 20 bp long) are<br />
preferred, we improve the accuracy <strong>of</strong> predictions <strong>of</strong> yeast in<br />
vitro nucleosome occupancy. The in vitro system contains only<br />
nucleosomes and naked yeast genomic DNA. Thus, the modeled<br />
interactions are intrinsic to the association <strong>of</strong> nucleosomes and DNA<br />
and are independent <strong>of</strong> other factors such as transcription factors and<br />
chromatin remodelers that affect chromatin organization in living<br />
cells.<br />
Notably, modeling these same interactions also improves the<br />
accuracy <strong>of</strong> nucleosome occupancy predictions <strong>of</strong> yeast in vivo.<br />
Moreover, these intrinsic interactions also improve the accuracy <strong>of</strong><br />
nucleosome occupancy predictions <strong>of</strong> C.elegans in vivo, suggesting<br />
that these interactions may be universal across eukaryotes.<br />
It will be interesting to understand the mechanistic basis<br />
for the preferred nucleosome interactions that we find. One<br />
possibility is that such interactions results from direct interaction<br />
between spatially close nucleosomes, which are known to occur<br />
(Chodaparambil et al., 2007; Dorigo et al., 2004; Luger et al.,<br />
1997). The fact that the modeled interactions are accompanied by<br />
a preference for short linkers may hint at that direction. Direct<br />
interaction between two adjacent nucleosomes (that may involve<br />
their histone tails) may also assist with the chromatin fiber folding,<br />
energetically justifying a shift <strong>of</strong> nucleosomes away from positions<br />
that would have been otherwise favored according to the single<br />
nucleosome sequence preferences.<br />
Funding: European Research Council (to E.S.). E.S. is the incumbent<br />
<strong>of</strong> the Soretta and Henry Shapiro career development chair.<br />
Conflict <strong>of</strong> Interest: none declared.<br />
REFERENCES<br />
Chodaparambil,J.V. et al. (2007) A charged and contoured surface on the nucleosome<br />
regulates chromatin compaction. Nat. Struct. Mol. Biol., 14, 1105–1107.<br />
Cohanim,A.B. et al. (2005) Yeast nucleosome DNA pattern: deconvolution from<br />
genome sequences <strong>of</strong> S. cerevisae. J. Biomol. Struct. Dyn., 22, 687–694.<br />
Cohanim,A.B. et al. (2006) Three sequence rules for chromatin. J. Biomol. Struct. Dyn.,<br />
23, 559–566.<br />
Dorigo B et al. (2004) Nucleosome arrays reveal the two-start organization <strong>of</strong> the<br />
chromatin fiber. <strong>Science</strong>, 306, 1571–1573.<br />
Field,Y. et al. (2008) Distinct modes <strong>of</strong> regulation by chromatin are encoded through<br />
nucleosome positioning signals. PLoS Comput. Biol., 4, e1000216.<br />
Ioshikhes,I.P. et al. (1996) Nucleosome DNA sequence pattern revealed by multiple<br />
alignment <strong>of</strong> experimentally mapped sequences. J. Mol. Biol., 262, 129–139.<br />
Ioshikhes,I.P. et al. (2006) Nucleosome positions predicted through comparative<br />
genomics. Nat. Genet., 38, 1210–1215.<br />
Kaplan,N. et al. (2009) The DNA-encoded nucleosome organization <strong>of</strong> a eukaryotic<br />
genome. Nature, 458, 362–366.<br />
Kato,M. et al. (2003) Dinucleosome DNA <strong>of</strong> human k562 cells: experimental and<br />
computational characterizations. J. Mol. Biol., 332, 111–125.<br />
Kornberg RD, Lorch Y. (1999) Twenty-five years <strong>of</strong> the nucleosome, fundamental<br />
particle <strong>of</strong> the eukaryote chromosome. Cell, 98, 285–294.<br />
Lee,W. et al. (2007) A high-resolution atlas <strong>of</strong> nucleosome occupancy in yeast. Nat.<br />
Genet., 39, 1235–1244.<br />
Luger,K. et al. (1997) Crystal structure <strong>of</strong> the nucleosome core particle at 2.8Å<br />
resolution. Nature, 389, 251–260.<br />
Peckham,H.E. et al. (2007) Nucleosome positioning signals in genomic DNA. Genome<br />
Res., 17, 1170–1177.<br />
Rabiner,L.R. (1989) A tutorial on Hidden Markov Models and selected applications in<br />
speech recognition. Proc. IEEE, 77, 257–286.<br />
Routh,A. et al. (2008) Nucleosome repeat length and linker histone stoichiometry<br />
determine chromatin fiber structure. Proc. Natl Acad. Sci. USA, 105,<br />
8872–8877.<br />
Satchwell,S.C. et al. (1986) Sequence periodicities in chicken nucleosome core DNA.<br />
J. Mol. Biol., 191, 659–675.<br />
Schalch,T. et al. (2005) X-ray structure <strong>of</strong> a tetranucleosome and its implications for<br />
the chromatin fibre. Nature, 436, 138–141.<br />
<strong>Segal</strong>,E. et al. (2006) A genomic code for nucleosome positioning. Nature, 442,<br />
772–778.<br />
Valouev,A. et al. (2008)Ahigh resolution, nucleosome position map <strong>of</strong> c. elegans reveals<br />
a lack <strong>of</strong> universal sequence-dictated positioning. Genome Res., 18, 1051–1063.<br />
Wang,J.-P. et al. (2008) Preferentially quantized linker DNA lengths in Saccharomyces<br />
cerevisiae. PLoS Comput. Biol., 4, e1000175.<br />
Widom,J. (1992) A relationship between the helical twist <strong>of</strong> DNA and the ordered<br />
positioning <strong>of</strong> nucleosomes in all eukaryotic cells. Proc. Natl Acad. Sci. USA, 89,<br />
1095–1099.<br />
Widom,J. (1996) Short-range order in two eukaryotic genomes: relation to chromosome<br />
structure. J. Mol. Biol., 259, 579–588.<br />
Yuan,G.C. and Liu,J.S. (2008) Genomic sequence is highly predictive <strong>of</strong> local<br />
nucleosome depletion. PLoS Comput. Biol., 4, e13.<br />
i355