Survey of Seat Belt - Road Safety Authority
Survey of Seat Belt - Road Safety Authority
Survey of Seat Belt - Road Safety Authority
- No tags were found...
You also want an ePaper? Increase the reach of your titles
YUMPU automatically turns print PDFs into web optimized ePapers that Google loves.
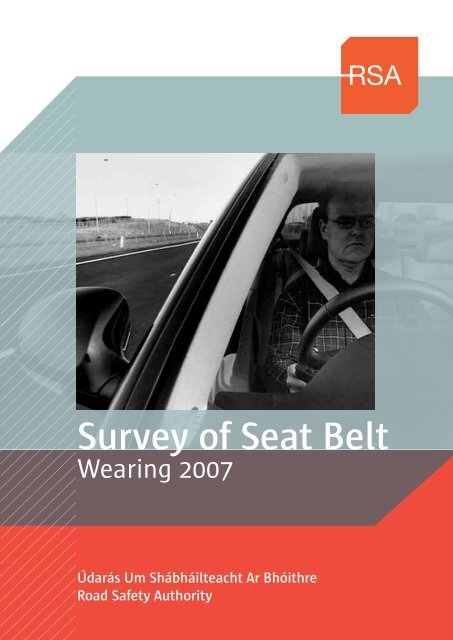
<strong>Survey</strong> <strong>of</strong> <strong>Seat</strong> <strong>Belt</strong><br />
Wearing 2007<br />
Údarás Um Shábháilteacht Ar Bhóithre<br />
<strong>Road</strong> <strong>Safety</strong> <strong>Authority</strong>
<strong>Survey</strong> <strong>of</strong> <strong>Seat</strong> <strong>Belt</strong> Wearing 2007<br />
Contents<br />
Executive Summary 3<br />
Introduction 4<br />
Overview <strong>of</strong> <strong>Seat</strong> belt wearing survey, 2007 6<br />
Front seat belt wearing rate results 7<br />
Rear seat belt wearing rates results 9<br />
Student seat belt wearing survey results 10<br />
Appendix 1: Adult <strong>Seat</strong> <strong>Belt</strong> <strong>Survey</strong> 12<br />
Appendix 2:Sample front seat belt survey sheet 13<br />
Appendix 3: <strong>Seat</strong> belt wearing rates survey locations 14<br />
1
<strong>Survey</strong> <strong>of</strong> <strong>Seat</strong> <strong>Belt</strong> Wearing 2007<br />
Executive Summary<br />
A nationwide observational survey <strong>of</strong> seatbelt wearing on Irish roads was<br />
conducted in the summer <strong>of</strong> 2007 by the <strong>Road</strong> <strong>Safety</strong> <strong>Authority</strong>. Data was<br />
recorded from drivers, both male and female, for front and rear passengers<br />
excluding children. Separate surveys for primary school and secondary school<br />
children in the front or rear seat were also conducted.<br />
<strong>Seat</strong> belt wearing<br />
increased by 2% in 2007<br />
The survey was designed to be broadly comparable with previous surveys since<br />
1991 in order to produce trend analysis. A total <strong>of</strong> 15,616 adults occupying front<br />
seat and 866 adults occupying rear seat were observed in 2007.<br />
Females continue to have<br />
better wearing rates than<br />
males<br />
During the last decade, drivers on Irish roads increasingly wore a seat belt. In<br />
2007, 88% <strong>of</strong> drivers observed were wearing a seatbelt. This represents an<br />
improvement <strong>of</strong> 2% over the summer 2006 survey. Previous surveys revealed<br />
wearing rates <strong>of</strong> 86% in 2005, 85 % in 2003 survey, 71% in 2002 survey, 55% in<br />
the 1999 and 52% in 1991.<br />
A significant increase in<br />
rear seat wearing, now at<br />
84%<br />
Compared to 2006 estimates, the overall front seat rate for females has<br />
increased by one percentage point to 93 %, while the rate for males increased<br />
by three percentage point to 85 % in 2007.<br />
In rear seats, the wearing rate for adults has increased from 63 % in 2006 to 84<br />
% in 2007. Women are more likely than men to wear seat belts in rear seats,<br />
with wearing rates <strong>of</strong> 87% and 80 % respectively.<br />
Significant improvement<br />
by primary school pupils<br />
The 2007 school seat belt survey showed a consistent increase in seat-belt<br />
wearing rates for primary schools. The estimated seat belt wearing rate for<br />
primary school goers in rear seats increased from 64 % in 2006 to 70 % in 2007.<br />
In the case <strong>of</strong> front seat belts this rate increased from 67% to 80%<br />
The only section that<br />
showed a decrease in<br />
wearing rates were<br />
secondary school pupils<br />
However the rate <strong>of</strong> seat belt wearing for secondary school pupils reduced from<br />
2006 levels. The rate <strong>of</strong> wearing <strong>of</strong> front seat fell from 88% to 78% and from 77%<br />
to 63% for those seated in the rear.<br />
2
<strong>Survey</strong> <strong>of</strong> <strong>Seat</strong> <strong>Belt</strong> Wearing 2007<br />
1. Introduction<br />
By far the greatest contributor to injury reduction in the past decades is the<br />
occupants in vehicles use <strong>of</strong> seat belts, (Shinar 2007) 1 . The World Health<br />
Organisation reported that fatalities and injuries can be reduced by between<br />
40-50 %, (WHO 2004) 2 .<br />
Under the Government <strong>Road</strong> <strong>Safety</strong> Strategy 2007-<br />
2012, a target <strong>of</strong> 95 % for front seat belt wearing<br />
has been set for Ireland by 2012 3 . The achievement<br />
<strong>of</strong> this target would set Ireland among the states<br />
with the safest road safety records in the world<br />
Given the proven effectiveness <strong>of</strong> seat belts, it is a<br />
matter <strong>of</strong> national interest in every country to<br />
measure seat belt use to track changes in use rates<br />
as a function <strong>of</strong> various efforts to increase usage.<br />
Under the Government <strong>Road</strong> <strong>Safety</strong> Strategy, 2007 –<br />
2012 the <strong>Road</strong>s <strong>Safety</strong> <strong>Authority</strong> is tasked with<br />
carrying out national surveys in relation to seat belt<br />
wearing and traffic speeds. <strong>Survey</strong> results are used<br />
to monitor trends, determine the effectiveness <strong>of</strong><br />
safety initiatives and to inform the on-going review<br />
<strong>of</strong> public policy in relation to road safety.<br />
Despite the fact that seatbelts are an effective way<br />
<strong>of</strong> reducing the number <strong>of</strong> road deaths and severely<br />
injured, not everybody wears one.<br />
The National <strong>Road</strong>s <strong>Authority</strong> in 2002, 2003 and<br />
2005, and the <strong>Road</strong> <strong>Safety</strong> <strong>Authority</strong> in 2006 carried<br />
out nationwide surveys <strong>of</strong> free speeds (Urban and<br />
Rural) and seat-belt wearing rates.<br />
Methods<br />
Over 100 sites were selected with an average <strong>of</strong> 100<br />
cars and light goods vehicles being surveyed at each<br />
location, giving a total sample size <strong>of</strong> over 10,000 -<br />
which is sufficient to give a range <strong>of</strong> accuracy <strong>of</strong><br />
approximately plus or minus one percent on the<br />
overall driver and front seat wearing rate figure.<br />
For the purposes <strong>of</strong> the survey the network <strong>of</strong> public<br />
roads was broken down into eleven separate road<br />
classes (listed in Appendix 1). As with previous<br />
surveys, members <strong>of</strong> An Garda Síochána, driving<br />
instructors, taxi drivers and children were excluded<br />
from the front and rear adult seat belt surveys.<br />
<strong>Survey</strong>ors were instructed to continue the survey<br />
until the target sample coverage was exceeded or<br />
for a maximum <strong>of</strong> three hours if the quota was not<br />
reached. Front and rear adult seat belt wearing rate<br />
surveys were carried out in June, July and August<br />
2007.<br />
The survey results may be biased as the survey was<br />
carried out during the daylight hours in the summer<br />
months; seat belt wearing rates may differ<br />
according to time <strong>of</strong> the day, day <strong>of</strong> the week and<br />
month. This is especially true because there would<br />
be a higher level <strong>of</strong> tourist activity on the roads<br />
during the summer months and tourists may be<br />
more or less likely than residents to wear seat belts.<br />
<strong>Seat</strong> belt wearing rates at the time <strong>of</strong> day that the<br />
surveys were carried out (mostly mid-morning or<br />
mid-afternoon) may also not be fully representative<br />
<strong>of</strong> average daily wearing rates.<br />
In addition to the front and rear adult seat belt<br />
surveys, the 2007, 2006, 2005 and 2003 studies<br />
included a separate seat belt survey <strong>of</strong> students<br />
attending primary and secondary schools.<br />
The front and rear adult seat belt survey locations<br />
are shown in Appendix 3.<br />
1 Shinar. D. (2007) Traffic <strong>Safety</strong> and Human Behaviour, Elsevier<br />
2 WHO (2004 World Report on <strong>Road</strong> Injury Prevention, Edited by M. Peden et al, World Health Organisation, Geneva<br />
http://www.who.int/violence_injury_prevention/publications/road_traffic/world_report/ summary_en_rev.pdf<br />
3 RSA (2007) <strong>Road</strong> <strong>Safety</strong> Strategy 2007-2012 <strong>Road</strong> <strong>Safety</strong> <strong>Authority</strong><br />
http://www.rsa.ie/publication/publication/upload/822_RSA_Strategy_ENG.pdfPHPSESSID=7cd3d7960dc0a149655056972337bd07<br />
3
<strong>Survey</strong> <strong>of</strong> <strong>Seat</strong> <strong>Belt</strong> Wearing 2007<br />
2. Overview <strong>of</strong> <strong>Seat</strong> belt wearing survey, 2007<br />
Overall <strong>Seat</strong>belt Use: In 2007, the overall front seat belt wearing in the<br />
Republic <strong>of</strong> Ireland was 88 %. This represents an increase <strong>of</strong> 2% over 2006,<br />
and a 35 % increase since 1999.<br />
100<br />
<strong>Seat</strong>belt Use by Gender Male (%) Female (%) Overall (%)<br />
80<br />
60<br />
40<br />
’91<br />
’99<br />
’02<br />
’03<br />
’05<br />
’06<br />
’07<br />
<strong>Seat</strong>belt Use by Gender<br />
Women are more likely than men to wear seat belts<br />
in front seats, with wearing rates <strong>of</strong> 93 % and 85 %<br />
respectively. Females had higher seat belt use than<br />
males whether driving as a front passenger or rear<br />
passenger and on all types <strong>of</strong> roads.<br />
<strong>Seat</strong>belt Use by <strong>Road</strong> Type<br />
While seat belt usage increases on all road types<br />
since 1991, the greatest increases are on urban<br />
roads in Cork, small urban areas, county roads and<br />
urban national secondary roads. <strong>Seat</strong> belt wearing<br />
on urban roads in Dunlaoghaire, Limerick and rural<br />
national primary roads, while improving, did so at a<br />
lesser rate than the other road types.<br />
<strong>Seat</strong> <strong>Belt</strong> Wearing Rates 1999-2007 by <strong>Road</strong> Type<br />
100<br />
80<br />
60<br />
40<br />
20<br />
’91<br />
’99<br />
’02<br />
’03<br />
’05<br />
’06<br />
’07<br />
County <strong>Road</strong>s Regional <strong>Road</strong>s Small Urban Areas Limerick (Urban) Dun Laoighaire (Urban) Dublin (Urban)<br />
Cork (Urban)<br />
Rural National<br />
Secondary <strong>Road</strong>s<br />
Rural National<br />
Primary <strong>Road</strong>s<br />
Urban National<br />
Secondary <strong>Road</strong>s<br />
Urban National<br />
Primary <strong>Road</strong>s<br />
4
<strong>Survey</strong> <strong>of</strong> <strong>Seat</strong> <strong>Belt</strong> Wearing 2007<br />
3. Front seat belt wearing rate results<br />
A total <strong>of</strong> 15,616 adults occupying front seats were observed in 2007. 12,319<br />
(79%) <strong>of</strong> the adults occupying front seat observed were driving, 3,297 (21%)<br />
were front seat passengers.<br />
The survey results in the table below which shows<br />
driver seat belt wearing rates by gender and road<br />
type, indicate that wearing rates are highest in<br />
Small Urban Areas, County roads, Cork (urban),<br />
Dublin (urban) and Urban National Primary roads<br />
and lowest on Limerick (urban) and National<br />
Secondary roads.<br />
Driver wearing rates (%) by gender and road<br />
class<br />
Male drivers are generally less likely to wear seat<br />
belts: in 2007, 86 % <strong>of</strong> male drivers and 93 % <strong>of</strong><br />
female drivers were observed to have been wearing<br />
seat belts. This shows a marginal increase in seat<br />
belt rates from the 2006 figures <strong>of</strong> 82 % and 92 %,<br />
respectively.<br />
<strong>Seat</strong> <strong>Belt</strong> Wearing Rates by Gender and <strong>Road</strong> Type - 2007<br />
Male (%) Female (%)<br />
100<br />
80<br />
60<br />
40<br />
20<br />
0<br />
Urban<br />
National<br />
Primary<br />
<strong>Road</strong>s<br />
Urban<br />
National<br />
Secondary<br />
<strong>Road</strong>s<br />
Rural<br />
National<br />
Primary<br />
<strong>Road</strong>s<br />
Rural<br />
National<br />
Secondary<br />
<strong>Road</strong>s<br />
Cork<br />
(Urban)<br />
Dublin<br />
(Urban)<br />
Dun Laoighaire<br />
(Urban)<br />
Limerick<br />
(Urban)<br />
Small<br />
Urban<br />
Areas<br />
Regional<br />
<strong>Road</strong>s<br />
County<br />
<strong>Road</strong>s<br />
5
<strong>Survey</strong> <strong>of</strong> <strong>Seat</strong> <strong>Belt</strong> Wearing 2007<br />
In 2007, 83 % <strong>of</strong> male and 94 % <strong>of</strong> female front seat<br />
passengers were observed to have been using seat<br />
belts. Combining the driver and front passenger<br />
wearing rates into an ‘overall front seat’ wearing<br />
rate, this rate has improved by two percentage<br />
points over the estimated figure in 2006 (88%). The<br />
overall front seat rate for females increased by one<br />
percentage point to 93 % in 2007, while the rate for<br />
males increased by three percentage points to 85 %<br />
in 2007.<br />
The table below shows the association between the<br />
driver and front passenger seat belt usage. The<br />
results suggest that both male and female drivers<br />
are more likely to be wearing a seat belt if the front<br />
seat passenger is belted up. Wearing rates are<br />
lowest for male drivers, especially for those beside<br />
unbelted male passengers (36%).<br />
Drivers and front passengers seat belt wearing rates (%) by gender, 1999, 2003 and 2007<br />
100<br />
80<br />
60<br />
40<br />
20<br />
0<br />
Front Passengers Female<br />
Front Passengers Male<br />
Drivers Female<br />
Drivers Male<br />
2007 2003 1999<br />
Association between the driver and front passenger seat belt usage, 2007<br />
MALE<br />
DRIVER<br />
WEARING RATES<br />
FEMALE<br />
DRIVER<br />
WEARING<br />
RATES<br />
OVERALL<br />
DRIVER<br />
WEARING<br />
RATES<br />
Driver alone 80 92 84<br />
Male passenger wearing 96 97 96<br />
Male passenger not wearing 36 76 43<br />
Female passenger wearing 96 98 96<br />
Female passenger not wearing 67 48 61<br />
Overall Wearing Rates 86 93 88<br />
6
<strong>Survey</strong> <strong>of</strong> <strong>Seat</strong> <strong>Belt</strong> Wearing 2007<br />
4. Rear seat belt wearing rates results<br />
On the rear seats, the wearing rate for adults has increased from 63 % in<br />
2006 to 84 % in 2007. Women are more likely than men to wear seat belts in<br />
rear seats, with wearing rates <strong>of</strong> 87% and 80 % respectively.<br />
The table below shows the results <strong>of</strong> the adult rear<br />
seat belt surveys conducted in 2007. Sample sizes<br />
for each location were relatively small owing in part<br />
to the low proportion <strong>of</strong> cars with an adult in the<br />
rear seat and also reflecting the difficulty surveying<br />
rear seats.<br />
The total number <strong>of</strong> vehicles containing rear<br />
passengers observed was only 866. When spread<br />
across the 100 locations the numbers observed were<br />
very few. In Cork the number was only 33, in<br />
Dunlaoghaire 10 and in Limerick only 13.<br />
Wearing rates (%) for adults in the rear seats<br />
100<br />
<strong>Seat</strong> <strong>Belt</strong> usage in rear seats - years 2003 - 2007 2007 2006 2005 2003<br />
80<br />
60<br />
40<br />
20<br />
0<br />
All<br />
Male<br />
Female<br />
7
<strong>Survey</strong> <strong>of</strong> <strong>Seat</strong> <strong>Belt</strong> Wearing 2007<br />
5. Student seat belt wearing survey results<br />
<strong>Seat</strong> belt wearing rates were surveyed at a total <strong>of</strong> 28 schools, <strong>of</strong> which 15<br />
were secondary schools. <strong>Survey</strong>ors were asked to select sites in excess <strong>of</strong> 100<br />
metres away from each <strong>of</strong> the schools, which were the same as those chosen<br />
for the previous (2003, 2005 and 2006) surveys and were originally chosen at<br />
random from a list provided by the Department <strong>of</strong> Education.<br />
List <strong>of</strong> schools surveyed<br />
Primary Schools<br />
Aine Na<strong>of</strong>a, Gort, Galway<br />
Brackenstown, Swords<br />
Christ the King Cabra<br />
Holy Family, Balloonagh, Tralee<br />
IIIlies, Ballymangan Lifford, Donegal<br />
Mountmellick Convent, Laois<br />
Naomh Padraig, Donabate<br />
Our Lady <strong>of</strong> Consolation, Collins Avenue<br />
Presentation College, Thurles<br />
Rath Eoghan, Westmeath<br />
Sciol Na Molua Ardagh, Limerick<br />
Scoil Spirit Naomh, Bishopstown<br />
St. Michaels Stradone, Cavan<br />
St. Patrick’s College, Tuam<br />
Secondary Schools<br />
Ardee Community School<br />
Ballymun Snr. Comp Ballymun<br />
Belvedere College Dublin<br />
Castlecomer Community School<br />
Colaiste Mhuire, Cobh<br />
Community Sch., Carrick-on-Shannon<br />
Drumcollogher Community<br />
Leixilip Community Celbridge Rd<br />
Meanscoil lognaid Ris, Longmile <strong>Road</strong><br />
Scoil Mhuire Greenhill Carrick-on-Suir<br />
Scoil Mhire gan Smal, Roscommon<br />
St. Joseph’s, Rochefortbridge, Mullingar<br />
St. Mary’s Ballysadare, Sligo<br />
Tullow Community School<br />
8
<strong>Survey</strong> <strong>of</strong> <strong>Seat</strong> <strong>Belt</strong> Wearing 2007<br />
Primary schools<br />
A total <strong>of</strong> 415 primary school goers were surveyed in the front seat <strong>of</strong> cars. The table below shows that front<br />
seat-belt wearing rates were significantly higher for females (80%) than for males (79%). An average <strong>of</strong> 80%<br />
<strong>of</strong> primary school goers in the front passenger seat wore a belt in 2007, an increase <strong>of</strong> four percentage<br />
points over the 2006 figure.<br />
Primary schools – front seat belt wearing rates, 2007.<br />
Not wearing Wearing Wearing Rate (%)<br />
Female 38 155 80<br />
Male 47 175 79<br />
Total 2007 85 330 80<br />
Total 2006 94 294 76<br />
Total 2005 126 288 70<br />
Total 2003 133 283 68<br />
Out <strong>of</strong> a total <strong>of</strong> 599 primary school children in rear seats, 416 (or 70%) were wearing a seat belt. While this<br />
wearing rate is lower than that for those in the front passenger seat, it represents an improvement <strong>of</strong> six<br />
percentage points over the respective figure for 2006. Wearing rates for this cohort <strong>of</strong> males (63%) were<br />
significantly lower than for females (75%).<br />
Primary schools – rear seat belt wearing rates, 2007.<br />
Not wearing Wearing Wearing Rate (%)<br />
Female 75 229 75<br />
Male 108 187 63<br />
Total 2007 183 416 70<br />
Total 2006 202 360 64<br />
Total 2005 170 251 60<br />
Total 2003 216 203 48<br />
9
<strong>Survey</strong> <strong>of</strong> <strong>Seat</strong> <strong>Belt</strong> Wearing 2007<br />
Secondary schools<br />
The table provides a breakdown <strong>of</strong> the wearing rates for a total <strong>of</strong> 926 secondary school goers who were<br />
surveyed in the front passenger seat.<br />
Secondary schools – front seat belt wearing rates, 2007.<br />
Not wearing Wearing Wearing Rate (%)<br />
Female 116 444 79<br />
Male 85 283 77<br />
Total 2007 201 727 78<br />
Total 2006 91 655 88<br />
Total 2005 295 623 68<br />
Total 2003 211 343 62<br />
The table below shows the wearing rates for secondary school students in rear seats. Wearing rates are<br />
marginally higher for females (79%) than males (77%). The combined male and female, wearing rate for this<br />
group was 78%.<br />
Female secondary school goers are marginally more likely to wear seat belts in rear seats, with 66% <strong>of</strong><br />
females and 60% <strong>of</strong> males wearing seat belts.<br />
Secondary schools – front seat belt wearing rates, 2007.<br />
Not wearing Wearing Wearing Rate (%)<br />
Female 111 213 66<br />
Male 105 156 60<br />
Total 2007 216 369 63<br />
Total 2006 146 454 76<br />
Total 2005 271 325 55<br />
Total 2003 203 157 44<br />
10
<strong>Survey</strong> <strong>of</strong> <strong>Seat</strong> <strong>Belt</strong> Wearing 2007<br />
Appendix 1: Adult <strong>Seat</strong> <strong>Belt</strong> <strong>Survey</strong><br />
The survey was be carried out during working hours,<br />
Monday- Friday (9.30-17.30) and on 11 separate<br />
road classes:<br />
Urban national primary roads;<br />
Urban national secondary roads;<br />
Rural national primary roads;<br />
Rural national secondary roads;<br />
Cork (Urban);<br />
Dublin (Urban);<br />
Dun Laoghaire (Urban);<br />
As there were no comprehensive recent estimates<br />
for the distribution <strong>of</strong> total traffic on the network by<br />
these various road classes, it was assumed that the<br />
patterns <strong>of</strong> traffic had remained constant over the<br />
period and as a consequence the target sample sizes<br />
used in this survey were identical to that <strong>of</strong> the<br />
1999, 2002, 2003 and 2005 surveys.<br />
Members <strong>of</strong> An Garda Síochána, driving instructors,<br />
taxi drivers and children were excluded from the<br />
adult front and rear seat belt survey [separate<br />
primary and secondary school surveys were<br />
undertaken]. <strong>Survey</strong>ors were instructed to continue<br />
the survey until the target sample was exceeded or<br />
for a maximum <strong>of</strong> three hours if the quota was not<br />
reached.<br />
Limerick (Urban);<br />
Small urban areas (counted as a single road<br />
class);<br />
Regional roads, and<br />
County roads.<br />
Eligible vehicles:<br />
Cars<br />
Light goods vehicles<br />
11
<strong>Survey</strong> <strong>of</strong> <strong>Seat</strong> <strong>Belt</strong> Wearing 2007<br />
Appendix 2: Sample front seat belt survey sheet<br />
<strong>Seat</strong>-<strong>Belt</strong> Wearing <strong>Survey</strong> Front<br />
Site Information:<br />
Code:<br />
Location:<br />
Date:<br />
Target Sample Size:<br />
Actual Sample Size:<br />
Weather:<br />
Start Time:<br />
Finish Time:<br />
Speed Limit:<br />
<strong>Survey</strong>ed by:<br />
Driver<br />
Passenger<br />
Male Female <strong>Seat</strong>-belt Unknown Male Female <strong>Seat</strong>-belt Unknown<br />
12
<strong>Survey</strong> <strong>of</strong> <strong>Seat</strong> <strong>Belt</strong> Wearing 2007<br />
Appendix 3: <strong>Seat</strong> belt wearing rates survey locations<br />
Table A3.1: Urban national primary roads<br />
CODE ROAD SECTION LOCATION<br />
28 N7 48 Inchicore<br />
27 N4 42 Palmerstown Avenue junction<br />
24 N7 20C Portlaoise<br />
22 N22 5 Killarney<br />
29 N6 2C Galway<br />
20 N8 8 Fermoy<br />
Table A3.2: Urban national secondary roads<br />
CODE ROAD SECTION LOCATION<br />
15 N60 1 Westport<br />
26 N51 7 Navan<br />
Table A3.1: Urban national primary roads<br />
CODE ROAD SECTION LOCATION<br />
19 N25 7 Near Wexford town<br />
23 N9 01B Waterford<br />
10 N9 10 North <strong>of</strong> Waterford<br />
16 N2 10 Carrickmacross<br />
11 N15 1 Lifford<br />
12 N15 7 Donegal town<br />
21 N15 11 Ballyshannon<br />
25 N17 12 Julianstown – Drogheda<br />
6 N4 16 Drumsna – Drumod<br />
17 N6 22 Moate – Horsleap<br />
9 N24 20 Monard – Oola<br />
14 N21 3 Castleisland – Tralee<br />
13 N17 15 Galway – Claregalway<br />
Table A3.4: Rural national secondary roads<br />
CODE ROAD SECTION LOCATION<br />
3 N62 4 Thurles – Templemore<br />
8 N62 5 Templemore<br />
4 N56 9 Dungloe<br />
2 N57 4 Foxford – Swinford<br />
7 N55 8 Mostrim - Granard<br />
5 N65 3 Portumna<br />
18 N52 2 Nenagh<br />
1 N67 4 Kilkee<br />
13
<strong>Survey</strong> <strong>of</strong> <strong>Seat</strong> <strong>Belt</strong> Wearing 2007<br />
Table A3.5: Cork (urban)<br />
CODE CITY STREET<br />
101 Cork Monahan <strong>Road</strong><br />
102 Cork Mount Pleasant <strong>Road</strong><br />
103 Cork Clanricard <strong>Road</strong><br />
104 Cork North Main Street<br />
105 Cork Cathedral <strong>Road</strong><br />
Table A3.6: Dublin (urban)<br />
CODE CITY STREET<br />
106 Dublin Walkinstown Park<br />
107 Dublin St Finbarr’s <strong>Road</strong><br />
108 Dublin Old County <strong>Road</strong><br />
109 Dublin Kinvara Avenue<br />
111 Dublin Tonglee <strong>Road</strong><br />
112 Dublin Richmond <strong>Road</strong><br />
113 Dublin Dolphin <strong>Road</strong><br />
114 Dublin Pearse Street<br />
115 Dublin Malahide <strong>Road</strong><br />
116 Dublin Mount Street Upper<br />
117 Dublin Fairview<br />
Table A3.7: Dun Laoghaire (urban)<br />
CODE CITY STREET<br />
118 Dun Laoighire Ardmore Park<br />
119 Dun Laoighire Sallynoggin <strong>Road</strong><br />
120 Dun Laoighire Sandycove <strong>Road</strong><br />
Table A3.8: Limerick (urban)<br />
CODE CITY STREET<br />
121 Limerick Claughan Fort<br />
122 Limerick Brookville Avenue<br />
123 Limerick Shelbourne <strong>Road</strong><br />
14
<strong>Survey</strong> <strong>of</strong> <strong>Seat</strong> <strong>Belt</strong> Wearing 2007<br />
Table A3.9: Small urban areas<br />
CODE CITY STREET<br />
201 Galway Seapoint Promenade<br />
202 Galway Fr. Bourke <strong>Road</strong><br />
203 Galway Dominick Street<br />
205 Athlone Strand <strong>Road</strong><br />
206 Kilkenny Michael Street<br />
207 Carrick-on-Suir Cattlemart<br />
208 Longford St. Josephs <strong>Road</strong><br />
209 Longford Great Water Street<br />
210 Skibbereen High Street<br />
Table A3.10: Regional roads<br />
CODE ROAD CITY STREET<br />
320 R576 Cork Coolagh Junction<br />
321 R262 Donegal Donegal - Glenties<br />
322 R671 Waterford Knocknaskadagh<br />
327 R474 Clare Aug Na Glanna Bridge<br />
328 R339 Galway Monivea<br />
329 R336 Galway Irish College Spiddal<br />
330 R414 Kildare Mountrice<br />
331 R697 Kilkenny O’Leary’s Cross<br />
332 R695 Kilkenny Damma<br />
333 R513 Limerick Kilglass<br />
334 R319 Mayo Mulrany-Achill<br />
335 R178 Monaghan Rakeragh<br />
336 R165 Monaghan Drumbear<br />
337 R437 Offaly Broughall<br />
338 R440 Offaly Cadamstown<br />
339 R400 Westmeath Mullingar<br />
340 R392 Westmeath Mullingar<br />
341 R760 Wicklow Ballyvourney <strong>Road</strong><br />
15
<strong>Survey</strong> <strong>of</strong> <strong>Seat</strong> <strong>Belt</strong> Wearing 2007<br />
Table A3.11: County roads<br />
CODE COUNTY LOCATION<br />
301 Cork Bartlemy<br />
302 Cork Dirk-Long Strand<br />
303 Laois Castletown<br />
304 Limerick Ballyshonnaig<br />
305 Waterford Curraghkiely<br />
306 Cork Ballyhooly<br />
307 Donegal McIvors Farm<br />
308 Longford Killenboy<br />
309 Clare Caherleen<br />
310 Cork Meelin<br />
311 Donegal Letterkenny – Trentagh<br />
312 Donegal Castlemurray<br />
313 Galway Doonwood Golflinks<br />
314 Kerry Drumclough School<br />
315 Laois Killenure<br />
316 Roscommon Castleplunkit<br />
317 Westmeath Knockaville<br />
318 Wexford Dunganstown<br />
319 Wexford Ballytarsna<br />
323 Cork Cahirbarnagh<br />
324 Cork Glanworth<br />
325 Donegal Clonmany – Lennan<br />
326 Offaly Rahan – Ballycumber<br />
342 Cork Ballyknoskane<br />
343 Cork Mallymackeagh<br />
344 Kerry Ballineany<br />
346 Waterford Cappaquin – Youghal<br />
401 Dublin Tobersoole Lane<br />
402 Dublin South Strand <strong>Road</strong>, Rush<br />
403 Dublin Millview <strong>Road</strong> Malahide<br />
16
Working To Save Lives<br />
Údarás Um Shábháilteacht Ar Bhóithre<br />
<strong>Road</strong> <strong>Safety</strong> <strong>Authority</strong><br />
Páirc Ghnó Ghleann na Muaidhe, Cnoc an tSabhaircín, Bóthar Bhaile Átha Cliath,<br />
Béal an Átha, Co. Mhaigh Eo.<br />
Moy Valley Business Park, Primrose Hill, Dublin <strong>Road</strong>, Ballina, Co. Mayo.<br />
locall: 1890 50 60 80 fax: (096) 25 252<br />
email: info@rsa.ie website: www.rsa.ie


