An-Evaluation-of-Spearmans-Hypothesis-by-Manipulating-g-Saturation
An-Evaluation-of-Spearmans-Hypothesis-by-Manipulating-g-Saturation
An-Evaluation-of-Spearmans-Hypothesis-by-Manipulating-g-Saturation
- No tags were found...

You also want an ePaper? Increase the reach of your titles
YUMPU automatically turns print PDFs into web optimized ePapers that Google loves.
Spearman’s <strong>Hypothesis</strong> 337<br />
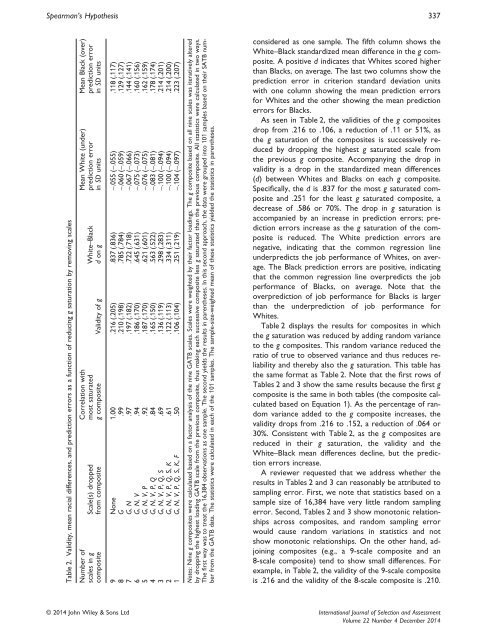
Table 2. Validity, mean racial differences, and prediction errors as a function <strong>of</strong> reducing g saturation <strong>by</strong> removing scales<br />
Mean Black (over)<br />
prediction error<br />
in SD units<br />
Mean White (under)<br />
prediction error<br />
in SD units<br />
White–Black<br />
d on g<br />
Correlation with<br />
most saturated<br />
g composite Validity <strong>of</strong> g<br />
Scale(s) dropped<br />
from composite<br />
Number <strong>of</strong><br />
scales in g<br />
composite<br />
9 None 1.00 .216 (.205) .837 (.836) −.055 (−.055) .118(.117)<br />
8 G .99 .210(.198) .785 (.784) −.060 (−.059) .129 (.127)<br />
7 G, N .97 .197 (.182) .722 (.718) −.067 (−.066) .144 (.141)<br />
6 G, N, V .94 .186 (.170) .645 (.631) −.075 (−.073) .160 (.156)<br />
5 G, N, V, P .92 .187 (.170) .621 (.601) −.076 (−.075) .162 (.159)<br />
4 G, N, V, P, Q .84 .165 (.150) .563 (.522) −.083 (−.081) .178 (.174)<br />
3 G, N, V, P, Q, S .69 .136 (.119) .298 (.283) −.100 (−.094) .214 (.201)<br />
2 G, N, V, P, Q, S,K .61 .122 (.113) .334 (.311) −.100 (−.094) .214 (.200)<br />
1 G, N, V, P, Q, S, K, F .50 .106 (.104) .251 (.219) −.104 (−.097) .223 (.207)<br />
Notes: Nine g composites were calculated based on a factor analysis <strong>of</strong> the nine GATB scales. Scales were weighted <strong>by</strong> their factor loadings. The g composite based on all nine scales was iteratively altered<br />
<strong>by</strong> dropping the highest loading GATB scale from the previous composite, thus making each successive composite less g saturated than the previous composite. All statistics were calculated in two ways.<br />
The first way was to treat the 16,384 observations as one sample. The second yields the results in parentheses. In this second approach, the data were grouped into 101 samples based on their SATB number<br />
from the GATB data. The statistics were calculated in each <strong>of</strong> the 101 samples. The sample-size-weighted mean <strong>of</strong> these statistics yielded the statistics in parentheses.<br />
considered as one sample. The fifth column shows the<br />
White–Black standardized mean difference in the g composite.<br />
A positive d indicates that Whites scored higher<br />
than Blacks, on average. The last two columns show the<br />
prediction error in criterion standard deviation units<br />
with one column showing the mean prediction errors<br />
for Whites and the other showing the mean prediction<br />
errors for Blacks.<br />
As seen in Table 2, the validities <strong>of</strong> the g composites<br />
drop from .216 to.106, a reduction <strong>of</strong> .11 or 51%, as<br />
the g saturation <strong>of</strong> the composites is successively reduced<br />
<strong>by</strong> dropping the highest g saturated scale from<br />
the previous g composite. Accompanying the drop in<br />
validity is a drop in the standardized mean differences<br />
(d) between Whites and Blacks on each g composite.<br />
Specifically, the d is .837 for the most g saturated composite<br />
and .251 for the least g saturated composite, a<br />
decrease <strong>of</strong> .586 or 70%. The drop in g saturation is<br />
accompanied <strong>by</strong> an increase in prediction errors; prediction<br />
errors increase as the g saturation <strong>of</strong> the composite<br />
is reduced. The White prediction errors are<br />
negative, indicating that the common regression line<br />
underpredicts the job performance <strong>of</strong> Whites, on average.<br />
The Black prediction errors are positive, indicating<br />
that the common regression line overpredicts the job<br />
performance <strong>of</strong> Blacks, on average. Note that the<br />
overprediction <strong>of</strong> job performance for Blacks is larger<br />
than the underprediction <strong>of</strong> job performance for<br />
Whites.<br />
Table 2 displays the results for composites in which<br />
the g saturation was reduced <strong>by</strong> adding random variance<br />
to the g composites. This random variance reduced the<br />
ratio <strong>of</strong> true to observed variance and thus reduces reliability<br />
and there<strong>by</strong> also the g saturation. This table has<br />
the same format as Table 2. Note that the first rows <strong>of</strong><br />
Tables 2 and 3 show the same results because the first g<br />
composite is the same in both tables (the composite calculated<br />
based on Equation 1). As the percentage <strong>of</strong> random<br />
variance added to the g composite increases, the<br />
validity drops from .216 to.152, a reduction <strong>of</strong> .064 or<br />
30%. Consistent with Table 2, as the g composites are<br />
reduced in their g saturation, the validity and the<br />
White–Black mean differences decline, but the prediction<br />
errors increase.<br />
A reviewer requested that we address whether the<br />
results in Tables 2 and 3 can reasonably be attributed to<br />
sampling error. First, we note that statistics based on a<br />
sample size <strong>of</strong> 16,384 have very little random sampling<br />
error. Second, Tables 2 and 3 show monotonic relationships<br />
across composites, and random sampling error<br />
would cause random variations in statistics and not<br />
show monotonic relationships. On the other hand, adjoining<br />
composites (e.g., a 9-scale composite and an<br />
8-scale composite) tend to show small differences. For<br />
example, in Table 2, the validity <strong>of</strong> the 9-scale composite<br />
is .216 and the validity <strong>of</strong> the 8-scale composite is .210.<br />
©2014 John Wiley & Sons Ltd International Journal <strong>of</strong> Selection and Assessment<br />
Volume 22 Number 4 December 2014