An-Evaluation-of-Spearmans-Hypothesis-by-Manipulating-g-Saturation
An-Evaluation-of-Spearmans-Hypothesis-by-Manipulating-g-Saturation
An-Evaluation-of-Spearmans-Hypothesis-by-Manipulating-g-Saturation
- No tags were found...

Create successful ePaper yourself
Turn your PDF publications into a flip-book with our unique Google optimized e-Paper software.
338 Michael A. McDaniel and Sven Kepes<br />
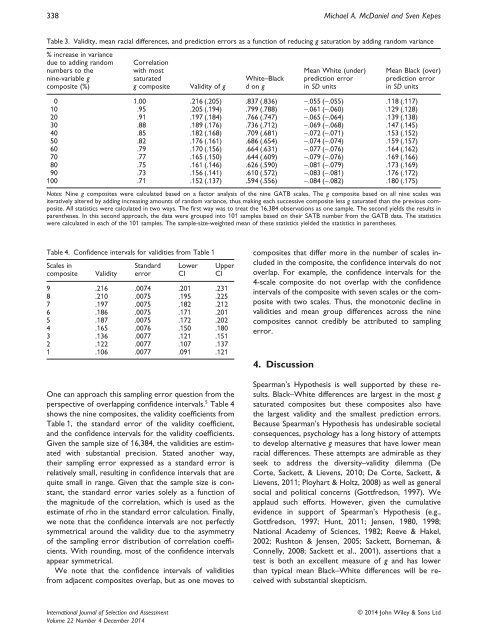
Table 3. Validity, mean racial differences, and prediction errors as a function <strong>of</strong> reducing g saturation <strong>by</strong> adding random variance<br />
% increase in variance<br />
due to adding random<br />
numbers to the<br />
nine-variable g<br />
composite (%)<br />
Correlation<br />
with most<br />
saturated<br />
g composite<br />
Validity <strong>of</strong> g<br />
White–Black<br />
d on g<br />
Mean White (under)<br />
prediction error<br />
in SD units<br />
Mean Black (over)<br />
prediction error<br />
in SD units<br />
0 1.00 .216 (.205) .837 (.836) −.055 (−.055) .118(.117)<br />
10 .95 .205 (.194) .799 (.788) −.061 (−.060) .129 (.128)<br />
20 .91 .197 (.184) .766 (.747) −.065 (−.064) .139 (.138)<br />
30 .88 .189 (.176) .736 (.712) −.069 (−.068) .147 (.145)<br />
40 .85 .182 (.168) .709 (.681) −.072 (−.071) .153 (.152)<br />
50 .82 .176 (.161) .686 (.654) −.074 (−.074) .159 (.157)<br />
60 .79 .170 (.156) .664 (.631) −.077 (−.076) .164 (.162)<br />
70 .77 .165 (.150) .644 (.609) −.079 (−.076) .169 (.166)<br />
80 .75 .161 (.146) .626 (.590) −.081 (−.079) .173 (.169)<br />
90 .73 .156 (.141) .610 (.572) −.083 (−.081) .176 (.172)<br />
100 .71 .152 (.137) .594 (.556) −.084 (−.082) .180 (.175)<br />
Notes: Nine g composites were calculated based on a factor analysis <strong>of</strong> the nine GATB scales. The g composite based on all nine scales was<br />
iteratively altered <strong>by</strong> adding increasing amounts <strong>of</strong> random variance, thus making each successive composite less g saturated than the previous composite.<br />
All statistics were calculated in two ways. The first way was to treat the 16,384 observations as one sample. The second yields the results in<br />
parentheses. In this second approach, the data were grouped into 101 samples based on their SATB number from the GATB data. The statistics<br />
were calculated in each <strong>of</strong> the 101 samples. The sample-size-weighted mean <strong>of</strong> these statistics yielded the statistics in parentheses.<br />
Table 4. Confidence intervals for validities from Table 1<br />
Scales in<br />
composite<br />
Validity<br />
Standard<br />
error<br />
Lower<br />
CI<br />
Upper<br />
CI<br />
9 .216 .0074 .201 .231<br />
8 .210 .0075 .195 .225<br />
7 .197 .0075 .182 .212<br />
6 .186 .0075 .171 .201<br />
5 .187 .0075 .172 .202<br />
4 .165 .0076 .150 .180<br />
3 .136 .0077 .121 .151<br />
2 .122 .0077 .107 .137<br />
1 .106 .0077 .091 .121<br />
One can approach this sampling error question from the<br />
perspective <strong>of</strong> overlapping confidence intervals. 5 Table 4<br />
shows the nine composites, the validity coefficients from<br />
Table 1, the standard error <strong>of</strong> the validity coefficient,<br />
and the confidence intervals for the validity coefficients.<br />
Given the sample size <strong>of</strong> 16,384, the validities are estimated<br />
with substantial precision. Stated another way,<br />
their sampling error expressed as a standard error is<br />
relatively small, resulting in confidence intervals that are<br />
quite small in range. Given that the sample size is constant,<br />
the standard error varies solely as a function <strong>of</strong><br />
the magnitude <strong>of</strong> the correlation, which is used as the<br />
estimate <strong>of</strong> rho in the standard error calculation. Finally,<br />
we note that the confidence intervals are not perfectly<br />
symmetrical around the validity due to the asymmetry<br />
<strong>of</strong> the sampling error distribution <strong>of</strong> correlation coefficients.<br />
With rounding, most <strong>of</strong> the confidence intervals<br />
appear symmetrical.<br />
We note that the confidence intervals <strong>of</strong> validities<br />
from adjacent composites overlap, but as one moves to<br />
composites that differ more in the number <strong>of</strong> scales included<br />
in the composite, the confidence intervals do not<br />
overlap. For example, the confidence intervals for the<br />
4-scale composite do not overlap with the confidence<br />
intervals <strong>of</strong> the composite with seven scales or the composite<br />
with two scales. Thus, the monotonic decline in<br />
validities and mean group differences across the nine<br />
composites cannot credibly be attributed to sampling<br />
error.<br />
4. Discussion<br />
Spearman’s <strong>Hypothesis</strong> is well supported <strong>by</strong> these results.<br />
Black–White differences are largest in the most g<br />
saturated composites but these composites also have<br />
the largest validity and the smallest prediction errors.<br />
Because Spearman’s <strong>Hypothesis</strong> has undesirable societal<br />
consequences, psychology has a long history <strong>of</strong> attempts<br />
to develop alternative g measures that have lower mean<br />
racial differences. These attempts are admirable as they<br />
seek to address the diversity–validity dilemma (De<br />
Corte, Sackett, & Lievens, 2010; De Corte, Sackett, &<br />
Lievens, 2011; Ployhart & Holtz, 2008) as well as general<br />
social and political concerns (Gottfredson, 1997). We<br />
applaud such efforts. However, given the cumulative<br />
evidence in support <strong>of</strong> Spearman’s <strong>Hypothesis</strong> (e.g.,<br />
Gottfredson, 1997; Hunt, 2011; Jensen, 1980, 1998;<br />
National Academy <strong>of</strong> Sciences, 1982; Reeve & Hakel,<br />
2002; Rushton & Jensen, 2005; Sackett, Borneman, &<br />
Connelly, 2008; Sackett et al., 2001), assertions that a<br />
test is both an excellent measure <strong>of</strong> g and has lower<br />
than typical mean Black–White differences will be received<br />
with substantial skepticism.<br />
International Journal <strong>of</strong> Selection and Assessment<br />
Volume 22 Number 4 December 2014<br />
©2014 John Wiley & Sons Ltd