economic analysis of small-scale tilapia aquaculture in mozambique
economic analysis of small-scale tilapia aquaculture in mozambique
economic analysis of small-scale tilapia aquaculture in mozambique

You also want an ePaper? Increase the reach of your titles
YUMPU automatically turns print PDFs into web optimized ePapers that Google loves.
P.O. Box 1390, Skulagata 4<br />
120 Reykjavik, Iceland F<strong>in</strong>al Project 2008<br />
ECONOMIC ANALYSIS OF SMALL-SCALE TILAPIA<br />
AQUACULTURE IN MOZAMBIQUE<br />
Alda M a . J. Salia<br />
Institute Nacional de Desenvolvimento de Aquacultura (INAQUA)<br />
Av: Almeida Garrett N o 46, Bairro da Coop<br />
Maputo<br />
Telefax: +25821415725<br />
asilva@mozpesca.gov.mz<br />
Supervisor<br />
Pall Jensson<br />
University <strong>of</strong> Iceland<br />
pall@hi.is<br />
ABSTRACT<br />
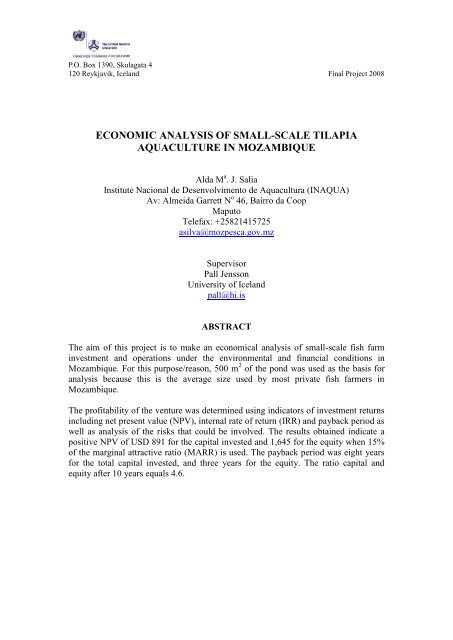
The aim <strong>of</strong> this project is to make an <strong>economic</strong>al <strong>analysis</strong> <strong>of</strong> <strong>small</strong>-<strong>scale</strong> fish farm<br />
<strong>in</strong>vestment and operations under the environmental and f<strong>in</strong>ancial conditions <strong>in</strong><br />
Mozambique. For this purpose/reason, 500 m 2 <strong>of</strong> the pond was used as the basis for<br />
<strong>analysis</strong> because this is the average size used by most private fish farmers <strong>in</strong><br />
Mozambique.<br />
The pr<strong>of</strong>itability <strong>of</strong> the venture was determ<strong>in</strong>ed us<strong>in</strong>g <strong>in</strong>dicators <strong>of</strong> <strong>in</strong>vestment returns<br />
<strong>in</strong>clud<strong>in</strong>g net present value (NPV), <strong>in</strong>ternal rate <strong>of</strong> return (IRR) and payback period as<br />
well as <strong>analysis</strong> <strong>of</strong> the risks that could be <strong>in</strong>volved. The results obta<strong>in</strong>ed <strong>in</strong>dicate a<br />
positive NPV <strong>of</strong> USD 891 for the capital <strong>in</strong>vested and 1,645 for the equity when 15%<br />
<strong>of</strong> the marg<strong>in</strong>al attractive ratio (MARR) is used. The payback period was eight years<br />
for the total capital <strong>in</strong>vested, and three years for the equity. The ratio capital and<br />
equity after 10 years equals 4.6.
Salia<br />
TABLE OF CONTENTS<br />
1 INTRODUCTION ............................................................................................................................... 5<br />
2 JUSTIFICATIONS ............................................................................................................................... 6<br />
2.1 Vision ....................................................................................................................................... 6<br />
3 LITERATURE REVIEW ........................................................................................................................ 7<br />
3.1 World <strong>aquaculture</strong> ................................................................................................................... 7<br />
3.2 Sub-Saharan Africa <strong>aquaculture</strong> .............................................................................................. 8<br />
3.3 Aquaculture <strong>in</strong> Mozambique ................................................................................................... 9<br />
3.4 General <strong>economic</strong> <strong>analysis</strong> .................................................................................................... 10<br />
4 METHODOLOGIES .......................................................................................................................... 12<br />
4.1 Data <strong>analysis</strong> .......................................................................................................................... 12<br />
4.2 Production plann<strong>in</strong>g model ................................................................................................... 13<br />
4.2.1 One pond model ............................................................................................................ 13<br />
5 PLANNING FARM OPERATION ....................................................................................................... 15<br />
5.1 Pr<strong>of</strong>itability model ................................................................................................................. 15<br />
5.2 Investment costs ................................................................................................................... 16<br />
5.3 Operat<strong>in</strong>g costs ...................................................................................................................... 17<br />
5.3.1 Expected returns ............................................................................................................ 17<br />
6 RESULTS ......................................................................................................................................... 18<br />
6.1 The net and total cash flow ................................................................................................... 18<br />
6.2 Accumulated net present value (NPV) .................................................................................. 18<br />
6.3 Internal rate <strong>of</strong> return (IRR) ................................................................................................... 19<br />
6.4 Debt service coverage ratio ................................................................................................... 19<br />
6.5 The net current ratio ............................................................................................................. 20<br />
6.6 Sensitivity <strong>analysis</strong> ................................................................................................................. 20<br />
7 DISCUSSION ................................................................................................................................... 21<br />
8 CONCLUSION ................................................................................................................................. 22<br />
ACKNOWLEDGEMENTS ......................................................................................................................... 23<br />
LIST OF REFERENCES .............................................................................................................................. 24<br />
APPENDICES ........................................................................................................................................... 27<br />
UNU-Fisheries Tra<strong>in</strong><strong>in</strong>g Programme 2
Salia<br />
Appendix 1: Pr<strong>of</strong>itability model: Assumptions and Results .................................................................. 32<br />
Appendix 2: Pr<strong>of</strong>itability model: Investment and f<strong>in</strong>ance ..................................................................... 33<br />
Appendix 3: Pr<strong>of</strong>itability model: Operation statement ......................................................................... 34<br />
Appendix 4: Pr<strong>of</strong>itability model: Cash flow ........................................................................................... 35<br />
Appendix 5: Pr<strong>of</strong>itability model: Source and allocation <strong>of</strong> founds ........................................................ 36<br />
Appendix 6: Pr<strong>of</strong>itability model: balance sheet .................................................................................... 37<br />
Appendix 7: Pr<strong>of</strong>itability model: Pr<strong>of</strong>itability measurements ............................................................... 38<br />
UNU-Fisheries Tra<strong>in</strong><strong>in</strong>g Programme 3
Salia<br />
LIST OF FIGURES<br />
Figure 1: World fisheries and <strong>aquaculture</strong> production and utilisation (Ichiro Nomura. 2007. 8<br />
Figure 2: Aquaculture production <strong>in</strong> Mozambique (from 2002-2007) (FAO, Fishery and<br />
Aquaculture Country Pr<strong>of</strong>ile 2006-2009) ................................................................................ 10<br />
Figure 3: Net- and total cash flow <strong>of</strong> the company dur<strong>in</strong>g 10 years <strong>of</strong> operation. ................. 18<br />
Figure 4: NPV and payback period <strong>of</strong> the 500 m 2 <strong>tilapia</strong> farm model. .................................... 19<br />
Figure 5: IRR <strong>of</strong> a <strong>tilapia</strong> farm. ................................................................................................. 19<br />
Figure 6: F<strong>in</strong>ancial ratios <strong>of</strong> 500m 2 <strong>tilapia</strong> production model. ................................................ 20<br />
Figure 7: Impact <strong>analysis</strong> <strong>of</strong> sales price, production and cost <strong>of</strong> equipment <strong>of</strong> the <strong>tilapia</strong><br />
production model. ................................................................................................................... 20<br />
Figure 8: Aquaculture production by region group<strong>in</strong>g <strong>in</strong> 2004 ............................................... 39<br />
LIST OF TABLES<br />
Table 1: Data collection ........................................................................................................... 12<br />
Table 2: A guide for supplementary feed<strong>in</strong>g <strong>of</strong> <strong>tilapia</strong> ............................................................ 12<br />
Table 3: Production data <strong>of</strong> <strong>tilapia</strong> cultured stoked density at five f<strong>in</strong>gerl<strong>in</strong>gs ....................... 14<br />
Table 4: Costs, gross revenue and net pr<strong>of</strong>it contributions from one pond <strong>tilapia</strong> production.<br />
................................................................................................................................................. 14<br />
Table 5: Investment costs ........................................................................................................ 17<br />
Table 6: Operat<strong>in</strong>g costs <strong>in</strong> one pond per cycle ...................................................................... 17<br />
Table 7: 10 years harvest<strong>in</strong>g plan ............................................................................................ 30<br />
Table 8: Net revenue for 10 years <strong>of</strong> operation ....................................................................... 31<br />
UNU-Fisheries Tra<strong>in</strong><strong>in</strong>g Programme 4
Salia<br />
1 INTRODUCTION<br />
The Republic <strong>of</strong> Mozambique is a tropical country located on the southeastern coast<br />
<strong>of</strong> Africa bordered by Tanzania to the north, South Africa and Swaziland to the south,<br />
Zimbabwe to the west, and Zambia and Malawi to the northwest. The total area <strong>of</strong> the<br />
country is about 801,600 km 2 . The average temperature ranges from 15.5 to 33.9 o C.<br />
There are two seasons; summer/dry season (October to March) and w<strong>in</strong>ter/wet/cold<br />
season (April to September). The annual average ra<strong>in</strong>fall is between 400 to 2000<br />
mm/year though the average maximum varies from 1,422 mm <strong>in</strong> the north to 762 mm<br />
<strong>in</strong> the south (MCEARM 2002).<br />
The total population is about 21,000,000 with an average population density <strong>of</strong> about<br />
27 people per km 2 ; most <strong>of</strong> the people (80% <strong>of</strong> the total population) live <strong>in</strong> the rural<br />
areas depend<strong>in</strong>g on the subsistence agriculture, livestock and fisheries (MCEARM<br />
2002). Mozambique has a coastl<strong>in</strong>e <strong>of</strong> about 2,700 km (Indian Ocean), 13,000 km 2 <strong>of</strong><br />
<strong>in</strong>land water which <strong>in</strong>cludes a large number <strong>of</strong> rivers, lakes, reservoirs, and streams.<br />
The potential fish<strong>in</strong>g is estimated at about 240,000 tonnes year -1 (Elsy et al. 2005).<br />
There are 258,000 ha <strong>of</strong> land suitable for <strong>aquaculture</strong>. However, fish culture is<br />
currently practised <strong>in</strong> only about 6,500 ponds with <strong>in</strong> average size <strong>of</strong> 400-500 m 2<br />
distributed across the country (Elsy et al. 2005). The Mozambique fish<strong>in</strong>g sector<br />
provides employment to 130,000 people and contributes 4% to the GDP and 8% to<br />
foreign exchange earn<strong>in</strong>gs. The per capita fish consumption is about 5.0 - 15 kg per<br />
year and is much higher <strong>in</strong> coastal communities. The fisheries are divided <strong>in</strong>to mar<strong>in</strong>e<br />
capture, <strong>in</strong>land capture and freshwater <strong>aquaculture</strong> sectors. The mar<strong>in</strong>e fisheries<br />
(artisanal and commercial) constitute 90% <strong>of</strong> total catch. The average annual catch is<br />
about 120,000 tonnes <strong>of</strong> which 80% comes from artisanal fisheries and is consumed<br />
with<strong>in</strong> Mozambique. On the other hand, the commercial fish<strong>in</strong>g sector provides the<br />
majority <strong>of</strong> export <strong>of</strong> fisheries products (FAO 2007). The ma<strong>in</strong> mar<strong>in</strong>e resources<br />
<strong>in</strong>clude crustaceans (prawns, deepwater shrimp, crayfish, lobsters and crabs), fish<br />
(demersal and pelagic species such as grouper, snapper, emperor and sea bream,<br />
yellow f<strong>in</strong> tuna and shark), and several other <strong>in</strong>vertebrate species (squid, octopus, sea<br />
cucumbers and bivalves). The total capture <strong>in</strong> 2002 was about 36 thousand tonnes, 44<br />
thousand tonnes <strong>in</strong> 2003, 45 thousand tonnes <strong>in</strong> 2004, 42 thousand tonnes <strong>in</strong> 2005 and<br />
43 thousand tonnes <strong>in</strong> 2006 (FAO 2007). The production values <strong>of</strong> commercial<br />
fisheries (<strong>in</strong>dustrial and semi-<strong>in</strong>dustrial) reported was about USD 97 thousand <strong>in</strong><br />
2004, USD 98 thousand <strong>in</strong> 2005, USD 92 thousand <strong>in</strong> 2006 and USD 79 thousand<br />
2007, show<strong>in</strong>g a clear reduction <strong>in</strong> the value fisheries products. In general, catches<br />
have decl<strong>in</strong>ed over the past three years due to an <strong>in</strong>crease <strong>in</strong> the price <strong>of</strong> fuel on the<br />
<strong>in</strong>ternational market, obsolete vessels, changes <strong>in</strong> the price <strong>of</strong> fisheries products <strong>in</strong> the<br />
<strong>in</strong>ternational market and reductions <strong>of</strong> the stock due to fish<strong>in</strong>g effort (Mozambique<br />
National M<strong>in</strong>istry <strong>of</strong> Fisheries <strong>of</strong> Mozambique 2008). Inland water <strong>in</strong>cludes Lake<br />
Niassa/Malawi Cahora Bassa Lake and many rivers and lagoons. The capture fishery<br />
is dom<strong>in</strong>ated by a <strong>small</strong> pelagic species locally known as kapenta, <strong>tilapia</strong> and carps.<br />
The total reported catch processed and marketed each year is about 10,000 tonnes, <strong>of</strong><br />
which 4,000 tonnes comes from artisanal and <strong>small</strong>-<strong>scale</strong> fisheries. The M<strong>in</strong>istry <strong>of</strong><br />
Fisheries <strong>of</strong> Mozambique (2008) reported total commercial catch was about 30<br />
thousand tonnes <strong>in</strong> 2004, 26 thousand tonnes <strong>in</strong> 2005, 28 thousand tonnes <strong>in</strong> 2006 and<br />
19 thousand tonnes <strong>in</strong> 2007. The reasons for the reductions <strong>in</strong> total catch are the same<br />
as for the mar<strong>in</strong>e fisheries above.<br />
UNU-Fisheries Tra<strong>in</strong><strong>in</strong>g Programme 5
Salia<br />
2 JUSTIFICATIONS<br />
Accord<strong>in</strong>g to Elsy et al. (2005), Mozambique is a country with good conditions for<br />
both mar<strong>in</strong>e and fresh water <strong>aquaculture</strong>. There are 258,000 ha suitable for <strong>in</strong>land<br />
<strong>aquaculture</strong> and 33,000 ha for mar<strong>in</strong>e <strong>aquaculture</strong>, currently less than 10% <strong>of</strong> this is<br />
exploited. Most fish farmers lack <strong>in</strong>formation on how to assess the pr<strong>of</strong>itability <strong>of</strong><br />
their farms. This has partly hampered <strong>aquaculture</strong> development <strong>in</strong> the country. This is<br />
lead<strong>in</strong>g to „potential‟ farmers not opt<strong>in</strong>g <strong>in</strong>to fish farm<strong>in</strong>g and even others becom<strong>in</strong>g<br />
„<strong>in</strong>active‟ because the pr<strong>of</strong>itability <strong>of</strong> <strong>aquaculture</strong> has not been demonstrated to them.<br />
Furthermore, the f<strong>in</strong>anc<strong>in</strong>g <strong>in</strong>stitutions and banks are not keen to give loans to farmers<br />
whose enterprise pr<strong>of</strong>itability has not been feasibly appraised.<br />
A <strong>small</strong>-<strong>scale</strong> <strong>aquaculture</strong> study from Tanzania published <strong>in</strong> 2006 on mixed <strong>tilapia</strong><br />
which was cultured with and without predator proved to be <strong>economic</strong>ally<br />
unsusta<strong>in</strong>able <strong>in</strong> the manner <strong>in</strong> which was developed (Kaliba et al. 2007). Greater<br />
pr<strong>of</strong>itability was suggested by a partial <strong>economic</strong>al <strong>analysis</strong> for Nile <strong>tilapia</strong> <strong>in</strong> Kenya,<br />
where that species was mixed with catfish, and a urea fertilizer was used weekly and<br />
fish were fed maize bran, (Gichuri et al. 2001) or rice bran (Liti et al. 2006).<br />
For those countries where such studies have been conducted and results demonstrated,<br />
the people are more <strong>in</strong>terested and the bank have <strong>in</strong>formation on the <strong>economic</strong>al<br />
feasibility <strong>of</strong> <strong>aquaculture</strong>. Mozambique is one <strong>of</strong> the countries where hunger, poverty,<br />
and unemployment are powerful issues <strong>in</strong> the government countries so proponents <strong>of</strong><br />
the development <strong>of</strong> this practice <strong>in</strong> Mozambique are optimistic. .<br />
Further studies on aquiculture viability <strong>in</strong> Mozambique are needed <strong>in</strong> order to<br />
improve the standard <strong>of</strong> liv<strong>in</strong>g for people <strong>in</strong> poor communities and to help farmers <strong>in</strong><br />
execut<strong>in</strong>g a successful trade. . It is expected that it will note take long to develop a<br />
knowledge base to help the <strong>small</strong>-<strong>scale</strong> fish farmers to understand better their<br />
bus<strong>in</strong>ess <strong>in</strong> order to make a significant pr<strong>of</strong>it. Therefore, the goal <strong>of</strong> this study is to<br />
analyse whether <strong>tilapia</strong> pond farm<strong>in</strong>g <strong>in</strong> Mozambique is pr<strong>of</strong>itable or not and to assess<br />
the risks <strong>in</strong>volved <strong>in</strong> this.<br />
2.1 Vision<br />
Generally, there has been a cont<strong>in</strong>ued reduction <strong>in</strong> the artisanal and <strong>in</strong>dustrial fish<strong>in</strong>g<br />
sectors <strong>in</strong> the last two years; and the government has def<strong>in</strong>ed a long-term development<br />
goal to <strong>in</strong>crease the production <strong>of</strong> aquatic products progressively. In order to manage<br />
and facilitate the development <strong>of</strong> the country‟s <strong>aquaculture</strong>, the Mozambique<br />
government has established the Institute <strong>of</strong> Aquaculture (INAQUA) <strong>in</strong> 2008 under<br />
the M<strong>in</strong>istry <strong>of</strong> Fishery.<br />
UNU-Fisheries Tra<strong>in</strong><strong>in</strong>g Programme 6
Salia<br />
3 LITERATURE REVIEW<br />
Aquaculture is def<strong>in</strong>ed by the FAO as “the farm<strong>in</strong>g <strong>of</strong> aquatic organisms, <strong>in</strong>clud<strong>in</strong>g<br />
fish, molluscs, crustaceans, and aquatic plants. Farm<strong>in</strong>g implies some form <strong>of</strong><br />
<strong>in</strong>tervention <strong>in</strong> the process to enhance production, such as regular stock<strong>in</strong>g, feed<strong>in</strong>g,<br />
protection from predators, etc. It also implies ownership <strong>of</strong> stock be<strong>in</strong>g cultivated”<br />
(Earth Trends 2003).<br />
Tilapia which belongs to the Cichlid family orig<strong>in</strong>ated from Africa where the<br />
temperature ranges from 14 to 33˚C (Philippart and Ruwet 1982). In nature, the<br />
maximum weight <strong>of</strong> <strong>tilapia</strong> published was about 4.3 kg (IGFA 2001) and the<br />
maximum length <strong>of</strong> 60 cm (Moreau et al. 1988) at the age <strong>of</strong> n<strong>in</strong>e years (Balon and<br />
Noakes 1982). The same characteristic <strong>of</strong> 60 cm as maximum size was reported by<br />
Eccles (1992). The unsexed fish <strong>in</strong> ponds reach about 24 cm <strong>in</strong> length (Trewavas<br />
1983). Sexual maturity is reached at 3-6 months depend<strong>in</strong>g on the temperature when<br />
the fish are at about 30 g and reproduction occurs only when the temperature is over<br />
20˚ C, (Trewavas 1983).<br />
Tilapia is well suited to fish farm<strong>in</strong>g because it grows quickly, is able to survive <strong>in</strong><br />
poor water conditions and eats a wide range <strong>of</strong> foods. The adult <strong>tilapia</strong> prefers<br />
vegetarian diets, vary<strong>in</strong>g from macrophytic to phytoplanktivorous. In ponds with<br />
supplementary feed<strong>in</strong>g, natural food contribute 30 to 50% <strong>of</strong> <strong>tilapia</strong> growth. Sexual<br />
maturity <strong>in</strong> <strong>tilapia</strong> depends on age, size and environmental conditions. The males<br />
grow faster than females. Nile <strong>tilapia</strong> with 75 to 500 g body weight can deposit 50 to<br />
2,000 eggs per spawn<strong>in</strong>g and can breed easily with no need for special hatchery<br />
technology (Chhorn et al. 2006).<br />
Various water quality parameters need to be monitored such as temperature,<br />
dissolved oxygen, acidity (pH) and sal<strong>in</strong>ity. The optimal water temperature for growth<br />
is between 29 and 31˚C and sal<strong>in</strong>ity should not exceed 15 ppt (Chhorn et al. 2006).<br />
For easy management, a pond size range from 500–2000 m 2 is recommended (Nandlal<br />
and Picker<strong>in</strong>g 2004).<br />
There are three commercial species <strong>of</strong> Oreochromis such as Nile <strong>tilapia</strong> (O. niloticus),<br />
Mozambique <strong>tilapia</strong> (O. mossambicus) and blue <strong>tilapia</strong> (O. aureus). O. niloticus has<br />
been reported as the best species for cultivation <strong>in</strong> ponds. S<strong>in</strong>ce O. niloticus reaches<br />
sexual maturity after three to five months <strong>of</strong> age, they typically weigh 150 to 200 g<br />
more than O. mossambicus . In ponds after eight months <strong>of</strong> culture, <strong>tilapia</strong> can weight<br />
500 g. Overpopulation can be controlled (by stock<strong>in</strong>g one catfish per two <strong>tilapia</strong>s).<br />
Do<strong>in</strong>g so causes the production homogeneous weight <strong>of</strong> <strong>in</strong>dividuals that can be sold<br />
at a uniform price, (M<strong>in</strong>istry <strong>of</strong> Agriculture, Animal Industry and Fisheries 2005).<br />
3.1 World <strong>aquaculture</strong><br />
The world population is <strong>in</strong>creas<strong>in</strong>g as is the demand for aquatic food products.<br />
Predictions <strong>in</strong>dicate that <strong>in</strong> the future, capture fisheries will, not be be able to meet<br />
the grow<strong>in</strong>g global demand for aquatic food. This is because most <strong>of</strong> the ma<strong>in</strong> fish<strong>in</strong>g<br />
areas have reached their maximum potential yield (FAO 2005).<br />
UNU-Fisheries Tra<strong>in</strong><strong>in</strong>g Programme 7
Salia<br />
Total world fisheries <strong>in</strong> 2000 were 130 million tonnes, <strong>of</strong> which <strong>aquaculture</strong><br />
contributed 36 million tonnes and the total global population was about 6 billion. In<br />
2005 world fisheries catches had reached 140 million tonnes, 48 million tonnes <strong>of</strong><br />
which were produced through <strong>aquaculture</strong>, and global population had climed to 6.5<br />
billion. Therefore, we can clearly see the reduction <strong>in</strong> catches (Figure 1) which means<br />
there is a likely reduction <strong>of</strong> fish<strong>in</strong>g stock and the human consumption is <strong>in</strong>creas<strong>in</strong>g<br />
(FAO 2007).<br />
Figure 1: World fisheries and <strong>aquaculture</strong> production and utilisation (Ichiro Nomura. 2007.<br />
3.2 Sub-Saharan Africa <strong>aquaculture</strong><br />
The sub-Saharan Africa region cont<strong>in</strong>ues to be a m<strong>in</strong>or player <strong>in</strong> <strong>aquaculture</strong> <strong>in</strong> the<br />
world, although the <strong>tilapia</strong> species most cultivated <strong>in</strong> the world orig<strong>in</strong>ate from Africa.<br />
Nigeria leads <strong>in</strong> the region, with reported production <strong>of</strong> 44 thousand tonnes <strong>of</strong> catfish,<br />
<strong>tilapia</strong> and other freshwater species. But there are many species <strong>of</strong> greater importance<br />
such as black tiger shrimp (Penaeus monodon) <strong>in</strong> Madagascar, Eucheuma seaweed <strong>in</strong><br />
the United Republic <strong>of</strong> Tanzania and abalone (Haliotis spp) <strong>in</strong> South Africa (FAO<br />
2006).<br />
Accord<strong>in</strong>g to FAO (2006), <strong>in</strong> 2004 the Asia Pacific contributed 21.92% <strong>of</strong> the global<br />
<strong>aquaculture</strong> production, Ch<strong>in</strong>a produced 69.57% and the other 8.51% from the rest<br />
<strong>of</strong> the world Sub-Saharan Africa contributes only about 0.16% <strong>of</strong> that last 8.51%. In<br />
terms <strong>of</strong> the money generated from global <strong>aquaculture</strong> Ch<strong>in</strong>a is lead<strong>in</strong>g with 51.20%<br />
followed by Asia and Pacific with 29.30% and f<strong>in</strong>ally other countries with about<br />
19.50% where sub-Saharan Africa contributes with 0.36%. (Figure 8)..<br />
The pr<strong>in</strong>cipal <strong>aquaculture</strong> export products from countries <strong>in</strong> Africa are mariculture<br />
products, ma<strong>in</strong>ly shrimp, abalone and seaweed. Shrimp are exported frozen<br />
(Madagascar and Mozambique), seaweeds are exported dry (United Republic <strong>of</strong><br />
Tanzania, Madagascar and Mozambique) and 80-85% <strong>of</strong> abalone produced <strong>in</strong> South<br />
Africa is exported live and the rema<strong>in</strong>der is canned (FAO 2006).<br />
The contribution <strong>of</strong> sub-Saharan Africa to the total fish production <strong>in</strong> 2004 was about<br />
6 million tonnes. Fish consumption is the lowest if compared to the rest <strong>of</strong> the world.<br />
In order to ma<strong>in</strong>ta<strong>in</strong> the current level <strong>of</strong> per capita supply <strong>in</strong> sub-Saharan Africa <strong>of</strong> 6.6<br />
kg per year until the year 2015, capture fisheries and <strong>aquaculture</strong> must <strong>in</strong>crease by<br />
28% over this period (FAO 2006).<br />
UNU-Fisheries Tra<strong>in</strong><strong>in</strong>g Programme 8
Salia<br />
The <strong>aquaculture</strong> <strong>in</strong>dustry has great potential to meet this <strong>in</strong>creas<strong>in</strong>g demand for<br />
aquatic food <strong>in</strong> most regions <strong>of</strong> the world. However, <strong>in</strong> order to achieve this, the<br />
sector (fisheries organisations, governments and farmers) may face significant<br />
challenges because:<br />
Economic and bio-technical constra<strong>in</strong>ts exist, and the transition from noncommercial<br />
to commercial fish farm<strong>in</strong>g is not common.<br />
F<strong>in</strong>gerl<strong>in</strong>g availability, quality and distribution rema<strong>in</strong> a serious constra<strong>in</strong>t to<br />
non-commercial and commercial <strong>aquaculture</strong> development <strong>in</strong> all countries<br />
however this also presents unique bus<strong>in</strong>ess opportunities.<br />
Feed availability, quality <strong>of</strong> seed, distribution <strong>of</strong> f<strong>in</strong>gerl<strong>in</strong>gs and acceptable<br />
food conversion ratios rema<strong>in</strong> major constra<strong>in</strong>ts to both non-commercial and<br />
commercial producers. Most non-commercial farmers use prote<strong>in</strong> limit<strong>in</strong>g<br />
diets, the use <strong>of</strong> farm made feeds is <strong>in</strong>creas<strong>in</strong>g slowly, while manufactured<br />
feeds are generally <strong>of</strong> a low quality. High quality extruded feeds are only<br />
manufactured <strong>in</strong> South Africa (Machena and Moehl 2001).<br />
3.3 Aquaculture <strong>in</strong> Mozambique<br />
Aquaculture activity <strong>in</strong> Mozambique like <strong>tilapia</strong> culture has existed s<strong>in</strong>ce 1950. In<br />
1960, as a way <strong>of</strong> ensur<strong>in</strong>g the susta<strong>in</strong>ability <strong>of</strong> this activity, three hatcheries were<br />
built by the government (FAO 2005) through the M<strong>in</strong>istry <strong>of</strong> Agriculture <strong>in</strong><br />
Umbeluzi-Maputo (0.05 ha), Sussundenga-Manica (2 ha) and Chowke-Gaza (1.6 ha).<br />
Two <strong>of</strong> them (Maputo and Manica) are still <strong>in</strong> operation but under private<br />
management (Elsy et al. 2005).<br />
The government, through the M<strong>in</strong>istry <strong>of</strong> Fisheries, has adopted a strategic plan to<br />
combat extreme poverty and hunger by develop<strong>in</strong>g <strong>aquaculture</strong> to reduce the<br />
dependence on fish from the capture fisheries. Develop<strong>in</strong>g <strong>aquaculture</strong> <strong>in</strong> that way the<br />
government will play an important role <strong>in</strong> the socio-<strong>economic</strong>s <strong>of</strong> development <strong>of</strong> the<br />
country through provision <strong>of</strong> cheap and affordable fish as a source <strong>of</strong> prote<strong>in</strong>,<br />
improv<strong>in</strong>g the population‟s diet, creat<strong>in</strong>g jobs, generat<strong>in</strong>g <strong>in</strong>come and promot<strong>in</strong>g<br />
regional development (Elsy et al. 2005).<br />
INAQUA <strong>in</strong>corporates the Actions Plan for the Reduction <strong>of</strong> Absolute Poverty <strong>in</strong><br />
Mozambique (PARPA II). The PARPA II <strong>in</strong>tends to reduce the poverty <strong>in</strong>dex from<br />
70% (1997) to below 45% <strong>in</strong> 2015. At present, the attention <strong>of</strong> the government <strong>in</strong><br />
relation to <strong>aquaculture</strong> is <strong>in</strong> <strong>in</strong>land waters. The program was def<strong>in</strong>ed by the plan <strong>of</strong><br />
food production approved <strong>in</strong> 2007 under the National Strategy for Green Revolution<br />
<strong>in</strong> Mozambique (Aquaculture Association <strong>of</strong> Southern Africa 2009).<br />
The activities <strong>of</strong> INAQUA are based on recommendations <strong>in</strong> the Mozambique Master<br />
Plan <strong>of</strong> the M<strong>in</strong>istry <strong>of</strong> Fisheries and <strong>in</strong> the general strategy <strong>of</strong> <strong>aquaculture</strong>. The<br />
Master Plan def<strong>in</strong>ed the ways how to set up <strong>in</strong>centives for <strong>in</strong>vestment <strong>in</strong> mar<strong>in</strong>e<br />
<strong>aquaculture</strong> enterprises, especially shrimp <strong>aquaculture</strong> and encourag<strong>in</strong>g develop<strong>in</strong>g<br />
fresh water fish farm<strong>in</strong>g <strong>in</strong> the <strong>in</strong>land areas <strong>of</strong> the country (Elsy et al. 2005).<br />
Although the <strong>aquaculture</strong> is not new, it is practiced mostly at subsistence level by<br />
7,000 <strong>small</strong>-<strong>scale</strong> fish farmers which are characterised by low capital <strong>in</strong>vestment<br />
UNU-Fisheries Tra<strong>in</strong><strong>in</strong>g Programme 9
Salia<br />
result<strong>in</strong>g <strong>in</strong>to low production. The ponds are <strong>small</strong> (150-300 m 2 ) <strong>in</strong> size and the<br />
average stock<strong>in</strong>g density used is about two f<strong>in</strong>gerl<strong>in</strong>gs m -2 , and the average production<br />
per year is about 20 kg per pond (Aquaculture Association <strong>of</strong> Southern Africa 2009).<br />
In order to be developed as a commercial bus<strong>in</strong>ess not only <strong>in</strong> Mozambique, but also<br />
<strong>in</strong> all <strong>of</strong> sub-Saharan Africa countries, <strong>aquaculture</strong> must overcome certa<strong>in</strong> constra<strong>in</strong>ts<br />
related with lack <strong>of</strong> availability <strong>of</strong> quality f<strong>in</strong>gerl<strong>in</strong>gs, access and availability to credit<br />
by <strong>small</strong>-<strong>scale</strong> farmers, limited capacity <strong>of</strong> market/market<strong>in</strong>g and process<strong>in</strong>g<br />
<strong>in</strong>frastructure (Elsy et al. 2005).<br />
The total catch <strong>of</strong> Mozambique <strong>in</strong> 2001 was about 30,000 metric tonnes and had<br />
rapidly <strong>in</strong>creased by 2004 when production was 45,000 metric tonnes. In 2005 the<br />
registered total was about 42,000 metric tonnes (FAO 2007). From 2005 to present,<br />
the catches have decl<strong>in</strong>ed each year because <strong>of</strong> ma<strong>in</strong> constra<strong>in</strong>ts (like petrol, taxes<br />
and ag<strong>in</strong>g <strong>of</strong> vessels). Production (quantity and value) from <strong>aquaculture</strong>, mariculture<br />
and <strong>in</strong>land fresh water is presented below (Figure 2). The production <strong>in</strong> 2004 decl<strong>in</strong>ed<br />
because <strong>of</strong> changes with<strong>in</strong> the European Union and <strong>in</strong> 2006 one <strong>of</strong> the shrimp<br />
companies abandoned their facility, (Mozambique National M<strong>in</strong>istry <strong>of</strong> Fisheries <strong>of</strong><br />
Mozambique 2008).<br />
Figure 2: Aquaculture production <strong>in</strong> Mozambique (from 2002-2007) (FAO, Fishery<br />
and Aquaculture Country Pr<strong>of</strong>ile 2006-2009)<br />
3.4 General <strong>economic</strong> <strong>analysis</strong><br />
Before start<strong>in</strong>g any activity all likely costs <strong>in</strong>volved <strong>in</strong> that activity should be taken<br />
<strong>in</strong>to account. In the case <strong>of</strong> <strong>aquaculture</strong> it is important that technical factors such as<br />
availability <strong>of</strong> water throughout the year, water quality, location <strong>of</strong> the company,<br />
availability <strong>of</strong> raw material (f<strong>in</strong>gerl<strong>in</strong>gs, feed, etc.) and size <strong>of</strong> likely market must be<br />
taken <strong>in</strong>to account as well as the cost and supply <strong>of</strong> labour and the sell<strong>in</strong>g price <strong>of</strong> the<br />
f<strong>in</strong>al product. Depend<strong>in</strong>g on the <strong>in</strong>terest rate applied <strong>in</strong> the country the person who is<br />
<strong>in</strong>terested can opt for a bank loan or not. Many people express <strong>in</strong>terest <strong>in</strong> fish farm<strong>in</strong>g,<br />
but before mak<strong>in</strong>g a decision they must <strong>in</strong>vestigate carefully the costs <strong>of</strong> and<br />
requirements for becom<strong>in</strong>g a successful farmer. Fish farm<strong>in</strong>g is not for everyone and<br />
is certa<strong>in</strong>ly not for the “weekend farmer”. Fish are liv<strong>in</strong>g animals that require daily<br />
attention and patience. Therefore, for successful management it is important to<br />
comb<strong>in</strong>e technical and f<strong>in</strong>ancial measures for <strong>aquaculture</strong> (Nandlal and Picker<strong>in</strong>g<br />
2004).<br />
UNU-Fisheries Tra<strong>in</strong><strong>in</strong>g Programme 10
Salia<br />
The purpose <strong>of</strong> bus<strong>in</strong>ess is to generate pr<strong>of</strong>its. An enterprise budget is used to see<br />
whether any bus<strong>in</strong>ess is pr<strong>of</strong>itable or not. If the total farm revenues from sales<br />
generated for the period are greater than the costs, it means pr<strong>of</strong>its are generated for<br />
that given period (Nandlal and Picker<strong>in</strong>g 2004).<br />
Another <strong>in</strong>dicator that is used is the <strong>in</strong>ternal rate <strong>of</strong> return (IRR) that shows the returns<br />
<strong>of</strong> the capital <strong>in</strong>vestment (cash or goods used to generate <strong>in</strong>come either by <strong>in</strong>vest<strong>in</strong>g <strong>in</strong><br />
a bus<strong>in</strong>ess or a different <strong>in</strong>come property) over the life <strong>of</strong> the <strong>in</strong>vestment. The returns<br />
measure the pr<strong>of</strong>itability <strong>of</strong> the <strong>in</strong>vestment capital (Engle and Neira 2005).<br />
The most fundamental types <strong>of</strong> f<strong>in</strong>ancial records and analyses that all fish farmers<br />
should ma<strong>in</strong>ta<strong>in</strong> <strong>in</strong>clude the follow<strong>in</strong>g: enterprise budget, balance sheet, <strong>in</strong>come<br />
statement. Cash flow budget which is used to measure the solvency and liquidity <strong>in</strong><br />
the bus<strong>in</strong>ess. Each <strong>of</strong> these tools provides a different perspective on the farm bus<strong>in</strong>ess.<br />
The enterprise budget gives an estimate <strong>of</strong> the overall pr<strong>of</strong>itability <strong>of</strong> the enterprise<br />
(Engle and Neira 2005).<br />
The balance sheet <strong>in</strong>dicates the capital position and solvency <strong>of</strong> the bus<strong>in</strong>ess and<br />
whether net worth, or the wealth <strong>of</strong> the farm owner, is <strong>in</strong>creas<strong>in</strong>g overtime. The<br />
<strong>in</strong>come statement shows annual pr<strong>of</strong>its or losses <strong>of</strong> the bus<strong>in</strong>ess, while the cash flow<br />
budget shows whether or not the farm will be able to make its payments when the<br />
payments are due (Engle and Neira 2005).<br />
UNU-Fisheries Tra<strong>in</strong><strong>in</strong>g Programme 11
Salia<br />
4 METHODOLOGIES<br />
In the present study, the data used was collected from <strong>small</strong>-<strong>scale</strong> <strong>in</strong>land water<br />
<strong>aquaculture</strong> <strong>in</strong> Mozambique and other <strong>in</strong>formation was estimated on the basis <strong>of</strong><br />
thorough literature review (Table 1 and Table 2).<br />
Table 1: Data collection<br />
All values <strong>in</strong> USD<br />
Item Mozambique Literature review My assumptions Reference<br />
Pond area 500 m 2 *<br />
Pond cost 355.56 *<br />
Month days 30 *<br />
Batch cycle length 8 months *<br />
Stock<strong>in</strong>g density 5 f<strong>in</strong>gerl<strong>in</strong>g/m 2 *<br />
Initial weight <strong>of</strong> <strong>tilapia</strong> stock<strong>in</strong>g 10-12 g *<br />
Cost <strong>of</strong> each <strong>tilapia</strong> f<strong>in</strong>gerl<strong>in</strong>g 0.26 *<br />
Survival rate at harvest 80-90% * Satya and Timothy 2004<br />
Harvest weigth 414 g * Li, S, 1998<br />
Tilapia sell<strong>in</strong>g price 3.6 *<br />
Cost <strong>of</strong> feed 0.24 *<br />
Limestone CaCO 3 2kg/10m 2 * Satya and Timothy 2004<br />
1000-2000kg/ha, 1-<br />
Quantity 315 kg *<br />
cost 0.6 *<br />
Urea 6 g /m 2 * Satya and Timothy 2004<br />
Quantity 235 kg *<br />
Cost 1.68 *<br />
Equity 1,419 *<br />
Loan 3,311 *<br />
Income taxes 12% *<br />
Interest on Loan 9% *<br />
Depreciation on equipment 10% *<br />
Depreciation ponds 4% *<br />
Depreciation <strong>of</strong> others 10% *<br />
Years for equipment and pond loans 10% *<br />
Table 2: A guide for supplementary feed<strong>in</strong>g <strong>of</strong> <strong>tilapia</strong><br />
A guide for supplementary feed<strong>in</strong>g <strong>of</strong> <strong>tilapia</strong> (Satya and Timothy 2004)<br />
Body Weight <strong>of</strong> fish (g) Number <strong>of</strong> fish per kilogram Feed<strong>in</strong>g rate No. Of feeds per day<br />
1.-.5 1000 - 200 10 -6% 4. -. 6<br />
5.-.25 200 - 40 5% 4<br />
25 - 155 40 - 7 4 - 3% 4<br />
150 - 250 7.- .4 3% 3 -. 4<br />
250 - 450 4. - .2 2 - 3% 2 -. 3<br />
4.1 Data <strong>analysis</strong><br />
Some <strong>of</strong> the data were collected from one <strong>of</strong> the <strong>small</strong>-<strong>scale</strong> fish farm companies <strong>in</strong><br />
Mozambique and the rest from literature review.. This data was used to calculate<br />
revenue from the one pond <strong>tilapia</strong> production. Pr<strong>of</strong>itability <strong>analysis</strong> <strong>of</strong> the operation <strong>of</strong><br />
one <strong>aquaculture</strong> pond over 10 years was carried out based on this data. For the present<br />
study one 500 m 2 pond was used as an example and the pr<strong>of</strong>itability was assessed<br />
based on stock<strong>in</strong>g with five f<strong>in</strong>gerl<strong>in</strong>gs m -2 . The cost <strong>in</strong>volved <strong>in</strong> fertilisation with<br />
urea and limestone to promote the primary production was estimated. Eight months<br />
UNU-Fisheries Tra<strong>in</strong><strong>in</strong>g Programme 12
Salia<br />
were considered as the batch cycle length and 90% was used as the survival rate. The<br />
market price for <strong>tilapia</strong> <strong>in</strong> Mozambique is 3.6 USD/kg (Table 3 and Table 4) and this<br />
price was used to calculate the value <strong>of</strong> the produced fish.<br />
The price <strong>of</strong> buy<strong>in</strong>g one kg <strong>of</strong> f<strong>in</strong>gerl<strong>in</strong>gs was estimated at about USD 1.32. The total<br />
cost <strong>of</strong> buy<strong>in</strong>g f<strong>in</strong>gerl<strong>in</strong>gs per cycle was USD 1,100. The cost <strong>of</strong> urea- fertiliser per kg<br />
was USD 1.7 and CaCO 3 per kg was USD 0.6. The total cost <strong>of</strong> fertilisers dur<strong>in</strong>g the<br />
cycle <strong>of</strong> eight months was USD 550. The harvest<strong>in</strong>g cost reported was about USD 8<br />
per person per day and five persons were hired for this purpose, (Table 4). The other<br />
data collected were grouped <strong>in</strong>to <strong>in</strong>vestment (build<strong>in</strong>g, equipment and other costs) and<br />
operation (variable and fixed) costs (Table 5 and Table 6).<br />
4.2 Production plann<strong>in</strong>g model<br />
4.2.1 One pond model<br />
A one pond production model was developed based on the data <strong>in</strong> Table 1 and some<br />
<strong>of</strong> the data from Table 5 and Table 6 such as harvest<strong>in</strong>g cost and labour. Initially,<br />
2,500 f<strong>in</strong>gerl<strong>in</strong>gs were used to achieve stock<strong>in</strong>g at a density <strong>of</strong> 5 f<strong>in</strong>gerl<strong>in</strong>gs m -2 . The<br />
pond was supposed to be fertilised with 20 kg <strong>of</strong> urea and 75 kg <strong>of</strong> limestone (CaCO 3 )<br />
monthly <strong>in</strong> order to promote the primary production <strong>in</strong> the pond. Mean body weights<br />
and percentages <strong>of</strong> mortality were determ<strong>in</strong>ed as <strong>in</strong> Table 3.<br />
In this study a survival rate was 90% for all a complete cycle was assumed. This was<br />
used to calculate the biomass <strong>in</strong> the pond by multiply<strong>in</strong>g the total number <strong>of</strong> fish <strong>in</strong><br />
the pond by the weight divided by 1000 g kg -1 . That biomass multiplied by the<br />
percentage <strong>of</strong> feed<strong>in</strong>g per month was used to determ<strong>in</strong>e the quantity <strong>of</strong> food needed<br />
per month (Table 3).<br />
Biomass (kg) =Number <strong>of</strong> fish × Mean body weight (g) × 10 -3<br />
Length (Cm) =Inf<strong>in</strong>itive length × [1- Exp (-K × Time)]<br />
Mean body weight (g) =a × Length b<br />
UNU-Fisheries Tra<strong>in</strong><strong>in</strong>g Programme 13
Salia<br />
Table 3: Production data <strong>of</strong> <strong>tilapia</strong> cultured stoked density at five f<strong>in</strong>gerl<strong>in</strong>gs<br />
Price <strong>of</strong> food<br />
<strong>in</strong>f<strong>in</strong>itive length 34.7 cise <strong>of</strong> pond <strong>in</strong> m^2 500 Price/f<strong>in</strong>gerl<strong>in</strong>gs 0.26 /kg 0.24<br />
Fertiliser cost<br />
K 0.27 Density/m2 5 cost/kg <strong>of</strong> f<strong>in</strong>gerl<strong>in</strong>gs 1.32 Urea/kg 1.7<br />
a 0.04 Initial Number 2500 Tocal cost <strong>of</strong> f<strong>in</strong>g 1,100<br />
Fertiliser cost<br />
CaCo3/kg 0.6<br />
Number <strong>of</strong><br />
feed<strong>in</strong>g/day 3<br />
b 2.7<br />
Time (month) Length (cm) Mean body<br />
weigth (gr)<br />
% <strong>of</strong><br />
mortality/month<br />
Number <strong>of</strong> fish Biomass (kg) % <strong>of</strong> feed<strong>in</strong>g/month Kg <strong>of</strong><br />
food<br />
cost <strong>of</strong><br />
feed<strong>in</strong>g/kg/Cy<br />
cle<br />
Kg <strong>of</strong><br />
fertilizer/<br />
month<br />
urea<br />
cost <strong>of</strong><br />
fertilizer/Cycle<br />
CaCO3,<br />
Price/Kg<br />
CaCO3<br />
cost <strong>of</strong><br />
fertilizer/Cycle<br />
0 0 0 2,500<br />
1 8 12 2,500 29 7% 6 1 20 34 75 45<br />
2 14 54 10% 2,250 123 6% 22 5 20 34 75 45<br />
3 19 118 4% 2,160 254 5% 38 9 20 34 75 45<br />
4 23 188 3% 2,095 394 4% 47 11 20 34 75 45<br />
5 26 256 1% 2,074 532 3% 48 11 20 34 75 45<br />
6 28 318 1% 2,054 653 2% 39 9 20 34 75 45<br />
7 29 371 1% 2,033 753 1.5% 34 8 20 34 75 45<br />
8 31 414 2,013 834 1.5% 38 9<br />
272 65 140 235 525 315<br />
The net revenue from this pond was obta<strong>in</strong>ed by subtract<strong>in</strong>g the cost <strong>of</strong> production<br />
dur<strong>in</strong>g the cycle (purchase <strong>of</strong> f<strong>in</strong>gerl<strong>in</strong>gs, fertilizer and food) by total sales. Thus it<br />
was possible to determ<strong>in</strong>e the net revenue <strong>of</strong> produc<strong>in</strong>g 1 kg <strong>of</strong> fish by subtract<strong>in</strong>g the<br />
total costs from the gross revenue (Table 4).<br />
Table 4: Costs, gross revenue and net pr<strong>of</strong>it contributions from one pond <strong>tilapia</strong><br />
production.<br />
Quantity <strong>of</strong> sales <strong>in</strong> kg 834<br />
Price/kg (USD) 3.6<br />
Gross revenue 3,001<br />
Cost <strong>of</strong> f<strong>in</strong>gerl<strong>in</strong>gs/Cycle 650<br />
Cost <strong>of</strong> feed<strong>in</strong>g/Cycle 65<br />
Urea Cost <strong>of</strong> fertilizer/Cycle 235<br />
CaCo3 Cost <strong>of</strong> fertilizer/Cycle 315<br />
Harvest<strong>in</strong>g cost 40<br />
Labour 460<br />
Total Costs/Cycle 951<br />
Net Revenue/Cylce 2,051<br />
Net Revenue/kg 2.46<br />
UNU-Fisheries Tra<strong>in</strong><strong>in</strong>g Programme 14
Salia<br />
5 PLANNING FARM OPERATION<br />
5.1 Pr<strong>of</strong>itability model<br />
The pr<strong>of</strong>itability model <strong>analysis</strong> based on excel calculations is def<strong>in</strong>ed as a simulation<br />
model <strong>of</strong> an <strong>in</strong>itial <strong>in</strong>vestment and subsequent operations. It was developed by Pall<br />
Jensson, pr<strong>of</strong>essor <strong>of</strong> eng<strong>in</strong>eer<strong>in</strong>g at the University <strong>of</strong> Iceland and has been used by<br />
several countries <strong>in</strong> Iceland as well as other countries. The model is based on given<br />
assumptions which are determ<strong>in</strong>istic, however random variables reflect<strong>in</strong>g uncerta<strong>in</strong><br />
factors can easily be added. Time unit is one year.<br />
In the present case study, 10 years were used as the plann<strong>in</strong>g horizon for the bus<strong>in</strong>ess.<br />
The pr<strong>of</strong>itability model was developed based on the results <strong>of</strong> the 500 m 2 pond<br />
production model. The pr<strong>of</strong>itability model has the follow<strong>in</strong>g components (see<br />
Appendix 1 to Appendix 7).<br />
a) Assumptions: In the first component <strong>of</strong> the model most <strong>of</strong> the calculations are<br />
done such as cost <strong>of</strong> buy<strong>in</strong>g f<strong>in</strong>gerl<strong>in</strong>gs, cost <strong>of</strong> fertilizers, calculation <strong>of</strong><br />
biomass <strong>in</strong> the pond, mean body weight, number <strong>of</strong> fish at the end <strong>of</strong><br />
production (Appendix 1). The 10 years production plan was presented here<br />
show<strong>in</strong>g the stock<strong>in</strong>g, harvest<strong>in</strong>g and clean<strong>in</strong>g period, as well as net revenue,<br />
(Table 7 and Table 8).<br />
b) Breakdown: In this component the <strong>in</strong>vestment and operation costs are detailed<br />
such as cost <strong>of</strong> equipment, <strong>in</strong>frastructure, buy<strong>in</strong>g f<strong>in</strong>gerl<strong>in</strong>gs, food, salary and<br />
other costs (Table 5 and Table 6).<br />
c) Summary: The summary component shows the <strong>in</strong>puts, i.e. the ma<strong>in</strong><br />
assumptions. Here, a total f<strong>in</strong>anc<strong>in</strong>g 4,729 USD is needed for <strong>in</strong>vestment. This<br />
is assumed to be 30% by equity and 70% by a bank loan at a real <strong>in</strong>terest rate<br />
<strong>of</strong> 9% (<strong>in</strong>flation is omitted).. The assumptions about creditors tax is also<br />
<strong>in</strong>dicated (Appendix 1).<br />
d) Investment: The <strong>in</strong>vestment component shows how loan payments will be<br />
covered. It also shows booked value and depreciation <strong>of</strong> build<strong>in</strong>gs, equipment<br />
and other <strong>in</strong>vestments dur<strong>in</strong>g the plann<strong>in</strong>g horizon <strong>of</strong> 10 years (Appendix 2).<br />
e) Operations: The operations component shows the revenue or loss from the<br />
operation over 10 years. The sales price per kg and the annual quantity <strong>of</strong> sales<br />
<strong>in</strong> kg are used here to calculate the gross revenue (sales multiplied by price).<br />
Variable cost factors are subtracted from the revenue, fixed costs,<br />
depreciation, f<strong>in</strong>ancial costs, taxes and dividend to calculate the net pr<strong>of</strong>it or<br />
loss (Appendix 3).<br />
f) Cash flow: The cash flow component shows the movement <strong>of</strong> cash <strong>in</strong>to<br />
(<strong>in</strong>flows) and out <strong>of</strong> (outflows) the bus<strong>in</strong>ess. The outflow <strong>of</strong> cash <strong>in</strong>cludes<br />
paid dividend, taxes, f<strong>in</strong>ancial costs and repayment <strong>of</strong> loans. The <strong>in</strong>flow<br />
<strong>in</strong>cludes the cash that the company will receive from customers, lenders and<br />
<strong>in</strong>vestors, Appendix 4.<br />
UNU-Fisheries Tra<strong>in</strong><strong>in</strong>g Programme 15
Salia<br />
g) Balance sheet: The balance sheet component shows the f<strong>in</strong>ancial status at the<br />
end <strong>of</strong> each year, what the assets are, what the liabilities are and the net worth.<br />
The “bottom l<strong>in</strong>e” <strong>of</strong> a balance sheet shows the total liabilities (company<br />
obligations) subtracted from the assets. This must always balance each other,<br />
that is assets have to be equal to summation <strong>of</strong> liabilities (Appendix 6).<br />
h) Pr<strong>of</strong>itability: This component shows f<strong>in</strong>ancial <strong>in</strong>dicators (Appendix 7) that<br />
measure the pr<strong>of</strong>itability <strong>of</strong> the project. The most important are the net present<br />
value (NPV) and the <strong>in</strong>ternal rate <strong>of</strong> return (IRR). The NPV can be calculated<br />
by us<strong>in</strong>g the formula below where:<br />
CF t = Cash flow <strong>in</strong> year t and<br />
i = Discount<strong>in</strong>g factor<br />
The IRR is a (discount<strong>in</strong>g factor) that br<strong>in</strong>gs the NPV to zero. In other words, IRR is<br />
the highest <strong>in</strong>terest rate that the project can support (see Appendix 7). The m<strong>in</strong>imum<br />
attractive rate <strong>of</strong> return or MARR is the <strong>in</strong>terest rate that represents the m<strong>in</strong>imum<br />
pr<strong>of</strong>it that an <strong>in</strong>vestor wants to ga<strong>in</strong> when an <strong>in</strong>vestment is done. IRR should be<br />
greater than MARR for an <strong>in</strong>vestment to be <strong>economic</strong>ally feasible (Appendix 1).<br />
Sensitivity Analysis: The bus<strong>in</strong>ess impact <strong>analysis</strong> is an essential component <strong>of</strong> an<br />
organisation‟s bus<strong>in</strong>ess cont<strong>in</strong>uance; it <strong>in</strong>cludes an exploratory component to reveal<br />
any vulnerability and a plann<strong>in</strong>g component to develop strategies for m<strong>in</strong>imis<strong>in</strong>g risk.<br />
5.2 Investment costs<br />
In the present case study the build<strong>in</strong>g costs were divided <strong>in</strong>to pond construction,<br />
fenc<strong>in</strong>g and house construct<strong>in</strong>g. The total value <strong>of</strong> build<strong>in</strong>gs <strong>in</strong> the present case study,<br />
<strong>in</strong>clud<strong>in</strong>g cont<strong>in</strong>gency, was assumed to be about USD 2,200. Regard<strong>in</strong>g equipment<br />
needed <strong>in</strong> the operation such as a pump, vehicle, conta<strong>in</strong>ers, refrigerator, <strong>scale</strong>s and<br />
others, the total value was calculated as 2,178 USD. The value for other <strong>in</strong>vestment<br />
costs assumed was about USD 154. The total <strong>in</strong>vestment <strong>in</strong> the farm was about USD<br />
4,529 (Table 5).<br />
UNU-Fisheries Tra<strong>in</strong><strong>in</strong>g Programme 16
Salia<br />
Table 5: Investment costs<br />
Equipment Quantity Total Cost<br />
Investment Costs:<br />
Pump 1 800<br />
Build<strong>in</strong>gs:<br />
Total<br />
Nets 1 12 Pond 1 356<br />
Rent Vehicle 360 Fence 160<br />
Conta<strong>in</strong>ers 5 60 House 1 1,600<br />
Refrigerator 1 240 Sub total 2,116<br />
PVC Pipes 24 Cont<strong>in</strong>gency 4% 85<br />
Wheel Barrow 2 160 Total 2,200 USD<br />
Hoes 4 28<br />
Cutlass 2 6 Other Investment<br />
Scales 1 120 other costs Total Cost<br />
Test Kit PH 2 48 License 150.00<br />
Termometer 2 180 Sb total 150.00<br />
Shovels 2 56 Contngency 1% 1.50<br />
Sub total 2,094 Total 152 USD<br />
Contngency 4% 84<br />
Total 2,178 USD Total <strong>in</strong>vestment 4,529<br />
USD<br />
5.3 Operat<strong>in</strong>g costs<br />
Yearly operat<strong>in</strong>g costs are composed <strong>of</strong> variable and fixed costs. Variable costs are<br />
cost factors that are likely to change over the operation period. The variable cost<br />
factors <strong>in</strong> the present case <strong>in</strong>clude acquisition <strong>of</strong> f<strong>in</strong>gerl<strong>in</strong>gs, feed, fertilizers and<br />
harvest<strong>in</strong>g costs (Table 6). For example, the price <strong>of</strong> fertilizer and harvest<strong>in</strong>g costs can<br />
easily fluctuate with<strong>in</strong> a short period <strong>of</strong> time. The fixed costs considered <strong>in</strong>clude the<br />
payment <strong>of</strong> salary, because employees are permanent <strong>in</strong> the farm.<br />
Table 6: Operat<strong>in</strong>g costs <strong>in</strong> one pond per cycle<br />
Variable cost Total Cost / kg Fixed Cost Total Cost/Year<br />
F<strong>in</strong>gerl<strong>in</strong>gs 1.32 Employees 2 400<br />
Feed<strong>in</strong>g 0.08 Security 1 60<br />
Fertilizers(urea) 0.28 Sub total 460<br />
CaCo3 0.38 Cont<strong>in</strong>gency 3% 14<br />
Harvest<strong>in</strong>g cost 5 0.05 Total 474 USD<br />
Sub total<br />
2.11<br />
Cont<strong>in</strong>gency 4% 0.08<br />
Total<br />
2.19 USD/kg<br />
Operation Costs:<br />
5.3.1 Expected returns<br />
The returns on <strong>in</strong>vestment (gross revenue) is found by multiply<strong>in</strong>g total sales by the<br />
price per kg/tonne/unit accord<strong>in</strong>g to which unit is used m<strong>in</strong>us all costs <strong>in</strong>volved <strong>in</strong> the<br />
production. To get net pr<strong>of</strong>it or net revenue from the gross revenue all cost factors<br />
such as (taxes, variable and fixed costs, depreciation, cost <strong>of</strong> sales, etc.) are subtracted<br />
from the gross revenue.<br />
UNU-Fisheries Tra<strong>in</strong><strong>in</strong>g Programme 17
Salia<br />
The expected return is used to measure the health <strong>of</strong> a company or a bus<strong>in</strong>ess. The<br />
forecast <strong>of</strong> pr<strong>of</strong>it is the most important measurement used by possible <strong>in</strong>vestors to<br />
assess the viability <strong>of</strong> the enterprise. Pr<strong>of</strong>it also allows for bus<strong>in</strong>ess expansion. Pr<strong>of</strong>it<br />
is the first concern <strong>of</strong> an <strong>in</strong>vestor and bus<strong>in</strong>esses without proper pr<strong>of</strong>itability <strong>analysis</strong><br />
may lead to disappo<strong>in</strong>tments if returns on the <strong>in</strong>vestment turn out to be low or<br />
negative. The net pr<strong>of</strong>it <strong>in</strong> the present case study was calculated <strong>in</strong> the operation sheet<br />
(Appendix 3).<br />
6 RESULTS<br />
6.1 The net and total cash flow<br />
The results show that dur<strong>in</strong>g the first year <strong>of</strong> the present case study, the net and total<br />
cash flow are negative. This is expla<strong>in</strong>ed mostly by the <strong>in</strong>itial <strong>in</strong>vestment. However,<br />
<strong>in</strong> the follow<strong>in</strong>g years the net and total cash flow are both positive, but variable over<br />
the plann<strong>in</strong>g horizon (Figure 3).<br />
Figure 3: Net- and total cash flow <strong>of</strong> the company dur<strong>in</strong>g 10 years <strong>of</strong> operation.<br />
6.2 Accumulated net present value (NPV)<br />
The NPV is the most common measure for evaluat<strong>in</strong>g the pr<strong>of</strong>itability <strong>of</strong> an<br />
<strong>in</strong>vestment or project. It <strong>in</strong>dicates how much value an <strong>in</strong>vestment adds to the<br />
company. It is the difference between the sum <strong>of</strong> the discounted cash flow over the<br />
years, i.e. the net revenue expected from the <strong>in</strong>vestment and the amount which is<br />
<strong>in</strong>itially <strong>in</strong>vested.<br />
The discount<strong>in</strong>g rate or MARR used <strong>in</strong> this study is 15%. Us<strong>in</strong>g this rate, the NPV at<br />
the end <strong>of</strong> 10 years <strong>of</strong> bus<strong>in</strong>ess operation was found to be USD 891 for the total<br />
capital <strong>in</strong>vested and USD 1,645 for the equity. As can be seen <strong>in</strong> Figure 4, the<br />
payback period <strong>in</strong> the present case study is eight years for the total capital <strong>in</strong>vested<br />
and only three years for the equity. This means that it is to be expected that recovery<br />
<strong>of</strong> the <strong>in</strong>itial <strong>in</strong>vestment will take eight years (Figure 4).<br />
UNU-Fisheries Tra<strong>in</strong><strong>in</strong>g Programme 18
USD<br />
2010<br />
2011<br />
2012<br />
2013<br />
2014<br />
2015<br />
2016<br />
2017<br />
2018<br />
2019<br />
2020<br />
Salia<br />
2,000<br />
Acumulated NPV<br />
1,000<br />
0<br />
-1,000<br />
-2,000<br />
-3,000<br />
-4,000<br />
NPV Total Cash Flow<br />
NPV Net Cash Flow<br />
-5,000<br />
-6,000<br />
Years<br />
Figure 4: NPV and payback period <strong>of</strong> the 500 m 2 <strong>tilapia</strong> farm model.<br />
6.3 Internal rate <strong>of</strong> return (IRR)<br />
On Figure 5 we see that the IRR is 20% for the total capital and 46% for the equity.<br />
Already after five years <strong>of</strong> operations, the IRR <strong>of</strong> total cash flow is 10% and the IRR<br />
<strong>of</strong> equity is almost 40%.<br />
Figure 5: IRR <strong>of</strong> a <strong>tilapia</strong> farm.<br />
6.4 Debt service coverage ratio<br />
The debt service coverage ratio is a quantitative method used to determ<strong>in</strong>e if a project<br />
is able to pay its f<strong>in</strong>anc<strong>in</strong>g by means <strong>of</strong> cash flows generated. It is the relationship<br />
between the cash flow generated by the project divided by debt service (<strong>in</strong>terest +<br />
amortisation <strong>of</strong> pr<strong>in</strong>cipal). The debt service coverage ratio <strong>in</strong> the present case shows<br />
that the project can pay its f<strong>in</strong>anc<strong>in</strong>g cost (Figure 6).<br />
UNU-Fisheries Tra<strong>in</strong><strong>in</strong>g Programme 19
Salia<br />
6.5 The net current ratio<br />
The net current ratio shows the ability <strong>of</strong> current assets to pay the current liabilities.<br />
Figure 6 illustrates that the assets are enough to pay the liabilities <strong>in</strong> the present case<br />
study. In general a current ratio <strong>of</strong> 1.5 to 2 is adequate.<br />
Figure 6: F<strong>in</strong>ancial ratios <strong>of</strong> 500m 2 <strong>tilapia</strong> production model.<br />
6.6 Sensitivity <strong>analysis</strong><br />
An impact <strong>analysis</strong> was used <strong>in</strong> the present case study to analyse the risk <strong>of</strong><br />
develop<strong>in</strong>g <strong>aquaculture</strong> as a bus<strong>in</strong>ess <strong>in</strong> Mozambique. The impact <strong>analysis</strong> on IRR <strong>of</strong><br />
equity is shown <strong>in</strong> Figure 7. It appears that the pr<strong>of</strong>itability <strong>of</strong> the <strong>tilapia</strong> production is<br />
most sensitive to variations <strong>in</strong> the sales price. When the value <strong>of</strong> the sales price falls<br />
by 15% or more, a negative IRR <strong>of</strong> cash flow is observed.<br />
Figure 7: Impact <strong>analysis</strong> <strong>of</strong> sales price, production and cost <strong>of</strong> equipment <strong>of</strong> the<br />
<strong>tilapia</strong> production model.<br />
UNU-Fisheries Tra<strong>in</strong><strong>in</strong>g Programme 20
Salia<br />
7 DISCUSSION<br />
Mozambique is fac<strong>in</strong>g the problem <strong>of</strong> hunger, unemployment and absolute poverty.<br />
The catches are far from cover<strong>in</strong>g the needs <strong>of</strong> the population <strong>in</strong> terms <strong>of</strong> fish<br />
consumption. As a way to solve these problems, the government def<strong>in</strong>ed a long-term<br />
development goal to <strong>in</strong>crease the production <strong>of</strong> aquatic products progressively and at<br />
the same time to reduce poverty, hunger and unemployment by us<strong>in</strong>g <strong>aquaculture</strong><br />
because the area suitable for <strong>in</strong>land <strong>aquaculture</strong> is currently underexploited.<br />
The goal <strong>of</strong> this study was to analyse whether <strong>tilapia</strong> pond farm<strong>in</strong>g <strong>in</strong> Mozambique is<br />
pr<strong>of</strong>itable or not and assess the risks <strong>in</strong>volved, ma<strong>in</strong>ly because similar studies have<br />
never been demonstrated to the farmers.<br />
The study showed that if one 500 m 2 pond is used to culture <strong>tilapia</strong>, then it can<br />
produce 834 kg <strong>of</strong> fish <strong>in</strong> one cycle <strong>of</strong> eight months (Table 4), and if two cycles are<br />
considered per year this number doubles to 1,668 kg year -1 . The newsletter published<br />
by the Aquaculture Association <strong>of</strong> Southern Africa (2009) reported productivity <strong>of</strong> 20<br />
kg <strong>of</strong> fish per year for an average <strong>small</strong>-<strong>scale</strong> fish farmer <strong>in</strong> Mozambique. There are a<br />
few po<strong>in</strong>ts that need to be considered based on our f<strong>in</strong>d<strong>in</strong>gs:<br />
a) The very positive results found <strong>in</strong> the present case study may be related to an<br />
overestimation <strong>of</strong> the data used such as the mortality rate dur<strong>in</strong>g the production<br />
cycle.<br />
b) The low productivity reported by the Aquaculture Association <strong>of</strong> Southern<br />
Africa (2009), may be due to impractical management <strong>of</strong> the farms.<br />
c) The results obta<strong>in</strong>ed <strong>in</strong> this case on one pond production should not be<br />
compared with the average or the lowest production per pond usually reported,<br />
but should rather be compared with farms where the same pond size was used<br />
and with appropriate management.<br />
The total <strong>in</strong>vestment was estimated to be around USD 4,529 plus a work<strong>in</strong>g capital<br />
requirement <strong>of</strong> about USD 200. This means that the farmer will need approximately<br />
USD 5,000 to start the bus<strong>in</strong>ess. Due to the weak f<strong>in</strong>ancial capacity <strong>of</strong> the people<br />
likely to want develop <strong>aquaculture</strong>, bank loans will be needed.<br />
The impact <strong>analysis</strong> showed that the pr<strong>of</strong>itability <strong>of</strong> the <strong>tilapia</strong> production is most<br />
sensitive to variations <strong>in</strong> the sales price. When the value <strong>of</strong> the sales price falls by<br />
15% or more, a negative IRR <strong>of</strong> cash flow is observed. Thus an <strong>in</strong>vestment like this is<br />
subject to some risk related to market conditions.<br />
UNU-Fisheries Tra<strong>in</strong><strong>in</strong>g Programme 21
Salia<br />
8 CONCLUSION<br />
The results found from the pr<strong>of</strong>itability model <strong>in</strong> this study showed positive net<br />
revenue, NPV and IRR. The impact <strong>analysis</strong> showed that, <strong>aquaculture</strong> <strong>in</strong>vestment is<br />
rather sensitive to market conditions.<br />
Accord<strong>in</strong>g to these results and based on the ma<strong>in</strong> assumption <strong>of</strong> one 500 m 2 pond,<br />
<strong>small</strong>-<strong>scale</strong> <strong>tilapia</strong> farm <strong>in</strong> Mozambique can be very pr<strong>of</strong>itable s<strong>in</strong>ce one pond <strong>of</strong> this<br />
size can produce at least 834 kg per year (Table 4) and even more with two harvests<br />
some years. It is clear that if the production is <strong>in</strong>deed as low as reported by the<br />
Aquaculture Association <strong>of</strong> South Africa (2009), then the f<strong>in</strong>d<strong>in</strong>gs <strong>of</strong> the present study<br />
are <strong>in</strong> remarkable contrast with this. The current study <strong>in</strong>cludes some uncerta<strong>in</strong><br />
assumptions and , these results should be tested <strong>in</strong> at least one farm based on realistic<br />
data to obta<strong>in</strong> more reliable results.<br />
Several po<strong>in</strong>ts and recommendations can be drawn from our study:<br />
Better data records have to be collected from farms <strong>in</strong> order to allow better<br />
<strong>analysis</strong>.<br />
The farmers should use larger ponds. The most common pond size currently<br />
used 150 or 300m 2 may need to be almost 634 m 2 as reported by Kaliba et al.<br />
(2007).<br />
Careful consideration <strong>of</strong> constra<strong>in</strong>ts such as availability <strong>of</strong> quality f<strong>in</strong>gerl<strong>in</strong>gs<br />
and feed manufactur<strong>in</strong>g is necessary dur<strong>in</strong>g plann<strong>in</strong>g and ma<strong>in</strong>ta<strong>in</strong>ed<br />
throughout operation.<br />
Accord<strong>in</strong>g to this study, it is a challenge <strong>of</strong> great importance <strong>in</strong> the short term for the<br />
Mozambique government, and especially for the National Institute <strong>of</strong> Aquaculture<br />
Development, to provide conditions conductive to the implementation <strong>of</strong> one po<strong>in</strong>t<br />
<strong>tilapia</strong> farm<strong>in</strong>g. This would give more precise results, and thus verify the results<br />
presented here. The next step would be to design strategies for the development <strong>of</strong> the<br />
sector as well as <strong>in</strong>troduc<strong>in</strong>g the results to <strong>in</strong>fluence the lend<strong>in</strong>g <strong>in</strong>stitutions to become<br />
more <strong>in</strong>terested <strong>in</strong> <strong>in</strong>vest<strong>in</strong>g <strong>in</strong> <strong>aquaculture</strong>.<br />
UNU-Fisheries Tra<strong>in</strong><strong>in</strong>g Programme 22
Salia<br />
ACKNOWLEDGEMENTS<br />
I would like to express my gratitude to all the people who were <strong>in</strong>volved and made the<br />
culm<strong>in</strong>ation <strong>of</strong> this project possible.<br />
I would also like to thank all lecturers from the University <strong>of</strong> Akureyri <strong>in</strong>volved <strong>in</strong> the<br />
company managegment course and the UNU/FTP staff for their expertise and efforts<br />
<strong>in</strong> improv<strong>in</strong>g my pr<strong>of</strong>essional skills, through valuable suggestions and discussions,<br />
which have been decisive <strong>in</strong> the completion <strong>of</strong> this project.<br />
I would also like to thank Ms Isabel Omar my director at the National Institute <strong>of</strong><br />
Development <strong>of</strong> Aquaculture and Mr. Gudni Eiriksson, Programme Manager <strong>of</strong><br />
UNU-Fisheries Tra<strong>in</strong><strong>in</strong>g Programme, for giv<strong>in</strong>g me this wonderful opportunity.<br />
Special thanks and appreciation to my supervisor, Pall Jensson, for his excellent<br />
guidance and comments and support rendered to me at all stages <strong>of</strong> the project.<br />
I thank Evans and Pedro Junior, my sons; Pedro Silva, my husband for their love and<br />
patience dur<strong>in</strong>g the six months.<br />
Thanks to the fellows <strong>of</strong> 2008 for their friendship, company, and good times.<br />
UNU-Fisheries Tra<strong>in</strong><strong>in</strong>g Programme 23
Salia<br />
LIST OF REFERENCES<br />
Aquaculture Association <strong>of</strong> Southern Africa. 2009. Newsletter <strong>of</strong> Aquaculture<br />
Association <strong>of</strong> South Africa & Aquaculture Institute <strong>of</strong> South Africa. Volume 5:1<br />
http://www.aasa-aqua.co.za/ and http://www.ai-sa.org.za/<br />
Balon, E. K. and Noakes, D.G. L. 1982. Life histories <strong>of</strong> <strong>tilapia</strong>s: an evolutionary<br />
perspective. p. 61-82. In R.S.V. Pull<strong>in</strong> and R.H. Lowe-McConnell (eds.) the biology<br />
and culture <strong>of</strong> <strong>tilapia</strong>s ICLARM Conf. Proc. 7<br />
http://www.worldfishcenter.org/lib<strong>in</strong>fo/Pdf/Pub%20CP6%207.pdf<br />
Chhorn, E L. and Carl, D Webster. 2006. Tilapia, Biology, Culture, and Nutrition p.<br />
2-30.<br />
Eccles D. H. 1992 FAO species identification sheets for fishery purposes. Field guide<br />
to the fresh water fishes <strong>of</strong> Tanzania. Prepared and published with the support <strong>of</strong> the<br />
United Nations Development Programme (project URT/87/016). FAO, Rome. 145<br />
p.e.<br />
Elsy R., Jamu. D. M., Modadugu. V. G., Omar. M.I.V., Paton. J. G., Ribeiro. F. L.<br />
2005. Proposed Policies for Development <strong>of</strong> Aquaculture <strong>in</strong> Mozambique.<br />
Commonwealth Secretariat and Government <strong>of</strong> Mozambique.<br />
Engle, C.R and Neira, I. 2005. Tilapia Farm Bus<strong>in</strong>ess Management and Economics: A<br />
Tra<strong>in</strong><strong>in</strong>g Manual.<br />
FAO 2005. Ma<strong>in</strong>stream<strong>in</strong>g fisheries <strong>in</strong>to national development and poverty reduction<br />
strategies: current situation and opportunities, by A. Thorpe. FAO<br />
FAO 2006. State <strong>of</strong> world <strong>aquaculture</strong> 2006, by R. Subas<strong>in</strong>ghe. FAO<br />
FisheriesTechnical Paper No. 500. Rome.<br />
FAO. 2006-2009. National Aquaculture Sector Overview. Mozambique. Text by<br />
Omar, I. In: FAO Fisheries and Aquaculture Department [onl<strong>in</strong>e]. Rome. [Cited 6<br />
March 2009].<br />
<br />
Earthtrends 2003. Capture and Aquaculture Production Totals for Mar<strong>in</strong>e and Inland<br />
Fisheries. http://earthtrends.wri.org/pdf_library/data_tables/coa2_2003.pdf. Technical<br />
Notes. 2003.<br />
Gichuri, W. M, Omondi, J. G. and Viverica, K. 2001. A partial <strong>economic</strong> <strong>analysis</strong> for<br />
Nile <strong>tilapia</strong> Orechromis niloticus L. And sharptoothet catfish Clarias gariep<strong>in</strong>us<br />
(Burchel 1822) polyculture <strong>in</strong> central Kenya.<br />
Ichiro Nomura. 2007. State <strong>of</strong> World Aquaculture, Fisheries Technical Paper N O 500.<br />
Rome, FAO.134p.<br />
The State <strong>of</strong> World Fisheries and Aquaculture - 2006 (SOFIA)...[January,2009]<br />
UNU-Fisheries Tra<strong>in</strong><strong>in</strong>g Programme 24
Salia<br />
IGFA 2001 Database <strong>of</strong> IGFA angl<strong>in</strong>g records until 2001. IGFA, Fort Lauderdale,<br />
http://www.igfa.org/<br />
Kaliba, R. A., Mackambo, J., Ngugi, C C. and Quagra<strong>in</strong>ie, K. K. 2007. Economic<br />
pr<strong>of</strong>itability <strong>of</strong> Nile <strong>tilapia</strong> (Orechromis niloticus L.) production <strong>in</strong> Kenya<br />
Li, S., 1998. Genetic characterization <strong>of</strong> major freshwater culture fishes <strong>in</strong> Ch<strong>in</strong>a.<br />
Shanghai Scientific & Technical Publishers, Shanghai, Ch<strong>in</strong>a, 233 p.<br />
<br />
Liti, D. M., Mugo, R. M, Munguti, J. M, and Waidbacher, H. 2006. Growth and<br />
<strong>economic</strong> performance <strong>of</strong> Nile <strong>tilapia</strong> (Oreochromis niloticus) fed on tree brans<br />
(maize, wheat and rice) <strong>in</strong> fertilized ponds<br />
Machena, C. and Moehl, J. 2001. African Aquaculture: A Regional Summary with<br />
Emphasis on Sub-Saharan Africa African Aquaculture: A Regional Summary with<br />
Emphasis on Sub.[march, 2009]<br />
M<strong>in</strong>istry <strong>of</strong> Agriculture, Animal Industry and Fisheries. 2005. Aquaculture technical<br />
Manual, an Introduction to Commercial fish farm<strong>in</strong>g, Volume 1 NAADS<br />
M<strong>in</strong>istry for Coord<strong>in</strong>ation <strong>of</strong> Environmental Action <strong>of</strong> Republic <strong>of</strong> Mozambique.<br />
2002. National Action Plan to Combat Drought and Desertification<br />
Plano de Acção Nacional de Combate à Seca e à Desertificação<br />
Moreau J. Pauly D. and Pre<strong>in</strong> M. 1988. A comparison <strong>of</strong> overall growth performance<br />
<strong>of</strong> <strong>tilapia</strong> <strong>in</strong> open waters and <strong>aquaculture</strong>. p. 469-479. In R.S.V. Pull<strong>in</strong>, T. Bhukaswan,<br />
K. Tonguthai and J.L. Maclean (eds.). The Second International Symposium on<br />
Tilapia <strong>in</strong> Aquaculture. ICLARM Conf. Proc. 15<br />
Mozambique National M<strong>in</strong>istry <strong>of</strong> Fisheries. 2008. Three years Balance 2005-2007-<br />
VIII Council Coord<strong>in</strong>ator, Policies and Measures<br />
Nandlal, S. and Picker<strong>in</strong>g, T. 2004. Tilapia fish farm<strong>in</strong>g <strong>in</strong> Pacific Island countries.<br />
Volume 2. Tilapia grow -out <strong>in</strong> ponds. Noumea, New Caledonia: Secretariat <strong>of</strong> the<br />
Pacific Community 13 Uganda M<strong>in</strong>istry <strong>of</strong> Agriculture, Animal Industry and<br />
Fisheries. 2005. Aquaculture Technical manual, Volume 1<br />
Philippart, J.-C. and J.-C. Ruwet, 1982. Ecology and distribution <strong>of</strong> <strong>tilapia</strong>s. p. 15-60.<br />
In R.S.V. Pull<strong>in</strong> and R.H. Lowe-McConnell (eds.) The biology and culture <strong>of</strong> <strong>tilapia</strong>s.<br />
ICLARM Conf. Proc. 7<br />
Trewavas, E. 1983 Tilapi<strong>in</strong>e fishes <strong>of</strong> the genera Sarotherodon, Oreochromis and<br />
Danakilia. British Mus. Nat. Hist., London, UK. 583 p e<br />
Sites related<br />
http://earthrends.wri.org. (Country pr<strong>of</strong>ile on-l<strong>in</strong>e)<br />
Moçambique - Wikipédia, a enciclopédia livre (Map)<br />
UNU-Fisheries Tra<strong>in</strong><strong>in</strong>g Programme 25
Salia<br />
APPENDICES<br />
Table 1: Data collection<br />
All values <strong>in</strong> USD<br />
Item Mozambique Literature review My assumptions Reference<br />
Pond area 500 m 2 *<br />
Pond cost 355.56 *<br />
Month days 30 *<br />
Batch cycle length 8 months *<br />
Stock<strong>in</strong>g density 5 f<strong>in</strong>gerl<strong>in</strong>g/m 2 *<br />
Initial weight <strong>of</strong> <strong>tilapia</strong> stock<strong>in</strong>g 10-12 g *<br />
Cost <strong>of</strong> each <strong>tilapia</strong> f<strong>in</strong>gerl<strong>in</strong>g 0.26 *<br />
Survival rate at harvest 80-90% * Satya and Timothy 2004<br />
Harvest weigth 414 g * Li, S, 1998<br />
Tilapia sell<strong>in</strong>g price 3.6 *<br />
Cost <strong>of</strong> feed 0.24 *<br />
Limestone CaCO 3 2kg/10m 2 * Satya and Timothy 2004<br />
1000-2000kg/ha, 1-<br />
Quantity 315 kg *<br />
cost 0.6 *<br />
Urea 6 g /m 2 * Satya and Timothy 2004<br />
Quantity 235 kg *<br />
Cost 1.68 *<br />
Equity 1,419 *<br />
Loan 3,311 *<br />
Income taxes 12% *<br />
Interest on Loan 9% *<br />
Depreciation on equipment 10% *<br />
Depreciation ponds 4% *<br />
Depreciation <strong>of</strong> others 10% *<br />
Years for equipment and pond loans 10% *<br />
UNU-Fisheries Tra<strong>in</strong><strong>in</strong>g Programme 27
Salia<br />
Table 2: A guide for supplementary feed<strong>in</strong>g <strong>of</strong> <strong>tilapia</strong><br />
A guide for supplementary feed<strong>in</strong>g <strong>of</strong> <strong>tilapia</strong> (Satya and Timothy 2004)<br />
Body Weight <strong>of</strong> fish (g) Number <strong>of</strong> fish per kilogram Feed<strong>in</strong>g rate No. Of feeds per day<br />
1.-.5 1000 - 200 10 -6% 4. -. 6<br />
5.-.25 200 - 40 5% 4<br />
25 - 155 40 - 7 4 - 3% 4<br />
150 - 250 7.- .4 3% 3 -. 4<br />
250 - 450 4. - .2 2 - 3% 2 -. 3<br />
Table 3: Production data <strong>of</strong> <strong>tilapia</strong> cultured stoked density at five f<strong>in</strong>gerl<strong>in</strong>gs<br />
<strong>in</strong>f<strong>in</strong>itive length 34.7 cise <strong>of</strong> pond <strong>in</strong> m^2 500 Price/f<strong>in</strong>gerl<strong>in</strong>gs 0.26<br />
Price <strong>of</strong> food<br />
/kg 0.24<br />
Fertiliser cost<br />
K 0.27 Density/m2 5 cost/kg <strong>of</strong> f<strong>in</strong>gerl<strong>in</strong>gs 1.32 Urea/kg 1.7<br />
a 0.04 Initial Number 2500 Tocal cost <strong>of</strong> f<strong>in</strong>g 1,100<br />
Fertiliser cost<br />
CaCo3/kg 0.6<br />
Number <strong>of</strong><br />
feed<strong>in</strong>g/day 3<br />
b 2.7<br />
Time (month) Length (cm) Mean body<br />
weigth (gr)<br />
% <strong>of</strong><br />
mortality/month<br />
Number <strong>of</strong> fish Biomass (kg) % <strong>of</strong> feed<strong>in</strong>g/month Kg <strong>of</strong><br />
food<br />
cost <strong>of</strong><br />
feed<strong>in</strong>g/kg/Cy<br />
cle<br />
Kg <strong>of</strong><br />
fertilizer/<br />
month<br />
urea<br />
cost <strong>of</strong><br />
fertilizer/Cycle<br />
CaCO3<br />
CaCO3, cost <strong>of</strong><br />
Price/Kg fertilizer/Cycle<br />
0 0 0 2,500<br />
1 8 12 2,500 29 7% 6 1 20 34 75 45<br />
2 14 54 10% 2,250 123 6% 22 5 20 34 75 45<br />
3 19 118 4% 2,160 254 5% 38 9 20 34 75 45<br />
4 23 188 3% 2,095 394 4% 47 11 20 34 75 45<br />
5 26 256 1% 2,074 532 3% 48 11 20 34 75 45<br />
6 28 318 1% 2,054 653 2% 39 9 20 34 75 45<br />
7 29 371 1% 2,033 753 1.5% 34 8 20 34 75 45<br />
8 31 414 2,013 834 1.5% 38 9<br />
272 65 140 235 525 315<br />
UNU-Fisheries Tra<strong>in</strong><strong>in</strong>g Programme 28
Salia<br />
Table 4: Costs, gross revenue and net pr<strong>of</strong>it contributions from one pond <strong>tilapia</strong> production<br />
Quantity <strong>of</strong> sales <strong>in</strong> kg 834<br />
Price/kg (USD) 3.6<br />
Gross revenue 3,001<br />
Cost <strong>of</strong> f<strong>in</strong>gerl<strong>in</strong>gs/Cycle 650<br />
Cost <strong>of</strong> feed<strong>in</strong>g/Cycle 65<br />
Urea Cost <strong>of</strong> fertilizer/Cycle 235<br />
CaCo3 Cost <strong>of</strong> fertilizer/Cycle 315<br />
Harvest<strong>in</strong>g cost 40<br />
Labour 460<br />
Total Costs/Cycle 951<br />
Net Revenue/Cylce 2,051<br />
Net Revenue/kg 2.46<br />
Table 5: Investment costs<br />
Investment Costs:<br />
Equipment Quantity Total Cost<br />
Pump 1 800<br />
Build<strong>in</strong>gs:<br />
Total<br />
Nets 1 12 Pond 1 356<br />
Rent Vehicle 360 Fence 160<br />
Conta<strong>in</strong>ers 5 60 House 1 1,600<br />
Refrigerator 1 240 Sub total 2,116<br />
PVC Pipes 24 Cont<strong>in</strong>gency 4% 85<br />
Wheel Barrow 2 160 Total 2,200 USD<br />
Hoes 4 28<br />
Cutlass 2 6 Other Investment<br />
Scales 1 120 other costs Total Cost<br />
Test Kit PH 2 48 License 150.00<br />
Termometer 2 180 Sb total 150.00<br />
Shovels 2 56 Contngency 1% 1.50<br />
Sub total 2,094 Total 152 USD<br />
Contngency 4% 84<br />
Total 2,178 USD Total <strong>in</strong>vestment 4,529<br />
USD<br />
UNU-Fisheries Tra<strong>in</strong><strong>in</strong>g Programme 29
Salia<br />
Table 6: Operat<strong>in</strong>g costs <strong>in</strong> one pond per cycle<br />
Operation Costs:<br />
Variable cost Total Cost / kg Fixed Cost Total Cost/Year<br />
F<strong>in</strong>gerl<strong>in</strong>gs 1.32 Employees 2 400<br />
Feed<strong>in</strong>g 0.08 Security 1 60<br />
Fertilizers(urea) 0.28 Sub total 460<br />
CaCo3 0.38 Cont<strong>in</strong>gency 3% 14<br />
Harvest<strong>in</strong>g cost 5 0.05 Total 474 USD<br />
2.11<br />
Sub total<br />
Cont<strong>in</strong>gency 4% 0.08<br />
Total<br />
2.19 USD/kg<br />
Table 7: 10 years harvest<strong>in</strong>g plan<br />
2500 F<strong>in</strong>al kg <strong>of</strong> fish/Cycle 834<br />
1 2 3 4 5 6 7 8 9 10 11 12 N. <strong>of</strong> f<strong>in</strong>gerl<strong>in</strong>gs 0.26<br />
January February March April May June July Agost September Octuber November December Price/f<strong>in</strong>ger<strong>in</strong>g Cost <strong>of</strong> f<strong>in</strong>gerl<strong>in</strong>gs/Year Total Kg <strong>of</strong> fish/Year<br />
2010 Stock<strong>in</strong>g 0<br />
2011 Harvest<strong>in</strong>g Stock<strong>in</strong>g Harvest<strong>in</strong>g 2 1,300 1,667<br />
2012 Stock<strong>in</strong>g Harvest<strong>in</strong>g Stock<strong>in</strong>g 2 1,300 1,667<br />
2013 Harvest<strong>in</strong>g Stock<strong>in</strong>g 1 650 834<br />
2014 Harvest<strong>in</strong>g Stock<strong>in</strong>g Harvest<strong>in</strong>g 1 650 834<br />
2015 Stock<strong>in</strong>g Harvest<strong>in</strong>g Stock<strong>in</strong>g 2 1,300 1,667<br />
2016 Harvest<strong>in</strong>g Stock<strong>in</strong>g 1 650 834<br />
2017 Harvest<strong>in</strong>g Stock<strong>in</strong>g Harvest<strong>in</strong>g 1 650 834<br />
2018 Stock<strong>in</strong>g Harvest<strong>in</strong>g Stock<strong>in</strong>g 2 1,300 1,667<br />
2019 Harvest<strong>in</strong>g Stock<strong>in</strong>g 1 650 834<br />
2020 Harvest<strong>in</strong>g Stock<strong>in</strong>g Harvest<strong>in</strong>g 1 650 834<br />
Years<br />
UNU-Fisheries Tra<strong>in</strong><strong>in</strong>g Programme 30
Salia<br />
Table 8: Net revenue for 10 years <strong>of</strong> operation<br />
Production for 10 years 2010 2011 2012 2013 2014 2015 2016 2017 2018 2019 2020<br />
cost fo f<strong>in</strong>gerl<strong>in</strong>gs 1,300 1,300 650 650 1,300 650 650 1,300 650 650<br />
cost <strong>of</strong> feed<strong>in</strong>g 131 131 65 65 131 65 65 131 65 65<br />
cost <strong>of</strong> fertilysers Urea 470.4 470.4 235.2 235.2 470.4 235 235.2 470.4 235.2 235.2<br />
cost <strong>of</strong> fertilysers CaCO3 630 630 315 315 630 315 315 630 315 315<br />
Total Variable costs 1,901 1,901 951 951 1,901 951 951 1,901 951 951<br />
Quantity <strong>of</strong> Kg <strong>of</strong> fishes 1,667 1,667 834 834 1,667 834 834 1,667 834 834<br />
Price/ Kg <strong>of</strong> fish 3.6 3.6 3.6 3.6 3.6 3.6 3.6 3.6 3.6 3.6<br />
Revenue 6,003 6,003 3,001 3,001 6,003 3,001 3,001 6,003 3,001 3,001<br />
Net revenue 4,102 4,102 2,051 2,051 4,102 2,051 2,051 4,102 2,051 2,051<br />
UNU-Fisheries Tra<strong>in</strong><strong>in</strong>g Programme 31
Salia<br />
Appendix 1: Pr<strong>of</strong>itability model: Assumptions and Results<br />
Assumptions and Results<br />
All amounts are <strong>in</strong> fixed terms<br />
2010 Discount<strong>in</strong>g Rate 15% (MARR)<br />
Investment: USD Plann<strong>in</strong>g Horizon 10 years<br />
Build<strong>in</strong>gs 2,200<br />
Equipment 100% 2,178 Total Cap. Equity<br />
Other 152 NPV <strong>of</strong> Cash Flow 891 1,645<br />
Total 4,529 Internal Rate 20% 46%<br />
F<strong>in</strong>anc<strong>in</strong>g:<br />
Work<strong>in</strong>g Capital 200 Capital/Equity 4.6<br />
Total F<strong>in</strong>anc<strong>in</strong>g 4,729 after 10 years<br />
Equity 30%<br />
Loan Repayments<br />
8 years<br />
Real Interest Rate <strong>of</strong> Loans 9%<br />
Operations: 2010 2011 2012 2013 2014 2015 2016 2017 2018 2019 2020<br />
Sales Quantity 100% 1,667 1,667 834 834 1,667 834 834 1,667 834 834 Kg/year<br />
Sales Price 100% 3.6 3.6 3.6 3.6 3.6 3.6 3.6 3.6 3.6 3.6 USD/Kg<br />
Variable Cost<br />
2.19 USD/kg<br />
Fixed Cost 474 USD/year Breakdown <strong>of</strong> cost<br />
Inventory Build-up Variable Cost 25,560 38.7%<br />
Debtors 20% <strong>of</strong> turnover Fixed Cost 4,738 7.2%<br />
Creditors 15% <strong>of</strong> variable cost Paid Taxes 821 1.2%<br />
Dividend 20% <strong>of</strong> pr<strong>of</strong>it F<strong>in</strong>ancial Cost 1,333 2.0%<br />
Depreciation Build<strong>in</strong>gs 4% Loan Repayment 3,311 5.0%<br />
Depreciation Equipm. 10% Paid Dividend 1,218 1.8%<br />
Depreciation Other 10% Cash Account 29,107 44.0%<br />
Loan Managem. Fees 2% Total 66,088 100.0%<br />
Income Tax 12%<br />
UNU-Fisheries Tra<strong>in</strong><strong>in</strong>g Programme 32
Salia<br />
Appendix 2: Pr<strong>of</strong>itability model: Investment and f<strong>in</strong>ance<br />
Investment<br />
2010 2011 2012 2013 2014 2015 2016 2017 2018 2019 2020 Total<br />
Investment and F<strong>in</strong>anc<strong>in</strong>g 1 2 3 4 5 6 7 8 9 10<br />
Investment:<br />
Build<strong>in</strong>gs 2,200 2,112 2,024 1,936 1,848 1,760 1,672 1,584 1,496 1,408 1,320<br />
Equipment 2,178 1,960 1,742 1,524 1,307 1,089 871 653 436 218 0<br />
Other 152 136 121 106 91 76 61 61 61 61 61<br />
Booked Value 4,529 4,209 3,888 3,567 3,246 2,925 2,604 2,298 1,992 1,686 1,381<br />
Depreciation:<br />
Depreciation Build<strong>in</strong>gs 4% 88 88 88 88 88 88 88 88 88 88 880<br />
Depreciation Equipm. 10% 218 218 218 218 218 218 218 218 218 218 2,178<br />
Depreciation Other 10% 15 15 15 15 15 15 0 0 0 0 91<br />
Total Depreciation 321 321 321 321 321 321 306 306 306 306 3,149<br />
F<strong>in</strong>anc<strong>in</strong>g: 4,729<br />
Equity 30% 1,419<br />
Loans 70% 3,311<br />
Repayment 8 0 0 414 414 414 414 414 414 414 414 0 3,311<br />
Pr<strong>in</strong>cipal (=Loans) 3,311 3,311 2,897 2,483 2,069 1,655 1,241 828 414 0 0 18,208<br />
Interest 9.0% 298 298 261 223 186 149 112 74 37 0 1,639<br />
Loan Managem. Fees 2% 66<br />
UNU-Fisheries Tra<strong>in</strong><strong>in</strong>g Programme 33
Salia<br />
Appendix 3: Pr<strong>of</strong>itability model: Operation statement<br />
Operations<br />
2010 2011 2012 2013 2014 2015 2016 2017 2018 2019 2020 Total<br />
Operations Statement 1 2 3 4 5 6 7 8 9 10<br />
Sales (kg/year) 1,667 1,667 834 834 1,667 834 834 1,667 834 834 11,672<br />
Price (USD/Kg) 3.6 3.6 3.6 3.6 3.6 3.6 3.6 3.6 3.6 3.6 36<br />
Revenue 6,003 6,003 3,001 3,001 6,003 3,001 3,001 6,003 3,001 3,001 420,206<br />
Variable Cost (USD/Kg) 2.19 3,651 3,651 1,826 1,826 3,651 1,826 1,826 3,651 1,826 1,826 25,560<br />
Net Pr<strong>of</strong>it Contribution 2,351 2,351 1,176 1,176 2,351 1,176 1,176 2,351 1,176 1,176 394,646<br />
Fixed Cost 474 474 474 474 474 474 474 474 474 474 474 4,738<br />
Diverse Taxes<br />
Operat<strong>in</strong>g Surplus (EBITDA) 1,878 1,878 702 702 1,878 702 702 1,878 702 702 389,908<br />
Inventory Movement<br />
Depreciation 321 321 321 321 321 321 306 306 306 306 3,149<br />
Operat<strong>in</strong>g Ga<strong>in</strong>/Loss (EBIT)(creditors) 0 1,557 1,557 381 381 1,557 381 396 1,572 396 396 386,759<br />
F<strong>in</strong>ancial Costs (Interest+LMF) 66 298 298 261 223 186 0 0 0 0 0 1,333<br />
Pr<strong>of</strong>it before Tax -66 1,259 1,259 120 158 1,371 381 396 1,572 396 396 385,427<br />
Loss Transfer 0 -66 0 0 0 0 0 0 0 0 0 0 66<br />
Taxable Pr<strong>of</strong>it 0 1,193 1,259 120 158 1,371 381 396 1,572 396 396 7,241<br />
Income Tax (taxe payable) 12% 0 143 151 14 19 164 46 48 189 48 48 869<br />
Pr<strong>of</strong>it after Tax -66 1,116 1,108 106 139 1,206 335 349 1,383 349 349 384,558<br />
Dividend 20% 0 223 222 21 28 241 67 70 277 70 70 1,288<br />
Net Pr<strong>of</strong>it/Loss -66 893 886 85 111 965 268 279 1,107 279 279 383,270<br />
UNU-Fisheries Tra<strong>in</strong><strong>in</strong>g Programme 34
Salia<br />
Appendix 4: Pr<strong>of</strong>itability model: Cash flow<br />
Cash Flow<br />
2010 2011 2012 2013 2014 2015 2016 2017 2018 2019 2020 Total<br />
Cash Flow 1 2 3 4 5 6 7 8 9 10<br />
Operat<strong>in</strong>g Surplus (EBITDA) 0 1,878 1,878 702 702 1,878 702 702 1,878 702 702 11,722<br />
Debtor's Changes 1,201 0 -600 0 600 -600 0 600 -600 0 600<br />
Creditor Changes 548 0 -274 0 274 -274 0 274 -274 0 274<br />
Inventory Build up<br />
Cash Flow before Tax 0 1,225 1,878 1,028 702 1,551 1,028 702 1,551 1,028 702 11,396<br />
Paid Taxes 0 0 143 151 14 19 164 46 48 189 48 821<br />
Cash Flow after Tax 0 1,225 1,735 877 687 1,532 864 656 1,504 840 654 10,574<br />
F<strong>in</strong>ancial Costs 66 298 298 261 223 186 0 0 0 0 0 1,333<br />
Repayment 0 0 414 414 414 414 414 414 414 414 0 3,311<br />
Net (Free) Cash Flow -66 927 1,023 203 50 932 450 242 1,090 426 654 5,931<br />
Paid Dividend 0 0 223 222 21 28 241 67 70 277 70 1,218<br />
F<strong>in</strong>anc<strong>in</strong>g - Expenditure (Work<strong>in</strong>g Capital) 200<br />
Cash Movement 134 927 800 -19 29 905 209 175 1,020 149 585 4,713<br />
UNU-Fisheries Tra<strong>in</strong><strong>in</strong>g Programme 35
Salia<br />
Appendix 5: Pr<strong>of</strong>itability model: Source and allocation <strong>of</strong> founds<br />
Source and Allocation <strong>of</strong> Funds<br />
2010 2011 2012 2013 2014 2015 2016 2017 2018 2019 2020 Total<br />
Source <strong>of</strong> Funds<br />
Pr<strong>of</strong>it before Tax -66 1,259 1,259 120 158 1,371 381 396 1,572 396 396 7,241<br />
Depreciation 0 321 321 321 321 321 321 306 306 306 306 3,149<br />
Funds from Operations -66 1,580 1,580 441 478 1,691 702 702 1,878 702 702 10,390<br />
Loan Drawdown 3,311 3,311<br />
Equity Drawdown 1,419 1,419<br />
Funds for allocation 4,663 1,580 1,580 441 478 1,691 702 702 1,878 702 702 15,119<br />
Allocation <strong>of</strong> Funds<br />
Investment 4,529 4,529<br />
Repayment 0 0 414 414 414 414 414 414 414 414 0 3,311<br />
Paid Taxes 0 0 143 151 14 19 164 46 48 189 48 821<br />
Paid Dividend 0 0 223 222 21 28 241 67 70 277 70 1,218<br />
Total allocation 4,529 0 780 786 449 460 819 527 531 879 117 9,879<br />
Changes Net Curr. Assets 134 1,580 800 -345 29 1,231 -118 175 1,347 -177 585 5,240<br />
Analysis <strong>of</strong> Changes<br />
Current Assets<br />
Cash at start <strong>of</strong> year 0 134 1,061 1,860 1,842 1,871 2,775 2,984 3,159 4,179 4,329 24,193<br />
Cash at end <strong>of</strong> year 134 1,061 1,860 1,842 1,871 2,775 2,984 3,159 4,179 4,329 4,913 29,107<br />
Changes <strong>in</strong> Cash 134 927 800 -19 29 905 209 175 1,020 149 585 4,913<br />
Debtor changes 0 1,201 0 -600 0 600 -600 0 600 -600 0 600<br />
Inventory Movements 0 0 0 0 0 0 0 0 0 0 0 0<br />
Changes <strong>in</strong> Current Assets 134 2,127 800 -619 29 1,505 -391 175 1,620 -451 585 5,514<br />
Liabilities<br />
Creditor changes 0 548 0 -274 0 274 -274 0 274 -274 0 274<br />
Changes Net Curr. Assets 134 1,580 800 -345 29 1,231 -118 175 1,347 -177 585 5,240<br />
UNU-Fisheries Tra<strong>in</strong><strong>in</strong>g Programme 36
Salia<br />
Appendix 6: Pr<strong>of</strong>itability model: balance sheet<br />
2010 2011 2012 2013 2014 2015 2016 2017 2018 2019 2020 Total<br />
Balance Sheet 1 2 3 4 5 6 7 8 9 10<br />
Assets<br />
Cash Account 0 134 1,061 1,860 1,842 1,871 2,775 2,984 3,159 4,179 4,329 4,913 29,107<br />
Debtors (Acc Receivables) 20% 0 1,201 1,201 600 600 1,201 600 600 1,201 600 600 8,404<br />
Inventory 0 0 0 0 0 0 0 0 0 0 0 0 0<br />
Current Assets 134 2,261 3,061 2,442 2,471 3,976 3,584 3,760 5,380 4,929 5,514 37,511<br />
Fixed Assets (Booked Values) 4,529 4,209 3,888 3,567 3,246 2,925 2,604 2,298 1,992 1,686 1,381 32,324<br />
Total Assets 4,663 6,470 6,948 6,008 5,717 6,900 6,188 6,058 7,372 6,616 6,894 69,835<br />
Debts<br />
Dividend Payable 0 223 222 21 28 241 67 70 277 70 70 1,288<br />
Taxes Payable 0 143 151 14 19 164 46 48 189 48 48 869<br />
Creditors (Acc Payables) 15% 0 548 548 274 274 548 274 274 548 274 274 3,834<br />
Next Year Repayment 0 414 414 414 414 414 414 414 414 0 0 3,311<br />
Current Liabilities(Short Term Debdt) 0 1,328 1,334 723 734 1,367 800 805 1,427 391 391 9,301<br />
Long Term Loans 3,311 2,897 2,483 2,069 1,655 1,241 828 414 0 0 0 14,898<br />
Total Debt 3,311 4,225 3,817 2,792 2,390 2,609 1,628 1,219 1,427 391 391 24,199<br />
Equity 0 1,419 1,419 1,419 1,419 1,419 1,419 1,419 1,419 1,419 1,419 1,419 15,607<br />
Pr<strong>of</strong>it & Loss Balance 0 -66 826 1,713 1,797 1,908 2,873 3,141 3,420 4,527 4,806 5,084 30,029<br />
Total Capital 1,353 2,245 3,131 3,216 3,327 4,292 4,560 4,839 5,945 6,224 6,503 45,636<br />
Debts and Capital 4,663 6,470 6,948 6,008 5,717 6,900 6,188 6,058 7,372 6,616 6,894 69,835<br />
UNU-Fisheries Tra<strong>in</strong><strong>in</strong>g Programme 37
Salia<br />
Appendix 7: Pr<strong>of</strong>itability model: Pr<strong>of</strong>itability measurements<br />
2010 2011 2012 2013 2014 2015 2016 2017 2018 2019 2020 Total<br />
Pr<strong>of</strong>itability Measurements<br />
NPV and IRR <strong>of</strong> Total Cash Flow<br />
Cash Flow after Taxes 0 1,225 1,735 877 687 1,532 864 656 1,504 840 654 10,574<br />
Loans -3,311 -3,311<br />
Equity -1,419 -1,419<br />
Total Cash Flow & Capital -4,729 1,225 1,735 877 687 1,532 864 656 1,504 840 654 5,845<br />
NPV Total Cash Flow 0 -4,729 -3,664 -2,353 -1,776 -1,383 -621 -248 -1 491 729 891 2,148<br />
IRR Total Cash Flow 0% 0% 0% 0% 0% 9% 13% 15% 18% 20% 20%<br />
NPV and IRR <strong>of</strong> Net Cash Flow<br />
Net (free) Cash Flow -66 927 1023 203 50 932 450 242 1090 426 654 5,931<br />
Equity -1419 -1,419<br />
Net Cash Flow & Equity -1,485 927 1,023 203 50 932 450 242 1,090 426 654 4,513<br />
NPV Net Cash Flow 0 -1,485 -679 94 228 256 720 914 1,006 1,362 1,483 1,645<br />
IRR Net Cash Flow 0% 0% 20% 26% 27% 38% 41% 42% 44% 45% 46%<br />
F<strong>in</strong>ancial Ratios<br />
ROI (Pr<strong>of</strong>it+Interest/Debt+Capital) 33% 24% 5% 6% 27% 6% 6% 26% 5% 6%<br />
ROE (Pr<strong>of</strong>it/Shareh. Capital) 82% 49% 3% 4% 36% 8% 8% 29% 6% 6%<br />
Turnov Ratio(Revenue/Debit+Capital) 19% 14% 1% 2% 17% 4% 5% 18% 4% 4%<br />
Capital Ratio(Capital/Debt+Capital) 35% 45% 54% 58% 62% 74% 80% 81% 94% 94%<br />
Net Current Ratio(Current Asset/Current Liability) 1.7 2.3 3.4 3.4 2.9 4.5 4.7 3.8 12.6 14.1<br />
Liquid Current Ratio(Curr Assets-Inventory)/Curr Liability 1.7 2.3 3.4 3.4 2.9 4.5 4.7 3.8 12.6 14.1<br />
Internal Value <strong>of</strong> Shares(Total Capital/Equity) 1.6 2.2 2.3 2.3 3.0 3.2 3.4 4.2 4.4 4.6<br />
Debt Service Coverage(Cash Flow After Taxe/(Internal +Repayment)) 4.1 2.4 1.3 1.1 2.6 2.1 1.6 3.6 2.0<br />
UNU-Fisheries Tra<strong>in</strong><strong>in</strong>g Programme 38
Salia<br />
Figure 8: Aquaculture production by region group<strong>in</strong>g <strong>in</strong> 2004<br />
UNU-Fisheries Tra<strong>in</strong><strong>in</strong>g Programme 39