

Reading 2009 - African American Communication and Collaboration ...
Reading 2009 - African American Communication and Collaboration ...
Reading 2009 - African American Communication and Collaboration ...

Create successful ePaper yourself
Turn your PDF publications into a flip-book with our unique Google optimized e-Paper software.
GRADE<br />
4<br />
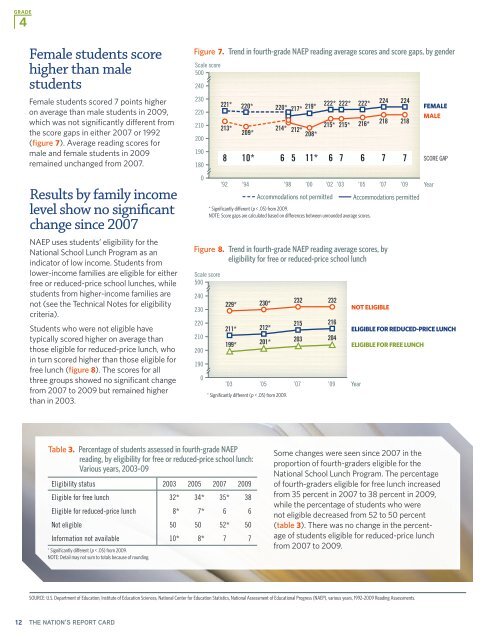
Female students score<br />
higher than male<br />
students<br />
Female students scored 7 points higher<br />
on average than male students in <strong>2009</strong>,<br />
which was not significantly different from<br />
the score gaps in either 2007 or 1992<br />
(figure 7). Average reading scores for<br />
male <strong>and</strong> female students in <strong>2009</strong><br />
remained unchanged from 2007.<br />
Results by family income<br />
level show no significant<br />
change since 2007<br />
NAEP uses students’ eligibility for the<br />
National School Lunch Program as an<br />
indicator of low income. Students from<br />
lower-income families are eligible for either<br />
free or reduced-price school lunches, while<br />
students from higher-income families are<br />
not (see the Technical Notes for eligibility<br />
criteria).<br />
Students who were not eligible have<br />
typically scored higher on average than<br />
those eligible for reduced-price lunch, who<br />
in turn scored higher than those eligible for<br />
free lunch (figure 8). The scores for all<br />
three groups showed no significant change<br />
from 2007 to <strong>2009</strong> but remained higher<br />
than in 2003.<br />
Figure 7. Trend in fourth-grade NAEP reading average scores <strong>and</strong> score gaps, by gender<br />
Scale score<br />
500<br />
240<br />
230<br />
220<br />
210<br />
200<br />
190<br />
180<br />
0<br />
Figure 8. Trend in fourth-grade NAEP reading average scores, by<br />
eligibility for free or reduced-price school lunch<br />
Scale score<br />
500<br />
240<br />
230<br />
220<br />
210<br />
200<br />
190<br />
0<br />
221*<br />
213*<br />
229*<br />
220*<br />
209*<br />
8 10* 6 5 11* 6 7 6 7 7<br />
230*<br />
211* 212*<br />
199* 201*<br />
232<br />
215<br />
203<br />
232<br />
216<br />
204<br />
’03 ’05 ’07 ’09<br />
* Significantly different (p < .05) from <strong>2009</strong>.<br />
220* 217* 219*<br />
214* 212*<br />
208*<br />
’92 ’94 ’98 ’00 ’02 ’03 ’05 ’07<br />
Accommodations not permitted<br />
222* 222* 222*<br />
215* 215* 216*<br />
* Significantly different (p < .05) from <strong>2009</strong>.<br />
NOTE: Score gaps are calculated based on differences between unrounded average scores.<br />
NOT ELIGIBLE<br />
ELIGIBLE FOR REDUCED-PRICE LUNCH<br />
ELIGIBLE FOR FREE LUNCH<br />
Year<br />
224<br />
218<br />
224<br />
218<br />
’09<br />
Accommodations permitted<br />
FEMALE<br />
MALE<br />
SCORE GAP<br />
Year<br />
Table 3. Percentage of students assessed in fourth-grade NAEP<br />
reading, by eligibility for free or reduced-price school lunch:<br />
Various years, 2003–09<br />
Eligibility status 2003 2005 2007 <strong>2009</strong><br />
Eligible for free lunch 32* 34* 35* 38<br />
Eligible for reduced-price lunch 8* 7* 6 6<br />
Not eligible 50 50 52* 50<br />
Information not available 10* 8* 7 7<br />
* Significantly different (p < .05) from <strong>2009</strong>.<br />
NOTE: Detail may not sum to totals because of rounding.<br />
Some changes were seen since 2007 in the<br />
proportion of fourth-graders eligible for the<br />
National School Lunch Program. The percentage<br />
of fourth-graders eligible for free lunch increased<br />
from 35 percent in 2007 to 38 percent in <strong>2009</strong>,<br />
while the percentage of students who were<br />
not eligible decreased from 52 to 50 percent<br />
(table 3). There was no change in the percentage<br />
of students eligible for reduced-price lunch<br />
from 2007 to <strong>2009</strong>.<br />
SOURCE: U.S. Department of Education, Institute of Education Sciences, National Center for Education Statistics, National Assessment of Educational Progress (NAEP), various years, 1992–<strong>2009</strong> <strong>Reading</strong> Assessments.<br />
12 THE NATION’S REPORT CARD