Climate change impact on recurrence and regime of ... - BALTEX
Climate change impact on recurrence and regime of ... - BALTEX
Climate change impact on recurrence and regime of ... - BALTEX
Create successful ePaper yourself
Turn your PDF publications into a flip-book with our unique Google optimized e-Paper software.
<str<strong>on</strong>g>Climate</str<strong>on</strong>g> <str<strong>on</strong>g>change</str<strong>on</strong>g> <str<strong>on</strong>g>impact</str<strong>on</strong>g> <strong>on</strong><br />
<strong>recurrence</strong> <strong>and</strong> <strong>regime</strong> <strong>of</strong> run<strong>of</strong>f<br />
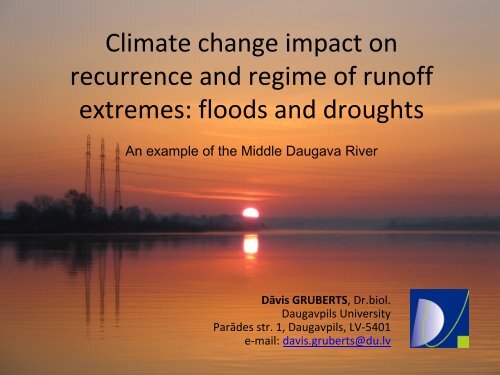
extremes: floods <strong>and</strong> droughts<br />
An example <strong>of</strong> the Middle Daugava River<br />
Dāvis GRUBERTS, Dr.biol.<br />
Daugavpils University<br />
Parādes str. 1, Daugavpils, LV‐5401<br />
e‐mail: davis.gruberts@du.lv
Introducti<strong>on</strong><br />
Aim <strong>of</strong> the study:<br />
• to evaluate l<strong>on</strong>g-term <str<strong>on</strong>g>change</str<strong>on</strong>g>s in the reoccurence<br />
(probability) <strong>and</strong> <strong>regime</strong> <strong>of</strong> the run<strong>of</strong>f extremes (floods<br />
<strong>and</strong> droughts) <strong>of</strong> the Middle Daugava River in c<strong>on</strong>text <strong>of</strong><br />
climate <str<strong>on</strong>g>change</str<strong>on</strong>g>.
Study site<br />
Helsinki<br />
Helsinki<br />
Stockholm<br />
St.-Petersburg<br />
Stockholm Tallinn St.-Petersburg<br />
Tallinn<br />
ESTONIA<br />
ESTONIA<br />
RUSSIA<br />
RUSSIA<br />
SWEDEN<br />
SWEDEN LATVIA<br />
LATVIA<br />
Riga<br />
Riga<br />
Wisla<br />
Wisla<br />
Baltic Sea<br />
Baltic Sea<br />
Warszawa<br />
Warszawa<br />
Daugava<br />
Daugava<br />
LITHUANIA<br />
LITHUANIA Vilnius<br />
Vilnius Minsk<br />
Minsk<br />
Pripyat<br />
Pripyat<br />
Dnepr Dnepr<br />
B E L A R U S<br />
B E L A R U S<br />
P O L A N D<br />
P O L A N D<br />
Krakov<br />
Krakov Lvov<br />
Lvov<br />
Kiev<br />
Kiev<br />
100 km<br />
100 km<br />
A false‐colour image <strong>of</strong> the<br />
Middle Daugava <strong>and</strong> its<br />
floodplain from the<br />
LANDSAT‐2 satellite at the<br />
peak <strong>of</strong> the spring floods<br />
(April 10, 1979).<br />
Hydrological<br />
stati<strong>on</strong> “Daugava<br />
at Daugavpils”<br />
Daugavpils<br />
University
The Daugava River upstream from Daugavpils City during the summer low‐flow<br />
period (photo by Ivars Druvietis, July 28, 2004)
The Daugava River downstream from Daugavpils (at Nīcgale) during the spring<br />
floods (obligue aerial photo by Dāvis Gruberts, April 25, 2009)
Floodplain meadows <strong>of</strong> the Daugava River at Dviete during the spring floods<br />
(obligue aerial photo by Dāvis Gruberts, April 24, 2009)
Floodplain meadows <strong>of</strong> the Daugava River at Ilūkste during the spring floods<br />
(obligue aerial photo by Kristīne Vēvere, April 24, 2009)
Data sources<br />
1. The Global Run<strong>of</strong>f Data Centre, Koblenz, Germany<br />
(www.grdc.bafg.de) – daily mean discharges <strong>of</strong> the Daugava<br />
River at Daugavpils (GRDC No. 6973300, 1936‐2007);<br />
2. The Nati<strong>on</strong>al Climatic Data Centre, Asheville, NC, USA<br />
(ftp://ftp.ncdc.noaa.gov/pub/data/gsod): daily mean air<br />
temperature, amount <strong>of</strong> precipitati<strong>on</strong> <strong>and</strong> thickness <strong>of</strong> snow<br />
cover at Riga, Daugavpils <strong>and</strong> Vitebsk weather stati<strong>on</strong>s<br />
(1964‐2006).
Main characteristics <strong>of</strong> the hydrological<br />
stati<strong>on</strong> “Daugava at Daugavpils”<br />
• latitude: 55,88°<br />
• l<strong>on</strong>gitude: 26,53°<br />
• altitude: 86,0 m a.s.l.<br />
• catchment area: 64’500 km²<br />
• object <strong>of</strong> observati<strong>on</strong>s: water level, discharge<br />
• beginning <strong>of</strong> observati<strong>on</strong>s: since 1881<br />
• frequency <strong>of</strong> observati<strong>on</strong>s: each day<br />
• highest observed discharge: 6930 m 3 /s (April, 1931)<br />
• lowest observed discharge: 40,5 m 3 /s (February, 1942)
Locati<strong>on</strong> <strong>of</strong> the weather stati<strong>on</strong>s<br />
Gulf<br />
<strong>of</strong><br />
Riga<br />
Riga<br />
L A T V I A<br />
Ogre<br />
Aiviekste<br />
Daugava Jekabpils<br />
Lake<br />
Lubans<br />
‐ weather stati<strong>on</strong><br />
R U S S I A<br />
Zap. Dvina<br />
Daugavpils<br />
Drisa<br />
Meza<br />
LITHUANIA<br />
Disna<br />
Polock<br />
Zap. Dvina<br />
Kaspla<br />
Ulla<br />
Vitebsk<br />
60 km<br />
B E L A R U S<br />
- country borders
Statistical analysis <strong>of</strong> the hydrological drought<br />
reoccurence (probability distributi<strong>on</strong>s)<br />
• selected periods: 1936‐1977, 1966‐2007 (summer <strong>and</strong> allyear<br />
droughts); 1936‐1987, 1956‐2007 (winter droughts);<br />
• threshold level for the distincti<strong>on</strong> <strong>of</strong> the hydrological drought<br />
periods: 70 %;<br />
• parameters: all‐year droughts; summer droughts (June 5 –<br />
November 9); winter droughts (November 10 –June 4);<br />
• estimated probability distributi<strong>on</strong>s: relative run<strong>of</strong>f deficit;<br />
real low‐flow durati<strong>on</strong>; full low‐flow durati<strong>on</strong>;<br />
• the program: Nizowka 2003 (Distributi<strong>on</strong>s <strong>of</strong> Low Flow<br />
Extremes)*.<br />
* ‐ Dr. Wojciech Jakubowski, pr<strong>of</strong>. Laura Radczuk, Agricultural University <strong>of</strong> Wrocław, Pol<strong>and</strong>
The l<strong>on</strong>g‐term <str<strong>on</strong>g>change</str<strong>on</strong>g>s
The l<strong>on</strong>g‐term <str<strong>on</strong>g>change</str<strong>on</strong>g>s
The l<strong>on</strong>g‐term <str<strong>on</strong>g>change</str<strong>on</strong>g>s
The l<strong>on</strong>g‐term <str<strong>on</strong>g>change</str<strong>on</strong>g>s
The l<strong>on</strong>g‐term <str<strong>on</strong>g>change</str<strong>on</strong>g>s
The probability <strong>of</strong> hydrological droughts<br />
Relative deficit <strong>of</strong> the all‐year droughts
The probability <strong>of</strong> hydrological droughts<br />
Relative deficit <strong>of</strong> the winter droughts
The probability <strong>of</strong> hydrological droughts<br />
Relative deficit <strong>of</strong> the summer droughts
The probability <strong>of</strong> hydrological droughts<br />
Full durati<strong>on</strong> <strong>of</strong> the all‐year droughts
The probability <strong>of</strong> hydrological droughts<br />
Full durati<strong>on</strong> <strong>of</strong> the winter droughts
The probability <strong>of</strong> hydrological droughts<br />
Full durati<strong>on</strong> <strong>of</strong> the summer droughts
L<strong>on</strong>g‐term <str<strong>on</strong>g>change</str<strong>on</strong>g>s <strong>on</strong> the m<strong>on</strong>thly<br />
scale<br />
Example 1: the m<strong>on</strong>thly highest, averare <strong>and</strong> lowest air<br />
temperature at Daugavpils (1973‐2007)
L<strong>on</strong>g‐term <str<strong>on</strong>g>change</str<strong>on</strong>g>s <strong>on</strong> the m<strong>on</strong>thly<br />
scale<br />
Example 2: the m<strong>on</strong>thly mean max, average <strong>and</strong> min discharge<br />
<strong>of</strong> the Daugava at Daugavpils (1881‐2007)<br />
mean max<br />
average mean<br />
mean min
<str<strong>on</strong>g>Climate</str<strong>on</strong>g> <str<strong>on</strong>g>change</str<strong>on</strong>g> <str<strong>on</strong>g>impact</str<strong>on</strong>g>
<str<strong>on</strong>g>Climate</str<strong>on</strong>g> <str<strong>on</strong>g>change</str<strong>on</strong>g> <str<strong>on</strong>g>impact</str<strong>on</strong>g><br />
Example 2: Correlati<strong>on</strong> between the mean m<strong>on</strong>thly<br />
discharge <strong>of</strong> the Daugava River <strong>and</strong> the mean air<br />
temperature at Daugavpils in March
Main c<strong>on</strong>clusi<strong>on</strong>s<br />
1. In general, the climate <strong>of</strong> the Daugava River drainage basin<br />
becomes more warm <strong>and</strong> wet, with less snow in winter.<br />
2. The climate becomes also more diverse <strong>on</strong> the regi<strong>on</strong>al scale.<br />
3. The annual discharge <strong>of</strong> the Middle Daugava correlates better to<br />
the climatic characteristics <strong>of</strong> the Vitebsk weather stati<strong>on</strong>.<br />
4. Peculiaries <strong>of</strong> the climate <str<strong>on</strong>g>change</str<strong>on</strong>g> <strong>and</strong> the Daugava’s run<strong>of</strong>f <strong>regime</strong><br />
are better seen <strong>on</strong> the m<strong>on</strong>thly scale.<br />
5. The probability <strong>of</strong> reoccurence <strong>and</strong> the magnitude <strong>of</strong> typical run<strong>of</strong>f<br />
extremes <strong>of</strong> the Daugava River are decreasing.<br />
6. The possibility to predict the date <strong>of</strong> the annual floods’ peak is also<br />
decreasing.<br />
7. Predicti<strong>on</strong>s <strong>of</strong> the future climate related <str<strong>on</strong>g>change</str<strong>on</strong>g>s in the run<strong>of</strong>f<br />
<strong>regime</strong> <strong>of</strong> the Middle Daugava should be based <strong>on</strong> the weather<br />
stati<strong>on</strong>s located outside Latvia.
Paldies par uzmanību!<br />
The Daugava River upstream from Daugavpils City during the spring floods<br />
(photo by Dainis Lazdāns, March 26, 2007)


