Footwear Industry Footwear Industry - empirica
Footwear Industry Footwear Industry - empirica
Footwear Industry Footwear Industry - empirica

Create successful ePaper yourself
Turn your PDF publications into a flip-book with our unique Google optimized e-Paper software.
<strong>Footwear</strong><br />
years, as figures either represent a percentage of "all companies" (as in 2002 and 2003)<br />
or a percentage of "companies using computers" (as in 2005 and 2006). Differences are<br />
minimal, though, when figures have been weighted by employment.<br />
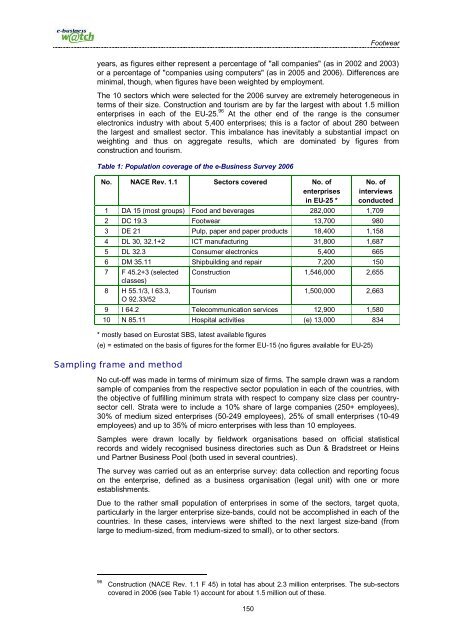
The 10 sectors which were selected for the 2006 survey are extremely heterogeneous in<br />
terms of their size. Construction and tourism are by far the largest with about 1.5 million<br />
enterprises in each of the EU-25. 96 At the other end of the range is the consumer<br />
electronics industry with about 5,400 enterprises; this is a factor of about 280 between<br />
the largest and smallest sector. This imbalance has inevitably a substantial impact on<br />
weighting and thus on aggregate results, which are dominated by figures from<br />
construction and tourism.<br />
Table 1: Population coverage of the e-Business Survey 2006<br />
No. NACE Rev. 1.1 Sectors covered No. of<br />
enterprises<br />
in EU-25 *<br />
No. of<br />
interviews<br />
conducted<br />
1 DA 15 (most groups) Food and beverages 282,000 1,709<br />
2 DC 19.3 <strong>Footwear</strong> 13,700 980<br />
3 DE 21 Pulp, paper and paper products 18,400 1,158<br />
4 DL 30, 32.1+2 ICT manufacturing 31,800 1,687<br />
5 DL 32.3 Consumer electronics 5,400 665<br />
6 DM 35.11 Shipbuilding and repair 7,200 150<br />
7 F 45.2+3 (selected<br />
classes)<br />
8 H 55.1/3, I 63.3,<br />
O 92.33/52<br />
Construction 1,546,000 2,655<br />
Tourism 1,500,000 2,663<br />
9 I 64.2 Telecommunication services 12,900 1,580<br />
10 N 85.11 Hospital activities (e) 13,000 834<br />
* mostly based on Eurostat SBS, latest available figures<br />
(e) = estimated on the basis of figures for the former EU-15 (no figures available for EU-25)<br />
Sampling frame and method<br />
No cut-off was made in terms of minimum size of firms. The sample drawn was a random<br />
sample of companies from the respective sector population in each of the countries, with<br />
the objective of fulfilling minimum strata with respect to company size class per countrysector<br />
cell. Strata were to include a 10% share of large companies (250+ employees),<br />
30% of medium sized enterprises (50-249 employees), 25% of small enterprises (10-49<br />
employees) and up to 35% of micro enterprises with less than 10 employees.<br />
Samples were drawn locally by fieldwork organisations based on official statistical<br />
records and widely recognised business directories such as Dun & Bradstreet or Heins<br />
und Partner Business Pool (both used in several countries).<br />
The survey was carried out as an enterprise survey: data collection and reporting focus<br />
on the enterprise, defined as a business organisation (legal unit) with one or more<br />
establishments.<br />
Due to the rather small population of enterprises in some of the sectors, target quota,<br />
particularly in the larger enterprise size-bands, could not be accomplished in each of the<br />
countries. In these cases, interviews were shifted to the next largest size-band (from<br />
large to medium-sized, from medium-sized to small), or to other sectors.<br />
96<br />
Construction (NACE Rev. 1.1 F 45) in total has about 2.3 million enterprises. The sub-sectors<br />
covered in 2006 (see Table 1) account for about 1.5 million out of these.<br />
150