Rangeland condition and feed resources in Metema District, North ...
Rangeland condition and feed resources in Metema District, North ...
Rangeland condition and feed resources in Metema District, North ...

You also want an ePaper? Increase the reach of your titles
YUMPU automatically turns print PDFs into web optimized ePapers that Google loves.
www.ipms-ethiopia.org<br />
www.eap.gov.et Work<strong>in</strong>g Paper No. 25<br />
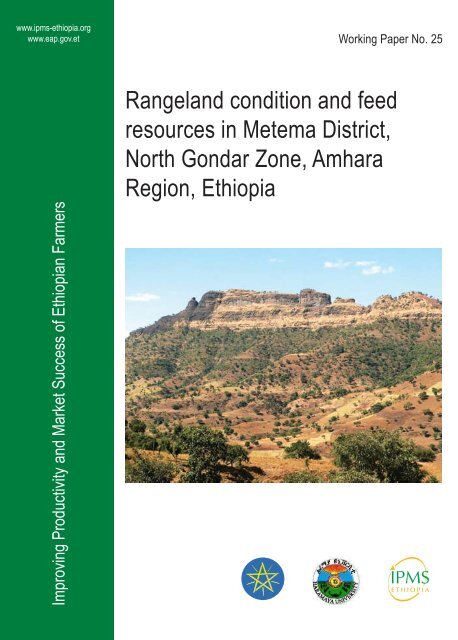
<strong>Rangel<strong>and</strong></strong> <strong>condition</strong> <strong>and</strong> <strong>feed</strong><br />
<strong>resources</strong> <strong>in</strong> <strong>Metema</strong> <strong>District</strong>,<br />
<strong>North</strong> Gondar Zone, Amhara<br />
Region, Ethiopia
<strong>Rangel<strong>and</strong></strong> <strong>condition</strong> <strong>and</strong> <strong>feed</strong> <strong>resources</strong><br />
<strong>in</strong> <strong>Metema</strong> <strong>District</strong>, <strong>North</strong> Gondar Zone,<br />
Amhara Region, Ethiopia<br />
Tesfaye Desalew, Azage Tegegne, Lisanework Nigatu <strong>and</strong> Worku Teka<br />
Improv<strong>in</strong>g Productivity <strong>and</strong> Market Success of Ethiopian Farmers project (IPMS)–<br />
International Livestock Research Institute (ILRI), Addis Ababa, Ethiopia<br />
*Azage Tegegne is correspond<strong>in</strong>g author: a.tegegne@cgiar.org
Authors’ affiliations<br />
Tesfaye Desalew, Bureau of Agriculture <strong>and</strong> Rural Development, Amhara National Regional<br />
State, Bahir Dar, Ethiopia<br />
Azage Tegegne, Improv<strong>in</strong>g Productivity <strong>and</strong> Market Success (IPMS) of Ethiopian Farmers<br />
Project, International Livestock Research Institute (ILRI), Addis Ababa, Ethiopia<br />
Lisanework Nigatu, Haramaya University, Dire Dawa, Ethiopia<br />
Worku Teka, IPMS, ILRI, <strong>Metema</strong>, Ethiopia<br />
© 2010 International Livestock Research Institute (ILRI)<br />
This publication is copyrighted by the International Livestock Research<br />
Institute (ILRI). It is licensed for use under the Creative Commons Attribution-<br />
Noncommercial-Share Alike 3.0 Unported License. To view this license, visit http://<br />
creativecommons.org/licenses/by-nc-sa/3.0/. Unless otherwise noted, you are free to copy,<br />
duplicate, or reproduce, <strong>and</strong> distribute, display, or transmit any part of this publication<br />
or portions thereof without permission, <strong>and</strong> to make translations, adaptations, or other<br />
derivative works under the follow<strong>in</strong>g <strong>condition</strong>s:<br />
ATTRIBUTION. The work must be attributed, but not <strong>in</strong> any way that suggests<br />
endorsement by ILRI or the author(s).<br />
NON-COMMERCIAL. This work may not be used for commercial purposes.<br />
SHARE ALIKE. If this work is altered, transformed, or built upon, the result<strong>in</strong>g work<br />
must be distributed only under the same or similar license to this one.<br />
NOTICE:<br />
For any reuse or distribution, the license terms of this work must be made clear to others.<br />
Any of the above <strong>condition</strong>s can be waived if permission is obta<strong>in</strong>ed from the copyright<br />
holder.<br />
Noth<strong>in</strong>g <strong>in</strong> this license impairs or restricts the author’s moral rights.<br />
Fair deal<strong>in</strong>g <strong>and</strong> other rights are <strong>in</strong> no way affected by the above.<br />
The parts used must not misrepresent the mean<strong>in</strong>g of the publication. ILRI would appreciate<br />
be<strong>in</strong>g sent a copy of any materials <strong>in</strong> which text, photos etc. have been used.<br />
Edit<strong>in</strong>g, design <strong>and</strong> layout—ILRI Editorial <strong>and</strong> Publish<strong>in</strong>g Services, Addis Ababa, Ethiopia.<br />
Correct citation: Tesfaye Desalew, Azage Tegegne, Lisanework Nigatu, <strong>and</strong> Worku Teka.<br />
2010. <strong>Rangel<strong>and</strong></strong> <strong>condition</strong> <strong>and</strong> <strong>feed</strong> <strong>resources</strong> <strong>in</strong> <strong>Metema</strong> district, <strong>North</strong> Gondar Zone,<br />
Amhara Region, Ethiopia. IPMS (Improv<strong>in</strong>g Productivity <strong>and</strong> Market Success) of Ethiopian<br />
Farmers Project Work<strong>in</strong>g Paper 25. Nairobi, Kenya, ILRI.<br />
P O Box 30709, Nairobi 00100, Kenya<br />
Phone + 254 20 422 3000<br />
Email ILRI-Kenya@cgiar.org<br />
International Livestock Research Institute<br />
www.ilri.org<br />
P O Box 5689, Addis Ababa, Ethiopia<br />
Phone + 251 11 617 2000<br />
Email ILRI-Ethiopia@cgiar.org
Table of Contents<br />
List of Tables<br />
List of Figures<br />
Abbreviations<br />
Acknowledgements<br />
Abstract<br />
v<br />
vii<br />
viii<br />
ix<br />
x<br />
1 Introduction 1<br />
2 Background 3<br />
2.1 Livestock <strong>resources</strong> <strong>in</strong> Ethiopia 3<br />
2.2 <strong>Rangel<strong>and</strong></strong>s of Ethiopia 3<br />
2.3 Major livestock <strong>feed</strong> <strong>resources</strong> <strong>in</strong> Ethiopia 4<br />
2.4 Causes of rangel<strong>and</strong> degradation 6<br />
2.5 Factors affect<strong>in</strong>g rangel<strong>and</strong> vegetation 8<br />
2.6 Factors <strong>in</strong>fluenc<strong>in</strong>g vegetation composition of the rangel<strong>and</strong> 8<br />
2.7 Range <strong>condition</strong> assessment 10<br />
2.8 Biomass estimation methods 13<br />
3 Materials <strong>and</strong> methods 14<br />
3.1 Description of the study area 14<br />
3.2. Selection of kebeles <strong>and</strong> farmers 16<br />
3.3 <strong>Rangel<strong>and</strong></strong> <strong>condition</strong> assessment 16<br />
3.4 Evaluat<strong>in</strong>g the quality of major <strong>feed</strong> <strong>resources</strong> 20<br />
3.5 Statistical analysis 20<br />
4 Results <strong>and</strong> discussion 22<br />
4.1 Socio-economic <strong>condition</strong>s 22<br />
4.2 L<strong>and</strong> hold<strong>in</strong>g <strong>and</strong> l<strong>and</strong> use pattern 24<br />
4.3 Livestock hold<strong>in</strong>gs 25<br />
4.4 Livestock herd/flock structure 26<br />
4.5 Major <strong>feed</strong> <strong>resources</strong> 27<br />
4.6 Feed management <strong>and</strong> utilization practices 28<br />
iii
4.7 Availability of natural pasture 29<br />
4.8 Floristic composition 38<br />
4.9 Range <strong>condition</strong> assessment 47<br />
4.10 Biomass production 52<br />
4.11 Correlation among variables studied for range <strong>condition</strong> assessment 55<br />
5 Conclusion <strong>and</strong> recommendations 57<br />
5.1 Conclusion 57<br />
5.2 Recommendations 59<br />
References 61<br />
Appendices 65<br />
Appendix Table 1. Criteria for the scor<strong>in</strong>g of the different factors determ<strong>in</strong><strong>in</strong>g<br />
range <strong>condition</strong>s (Herbaceous vegetation <strong>and</strong> soil <strong>condition</strong>) 65<br />
Appendix Table 2. Criteria for the scor<strong>in</strong>g of the different factors determ<strong>in</strong><strong>in</strong>g<br />
range <strong>condition</strong>s 66<br />
Appendix Table 3. Common <strong>and</strong>/or dom<strong>in</strong>ant woody species <strong>and</strong> their percentage<br />
composition <strong>in</strong> the farm<strong>in</strong>g system of different graz<strong>in</strong>g areas 67<br />
Appendix Table 4. Herbaceous species identified <strong>in</strong> different farm<strong>in</strong>g system <strong>and</strong><br />
graz<strong>in</strong>g types of the district 68<br />
Appendix Table 5. Correlation matrix among variables studied <strong>in</strong> the communal<br />
graz<strong>in</strong>g areas of CLFS 69<br />
Appendix Table 6. Correlation matrixes among variables studied <strong>in</strong> the road side<br />
graz<strong>in</strong>g areas of CLFS 70<br />
Appendix Table 7. Correlation matrixes among variables studied <strong>in</strong> the enclosure<br />
areas of CLFS 71<br />
Appendix Table 8. Correlation matrix among variables studied <strong>in</strong> the graz<strong>in</strong>g<br />
areas of CLFS 72<br />
Appendix Table 9. Correlation matrixes among variables studied <strong>in</strong> the graz<strong>in</strong>g<br />
areas of SLFS 73<br />
Appendix Table 10. Correlation matrix among variables studied <strong>and</strong> their<br />
<strong>in</strong>teractions <strong>in</strong> range <strong>condition</strong> assessment <strong>in</strong> <strong>Metema</strong> 74<br />
iv
List of Tables<br />
Table 1. Livestock population <strong>and</strong> regional distribution <strong>in</strong> Ethiopia 3<br />
Table 2.<br />
Nutritional quality of major <strong>feed</strong> <strong>resources</strong> <strong>in</strong> <strong>Metema</strong> district<br />
as <strong>in</strong>fluenced by season 5<br />
Table 3. Experimental units used for analysis <strong>in</strong> each composite sample site 21<br />
Table 4.<br />
Sex, ethnic group, education, <strong>and</strong> major occupation of respondents<br />
<strong>in</strong> the cotton–livestock <strong>and</strong> sesame–livestock farm<strong>in</strong>g systems <strong>in</strong> <strong>Metema</strong><br />
district 22<br />
Table 5. Family size, age of respondents <strong>and</strong> family members <strong>in</strong> <strong>Metema</strong> district 23<br />
Table 6. Mean ± SE l<strong>and</strong> hold<strong>in</strong>g <strong>and</strong> l<strong>and</strong> use pattern <strong>in</strong> <strong>Metema</strong> district 25<br />
Table 7. Livestock hold<strong>in</strong>gs <strong>in</strong> TLU of the sampled households <strong>in</strong> <strong>Metema</strong> 26<br />
Table 8.<br />
Livestock herd structures <strong>in</strong> surveyed households by farm<strong>in</strong>g system<br />
<strong>in</strong> <strong>Metema</strong> 27<br />
Table 9. Major livestock <strong>feed</strong> <strong>resources</strong> <strong>and</strong> <strong>feed</strong><strong>in</strong>g systems <strong>in</strong> <strong>Metema</strong> district 28<br />
Table 10. Percentage response of respondents on availability of <strong>feed</strong> <strong>resources</strong><br />
<strong>in</strong> <strong>Metema</strong> 30<br />
Table 11. Estimates of gra<strong>in</strong> <strong>and</strong> crop residues production for major crops grown<br />
<strong>in</strong> <strong>Metema</strong> 31<br />
Table 12. Percentage of respondents us<strong>in</strong>g stubble graz<strong>in</strong>g by farm<strong>in</strong>g system<br />
<strong>in</strong> <strong>Metema</strong> 32<br />
Table 13. Percentages of respondents show<strong>in</strong>g the types <strong>and</strong> amount<br />
of supplementation of <strong>feed</strong>s <strong>in</strong> the two farm<strong>in</strong>g systems <strong>in</strong> <strong>Metema</strong> 33<br />
Table 14. Availability of different <strong>feed</strong> <strong>resources</strong> by month <strong>in</strong> the district 34<br />
Table 15. Chemical composition (Mean ± SE) of different <strong>feed</strong>s <strong>in</strong> the study districts 34<br />
Table 16. Effect of season on chemical composition (Mean ± SE) of composite<br />
samples of dom<strong>in</strong>ant <strong>feed</strong> species <strong>in</strong> <strong>Metema</strong> 35<br />
Table 17. Estimates of <strong>feed</strong> balance <strong>in</strong> <strong>Metema</strong> district 36<br />
Table 18. Sources of water <strong>and</strong> water<strong>in</strong>g frequency by farm<strong>in</strong>g system for cattle<br />
<strong>in</strong> <strong>Metema</strong> (percentage of respondents) 37<br />
Table 19. Percentage of respondents show<strong>in</strong>g major problems to livestock<br />
production <strong>in</strong> <strong>Metema</strong> 37<br />
v
Table 20. Common <strong>and</strong> dom<strong>in</strong>ant grass species identified by farm<strong>in</strong>g systems<br />
<strong>and</strong> different graz<strong>in</strong>g types <strong>in</strong> <strong>Metema</strong> 39<br />
Table 21. Common <strong>and</strong> dom<strong>in</strong>ant woody species <strong>and</strong> their percentage<br />
composition by farm<strong>in</strong>g system <strong>in</strong> different graz<strong>in</strong>g areas <strong>in</strong> <strong>Metema</strong> 40<br />
Table 22. Percentage of height class (metres) distribution of trees <strong>and</strong> shrubs<br />
<strong>in</strong> <strong>Metema</strong> 41<br />
Table 23. Herbaceous species composition (% DM biomass) <strong>and</strong> their desirability<br />
by graz<strong>in</strong>g type <strong>in</strong> cotton–livestock farm<strong>in</strong>g system <strong>in</strong> <strong>Metema</strong> 42<br />
Table 24. Woody species <strong>and</strong> percentage composition <strong>in</strong> different graz<strong>in</strong>g system<br />
<strong>in</strong> cotton–livestock farm<strong>in</strong>g system <strong>in</strong> <strong>Metema</strong> 44<br />
Table 25. Herbaceous species composition (% DM biomass) <strong>and</strong> their desirability<br />
by graz<strong>in</strong>g type <strong>in</strong> sesame–livestock farm<strong>in</strong>g system <strong>in</strong> <strong>Metema</strong> 45<br />
Table 26. Woody species <strong>in</strong> the sesame based farm<strong>in</strong>g system by graz<strong>in</strong>g type<br />
<strong>in</strong> sesame–livestock farm<strong>in</strong>g system (SLFS) 47<br />
Table 27. Range <strong>condition</strong> score (Mean ± SE) of communal graz<strong>in</strong>g areas<br />
by farm<strong>in</strong>g system <strong>in</strong> <strong>Metema</strong> 48<br />
Table 28. Range <strong>condition</strong> score (Mean ± SE) for road side graz<strong>in</strong>g areas found<br />
<strong>in</strong> different farm<strong>in</strong>g systems of the study district 50<br />
Table 29. Range <strong>condition</strong> score (LSM ± SE) <strong>in</strong> enclosure graz<strong>in</strong>g areas<br />
by farm<strong>in</strong>g system <strong>in</strong> <strong>Metema</strong> 51<br />
Table 30. Dry matter biomass (kg/ha) of the communal graz<strong>in</strong>g areas by farm<strong>in</strong>g<br />
system <strong>in</strong> <strong>Metema</strong> district 52<br />
Table 31. Dry matter biomass (kg/ha) of the road side graz<strong>in</strong>g areas by farm<strong>in</strong>g<br />
system <strong>in</strong> <strong>Metema</strong> 53<br />
Table 32. Dry biomass (kg/ha) of enclosure graz<strong>in</strong>g areas by farm<strong>in</strong>g system<br />
<strong>in</strong> <strong>Metema</strong> 54<br />
vi
List of Figures<br />
Figure 1. Location of <strong>Metema</strong> woreda <strong>in</strong> Ethiopia 14<br />
Figure 2. Regression graph of dry matter biomass <strong>and</strong> range <strong>condition</strong> 55<br />
Appendix Figure 1. <strong>Metema</strong> district farm<strong>in</strong>g systems 75<br />
Appendix Figure 2. L<strong>and</strong> use <strong>and</strong> l<strong>and</strong> cover of <strong>Metema</strong> district 75<br />
Appendix Figure 3.<br />
The view of communal graz<strong>in</strong>g l<strong>and</strong>s at the dry season prior<br />
to flash burn<strong>in</strong>g 76<br />
Appendix Figure 4. The view of communal graz<strong>in</strong>g l<strong>and</strong>s at peak dry season 76<br />
Appendix Figure 5.<br />
Partial view of communal graz<strong>in</strong>g l<strong>and</strong>s <strong>in</strong> the sesame-based<br />
farm<strong>in</strong>g system 77<br />
Appendix Figure 6. Hay storage <strong>in</strong> open field 77<br />
Appendix Figure 7.<br />
Appendix Figure 8.<br />
P. spheslatum grass dom<strong>in</strong>ated communal graz<strong>in</strong>g l<strong>and</strong><br />
at SLFS 78<br />
Part of an enclosure site <strong>in</strong> the sesame–livestock farm<strong>in</strong>g<br />
system (Agam wuha) 78<br />
Appendix Figure 9. Communal graz<strong>in</strong>g l<strong>and</strong> after flash burn<strong>in</strong>g 79<br />
Appendix Figure 10. H. rufa grass dom<strong>in</strong>ated wood l<strong>and</strong> (Guange river side areas) 79<br />
vii
Abbreviations<br />
ADF<br />
ADL<br />
AEZ<br />
ANOVA<br />
ANRS<br />
AOAC<br />
BOA<br />
CACC<br />
CBFS<br />
CRs<br />
CSA<br />
DCP<br />
DM<br />
FAO<br />
GLM<br />
ha<br />
HHC<br />
HH<br />
ILCA<br />
ILRI<br />
IVDMD<br />
LSM<br />
masl<br />
ME<br />
MOA<br />
NDF<br />
OoARD<br />
OM<br />
PAs<br />
SE<br />
SBFS<br />
SPSS<br />
SSA<br />
SRM<br />
t<br />
TLU<br />
Acid Detergent Fibre<br />
Acid Detergent Lign<strong>in</strong><br />
Agro-ecological Zone<br />
Analysis of Variance<br />
Amhara National Regional State<br />
Association of Official Analytical Chemist<br />
Bureau of Agriculture<br />
Central Agricultural Census Commission<br />
Cotton Based Farm<strong>in</strong>g System<br />
Crop Residues<br />
Central Statistic Authority<br />
Digestible Crude Prote<strong>in</strong><br />
Dry Matter<br />
Food <strong>and</strong> Agriculture Organization of the United Nations<br />
General L<strong>in</strong>ear Model<br />
hectare<br />
Household Count<br />
Household<br />
International Livestock Center for Africa<br />
International Livestock Research Institute<br />
Invitro Dry Matter Digestibility<br />
Least square mean<br />
Metre above sea level<br />
Metabolizable Energy<br />
M<strong>in</strong>istry of Agriculture<br />
Neutral Detergent Fibre<br />
Office of Agriculture <strong>and</strong> Rural Development<br />
Organic Matter<br />
Peasant Associations<br />
St<strong>and</strong>ard error<br />
Sesame Based Farm<strong>in</strong>g System<br />
Statistical Package for Social Science<br />
Sub-Saharan Africa<br />
Society of Range Management<br />
tonne<br />
Tropical Livestock Unit<br />
viii
Acknowledgements<br />
The authors would like to extend their appreciation to the contributions of Solomon<br />
Legesse, Research <strong>and</strong> Development Assistant (RDA) <strong>and</strong> Teklehymanot Seyoum (driver)<br />
<strong>in</strong> IPMS <strong>Metema</strong> PLW, Ato Dawit Negassa <strong>and</strong> Ato Mulugeta Habte-Michael at the<br />
ILRI nutrition laboratory <strong>and</strong> Ato Yas<strong>in</strong> Getahun, IPMS GIS technician. The assistance<br />
of Ato Melaku Wondafrash at the National Herbarium, Addia Ababa University, <strong>in</strong> the<br />
identification of vegetation specimens is duely acknowledged. Ato Meseret Adane,<br />
<strong>Metema</strong> district computer technician, for his k<strong>in</strong>d cooperation to use the <strong>in</strong>ternet, is<br />
highly acknowledged. Deep appreciation <strong>and</strong> thanks goes to all the staff members of<br />
<strong>Metema</strong> Office of Agriculture <strong>and</strong> Rural Development, for their k<strong>in</strong>d cooperation <strong>and</strong><br />
provision of all the relevant <strong>in</strong>formation. S<strong>in</strong>cere appreciation <strong>and</strong> thanks also goes to<br />
Aderajew Molla, Bekele Kerebih, Tesfaye Mengistie <strong>and</strong> Solomon Nega for their technical<br />
support <strong>and</strong> encouragement dur<strong>in</strong>g the study. Last but not least, we would also like to<br />
thank the farmers <strong>in</strong> <strong>Metema</strong> for their full cooperation <strong>and</strong> contribution to the study.<br />
ix
Abstract<br />
The study was conducted <strong>in</strong> 2006/07 <strong>in</strong> <strong>Metema</strong> district, <strong>North</strong> Gondar Zone of Amhara<br />
region, Ethiopia, with the objectives to characterize the exist<strong>in</strong>g rangel<strong>and</strong> <strong>and</strong> to<br />
determ<strong>in</strong>e the <strong>feed</strong> <strong>resources</strong> utilization practices, to assess the natural graz<strong>in</strong>g l<strong>and</strong><br />
<strong>condition</strong> based on herbaceous, woody <strong>and</strong> soil <strong>condition</strong> <strong>and</strong> to evaluate the chemical<br />
composition of major livestock <strong>feed</strong> <strong>resources</strong> of the area. A s<strong>in</strong>gle-visit formal survey,<br />
group discussions <strong>and</strong> visual observations are used to collect the primary <strong>in</strong>formation<br />
<strong>and</strong> secondary sources are also used <strong>in</strong> livestock <strong>feed</strong> <strong>resources</strong> assessment of the<br />
district. A total of 140 respondents from 7 kebeles were selected for <strong>in</strong>terview<strong>in</strong>g by<br />
stratified r<strong>and</strong>om sampl<strong>in</strong>g techniques. To assess the range <strong>condition</strong>s, the samples<br />
were collected by classify<strong>in</strong>g the district <strong>in</strong>to cotton–livestock <strong>and</strong> sesame–livestock<br />
farm<strong>in</strong>g systems. With<strong>in</strong> a farm<strong>in</strong>g system, graz<strong>in</strong>g l<strong>and</strong>s were further stratified <strong>in</strong>to three<br />
sampl<strong>in</strong>g areas: communal, road side <strong>and</strong> enclosure graz<strong>in</strong>g areas. In each of the range<br />
sites a sampl<strong>in</strong>g block of 4 km × 1 km was demarcated <strong>and</strong> this was further stratified<br />
<strong>in</strong>to four sampl<strong>in</strong>g plots of equal size. In each of the plot, a belt transects of 50 m × 4 m<br />
was laid out r<strong>and</strong>omly. Then, the parameter used for (herbaceous, soil <strong>and</strong> woody) grass<br />
species composition, basal cover, litter cover, soil erosion, soil compaction, seedl<strong>in</strong>g<br />
count, age distribution <strong>and</strong> woody density enumeration, canopy cover <strong>and</strong> hedg<strong>in</strong>g<br />
were determ<strong>in</strong>ed. For the height classes 1–3 m, >3–4.5 m <strong>and</strong> >4.5 m was<br />
used. Feed samples were stratified by season <strong>and</strong> types <strong>and</strong> subjected to chemical<br />
analysis for determ<strong>in</strong>ation of DM, ash, CP, ADF, ADL <strong>and</strong> IVDMD. About 83% of the<br />
<strong>in</strong>habitants <strong>in</strong> the district practice mixed crop–livestock farm<strong>in</strong>g system. The mean family<br />
size is 5.31 ± 0.20 persons per household, while the average l<strong>and</strong> hold<strong>in</strong>g is 6.78 ±<br />
1.33 ha/household. The mean livestock hold<strong>in</strong>g per household is 12.52 ± 6.23 TLU,<br />
<strong>and</strong> is composed of cattle, goats, sheep, donkeys <strong>and</strong> camels. Natural pasture (55.7%),<br />
crop residues (20.7%), stubble (14.3%) <strong>and</strong> hay (9.3%) are the major <strong>feed</strong> <strong>resources</strong><br />
for dry season whereas <strong>in</strong> the wet season only natural pasture serves as <strong>feed</strong> resource.<br />
The total estimated DM yield of graz<strong>in</strong>g l<strong>and</strong> <strong>and</strong> stubble is 780,750 <strong>and</strong> 51,954 t DM<br />
per annum, respectively. The total estimated available <strong>feed</strong> supply is 833,531.2 t DM<br />
per annum. Of the identified 33 herbaceous species, 14 <strong>and</strong> 19 are different grasses<br />
<strong>and</strong> non-grass species. From the non-grass species 6 legumes <strong>and</strong> 13 sedges <strong>and</strong> other<br />
species are recorded. Of the grasses, 23.07%, 38.46% <strong>and</strong> 30.77% are highly desirable,<br />
desirable <strong>and</strong> less desirable, respectively. Of the identified 20 woody species, 15%,<br />
35%, <strong>and</strong> 50% are highly desirable, desirable <strong>and</strong> less desirable, respectively. The largest<br />
proportion of woody vegetation is contributed by different species of acacia (20%)<br />
<strong>and</strong> commbretum (10%). Trees <strong>and</strong> shrubs grouped with<strong>in</strong> the height class of >1–3 m<br />
constituted 41.2% <strong>in</strong> communal graz<strong>in</strong>g areas, 38.5% <strong>in</strong> road side graz<strong>in</strong>g <strong>and</strong> 33.3%<br />
x
<strong>in</strong> enclosures. Range <strong>condition</strong> assessment factors such as basal cover, litter cover,<br />
grass species composition, woody vegetation density, canopy cover, hedg<strong>in</strong>g effect, age<br />
distribution <strong>and</strong> total <strong>condition</strong> score are significant (P
1 Introduction<br />
Ethiopia, with its diverse climate <strong>and</strong> topography, is a country with wide <strong>resources</strong> <strong>and</strong><br />
traditional skill <strong>and</strong> experience <strong>in</strong> livestock rear<strong>in</strong>g (Ayana 1999). About 62% of the total<br />
l<strong>and</strong> surface <strong>in</strong> the country is suitable for graz<strong>in</strong>g (Mengistu 1998). In most develop<strong>in</strong>g<br />
countries, rangel<strong>and</strong>s have contributed to the major portion of <strong>feed</strong> consumed by<br />
rum<strong>in</strong>ants. In Ethiopia more than 90% of the rum<strong>in</strong>ant livestock <strong>feed</strong> on natural pastures,<br />
which vary <strong>in</strong> composition depend<strong>in</strong>g on the agro-ecology (Alemayehu 2005). <strong>Rangel<strong>and</strong></strong><br />
is def<strong>in</strong>ed as l<strong>and</strong> produc<strong>in</strong>g natural forage for animal consumption (Coppock 1994).<br />
Most rangel<strong>and</strong>s are at best only marg<strong>in</strong>ally suitable for arable cropp<strong>in</strong>g, <strong>and</strong> <strong>in</strong> Ethiopia<br />
there are extensive areas where livestock rais<strong>in</strong>g on the natural vegetation is the only<br />
possible types of l<strong>and</strong> use.<br />
The lowl<strong>and</strong>s of the country are found below 1500 metre above sea level (masl) <strong>and</strong><br />
are estimated to cover about 78 million hectares, which is about 61–65% of the total<br />
l<strong>and</strong> area of the country (Friedel et al. 2000). They are home for about 12% of the human<br />
<strong>and</strong> 26% of the livestock population (Beruk <strong>and</strong> Tafesse 2000). Pastoral communities<br />
dom<strong>in</strong>ate the lowl<strong>and</strong> areas of the country. Low human population density <strong>and</strong> highly<br />
variable <strong>and</strong> uncerta<strong>in</strong> ra<strong>in</strong>fall characterize the lowl<strong>and</strong> areas. In the pastoral community,<br />
graz<strong>in</strong>g biomass is entirely determ<strong>in</strong>ed by the amount, pattern <strong>and</strong> tim<strong>in</strong>g of ra<strong>in</strong>fall.<br />
The rangel<strong>and</strong>s are presently undergo<strong>in</strong>g extensive deterioration both <strong>in</strong> quantity<br />
<strong>and</strong> quality (Belaynesh 2006). The rangel<strong>and</strong>s have limited capabilities <strong>in</strong> vegetative<br />
production <strong>and</strong> <strong>in</strong> provid<strong>in</strong>g reasonable animal sustenance <strong>and</strong> production due primarily<br />
to adverse environments <strong>in</strong>clud<strong>in</strong>g low <strong>and</strong> seasonal ra<strong>in</strong>fall; moisture gather<strong>in</strong>g w<strong>in</strong>ds;<br />
vary<strong>in</strong>g degrees of poor soil; soil erosion; lack of or <strong>in</strong>adequate forage <strong>and</strong> graz<strong>in</strong>g<br />
management; <strong>and</strong> overstock<strong>in</strong>g rates (Alemayehu 2005). Intensity of graz<strong>in</strong>g <strong>and</strong><br />
brows<strong>in</strong>g <strong>and</strong> restriction of livestock mobility have more serious consequences on the<br />
rangel<strong>and</strong>s than the number of animals owned by the pastoralists. Community structure is<br />
vastly altered when improper graz<strong>in</strong>g cont<strong>in</strong>ues for long periods (Holcheck et al. 1998).<br />
In seasonally dry environments, the ma<strong>in</strong> limitations to animal production are the lack<br />
of green <strong>feed</strong> for at least half of the year coupled with the low nutritive quality of forages<br />
dur<strong>in</strong>g most of the active pasture growth period (Alemayehu 2005). The low nutritive<br />
quality of the forage dur<strong>in</strong>g the growth period is ma<strong>in</strong>ly due to environmental stresses<br />
such as high temperatures <strong>and</strong> <strong>in</strong>fertile soils (van Soest 1988). The major determ<strong>in</strong>ant of<br />
livestock productivity is dry-matter <strong>in</strong>take which, <strong>in</strong> turn, is <strong>in</strong>fluenced by the palatability,<br />
chemical composition <strong>and</strong> physical attributes of the diet, provided that the livestock are<br />
disease-free. The chemical composition of the fibre is important <strong>in</strong> provid<strong>in</strong>g <strong>in</strong>dications<br />
of fermentation rates. However, <strong>in</strong>teractions between the environment <strong>and</strong> plant<br />
1
physiology <strong>and</strong> growth are sufficient to render associations between fibre components<br />
<strong>and</strong> nutritive value unreliable (van Soest 1988).<br />
The Amhara Regional State is located <strong>in</strong> the northwestern part of the Ethiopia. The region<br />
covers about one-eighth of the total area of the country <strong>and</strong> is home to about 27% of the<br />
total human <strong>and</strong> 35% of the total livestock population (BoA 1999; Befekadu <strong>and</strong> Berhanu<br />
2000). The study area (<strong>Metema</strong>) district is one of the 104 districts of the Regional State,<br />
which is found <strong>in</strong> <strong>North</strong> Gondar Adm<strong>in</strong>istrative Zone border<strong>in</strong>g the Sudan. The district is<br />
broadly characterized as lowl<strong>and</strong> agro-ecology, <strong>and</strong> livestock production is an <strong>in</strong>tegral<br />
part of the l<strong>and</strong> use system. Cattle <strong>and</strong> goat rear<strong>in</strong>g is a common practice. The area has<br />
relatively high potential natural pasture dur<strong>in</strong>g the wet season (IPMS 2005; Elias et al.<br />
2007) Accord<strong>in</strong>g to Sisay (2006), the major livestock <strong>feed</strong>s available <strong>in</strong> the study areas are<br />
natural pasture, crop residues, crop aftermath <strong>and</strong> hay. Based on his estimation, the mean<br />
utilizable DM biomass of crop residues <strong>in</strong> the study areas was 3.68 t per household.<br />
Furthermore, the total ME (Metabolizable Energy), <strong>and</strong> DCP (Digestible Crude Prote<strong>in</strong>)<br />
produced <strong>in</strong> the district were 76,636.81 MJ <strong>and</strong> 736.75 kg, respectively which could<br />
satisfy the nutrient requirements of the livestock owned per household. These results may<br />
hold true for the wet season because of the availability of extensive graz<strong>in</strong>g l<strong>and</strong> <strong>in</strong> the<br />
area as compared to the district’s livestock population. Feed shortage <strong>in</strong> the dry season is<br />
becom<strong>in</strong>g a serious problem <strong>and</strong> the situation of the area is chang<strong>in</strong>g very fast because of<br />
the current resettlement program <strong>and</strong> the large number of seasonal transhumant livestock<br />
movement from the neighbour<strong>in</strong>g three highl<strong>and</strong> districts (Chilga, Dembia <strong>and</strong> Gondar<br />
Zuria) <strong>in</strong>to the district. The population pressure is undoubtedly <strong>in</strong>creas<strong>in</strong>g result<strong>in</strong>g <strong>in</strong><br />
deforestation, encroachment of farml<strong>and</strong>s <strong>in</strong>to forest areas, <strong>and</strong> dim<strong>in</strong>ish<strong>in</strong>g graz<strong>in</strong>g<br />
l<strong>and</strong>s. The poor <strong>feed</strong> conservation practice of the community has also resulted <strong>in</strong> decl<strong>in</strong>e<br />
of the potential of the rangel<strong>and</strong>s <strong>and</strong> has exacerbated the <strong>feed</strong> shortage, particularly<br />
dur<strong>in</strong>g the dry season. Accord<strong>in</strong>g to Sisay (2006), the number of livestock <strong>and</strong> the<br />
available <strong>feed</strong> <strong>resources</strong> is not proportional to be beneficial for livestock rear<strong>in</strong>g.<br />
Absence of adequate basel<strong>in</strong>e <strong>in</strong>formation about the rangel<strong>and</strong> <strong>resources</strong> is considered<br />
as one of the bottlenecks for development of rangel<strong>and</strong>s <strong>in</strong> Ethiopia (Amsalu 2000). Thus,<br />
to ensure susta<strong>in</strong>able use <strong>and</strong> development, characterization of the rangel<strong>and</strong> <strong>condition</strong>,<br />
assess<strong>in</strong>g <strong>and</strong> identify<strong>in</strong>g the major <strong>feed</strong> <strong>resources</strong> of the area is imperative. This study<br />
was therefore undertaken to generate <strong>in</strong>formation on the rangel<strong>and</strong> <strong>resources</strong>, to<br />
characterize the exist<strong>in</strong>g rangel<strong>and</strong>, to assess the natural graz<strong>in</strong>g l<strong>and</strong> <strong>condition</strong> based on<br />
herbaceous, woody <strong>and</strong> soil <strong>condition</strong>, to determ<strong>in</strong>e the major <strong>feed</strong> <strong>resources</strong>, to evaluate<br />
their nutritive value <strong>and</strong> their utilization practices, <strong>and</strong> to forward suggestions for future<br />
susta<strong>in</strong>able management of the rangel<strong>and</strong>s. A number of districts <strong>in</strong> Tigray <strong>and</strong> Amhara<br />
Regional States have similar agro-ecology to <strong>Metema</strong>, <strong>and</strong> the results of this study will<br />
have broader relevance to the large area of the lowl<strong>and</strong>s of northwestern Ethiopia.<br />
2
2 Background<br />
2.1 Livestock <strong>resources</strong> <strong>in</strong> Ethiopia<br />
Although statistical data on livestock <strong>in</strong> Ethiopia have never been consistent, the latest<br />
estimates <strong>in</strong>dicated that Ethiopia has the largest livestock population <strong>and</strong> the highest<br />
draught animal population <strong>in</strong> the African cont<strong>in</strong>ent. Data on Ethiopian livestock <strong>resources</strong><br />
are presented <strong>in</strong> Table 1. Despite its huge numbers, the livestock subsector <strong>in</strong> Ethiopia<br />
is not as productive as compared to its great potential <strong>and</strong> the direct contribution to the<br />
national economy is very limited. The poor genetic potential for productive traits, <strong>in</strong><br />
comb<strong>in</strong>ation with the suboptional general management situation that the animals are<br />
exposed to are the ma<strong>in</strong> contributors to the low productivity.<br />
Table 1. Livestock population <strong>and</strong> regional distribution <strong>in</strong> Ethiopia<br />
Region<br />
Thous<strong>and</strong> heads<br />
Cattle Sheep Goats Equ<strong>in</strong>es Camels<br />
Tigray 3103 1376 3107 476 32<br />
Afar 473 403 801 26 171<br />
Amhara 12,748 8987 6022 2438 50<br />
Oromia 2245 9098 7439 3738 255<br />
Somali 620 1162 283 96 24<br />
Benishangul Gumuz 411 84 321 49 –<br />
SNNPR 9263 3838 2626 732 –<br />
Gambela 130 17 31 – –<br />
Harari 44 4 36 8 –<br />
Dire Dawa 48 43 122 13 5<br />
Ethiopia—Total 49,297 25,017 21,884 7209 759<br />
Source: CSA survey (2008/09).<br />
2.2 <strong>Rangel<strong>and</strong></strong>s of Ethiopia<br />
Natural vegetation <strong>in</strong>tegration reflects the whole of the natural environment. If<br />
topography, geology <strong>and</strong> soil are not altered markedly, the change <strong>in</strong> vegetation<br />
usually reflects a change <strong>in</strong> ra<strong>in</strong>fall (Alemayehu 2005; Abule et al. 2007a). Basically,<br />
the vegetation of an area is a product of the material available <strong>and</strong> the environmental<br />
<strong>condition</strong>s prevail<strong>in</strong>g. The latter <strong>in</strong>cludes the environment, l<strong>and</strong>form, soil, climate <strong>and</strong><br />
factors such as fire <strong>and</strong> graz<strong>in</strong>g <strong>and</strong> modification, circulation of m<strong>in</strong>erals <strong>and</strong> plant<br />
decay. Furthermore, for a complete underst<strong>and</strong><strong>in</strong>g of vegetation, it is necessary to<br />
consider the past as well as the present, for each sample of vegetation have a history<br />
<strong>and</strong> a background of plant colonization <strong>and</strong> succession. Often, of course, the present<br />
vegetation represents a stage of regression from a more highly developed or vigorous<br />
community that has been brought under stress, perhaps through overgraz<strong>in</strong>g.<br />
3
The pastoral rangel<strong>and</strong>s of Ethiopia are located around the peripheral or the outer edge<br />
of the country, almost surround<strong>in</strong>g the central highl<strong>and</strong> mass (Alemayehu 2004). The<br />
areas are classified as marg<strong>in</strong>al arable <strong>and</strong> non-arable l<strong>and</strong> <strong>and</strong> comprise about 62%<br />
(767,600 km 2) of the country’s l<strong>and</strong> area. Most of these areas are below 1500 metres<br />
above sea level (masl) with the southwest <strong>and</strong> the southeastern areas hav<strong>in</strong>g an altitude<br />
of around 1000 masl <strong>and</strong> the southeastern <strong>and</strong> southwestern rangel<strong>and</strong>s ris<strong>in</strong>g up to<br />
1700 masl (Kidane 1993). Climate <strong>in</strong> the lowl<strong>and</strong>s <strong>in</strong>cludes arid (64%), semi-arid (21%)<br />
<strong>and</strong> subhumid (15%) zones largely def<strong>in</strong>ed by four ra<strong>in</strong>falls <strong>and</strong> temperature regimes.<br />
These zones vary markedly <strong>in</strong> terms of number of plant grow<strong>in</strong>g days per year, forage<br />
production, common plant associations, livestock <strong>and</strong> human carry<strong>in</strong>g capacities <strong>and</strong><br />
<strong>in</strong>cidence of important livestock diseases. Ethiopia has over 70 million heads of livestock,<br />
<strong>and</strong> the lowl<strong>and</strong>s are home to 12% of the human <strong>and</strong> 26% of the livestock population<br />
(CSA 2009). Various forms of pastoralism <strong>and</strong> agropastoralism dom<strong>in</strong>ate. Livestock<br />
depend upon rangel<strong>and</strong>s consist<strong>in</strong>g of native vegetation, with crop residues <strong>in</strong>creas<strong>in</strong>g <strong>in</strong><br />
importance as livestock <strong>feed</strong> as annual ra<strong>in</strong>fall <strong>in</strong>creases. Accord<strong>in</strong>g to Coppock (1994),<br />
calculated for the lowl<strong>and</strong>s overall, roughly six people/km² are dependent on 11 Tropical<br />
Livestock Units (TLUs), which are composed of cattle (49%), goats (16%), equ<strong>in</strong>es (16%),<br />
camels (12%) <strong>and</strong> sheep (7%). In contrast, the highl<strong>and</strong>s support 72 people/km² <strong>and</strong><br />
dependent on 44 TLUs/km² which are dom<strong>in</strong>ated by cattle (76%), equ<strong>in</strong>es (14%), sheep<br />
(8%) <strong>and</strong> goats (2%). Thus, although the lowl<strong>and</strong>s comprise over 50% more l<strong>and</strong> area<br />
than the highl<strong>and</strong>s, the lowl<strong>and</strong>s have only 40% as many TLUs at one-quarter the density.<br />
2.3 Major livestock <strong>feed</strong> <strong>resources</strong> <strong>in</strong> Ethiopia<br />
The major livestock <strong>feed</strong> <strong>resources</strong> <strong>in</strong> Ethiopia are natural graz<strong>in</strong>g <strong>and</strong> browse, crop<br />
residues, improved pasture, <strong>and</strong> agro-<strong>in</strong>dustrial by-products (Alemayehu 2004). The<br />
<strong>feed</strong><strong>in</strong>g systems <strong>in</strong>clude communal or private natural graz<strong>in</strong>g <strong>and</strong> brows<strong>in</strong>g, provision<br />
of crop residues <strong>and</strong> cut-<strong>and</strong>-carry <strong>feed</strong><strong>in</strong>g. At present, stock are fed almost entirely on<br />
natural pasture <strong>and</strong> crop residues. Livestock are grazed on permanent pastures, fallow<br />
l<strong>and</strong> <strong>and</strong> cropl<strong>and</strong> aftermath (Alemayehu 2004; Abule et al. 2007a).<br />
2.3.1 Feed availability <strong>and</strong> nutritive value of range forage<br />
Feed availability<br />
Natural pasture comprises the largest <strong>feed</strong> resource <strong>and</strong> estimates of its contribution to<br />
overall <strong>feed</strong> resource vary greatly. This is because the quantity <strong>and</strong> quality of native pasture<br />
varies with altitude, ra<strong>in</strong>fall, soil <strong>and</strong> cropp<strong>in</strong>g <strong>in</strong>tensity. Seasonal fluctuations of <strong>feed</strong><br />
<strong>resources</strong> <strong>in</strong> the tropics also follow the pattern of vegetation growth which is modified by<br />
4
availability of ra<strong>in</strong>fall. Alemayehu (1998) estimated that about 80–85% of the rum<strong>in</strong>ant <strong>feed</strong><br />
<strong>in</strong> Ethiopia comes from natural pasture. The total area of graz<strong>in</strong>g <strong>and</strong> brows<strong>in</strong>g is estimated<br />
at 62,280 million hectares, of which 12% is <strong>in</strong> the crop farm<strong>in</strong>g areas (with more than 600<br />
mm ra<strong>in</strong>fall) <strong>and</strong> the rest around the pastoral areas (Alemayehu 2005). Communal graz<strong>in</strong>g<br />
is managed as a common property resource. Estimat<strong>in</strong>g carry<strong>in</strong>g capacity, if calculated<br />
on plant availability, should allow a plant use of 30–50% (de Leeuw <strong>and</strong> Toothill 1993).<br />
Important pr<strong>in</strong>ciples of rangel<strong>and</strong> management that affect <strong>feed</strong> availability <strong>in</strong>clude stock<strong>in</strong>g<br />
rate, rest, frequency of graz<strong>in</strong>g, top hamper <strong>and</strong> litter cover (Alemayehu 2005; Abule et al.<br />
2007a). Trees are an important component of the rangel<strong>and</strong>s <strong>and</strong> serve for environmental<br />
conservation; provide fuel wood <strong>and</strong> build<strong>in</strong>g materials. They are also important source of<br />
<strong>feed</strong> for browsers <strong>and</strong> their value of tree litter as <strong>feed</strong> <strong>and</strong> shade to livestock should not be<br />
underestimated (Alemayehu 2005; Abule et al. 2007a).<br />
Feed quality<br />
Chemical analysis of range forage plants serves as a comparative measure of differences<br />
between species <strong>and</strong> changes with season. Chemical analyses are also useful for<br />
measur<strong>in</strong>g differences on effect of stage of growth, <strong>and</strong> effect of site quality on chemical<br />
constituents. Simbaya (1998) reported that the quality of natural pastures is <strong>in</strong>fluenced<br />
by the absence of legume species <strong>in</strong> communal grassl<strong>and</strong>s. This limits the nutritional<br />
quality of available fodder <strong>and</strong> animals are thus unable to meet their prote<strong>in</strong>, energy<br />
<strong>and</strong> m<strong>in</strong>eral requirements. As suggested by Osuji et al. (1993), poor nutrition is one of<br />
the major constra<strong>in</strong>ts to livestock productivity <strong>in</strong> sub-Saharan Africa. This is because<br />
animals thrive predom<strong>in</strong>antly on high-fibre <strong>feed</strong>s (straws, stover <strong>and</strong> native pasture hay)<br />
which are deficient <strong>in</strong> nutrients (nitrogen, sulphur, m<strong>in</strong>erals, phosphorus etc.) essential for<br />
microbial fermentation. Consequently, the digestibility <strong>and</strong> <strong>in</strong>take of digestible nutrients<br />
are unavoidably low. Data on chemical composition of major <strong>feed</strong> <strong>resources</strong> as affected<br />
by season <strong>in</strong> <strong>Metema</strong> district are presented <strong>in</strong> Table 2.<br />
Table 2. Nutritional quality of major <strong>feed</strong> <strong>resources</strong> <strong>in</strong> <strong>Metema</strong> district as <strong>in</strong>fluenced by season<br />
Feed types Season<br />
% chemical composition<br />
DM ASH CP ADF ADL NDF IVDMD<br />
Natural pasture August 93.4 9.4 6.4 45.8 4.7 78.3 57.8<br />
October 94.1 10.3 5.7 47.8 5.5 78.5 56.9<br />
Fodder August 92.3 15.4 14.4 37.0 13.3 54.9 51.6<br />
October 92.9 8.6 13.2 40.6 13.2 54.5 47.9<br />
Hay 94.5 10.5 7.2 41.2 4.8 76.8 54.3<br />
Sorghum stover 92.4 7.9 3.1 44.9 6.3 75.5 46.9<br />
Teff straw 93.2 8.9 4.3 46.9 8.0 76.0 41.0<br />
Millet stover 92.4 9.8 4.2 44.2 5.9 72.3 52.8<br />
Source: Sisay (2006).<br />
5
Range forage varies <strong>in</strong> quality from time to time <strong>and</strong> from place to place. Plants are most<br />
nutritious dur<strong>in</strong>g the growth stages. Once mature, plants are subject to leach<strong>in</strong>g <strong>and</strong><br />
dilution of nutrients <strong>and</strong> reduction <strong>in</strong> nutritive value. Decl<strong>in</strong>es <strong>in</strong> nutrient composition<br />
<strong>and</strong> leach<strong>in</strong>g are especially serious <strong>in</strong> the case of herbaceous plants (Alemayehu<br />
2006). As plants mature, contents of crude prote<strong>in</strong>, readily digested carbohydrates <strong>and</strong><br />
phosphorus decrease, while contents of fibre, lign<strong>in</strong> <strong>and</strong> cellulose <strong>in</strong>crease (Osuji et<br />
al. 1993). Most grasses <strong>and</strong> tree leaves <strong>in</strong> arid environments are low <strong>in</strong> nutritive value<br />
because of high contents of lign<strong>in</strong> <strong>and</strong> relatively <strong>in</strong>digestible (compared with starch)<br />
cellulose <strong>and</strong> hemicellulose. The plants require such substances as an adaptation<br />
mechanism to protect themselves from high temperatures <strong>and</strong> evapotranspiration.<br />
Unfortunately, these substances reduce their nutritional content <strong>and</strong> digestibility (Mathur<br />
et al. 1991). The stage of growth, maturity of grasses <strong>and</strong> taste <strong>in</strong>fluence their nutritional<br />
value. Mathur et al. (1991) reported that cattle kept solely on graz<strong>in</strong>g mature grass<br />
exhibited loss <strong>in</strong> body weight dur<strong>in</strong>g the dry season. The use of some roughages is also<br />
limited by their low contents of prote<strong>in</strong> <strong>and</strong> digestible energy (Ncube <strong>and</strong> Mpofu 1994),<br />
especially as the season progresses. Further problems are caused by secondary factors<br />
such as ant<strong>in</strong>utritive or toxic constituents <strong>in</strong> the plants, which restrict acceptability of the<br />
diet (Osuji et al. 1993; Kumar <strong>and</strong> D’Mello 1995).<br />
Crop residues are roughages that become available as livestock <strong>feed</strong>s after crops have<br />
been harvested. Residues can usually be grouped by crop type such as cereals, gra<strong>in</strong><br />
legumes, roots <strong>and</strong> tubers. Apart from be<strong>in</strong>g a source of animal <strong>feed</strong>, residues are also<br />
used as build<strong>in</strong>g, roof<strong>in</strong>g <strong>and</strong> fenc<strong>in</strong>g materials, as fuel, <strong>and</strong> as fertilizer or surface mulch<br />
<strong>in</strong> cropl<strong>and</strong>. Their value when used as <strong>feed</strong> depends on the dem<strong>and</strong> from livestock<br />
owners, which varies with the overall supply <strong>and</strong> dem<strong>and</strong> situation for <strong>feed</strong>s. This <strong>in</strong> turn<br />
depends on the livestock density <strong>and</strong> the supply of other <strong>feed</strong> <strong>resources</strong>, <strong>in</strong> particular<br />
forages <strong>and</strong> browse from natural vegetation (de Leeuw <strong>and</strong> Rey 1995). The supply of crop<br />
residues is a function of the proportion of l<strong>and</strong> used for cropp<strong>in</strong>g <strong>and</strong> of the edible <strong>feed</strong><br />
yields per unit of l<strong>and</strong>, where consumable <strong>feed</strong> from the crop residues exceeds graz<strong>in</strong>g<br />
from natural pastures (expressed <strong>in</strong> tonne of dry matter per hectare, t DM/ha). Depend<strong>in</strong>g<br />
on the production system, expansion of cropl<strong>and</strong> may have a positive effect on overall<br />
<strong>feed</strong> supply<br />
2.4 Causes of rangel<strong>and</strong> degradation<br />
<strong>Rangel<strong>and</strong></strong> degradation may be def<strong>in</strong>ed as the loss of utility or potential utility or<br />
the reduction, loss or change of features of rangel<strong>and</strong> ecosystem, which cannot be<br />
replaced (Chrisholm <strong>and</strong> Dumsday 1987). In general, rangel<strong>and</strong> degradation implies a<br />
reduction <strong>in</strong> rank or status, which <strong>in</strong>cludes a loss of topsoil, a change to a simple floral/<br />
6
fauna composition or a transition from one organic form to a lower organic form, <strong>and</strong><br />
cont<strong>in</strong>uous reduction of productivity/biomass of the ecosystem. Generally, a lower<br />
biological diversity is supposed to occur <strong>in</strong> a degraded rangel<strong>and</strong>.<br />
2.4.1 Drought <strong>and</strong> shortage of ra<strong>in</strong><br />
Prolonged drought <strong>in</strong>clud<strong>in</strong>g shortage <strong>and</strong> erratic ra<strong>in</strong>fall can cause serious range<br />
degradation. Ra<strong>in</strong>fall dur<strong>in</strong>g drought is hardly adequate to allow grasses to grow <strong>and</strong><br />
unable to fill the surface water ponds (Coss<strong>in</strong>s <strong>and</strong> Upton 1988).<br />
2.4.2 Bush encroachment<br />
Overall, woody vegetation reduces grass cover through <strong>in</strong>creas<strong>in</strong>g competition for<br />
available water <strong>and</strong> nutrients <strong>and</strong> reduc<strong>in</strong>g light reach<strong>in</strong>g the grass layer. In addition to<br />
compet<strong>in</strong>g with grasses, these noxious woody plants are commonly thorny <strong>and</strong> thicket<br />
form<strong>in</strong>g <strong>and</strong> reduce the graz<strong>in</strong>g capacity of the rangel<strong>and</strong> (Alemayehu 2004). From<br />
rangel<strong>and</strong> management perspective, underst<strong>and</strong><strong>in</strong>g the factors that contribute to <strong>in</strong>vasion<br />
process of undesirable woody vegetation is important. Many factors may be <strong>in</strong>volved<br />
<strong>in</strong> bush encroachment. Overgraz<strong>in</strong>g, <strong>in</strong>clud<strong>in</strong>g high stock<strong>in</strong>g rates, is claimed to be the<br />
major problem <strong>and</strong> a high concentration of woody plants are found around water po<strong>in</strong>ts<br />
where stock<strong>in</strong>g densities <strong>and</strong> graz<strong>in</strong>g <strong>in</strong>tensities are relatively high (Coss<strong>in</strong>s <strong>and</strong> Upton<br />
1988). As reported by Archer (2003), the characteristics common to many woody species<br />
that <strong>in</strong>crease <strong>in</strong> grazed environments <strong>in</strong>clude high seed production, seeds that persist <strong>in</strong><br />
soil for many years, ability to disperse over long distances, ability to sprout follow<strong>in</strong>g top<br />
removal, tolerance to low levels of water <strong>and</strong> nutrients <strong>and</strong> low palatability. A report by<br />
Alemayehu (2004) <strong>in</strong>dicates that the ecological succession <strong>in</strong> the Borana rangel<strong>and</strong>s of<br />
Ethiopia <strong>in</strong>dicates that the potential of grassl<strong>and</strong> is threatened by bush encroachment <strong>in</strong><br />
many areas.<br />
2.4.3 Over population <strong>and</strong> overstock<strong>in</strong>g<br />
Increase <strong>in</strong> human population necessitates the <strong>in</strong>crease <strong>in</strong> livestock population <strong>in</strong><br />
rangel<strong>and</strong>s <strong>in</strong> order to ma<strong>in</strong>ta<strong>in</strong> survival. In pastoral areas of Ethiopia, the animal <strong>and</strong><br />
human populations are grow<strong>in</strong>g at an <strong>in</strong>creas<strong>in</strong>g rate, while the pasture resource on<br />
which they depend is limited or dim<strong>in</strong>ish<strong>in</strong>g both <strong>in</strong> terms of graz<strong>in</strong>g area <strong>and</strong> range<br />
productivity (Coppock 1994). These <strong>in</strong>creases <strong>in</strong> population <strong>and</strong> over stock<strong>in</strong>g are<br />
<strong>in</strong>creas<strong>in</strong>g the imbalances <strong>in</strong> the Borana range system <strong>and</strong> have already resulted <strong>in</strong> over<br />
graz<strong>in</strong>g <strong>and</strong> range degradation (Alemayehu 2004). Gamedo (2004) also reported that<br />
overgraz<strong>in</strong>g has been one of the major factors for rangel<strong>and</strong> degradation <strong>in</strong> Borana <strong>and</strong><br />
7
the relatively good rangel<strong>and</strong> <strong>condition</strong> <strong>in</strong> ranches <strong>and</strong> kalos may show the fact that<br />
overgraz<strong>in</strong>g has contributed to rangel<strong>and</strong> degradation.<br />
2.5 Factors affect<strong>in</strong>g rangel<strong>and</strong> vegetation<br />
2.5.1 Climate <strong>and</strong> soil<br />
Climate plays a primary role <strong>in</strong> determ<strong>in</strong><strong>in</strong>g the ma<strong>in</strong> types <strong>and</strong> growth responses of<br />
vegetation used for graz<strong>in</strong>g (Alemayehu 2004; 2005). The amount <strong>and</strong> distribution<br />
of ra<strong>in</strong>fall determ<strong>in</strong>e the form <strong>and</strong> productivity of the natural vegetation. Edaphic<br />
characteristics may substantially modify climatic factors <strong>in</strong> various ways. High natural soil<br />
fertility levels <strong>in</strong>crease the vegetation’s response to moisture while soil volume <strong>and</strong> water<br />
hold<strong>in</strong>g characteristics <strong>condition</strong> the soil water storage capacity. Surface characteristics<br />
determ<strong>in</strong><strong>in</strong>g run-off <strong>and</strong> <strong>in</strong>filtration of water, <strong>and</strong> subsurface characteristics determ<strong>in</strong>ed<br />
the level of dra<strong>in</strong>age. Over graz<strong>in</strong>g can lead to bareness <strong>and</strong> loss of topsoil by erosion<br />
to such an extent that the vegetation assumes a drier appearance than the ra<strong>in</strong>fall data<br />
suggests.<br />
2.5.2 Animal management<br />
Livestock graz<strong>in</strong>g can have profound impact on vegetation. The general pattern of<br />
graz<strong>in</strong>g-<strong>in</strong>duced vegetation change is well documented (Alemyehu 2004; 2005). It is<br />
known that less palatable plants <strong>in</strong>crease at the expense of more palatable species.<br />
Community structure is vastly altered when improper graz<strong>in</strong>g cont<strong>in</strong>ues for long period.<br />
The poor animal production experienced <strong>in</strong> rangel<strong>and</strong>s has long been attributed to the<br />
poor quality of forage. This is generally confirmed by chemical analysis of the range<br />
plants. However, sampl<strong>in</strong>g of such material often overlooked selective graz<strong>in</strong>g by<br />
animals between species <strong>and</strong> deferent parts of species <strong>and</strong> selectivity is of considerable<br />
importance (Holechek et al. 1994).<br />
2.6 Factors <strong>in</strong>fluenc<strong>in</strong>g vegetation composition<br />
of the rangel<strong>and</strong><br />
The species composition of rangel<strong>and</strong> varies depend<strong>in</strong>g on topography, climate <strong>and</strong><br />
soil types. Different grassl<strong>and</strong>s conta<strong>in</strong> various types of grasses, legumes, <strong>and</strong> other<br />
herbaceous species. The botanical composition of a plant community can change<br />
because of many factors, <strong>in</strong>clud<strong>in</strong>g altitude, graz<strong>in</strong>g practices, burn<strong>in</strong>g, drought, <strong>and</strong><br />
temperature effects, pest, <strong>and</strong> erosion. Depend<strong>in</strong>g on the nature of this compositional<br />
change, the productivity of an area (<strong>in</strong> terms of its capacity to support livestock) may<br />
8
change. A change <strong>in</strong> plant composition results because of the relative adaptability of<br />
different species to these <strong>in</strong>fluences (Alemyehu 2004; 2005).<br />
2.6.1 Effects of graz<strong>in</strong>g on vegetation composition<br />
Natural pasture communities are very complex consist<strong>in</strong>g of a large range of grasses,<br />
shrubs <strong>and</strong> herbaceous species among which only few species are palatable. Livestock<br />
are able to selectively graze a small proportion of the palatable herbage available <strong>and</strong><br />
ignore the undesirable ones. The most palatable species are selected first <strong>and</strong> closely<br />
defoliated. If the graz<strong>in</strong>g pressure is high, then a decl<strong>in</strong>e <strong>in</strong> the quality <strong>and</strong> productivity<br />
of rangel<strong>and</strong> occurs (Coss<strong>in</strong>s <strong>and</strong> Upton 1985). This causes reduced vigour, less seed<br />
production <strong>and</strong> eventually plant death. Overgraz<strong>in</strong>g can also lead to extensive sheet <strong>and</strong><br />
gully erosion (Alemyehu 2005). S<strong>in</strong>ce the whole of plant organism, leaves, stems, <strong>and</strong><br />
roots react to the degree of trampl<strong>in</strong>g or graz<strong>in</strong>g which it receives, a weaken<strong>in</strong>g of the top<br />
growth results <strong>in</strong> a lighter short root system that dies back from the bottom. Grass roots<br />
cont<strong>in</strong>ue normal growth when not more than about 40–50% of the vegetative parts are<br />
removed (grazed) dur<strong>in</strong>g the period of active growth. Therefore, the effects of overgraz<strong>in</strong>g<br />
can be overcome if rangel<strong>and</strong>s are properly managed. Accord<strong>in</strong>g to Laze <strong>and</strong> Swa<strong>in</strong><br />
(1969), grasses naturally need certa<strong>in</strong> rest periods to develop, to grow, to seed <strong>and</strong> to be<br />
able to build reserves for the next grow<strong>in</strong>g season.<br />
2.6.2 Response of plants to graz<strong>in</strong>g<br />
The response to graz<strong>in</strong>g by various plants is dependent on the reduced vigour of plants<br />
grazed repeatedly without the opportunity to replenish food reserves. It is also based<br />
on the high degree of selectivity exhibited by graz<strong>in</strong>g livestock. Cattle prefer grasses,<br />
sheep prefer forbs, deer prefer browse. With<strong>in</strong> each category, there are ice-cream plants<br />
(decreasers), which the graz<strong>in</strong>g animal will seek out. Repeated graz<strong>in</strong>g will have the same<br />
effect as repeated clipp<strong>in</strong>g. A third factor <strong>in</strong>dependent of the plant–animal <strong>in</strong>teraction is<br />
the presence or absence <strong>in</strong> the climax plant community. The classification of decreaser<br />
<strong>and</strong> <strong>in</strong>creaser is based largely on the preference exhibited by the livestock. This is<br />
dependent on two major criteria: (1) the range site <strong>and</strong> (2) the livestock. The range site<br />
is important because it limits the selectivity available. This expla<strong>in</strong>s why some plants<br />
are decreasers on one site <strong>and</strong> <strong>in</strong>creasers on another. In the first case they are the most<br />
palatable species, while <strong>in</strong> the second there are other plants that are more palatable. The<br />
k<strong>in</strong>d of livestock will determ<strong>in</strong>e general categories of preference.̕<br />
9
2.7 Range <strong>condition</strong> assessment<br />
Range <strong>condition</strong> is the present status of vegetation of a range site <strong>in</strong> relation to the climax<br />
(natural potential) plant community for that site. It is an expression of the relative degree<br />
to which the k<strong>in</strong>ds, proportions, <strong>and</strong> amounts of plants <strong>in</strong> a plant community resemble<br />
that of the climax plant community for the site (SRM 1999).<br />
Accord<strong>in</strong>g to Pratt <strong>and</strong> Gwynne (1977), range <strong>condition</strong> is the state <strong>and</strong> health of the<br />
range, which can be assessed on the basis of an area’s vegetation composition, plant<br />
vigour, ground cover <strong>and</strong> soil status. The concept of ‘<strong>condition</strong>’ implies that an optimal or<br />
desired vegetation cover (<strong>in</strong> terms of quantity <strong>and</strong> composition) exists for each particular<br />
l<strong>and</strong> system. However, s<strong>in</strong>ce it will often be uncerta<strong>in</strong> what the desired or ‘optimum’<br />
<strong>condition</strong> is (particularly <strong>in</strong> areas which have undergone misuse for a considerable period<br />
of time), <strong>and</strong> s<strong>in</strong>ce optimum range <strong>condition</strong> will differ accord<strong>in</strong>g to the manner <strong>in</strong> which<br />
the range is used (e.g. cattle, sheep, wildlife), the comparison used should be clearly<br />
stated as well as whether this is based on actual measurements or whether it is assumed.<br />
As cited by Amaha (2006), rangel<strong>and</strong> <strong>condition</strong> is a concept encompass<strong>in</strong>g the levels<br />
of specific <strong>in</strong>dicators such as plant species composition, vegetation cover (basal cover),<br />
forage production (productivity), l<strong>and</strong> <strong>condition</strong> (soil erosion <strong>and</strong> compaction) <strong>and</strong><br />
management at a particular location(s) aimed at susta<strong>in</strong>ed livestock production (Friedel et<br />
al. 2000).<br />
Accord<strong>in</strong>g to Mannetje et al. (1976), the determ<strong>in</strong>ation of the botanical composition<br />
of rangel<strong>and</strong> is important <strong>in</strong> underst<strong>and</strong><strong>in</strong>g the fodder value of <strong>in</strong>dividual species <strong>and</strong><br />
their reaction to biotic <strong>and</strong> edaphic factors, which may be expla<strong>in</strong>ed <strong>in</strong> terms of type of<br />
species, yield, <strong>and</strong> frequency of occurrence, density <strong>and</strong> basal cover. Plant dry matter<br />
yield is often directly related to animal production, while the other parameters are useful<br />
to describe <strong>and</strong> quantify the plant population <strong>and</strong> successional trends of the rangel<strong>and</strong><br />
vegetation (DuToit <strong>and</strong> Aucamp 1985) <strong>and</strong> to assess the rangel<strong>and</strong> <strong>condition</strong> (van der<br />
Westhuizen et al. 1999; 2001). Methods of classify<strong>in</strong>g range <strong>condition</strong> have emphasized<br />
species composition, growth form composition, forage productivity, a comb<strong>in</strong>ation of<br />
a number of different vegetation <strong>and</strong> soil attributes, such as cover, composition, vigour,<br />
palatability, litter <strong>and</strong> soil stability.<br />
If overuse is excessive or cont<strong>in</strong>ued over long periods of time, <strong>in</strong>vaders or undesirable<br />
plants are found. The <strong>in</strong>vader plants were thought to be absent <strong>in</strong> the orig<strong>in</strong>al vegetation<br />
but through graz<strong>in</strong>g pressure have replaced the decreaser <strong>and</strong> <strong>in</strong>creaser plants. In<br />
favourable years <strong>in</strong>vaders can provide considerable forage for a short period of time<br />
but sound range management cannot be based on this uncerta<strong>in</strong> forage production.<br />
10
The four classes of range <strong>condition</strong> are based on production percentages of decreaser<br />
<strong>and</strong> <strong>in</strong>creaser plants present on the site as compared to the orig<strong>in</strong>al vegetation. A site<br />
composed of decreasers <strong>and</strong> <strong>in</strong>creasers <strong>in</strong>dicates a high <strong>condition</strong> range. As decreasers<br />
on the site are replaced with <strong>in</strong>creaser <strong>and</strong> <strong>in</strong>vader plants, the site shows need of<br />
improvement. The four range <strong>condition</strong> classes are as follows:<br />
Excellent <strong>condition</strong>: 76–100% of allowable vegetation is mixture of orig<strong>in</strong>al highly<br />
palatable, desirable perennial decreasers <strong>and</strong> <strong>in</strong>creasers. Legumes <strong>and</strong> desirable forbs<br />
may be present.<br />
Good <strong>condition</strong>: 51–75% of vegetation is mixture of orig<strong>in</strong>al highly palatable, desirable<br />
perennial decreasers <strong>and</strong> <strong>in</strong>creasers. Some legumes <strong>and</strong> forbs may be present.<br />
Fair <strong>condition</strong>: 26–50% of allowable vegetation is mixture of orig<strong>in</strong>al highly palatable,<br />
desirable perennial decreasers <strong>and</strong> <strong>in</strong>creasers. Some legumes may occur, but most forbs<br />
are <strong>in</strong>creasers <strong>and</strong> <strong>in</strong>vaders. Overall vegetation appearance is shorter <strong>and</strong> amount of bare<br />
ground is <strong>in</strong>creas<strong>in</strong>g.<br />
Poor <strong>condition</strong>: less than 25% of all vegetation is composed of highly palatable, desirable<br />
perennial decreasers <strong>and</strong> <strong>in</strong>creasers. Invader plants <strong>and</strong> unallowable <strong>in</strong>creasers comprise<br />
majority of vegetation.<br />
2.7.1 Estimat<strong>in</strong>g range <strong>condition</strong><br />
Range <strong>condition</strong> refers to the present ecological status <strong>in</strong> terms of productivity of a<br />
vegetation community relative to its natural potential for particular range site <strong>and</strong> types<br />
of l<strong>and</strong> use (SRM 1999). In other words the concept ‘<strong>condition</strong>’ implies that an optimal<br />
or desired vegetation cover (<strong>in</strong> terms of quantity <strong>and</strong> composition) exists for each<br />
particular l<strong>and</strong> system. Range <strong>condition</strong> is based on the species composition of the plant<br />
community as estimated by the percentage of the total annual air-dry weight of each<br />
species. Species must be classified as decreasers, <strong>in</strong>creasers, or <strong>in</strong>vaders. Each species has<br />
an allowable percentage that occurred <strong>in</strong> climax.<br />
2.7.2 Range sites<br />
Before range <strong>condition</strong> can be assessed the range sites must be located. Range sites<br />
are the basic unit of l<strong>and</strong> for practical use. Ideally, each range site should respond <strong>in</strong><br />
the same manner to climatic variation, have uniform topography <strong>and</strong> productivity <strong>and</strong><br />
respond uniformly to experimental treatment (Alemayehu 2006).<br />
11
2.7.3 Range trends<br />
The direction of change <strong>in</strong> ecological status or resource value rat<strong>in</strong>g observed over time<br />
(SRM 1999). It describes the current health of the range, <strong>and</strong> then range trend <strong>in</strong>dicates<br />
whether it is gett<strong>in</strong>g better, worse or stay<strong>in</strong>g the same. Consequently, range trend is the<br />
best s<strong>in</strong>gle <strong>in</strong>dicator of the success or failure of current management practices. It can be<br />
determ<strong>in</strong>ed by two range <strong>condition</strong> determ<strong>in</strong>ations. However, changes <strong>in</strong> range <strong>condition</strong><br />
can be fairly slow <strong>and</strong> the ability to properly estimate range <strong>condition</strong> has sufficient error<br />
to require that mean<strong>in</strong>gful changes must be based on read<strong>in</strong>gs at least five years apart.<br />
This is too long; management must be evaluated over shorter periods of time. Indicators<br />
of trend are very useful tools.<br />
2.7.4 Range <strong>condition</strong> classification<br />
Range <strong>condition</strong> classification is often <strong>in</strong>cluded <strong>in</strong> a range <strong>in</strong>ventory. Changes <strong>in</strong> range<br />
<strong>condition</strong> scores overtime are usually the basis for monitor<strong>in</strong>g management effectiveness.<br />
Range <strong>condition</strong> classification provides an <strong>in</strong>duction of management <strong>in</strong>puts necessary.<br />
If ranges are <strong>in</strong> good or excellent <strong>condition</strong>, ma<strong>in</strong>ta<strong>in</strong><strong>in</strong>g them <strong>in</strong> a stable <strong>condition</strong><br />
may be the best management strategy. However, if they are <strong>in</strong> poor or fair <strong>condition</strong>,<br />
management, that is aimed at ‘improvement’ may be <strong>in</strong>dicated. Generally, four or five<br />
<strong>condition</strong> classes are recognized: excellent, good, fair <strong>and</strong> poor. Sometimes a fifth<br />
category is added. Many approaches have been used to determ<strong>in</strong>e range <strong>condition</strong><br />
on different range sites or habitat types. Dyksterhuis (1949 1958) developed the most<br />
familiar method. This approach is ecological, <strong>in</strong> that range <strong>condition</strong> is measured <strong>in</strong><br />
degree of departure from climax. The approach assumes that climax can be determ<strong>in</strong>ed<br />
for each range sites. Excellent class would represent climax, i.e. excellent (76–100);<br />
good (50–75); fair (26–50); <strong>and</strong> poor (0–25). Orig<strong>in</strong>ally, species occurr<strong>in</strong>g on each<br />
site were classified, by their reaction to graz<strong>in</strong>g, as decreasers, <strong>in</strong>creasers, or <strong>in</strong>vaders.<br />
Dcreasers are highly palatable plants that decl<strong>in</strong>e <strong>in</strong> abundance with graz<strong>in</strong>g pressure.<br />
Plants classified as <strong>in</strong>creaser I types are moderately palatable <strong>and</strong> ‘serve as secondary<br />
forage plants’. They may <strong>in</strong>crease slightly, or rema<strong>in</strong> stable under moderate graz<strong>in</strong>g<br />
<strong>condition</strong> <strong>and</strong> reaches fair <strong>condition</strong>, they also decl<strong>in</strong>e. Other plant species present <strong>in</strong><br />
the climax vegetation but that are unpalatable may <strong>in</strong>crease under graz<strong>in</strong>g pressure or as<br />
site deterioration occurs. These species are classified as <strong>in</strong>creaser II plants. Invaders are<br />
species that encroach on to the sites from adjacent sites <strong>in</strong> a later stage of deterioration.<br />
Type I <strong>in</strong>vaders may eventually decrease if forced utilization occurs at later stages of<br />
deterioration; while type II <strong>in</strong>vaders are generally unpalatable <strong>and</strong> <strong>in</strong>crease even at the<br />
f<strong>in</strong>al stages of deterioration.<br />
12
2.8 Biomass estimation methods<br />
Biomass or st<strong>and</strong><strong>in</strong>g crop usually refers to the weight of organisms present at one time<br />
(SRM 1999). Increases <strong>in</strong> biomass through growth process of photosynthesis over time are<br />
generally considered productivity estimates that <strong>in</strong>clude a time dimension. In the English<br />
system biomass is generally expressed <strong>in</strong> pound per acre, <strong>and</strong> <strong>in</strong> the metric system, kg per<br />
hectare. Productivity estimates would <strong>in</strong>clude a unit of time (e.g. annual per day, week,<br />
month etc.). Most estimates of plant biomass or st<strong>and</strong><strong>in</strong>g crop <strong>in</strong>clude only that above<br />
the soil surface. This material is commonly available to larger herbivores. Below ground<br />
biomass is very important for plant functions, but is difficult to measure <strong>and</strong> generally not<br />
<strong>in</strong>cluded <strong>in</strong> <strong>in</strong>ventory or monitor<strong>in</strong>g procedures. Direct harvest<strong>in</strong>g is considered the most<br />
reliable method of determ<strong>in</strong><strong>in</strong>g above ground biomass. However, this method is too timeconsum<strong>in</strong>g<br />
to be of practical value for <strong>in</strong>ventory or monitor<strong>in</strong>g of extensive range areas.<br />
Several weight estimate techniques have been developed for rapid <strong>and</strong> fairly reliable<br />
determ<strong>in</strong>ation of herbage weight. These procedures <strong>in</strong>volve estimat<strong>in</strong>g herbage weight by<br />
species from small quadrates <strong>in</strong> the field. Tra<strong>in</strong><strong>in</strong>g of observers <strong>in</strong> the field is necessary.<br />
This can be done easily by check<strong>in</strong>g the estimates with clipped quadrate (Alemayehu<br />
2005). The method is considered reliable enough to be used on detailed research studies.<br />
Weight estimates can be adjusted by clipp<strong>in</strong>g a portion of the quadrates that have been<br />
estimated.<br />
13
3 Materials <strong>and</strong> methods<br />
3.1 Description of the study area<br />
3.1.1 Location, climate <strong>and</strong> topography<br />
The study was conducted <strong>in</strong> <strong>Metema</strong> district, <strong>North</strong> Gondar Zone of Amhara Regional<br />
State (Figure 1). <strong>Metema</strong> is located between 12º40’00” N <strong>and</strong> 36º8’00” E. It is 925<br />
km northwest of Addis Ababa <strong>and</strong> 180 km west of Gondar town. The district has an<br />
<strong>in</strong>ternational boundary of more than 60 km long distance between Ethiopia <strong>and</strong> Sudan.<br />
It has 18 rural <strong>and</strong> 2 urban kebeles. Accord<strong>in</strong>g to IPMS (2005), out of the total 18 rural<br />
kebeles <strong>in</strong> the district, 16 are under moist kola <strong>and</strong> the rema<strong>in</strong><strong>in</strong>g two kebeles are dry<br />
kola. Mean annual temperature ranges from 22ºC to 28ºC <strong>and</strong> daily temperature reaches<br />
as high as 43ºC dur<strong>in</strong>g the months of March to May. Mean annual ra<strong>in</strong>fall ranges from<br />
850 mm to 1100 mm (IPMS 2005) <strong>and</strong> has unimodal pattern. The ra<strong>in</strong>y months extend<br />
from June to end of September. Altitudes range from 550 to 1068 masl.<br />
<strong>Metema</strong><br />
Figure 1. Location of <strong>Metema</strong> woreda <strong>in</strong> Ethiopia.<br />
3.1.2 Human population <strong>and</strong> livestock <strong>resources</strong><br />
Accord<strong>in</strong>g to CSA (2005), the human population <strong>in</strong> the woreda is estimated at 76,084<br />
rural (54.2% male) <strong>and</strong> 18,467 urban (50.0% male). The majority of the population (80%)<br />
lives <strong>in</strong> rural areas with farm<strong>in</strong>g as a major occupation. The orig<strong>in</strong>al residents of the area<br />
14
are the Gumuz people. Until recently, they practised slash <strong>and</strong> burn <strong>and</strong> hunt<strong>in</strong>g wild<br />
animals. The area has been gradually populated by settlers from the highl<strong>and</strong>s. Accord<strong>in</strong>g<br />
to OoARD (2007), through a new resettlement program, the government has settled a<br />
total of 33,159 people between 2003 <strong>and</strong> 2005.<br />
Livestock production was an <strong>in</strong>tegral part of the l<strong>and</strong> use system. Production of cattle<br />
for draught power, milk, <strong>and</strong> meat; small rum<strong>in</strong>ants for <strong>in</strong>come <strong>and</strong> meat <strong>and</strong> donkeys<br />
<strong>and</strong> camels for transport <strong>and</strong> poultry for <strong>in</strong>come is a common practice. The livestock<br />
population is composed of 136,910 cattle, 32,024 goats, 1686 sheep, 7164 donkeys,<br />
7127 poultry, 400 camels <strong>and</strong> 23,789 beehives (OoARD 2007). Transhumance<br />
production system was commonly practised by the highl<strong>and</strong>ers. Accord<strong>in</strong>g to Azage et<br />
al. (2008), about 80% of the <strong>in</strong>habitants of the highl<strong>and</strong> Chilga, Dembia <strong>and</strong> Gondar<br />
Zuria districts trek their livestock to <strong>Metema</strong> <strong>in</strong> search of <strong>feed</strong> dur<strong>in</strong>g the ma<strong>in</strong> ra<strong>in</strong>y<br />
season from May to October. The major cattle breed of the study area is Fogera crossbred<br />
with other highl<strong>and</strong> zebu cattle. Ruthana cattle orig<strong>in</strong>ally from Sudan <strong>and</strong> Felata cattle<br />
from Niger <strong>and</strong> Nigeria also constituted smaller proportion of the cattle population. The<br />
ma<strong>in</strong> small rum<strong>in</strong>ant resource is goat production. There is a small proportion of sheep<br />
population locally known as the ‘Gumuz sheep’. Important livestock diseases <strong>in</strong>clude<br />
<strong>in</strong>fectious diseases, <strong>in</strong>ternal <strong>and</strong> external parasites.<br />
3.1.3 L<strong>and</strong> use <strong>and</strong> farm<strong>in</strong>g systems<br />
Accord<strong>in</strong>g to OoARD (2007), l<strong>and</strong> use pattern of <strong>Metema</strong> district is comprised of forest<br />
<strong>and</strong> rangel<strong>and</strong>s 72.0% (312,300 ha), cultivated l<strong>and</strong> 23.6%, (103,908 ha of which<br />
71,324 ha, 13,908 ha <strong>and</strong> 18,676 ha are smallholder farms, commercial farms, <strong>and</strong><br />
potential cultivable l<strong>and</strong>, respectively), <strong>and</strong> uncultivable l<strong>and</strong> 5% (23,877 ha). About<br />
60% of the district is pla<strong>in</strong>, <strong>and</strong> 20, 15, <strong>and</strong> 5% are sloppy, undulat<strong>in</strong>g <strong>and</strong> valley<br />
bottoms, respectively.<br />
Cotton–livestock farm<strong>in</strong>g system<br />
Accord<strong>in</strong>g to IPMS (2005), 4 out of the 18 peasant associations (PAs) belong to this<br />
farm<strong>in</strong>g system. They are Maka, Awlala, Genda Wuha <strong>and</strong> Kemechela. They are found<br />
<strong>in</strong> the northeastern part of the woreda. These PAs predom<strong>in</strong>antly grow cotton followed<br />
by sorghum <strong>and</strong> sesame <strong>in</strong> few areas. The PAs <strong>in</strong> this farm<strong>in</strong>g system have some different<br />
features <strong>in</strong> terms of suitability for crop production <strong>and</strong> amount of ra<strong>in</strong>fall received. These<br />
PAs are relatively cooler <strong>in</strong> temperature <strong>and</strong> have higher altitude <strong>and</strong> ra<strong>in</strong>fall. Most of the<br />
area is flat with black Vertisol <strong>and</strong> have water logg<strong>in</strong>g problem. As a result, the area is<br />
suitable for grow<strong>in</strong>g cotton <strong>and</strong> rice. Farmers <strong>in</strong> these PAs practice slightly early plant<strong>in</strong>g<br />
15
of crops. Cotton is grown <strong>in</strong> bigger plots, while sorghum <strong>and</strong> sesame are planted <strong>in</strong> very<br />
smaller areas. The primary <strong>and</strong> secondary sources of <strong>in</strong>come <strong>in</strong> this farm<strong>in</strong>g system were<br />
crops (97.7%) <strong>and</strong> livestock (97.6%). Off-farm activity was the third important source of<br />
<strong>in</strong>come for 82% of the respondents.<br />
Sesame–livestock farm<strong>in</strong>g system<br />
Fourteen PAs belong to this farm<strong>in</strong>g system, <strong>and</strong> sesame, cotton <strong>and</strong> sorghum are the<br />
major crops produced (<strong>in</strong> order of importance). Altitude (550 to 700 masl) <strong>and</strong> ra<strong>in</strong>fall<br />
(700 to 900 mm) <strong>in</strong> this farm<strong>in</strong>g system is lower than the cotton–livestock farm<strong>in</strong>g system.<br />
The underground water table is high, <strong>and</strong> <strong>in</strong> some places water could be obta<strong>in</strong>ed at<br />
less than 10 m depth. In addition, there are three rivers <strong>in</strong> this farm<strong>in</strong>g system that could<br />
be used for irrigated crop production <strong>and</strong> livestock rear<strong>in</strong>g. Extensive graz<strong>in</strong>g areas <strong>and</strong><br />
natural gum <strong>and</strong> <strong>in</strong>cense trees are found <strong>in</strong> this farm<strong>in</strong>g system. Sorghum is an important<br />
crop <strong>and</strong> it is the ma<strong>in</strong> food crop for all smallholder households <strong>and</strong> labourers <strong>in</strong><br />
commercial sesame <strong>and</strong> cotton farms. The major sources of <strong>in</strong>come <strong>in</strong> this farm<strong>in</strong>g system<br />
were crops (95.2%), livestock (84.8%) <strong>and</strong> off-farm (57.1%).<br />
3.2 Selection of kebeles <strong>and</strong> farmers<br />
A s<strong>in</strong>gle-visit formal survey method (ILCA 1990) was used to collect <strong>in</strong>formation on<br />
livestock <strong>feed</strong> <strong>resources</strong> <strong>and</strong> rangel<strong>and</strong> utilization practices <strong>in</strong> the district. A total of<br />
7 kebeles were selected r<strong>and</strong>omly out of the total 18 kebeles. Then, a total of 140<br />
respondents were selected us<strong>in</strong>g purposive sampl<strong>in</strong>g technique <strong>and</strong> <strong>in</strong>terviewed for<br />
collection of primary data. A structured questionnaire was prepared as per the objective<br />
of the study <strong>and</strong> was pre-tested. In addition, observations, group discussions with elders,<br />
development agents <strong>and</strong> key <strong>in</strong>formants were undertaken. Secondary data were reviewed<br />
<strong>and</strong> browsed to consolidate the <strong>in</strong>formation.<br />
3.3 <strong>Rangel<strong>and</strong></strong> <strong>condition</strong> assessment<br />
3.3.1 Range sites selection <strong>and</strong> sampl<strong>in</strong>g procedures<br />
Discussions were made with the community members, elders <strong>and</strong> agricultural experts<br />
about the locations <strong>and</strong> <strong>condition</strong>s of major graz<strong>in</strong>g areas <strong>in</strong> the two farm<strong>in</strong>g systems.<br />
Short visits were made to these sites for assessment. The number of sites was then decided<br />
based on proportions of the available graz<strong>in</strong>g l<strong>and</strong> with<strong>in</strong> farm<strong>in</strong>g system. Categories of<br />
the graz<strong>in</strong>g l<strong>and</strong>s were further stratified <strong>in</strong>to three sampl<strong>in</strong>g areas: communal graz<strong>in</strong>g,<br />
road side <strong>and</strong> enclosure us<strong>in</strong>g the systematically stratified r<strong>and</strong>om sampl<strong>in</strong>g technique.<br />
16
Enclosures used as benchmark was selected from protected areas <strong>in</strong> schools <strong>and</strong><br />
government protected acacia wooded grass l<strong>and</strong> for sesame–livestock farm<strong>in</strong>g system.<br />
The road sides were selected 200 metres away form the ma<strong>in</strong> road to avoid any edge<br />
effect. Road side graz<strong>in</strong>g l<strong>and</strong>s were selected because they are exposed to cont<strong>in</strong>uous<br />
graz<strong>in</strong>g <strong>and</strong> trampl<strong>in</strong>g by transhumants <strong>and</strong> <strong>in</strong>habitants.<br />
In each site, a sampl<strong>in</strong>g block of 4 km × 1 km, considered homogenous <strong>and</strong><br />
representative of the vegetation cover under <strong>in</strong>vestigation, was demarcated. This was<br />
further stratified <strong>in</strong>to four sampl<strong>in</strong>g plots of equal size (1 km × 1 km each) <strong>in</strong> order to<br />
encompass vegetations of herbaceous <strong>and</strong> woody layers. In each plot, a belt transects<br />
of 50 m × 4 m was laid out r<strong>and</strong>omly. A total of 68 composite samples (24 from<br />
communal <strong>and</strong> 24 from road side) for herbaceous <strong>and</strong> 21 composite samples for woody<br />
vegetation were collected from both farm<strong>in</strong>g systems. In enclosure areas, 8 <strong>and</strong> 12<br />
sampl<strong>in</strong>g units were used <strong>in</strong> cotton–livestock <strong>and</strong> sesame–livestock farm<strong>in</strong>g systems,<br />
respectively. The numbers of quadrates laid <strong>in</strong> the composite sampl<strong>in</strong>g units differed<br />
accord<strong>in</strong>g to the proportion of the graz<strong>in</strong>g areas <strong>and</strong> the factors assessed. For grass<br />
species composition, three <strong>and</strong> four quadrates per one composite unit were used <strong>in</strong><br />
the cotton–livestock <strong>and</strong> sesame–livestock farm<strong>in</strong>g systems, respectively. For woody<br />
vegetation assessment three belt transects per one composite sampl<strong>in</strong>g unit was used<br />
<strong>in</strong> both farm<strong>in</strong>g systems. For biomass estimation four quadrates per one composite<br />
sampl<strong>in</strong>g unit was employed <strong>in</strong> both farm<strong>in</strong>g systems. Compass <strong>and</strong> GPS were used to<br />
measure the transect locations <strong>and</strong> coord<strong>in</strong>ates. Sampl<strong>in</strong>g was done from 10 August to<br />
10 September 2007 when almost all the pasture plants were fully-grown with over 50%<br />
at flower<strong>in</strong>g stage.<br />
3.3.2 Species composition assessment<br />
At each sample site, the composition of herbaceous species was assessed by harvest<strong>in</strong>g<br />
three or four quadrates of 1 m × 1 m area (depend<strong>in</strong>g on the homogeneity <strong>and</strong><br />
heterogeneity of the range sites) r<strong>and</strong>omly by throw<strong>in</strong>g a quadrate each time towards the<br />
back <strong>and</strong> the herbaceous species with<strong>in</strong> the quadrates <strong>and</strong> this was cut to ground level.<br />
The sample was weighed immediately us<strong>in</strong>g a spr<strong>in</strong>g balance <strong>and</strong> was transferred <strong>in</strong>to<br />
properly labelled paper bag <strong>and</strong> fasten at the top. Samples were kept under a shade until<br />
sampl<strong>in</strong>g for the day was completed. Each of the sample <strong>in</strong> the paper bag was then h<strong>and</strong><br />
separated <strong>in</strong>to different species <strong>and</strong> separately weighed aga<strong>in</strong>. Subsequently, samples<br />
were sun dried. Dry matter (DM) of each species was determ<strong>in</strong>ed <strong>in</strong> an oven (60ºC for 72<br />
hours) at the ILRI laboratory Addis Ababa <strong>and</strong> the percent composition of each species<br />
were determ<strong>in</strong>ed on DM weight basis (ILCA 1990).<br />
17
3.3.3 Identification of plant species<br />
For identification of species, representative plants with flower<strong>in</strong>g head <strong>and</strong> other<br />
vegetative parts from each species were collected <strong>and</strong> dried <strong>in</strong> presses. After dry<strong>in</strong>g,<br />
the specimens were mounted. Very few common species were identified right <strong>in</strong> the<br />
field (Azene et al. 1993) <strong>and</strong> specimens were coded <strong>and</strong> transported to the National<br />
Herbarium of Addis Ababa University for f<strong>in</strong>al identification.<br />
3.3.4 Range <strong>condition</strong> assessment<br />
The rangel<strong>and</strong> <strong>condition</strong> was assessed consider<strong>in</strong>g the three layers (grass, woody, <strong>and</strong><br />
soil factors) based on the suggestion made by Friedle (1991). For grass <strong>and</strong> soil layer<br />
factors, the criteria developed <strong>in</strong> South Africa (Ta<strong>in</strong>ton 1981) <strong>and</strong> adapted to fit semiarid<br />
<strong>and</strong> subhumid environments by Baars et al. (1997) was used. Woody vegetation<br />
layer was assessed us<strong>in</strong>g density enumeration based on the suggestion of Pratt <strong>and</strong><br />
Gwynne (1977) for east African rangel<strong>and</strong>s. The assessment factors were based on the<br />
composition of the grass layer, basal cover, litter cover, soil erosion, soil compaction,<br />
<strong>and</strong> woody vegetation density (Appendix Table 1) summ<strong>in</strong>g up to a total of 50 po<strong>in</strong>ts,<br />
the overall rat<strong>in</strong>g of vegetation was <strong>in</strong>terpreted as excellent (65–58.5 po<strong>in</strong>ts), good<br />
(47.5–41 po<strong>in</strong>ts), fair (40–33.5 po<strong>in</strong>ts), poor (32.5–26 po<strong>in</strong>ts), very poor (≤ 25 po<strong>in</strong>ts)<br />
(Baars et al. 1997).<br />
3.3.5 Herbaceous species composition<br />
For herbaceous (ma<strong>in</strong>ly grasses) species composition, 1 to 10 po<strong>in</strong>ts were considered.<br />
Grass species were divided <strong>in</strong>to desirable species likely to decl<strong>in</strong>e with heavy graz<strong>in</strong>g<br />
pressure (deceasers), <strong>in</strong>termediate species likely to <strong>in</strong>crease with heavy graz<strong>in</strong>g pressure<br />
(<strong>in</strong>creasers), <strong>and</strong> undesirable species likely to <strong>in</strong>vade with heavy graz<strong>in</strong>g pressure<br />
(<strong>in</strong>vaders), accord<strong>in</strong>g to the succession theory (Abule et al. 2007). Classification of grass<br />
species <strong>in</strong>to these three categories was done by conduct<strong>in</strong>g detailed <strong>in</strong>terview with<br />
members of the local community about the palatability <strong>and</strong> distribution of each identified<br />
grass species <strong>in</strong> relation to the <strong>in</strong>tensity of graz<strong>in</strong>g, <strong>and</strong> cross check<strong>in</strong>g with the list of<br />
grasses from the literature.<br />
3.3.6 Basal <strong>and</strong> litter cover<br />
For basal <strong>and</strong> litter cover a score rat<strong>in</strong>g of 0 to 10 po<strong>in</strong>ts were considered as <strong>in</strong>dicated<br />
<strong>in</strong> Appendix Table 1. A representative sample area of 1 m 2 was selected for detail<br />
assessments of basal <strong>and</strong> litter cover. For the surface of basal cover of tufted grasses,<br />
18
the distribution was assessed as follows: The 1 m 2 was divided <strong>in</strong>to halves, one of<br />
which was aga<strong>in</strong> divided <strong>in</strong>to eighths. All plants <strong>in</strong> the selected 1 m 2 were removed<br />
<strong>and</strong> transferred to the eighth to facilitate visual estimation. Only basal cover of liv<strong>in</strong>g<br />
parts was considered. The rat<strong>in</strong>g of basal cover for tufted species was considered<br />
excellent if the eighth was completely fill<strong>in</strong>g (12.5) or very poor if the cover becomes<br />
less than 3%.<br />
3.3.7 Number of seedl<strong>in</strong>gs <strong>and</strong> age distribution<br />
The number of seedl<strong>in</strong>gs was counted <strong>in</strong> three r<strong>and</strong>omly selected areas, each the size<br />
of an A4 paper (30 cm × 21 cm) (Appendix Table 1). An A4 paper was dropped from an<br />
approximate height of 2 metre above the ground <strong>and</strong> the number of seedl<strong>in</strong>gs with<strong>in</strong> the<br />
paper was counted. The category: ‘no seedl<strong>in</strong>gs’, was given 0 po<strong>in</strong>t, <strong>and</strong> more than 4<br />
seedl<strong>in</strong>gs were given the maximum score of 5 po<strong>in</strong>ts. Similarly, if all age categories, i.e.<br />
young, medium <strong>and</strong> old plants of the dom<strong>in</strong>ant species are present, a maximum score<br />
of 5 po<strong>in</strong>ts was given. If there were only young plants, then the m<strong>in</strong>imum score of 1 was<br />
given (Appendix Table 1).<br />
3.3.8 Woody vegetation layer<br />
In woody vegetation assessment, species composition, density, canopy cover, plant height<br />
<strong>and</strong> hedge effect were considered. All species <strong>in</strong> the belt transect of 50 m × 4 m were<br />
recorded <strong>and</strong> identified. The desirability <strong>and</strong> palatability of each species was recorded<br />
based on group discussion with livestock owners with respect to the woody plants<br />
sensitivity to graz<strong>in</strong>g, abundance <strong>and</strong> preference by livestock as <strong>feed</strong>. This discussion was<br />
supported by literature (Azene et al. 1993). The criteria developed by Kuchar (1995) were<br />
used for scor<strong>in</strong>g the percent of canopy cover of woody species. Height of a particular<br />
species <strong>in</strong> the belt was measured us<strong>in</strong>g calibrated poles of appropriate sizes for different<br />
woody species <strong>and</strong> five height classes (>0.5–1 m, >1–2 m, >2–3 m, 3–4 m <strong>and</strong> >4–5 m)<br />
were employed (Amaha 2006). The density of woody species were enumerated from each<br />
belt transect of 200 m 2 area. Only live woody plants regardless of be<strong>in</strong>g s<strong>in</strong>gle or multiple<br />
stemmed were counted <strong>and</strong> recorded to estimate the woody vegetation density.<br />
The number of trees/shrubs per plot area was determ<strong>in</strong>ed <strong>and</strong> the lowest score (0 po<strong>in</strong>t)<br />
was given for the highest density: i.e. 0 = > 5000/ha, 1 = 4001–5000/ha, 2 = 3001–4000/<br />
ha, 3 = 2001–3000/ha, 4 = 1001–2000/ha, <strong>and</strong> 5 = 0–1000/ha (Abule 2003). The percent<br />
canopy cover of the species <strong>in</strong> the belt transect was measured us<strong>in</strong>g a tape meter. The<br />
ratio was computed as the measured canopy area by the rema<strong>in</strong><strong>in</strong>g tape length <strong>and</strong> the<br />
result percentage canopy cover was rated by the criteria developed by Kuchar (1995).<br />
19
The rates given for cover <strong>in</strong> the range of 1–5 po<strong>in</strong>ts, for woody covers of >45%, 36–45%,<br />
26–35%, 15–25% <strong>and</strong>
samples for herbaceous species <strong>and</strong> 21 composite sample units respectively, <strong>and</strong> all <strong>in</strong> all<br />
89 composite sample units (Table 3) were subjected to analysis us<strong>in</strong>g the General L<strong>in</strong>ear<br />
Model (GLM) procedure of SPSS version 12. One-way analysis of variance (ANOVA)<br />
was used for variables of range <strong>condition</strong>. Correlation analysis was used to test if there<br />
were relationships between rangel<strong>and</strong> degradation, biomass production <strong>and</strong> vegetation<br />
variables.<br />
Table 3. Experimental units used for analysis <strong>in</strong> each composite sample site<br />
Graz<strong>in</strong>g type<br />
Farm<strong>in</strong>g system<br />
Communal Road side Enclosure Subtotal<br />
Herbaceous layer CLFS 12 12 8 32<br />
SLFS 12 12 12 36<br />
Total 24 24 20 68<br />
Woody layer CLFS 4 4 2 10<br />
SLFS 4 4 3 11<br />
Total 8 8 5 21<br />
Composite samples = 89; SLFS = sesame–livestock farm<strong>in</strong>g system, CLFS = cotton–livestock farm<strong>in</strong>g system.<br />
21
4 Results <strong>and</strong> discussion<br />
4.1 Socio-economic <strong>condition</strong>s<br />
4.1.1 Household characteristics<br />
Sex, ethnic group, education, <strong>and</strong> major occupation of respondents under the two<br />
farm<strong>in</strong>g systems <strong>in</strong> <strong>Metema</strong> district are presented <strong>in</strong> Table 4. Overall, 87.1% of the<br />
respondents are male, 10% spouses, 1.4% sons <strong>and</strong> 1.4% are daughters. From overall<br />
respondents, 88.6 <strong>and</strong> 11.4% are male <strong>and</strong> female, respectively. There were five ethnic<br />
groups <strong>in</strong> the districts. Of these, the Amhara dom<strong>in</strong>ate <strong>in</strong> both farm<strong>in</strong>g systems, be<strong>in</strong>g<br />
76.3% <strong>in</strong> the sesame–livestock <strong>and</strong> 60% <strong>in</strong> cotton–livestock system. Overall, 86.4% are<br />
Amhara, 10% Tigre 5% Gumuz, 3% Agew <strong>and</strong> 1% are others.<br />
Table 4. Sex, ethnic group, education, <strong>and</strong> major occupation of respondents <strong>in</strong> the cotton–livestock<br />
<strong>and</strong> sesame–livestock farm<strong>in</strong>g systems <strong>in</strong> <strong>Metema</strong> district<br />
Variables<br />
CLFS SLFS Overall<br />
HHC % HHC % HHC %<br />
Respondent status N = 80 N = 60 N = 140<br />
Husb<strong>and</strong> 67 83.8 55 91.7 122 87.1<br />
Spouse 10 12.5 4 6.7 14 10.0<br />
Son 1 1.3 1 1.7 2 1.4<br />
Daughter 2 2.5 2 1.4<br />
Sex of household head<br />
Male 68 85.0 56 93.3 124 88.6<br />
Female 12 15.0 4 6.7 16 11.4<br />
Ethnic group of household<br />
Amhara 61 76.3 60 100 121 86.4<br />
Agew 3 3.8 3 2.1<br />
Tigre 10 12.5 10 7.1<br />
Gumuz 5 6.3 5 3.6<br />
Other 1 1.3 1 0.7<br />
Education status of household<br />
Illiterate 33 41.3 35 58.3 68 48.6<br />
Read <strong>and</strong> write only 29 36.3 18 30.0 47 33.6<br />
Grade 1–3 7 8.8 3 5.0 9 6.4<br />
Grade 4–6 9 11.3 2 3.3 9 6.4<br />
Grade 7–9 2 2.5 2 3.3 7 5.0<br />
Major occupation<br />
Trade 4 5.0 4 2.9<br />
Livestock rear<strong>in</strong>g only 3 3.8 1 1.7 4 2.9<br />
Crop production only 10 12.5 2 3.3 12 8.6<br />
Mixed farm<strong>in</strong>g 61 76.3 55 91.7 116 82.9<br />
Others 2 2.5 2 3.3 3 2.1<br />
SLFS = sesame–livestock farm<strong>in</strong>g system, CLFS = cotton–livestock farm<strong>in</strong>g system, HHC = household count.<br />
22
The overall educational status of the respondents <strong>in</strong>dicate that 48.6% are illiterate; be<strong>in</strong>g<br />
higher <strong>in</strong> sesame–livestock (58.3%) than <strong>in</strong> the cotton–livestock (41.3%) farm<strong>in</strong>g system.<br />
Similar f<strong>in</strong>d<strong>in</strong>gs were also reported for pastoralist communities <strong>in</strong> South Omo (Admasu<br />
2006) <strong>and</strong> Bale Zones (Teshome 2006) of Ethiopia. The f<strong>in</strong>d<strong>in</strong>gs may suggest that this<br />
situation could impede technology uptake. About 33.5% of the respondents could read<br />
<strong>and</strong> write. About 5% of the respondents had grade 7 to 9 education; which is the highest<br />
among the total respondents.<br />
The majority of the households (82.9%) are farmers <strong>and</strong> practised crop <strong>and</strong> livestock<br />
mixed farm<strong>in</strong>g system. This could be due to the fact that most of the settlers came to the<br />
district from highl<strong>and</strong> <strong>and</strong> medium altitude areas of Gondar, Wollo, <strong>North</strong> Shoa <strong>and</strong><br />
Gojjam Zones of the Region, which practised predom<strong>in</strong>antly mixed farm<strong>in</strong>g system. The<br />
native Gumuz people still practice hunt<strong>in</strong>g <strong>and</strong> wild plant gather<strong>in</strong>g with some farm<strong>in</strong>g<br />
(IPMS 2005).<br />
4.1.2 Age <strong>and</strong> family size<br />
The overall mean age of respondents is 40.16 ± 0.84 (Table 5). This result was lower than<br />
the mean average age of 44.3 years reported by (Teshome 2006) <strong>in</strong> Fogera district of the<br />
Amhara region, whereas it was <strong>in</strong> agreement with the mean average age of 41.2 ± 0.65<br />
years reported by (Tesfaye 2008) for <strong>Metema</strong> district.<br />
Table 5. Family size, age of respondents <strong>and</strong> family members <strong>in</strong> <strong>Metema</strong> district<br />
CLFS SLFS Overall<br />
Variables<br />
Mean ± SE<br />
(N = 60)<br />
Mean ± SE<br />
(N = 80)<br />
Mean ± SE<br />
(N = 140)<br />
Age of respondents, years 41.05 ± 1.43 39.49 ± 1.01 40.16 ± 0.84<br />
Age of family members<br />
> 60 years 3.00 ± 1.00 2.00 ± 0.00 2.44 ± 0.44<br />
16 to 60 years 2.74 ± 0.17 3.13 ± 0.19 2.97 ± 0.13<br />
6 to 15 years 3.29 ± 0.26 2.89 ± 0.24 3.09 ± 0.18<br />
< 6 years 2.46 ± 0.22 2.28 ± 0.14 2.35 ± 0.13<br />
Family size<br />
Male 5.47 ± 0.34 5.32 ± 0.32 5.41 ± 0.24<br />
Female 6.02 ± 1.32 4.98 ± 0.25 5.44 ± 0.65<br />
Total 5.37 ± 0.28a 5.26 ± 0.27a 5.31 ± 0.20a<br />
SLFS = sesame–livestock farm<strong>in</strong>g system, CLFS = cotton–livestock farm<strong>in</strong>g system.<br />
Means with same superscript with<strong>in</strong> the same row do not differ significantly (P
5.31 ± 0.20 persons per household. This mean family size was similar to the national<br />
average of 5.2 (CACC 2002), but lower than the values of 6.6 ± 0.31 reported by Sisay,<br />
(2006) for the same district <strong>and</strong> 7.3 for Hamer <strong>and</strong> Bena-Tsemay by Admasu (2006).<br />
The age structure showed that 50% are with<strong>in</strong> the productive workforce age of 16 to 60<br />
years. Only 2.5% are above 60 years of age. The rema<strong>in</strong><strong>in</strong>g 30.1% are between 6–15<br />
years of age, while 17.4% are children of less than 6 years of age. In rural Ethiopia, all<br />
people above 10 years of age are <strong>in</strong>volved <strong>in</strong> agricultural <strong>and</strong> related activities (CSA<br />
2003).<br />
4.2 L<strong>and</strong> hold<strong>in</strong>g <strong>and</strong> l<strong>and</strong> use pattern<br />
Data on l<strong>and</strong> hold<strong>in</strong>g <strong>and</strong> l<strong>and</strong> use pattern of the respondents are presented <strong>in</strong> Table<br />
6. The overall average l<strong>and</strong> hold<strong>in</strong>g per household is 6.78 ± 1.33 ha; be<strong>in</strong>g slightly<br />
higher (P>0.05) <strong>in</strong> the cotton–livestock (7.53 ± 1.53 ha) than <strong>in</strong> the sesame–livestock<br />
(6.21 ± 1.17 ha) farm<strong>in</strong>g system. The possible reason may be associated with the time<br />
of settlement <strong>in</strong> both areas. Accord<strong>in</strong>g to the group discussion with key <strong>in</strong>formants,<br />
the settled <strong>in</strong>habitants <strong>in</strong> the cotton–livestock farm<strong>in</strong>g system arrived earlier (by<br />
their own <strong>and</strong> government), benefited from less controlled open access l<strong>and</strong> <strong>and</strong> are<br />
therefore well established. The majority of the <strong>in</strong>habitants <strong>in</strong> the sesame–livestock<br />
system are relatively new settlers <strong>and</strong> only 1–2 ha of farm l<strong>and</strong> is allocated per settler<br />
(OoARD, Settlement Desk, personal communication). Accord<strong>in</strong>g to Sisay (2006), this<br />
is greater than the average l<strong>and</strong>hold<strong>in</strong>gs of the highl<strong>and</strong> districts of Debark (1.66 ha)<br />
<strong>and</strong> Layarmachiho (2.03 ha). As reported by IPMS (2005), previously settled <strong>and</strong> the<br />
<strong>in</strong>digenous people officially own about 5 ha of l<strong>and</strong>, but many farmers cultivate more<br />
than this.<br />
Accord<strong>in</strong>g to the respondents, about 91.4% of the l<strong>and</strong> is used for annual crop<br />
production; while 0.8% is covered by perennial crops, 3.1% is left for private graz<strong>in</strong>g <strong>and</strong><br />
4.7% fallowed (Table 6). The trend was similar to the result reported by Sisay 2006. This<br />
fallow l<strong>and</strong> was associated with the widely practised shift<strong>in</strong>g cultivation <strong>in</strong> the area as a<br />
means of soil fertility improvement measure. Based on the group discussion held with<br />
elders, some 10 years back, fallow<strong>in</strong>g of farml<strong>and</strong> was practised for about 5–8 years <strong>and</strong><br />
was a common practice <strong>in</strong> the district. The trend has been decreas<strong>in</strong>g, <strong>and</strong> currently, l<strong>and</strong><br />
is left for fallow for about 2 to 4 years due to the <strong>in</strong>crease <strong>in</strong> human population <strong>and</strong> the<br />
use of extensive areas for private <strong>in</strong>vestment.<br />
24
Table 6. Mean ± SE l<strong>and</strong> hold<strong>in</strong>g <strong>and</strong> l<strong>and</strong> use pattern <strong>in</strong> <strong>Metema</strong> district<br />
Variables<br />
CLFS SLFS Overall<br />
HHC % HHC % HHC %<br />
L<strong>and</strong> hold<strong>in</strong>g<br />
1–5 ha 21 42.9 38 52.8 64 50.4<br />
5.1–10 ha 15 30.6 23 31.9 38 29.9<br />
10.1–15 ha 10 20.4 11 15.3 22 17.3<br />
>15 ha 3 6.1 0 0.0 3 2.4<br />
Mean (SE) 55 7.53 ± 1.53a 72 6.21 ± 1.17b 127 6.78 ± 1.33b<br />
L<strong>and</strong> use<br />
Annual crops 51 89.5 66 93 117 91.4<br />
Perennial crops – – 1 1.4 1 0.8<br />
Private graz<strong>in</strong>g – – 4 5.6 4 3.1<br />
Fallow 6 10.5 – – 6 4.7<br />
HHC = household count, CLFS = cotton–livestock farm<strong>in</strong>g system, SLFS = sesame–livestock farm<strong>in</strong>g system.<br />
Means with different superscripts differ significantly (P
Table 7. Livestock hold<strong>in</strong>gs <strong>in</strong> TLU of the sampled households <strong>in</strong> <strong>Metema</strong><br />
Species<br />
CLFS<br />
Mean ± SE<br />
SLFS<br />
Mean ± SE<br />
Cattle 6.24 ± 0.45 6.34 ± 0.59<br />
Goats 0.36 ± 0.04 0.43 ± 0.60<br />
Sheep 0.01 ± 0.1a 0.11 ± 0.03b<br />
Donkey 0.34 ± 0.03 0.31 ± 0.04<br />
Camel 0.00a 0.06 ± 04b<br />
Poultry (No.) 15.7a 17.2b<br />
CLFS = cotton–livestock farm<strong>in</strong>g system; SLFS = sesame–livestock farm<strong>in</strong>g system; TLU = Tropical Livestock<br />
Unit.<br />
Means followed by different superscripts differ significantly (P
Table 8. Livestock herd structures <strong>in</strong> surveyed households by farm<strong>in</strong>g system <strong>in</strong> <strong>Metema</strong><br />
Variables<br />
Mean ± SE Mean ± SE<br />
CLFS<br />
SLFS<br />
Cattle<br />
Oxen 1.19 ± 0.09 1.06 ± 0.15<br />
Cow 2.04 ± 0.19 2.08 ± 0.26<br />
Heifer 1.02 ± 0.13 1.17 ± 0.15<br />
Steer 0.71 ± 0.13 0.73 ± 0.11<br />
Calves 1.30 ± 0.13 1.30 ± 0.18<br />
Total 6.24 ± 0.45 6.34 ± 0.59<br />
Goats<br />
He-goat 0.03 ± 0.01 0.01 ± 0.01<br />
She-goat 0.23 ± 0.03 0.22 ± 0.03<br />
Kids 0.11 ± 0.02 0.20 ± 0.04<br />
Total 0.36 ± 0.04 0.43 ± 0.60<br />
Sheep<br />
Male 0.01 ± 0.01 0.06 ± 0.02<br />
Female 0.0 0.01 ± 0.01<br />
Lambs 0.01 ± 0.0 0.04 ± 0.01<br />
Total 0.01 ± 0.1 0.11 ± 0.03<br />
Donkeys 0.34 ± 0.03 0.31 ± 0.04<br />
Camels 0.0 0.06 ± 0.04<br />
Total 13.60 ± 0.9a 14.11 ± 1.24b<br />
Poultry (No.) 15.7a 17.2b<br />
CLFS = cotton–livestock farm<strong>in</strong>g system; SLFS = sesame—livestock system; SE = st<strong>and</strong>ard error.<br />
Means followed by different superscripts differ significantly (P
Table 9. Major livestock <strong>feed</strong> <strong>resources</strong> <strong>and</strong> <strong>feed</strong><strong>in</strong>g systems <strong>in</strong> <strong>Metema</strong> district<br />
Feed<strong>in</strong>g system <strong>and</strong><br />
major <strong>feed</strong> sources<br />
CLFS SLFS Overall<br />
Wet Dry Wet Dry Wet Dry<br />
HHC % HHC % HHC % HHC % HHC % HHC%<br />
Major <strong>feed</strong>s for<br />
Cattle: 60<br />
– Natural pasture 100.0 30 50.0 80 100.0 48 60.0 140 100.0 78 55.7<br />
– Crop residues 14 23.3 15 18.8 29 20.7<br />
– Aftermath 9 15.0 11 13.8 20 14.3<br />
– Hay 7 11.7 6 7.5 13 9.3<br />
Goat 60<br />
– Trees <strong>and</strong> shrubs 100.0 45 75.0 80 100.0 57 71.3 140 100.0 102 72.9<br />
– Crop aftermath 15 25.0 23 28.8 38 27.1<br />
Sheep 60<br />
– Natural pasture 100.0 41 68.4 80 100.0 62 77.5 140 100.0 103 73.6<br />
– Crop residues 8 13.3 9 11.3 17 12.1<br />
– Crop aftermath 11 18.3 9 11.3 20 14.3<br />
Donkey 60<br />
– Natural pasture 100.0 13 21.7 80 100.0 12 15.0 140 100.0 25 17.9<br />
– Crop residues 35 58.3 57 71.3 92 65.7<br />
– Crop aftermath – 12 20.0 11 13.8 23 16.4<br />
Feed<strong>in</strong>g system<br />
Cattle 60<br />
– Tether<strong>in</strong>g 6 10.0 2 3.3 4 5.0 4 5.0 10 7.1 6 4.3<br />
– Free graz<strong>in</strong>g 54 90.0 58 96.7 68 85.0 73 91.3 122 87.1 131 93.6<br />
– Cut-<strong>and</strong>-carry – – – – 8 10.0 3 4.8 8 5.7 3 2.1<br />
Goat 60<br />
– Tether<strong>in</strong>g 13 21.7 – – 11 13.8 – – 24 17.1<br />
– Free brows<strong>in</strong>g 47 78.3 60 100.0 69 86.3 80 100.0 116 82.9 140 100<br />
Sheep 60<br />
– Free graz<strong>in</strong>g 60 100.0 60 100.0 80 100.0 80 100.0 140 100.0 140 100<br />
Donkey 60<br />
– Tether<strong>in</strong>g 14 23.3 39 65.0 15 18.8 49 61.3 29 20.7 88 62.9<br />
– Free graz<strong>in</strong>g 46 81..7 21 35.0 65 81.3 26 32.5 111 79.3 47 33.6<br />
– Cut-<strong>and</strong>-carry 5 6.3 5 3.5<br />
HHC = household count, CLFS = cotton–livestock farm<strong>in</strong>g system, SLFS = sesame–livestock farm<strong>in</strong>g system.<br />
4.6 Feed management <strong>and</strong> utilization practices<br />
Three types of <strong>feed</strong><strong>in</strong>g systems were practised <strong>in</strong> the district (Table 9). In the cotton–<br />
livestock farm<strong>in</strong>g system, 90 <strong>and</strong> 96.7% of the respondents practised free graz<strong>in</strong>g for<br />
their cattle dur<strong>in</strong>g the wet <strong>and</strong> the dry season, respectively; while the respective values<br />
were 85 <strong>and</strong> 91.3% <strong>in</strong> the sesame–livestock farm<strong>in</strong>g system. Overall, 87.1, 5.7 <strong>and</strong> 7.1%<br />
of the respondents use free graz<strong>in</strong>g, cut-<strong>and</strong>-carry <strong>and</strong> tether<strong>in</strong>g dur<strong>in</strong>g the wet season,<br />
28
espectively, while 93.6, 4.3 2.1% respectively practice these <strong>feed</strong><strong>in</strong>g management<br />
systems dur<strong>in</strong>g the dry season. Variations <strong>in</strong> labour shortage, number of animals<br />
kept by herders <strong>and</strong> area covered by crops contribute to seasonal differences <strong>in</strong> herd<br />
management.<br />
Overall, about 82.9% of the respondents allowed their goats to browse while 17.1%<br />
tethered them. Sheep production is based on free graz<strong>in</strong>g. There were some variations<br />
<strong>in</strong> <strong>feed</strong><strong>in</strong>g management between the two farm<strong>in</strong>g system. Donkeys are important<br />
animals <strong>in</strong> the district, <strong>and</strong> particularly male donkeys are bought from the neighbour<strong>in</strong>g<br />
highl<strong>and</strong> districts for the purpose of transportation services. Most of the respondents<br />
(62.9%) tethered their donkeys while some (33.6%) practised cut-<strong>and</strong>-carry system. This<br />
is because donkeys work hard dur<strong>in</strong>g the day <strong>and</strong> are left to graze at night. Unlike the<br />
highl<strong>and</strong>s, hyenas are not found <strong>in</strong> the district, mak<strong>in</strong>g night time graz<strong>in</strong>g possible.<br />
Dur<strong>in</strong>g the wet season, natural pasture is the sole <strong>feed</strong> resource for all species of livestock<br />
(Table 9). In the cotton–livestock farm<strong>in</strong>g system, the major <strong>feed</strong> <strong>resources</strong> for cattle<br />
dur<strong>in</strong>g the dry season are natural pasture (50%), crop residues (23.3%), crop aftermath<br />
(15%) <strong>and</strong> grass hay (11.7%). Whereas, <strong>in</strong> the sesame–livestock farm<strong>in</strong>g system, the<br />
use of natural pasture is higher (60%; P
Table 10. Percentage response of respondents on availability of <strong>feed</strong> <strong>resources</strong> <strong>in</strong> <strong>Metema</strong><br />
Variables<br />
CLFS SLFS Overall<br />
HHC % HHC % HHC %<br />
Availability of <strong>feed</strong>s<br />
Dry season<br />
Cattle:<br />
Adequate 23 38.3 28 35.0 51 36.4<br />
Inadequate 37 61.7 52 65.0 89 63.6<br />
Goat<br />
Adequate 45 75.0 56 70.0 115 82.1<br />
Inadequate 15 25.0 24 30.0 39 27.9<br />
Sheep<br />
Adequate 33 55.0 45 56.3 78 55.7<br />
Inadequate 27 45.0 35 44.8 62 44.3<br />
Donkey<br />
Adequate 51 85.0 62 77.5 113 80.7<br />
Inadequate 9 15.0 18 22.1 27 19.3<br />
Availability of <strong>feed</strong>s<br />
Wet season<br />
Adequate 28 48.3 42 52.5 70 50.0<br />
Inadequate 10 16.7 10 7.1<br />
Abundant 22 36.7 38 47.5 60 42.9<br />
Quality of the <strong>feed</strong>s<br />
Very good 48 80.0 70 87.5 118 84.3<br />
Average 12 20.0 10 12.5 22 15.7<br />
N = 60 for CLFS; N = 80 for SLFS, CLFS = cotton–livestock farm<strong>in</strong>g system, SLFS = sesame–livestock farm<strong>in</strong>g<br />
system, HHC = household count.<br />
4.7.1 Hay mak<strong>in</strong>g<br />
Accord<strong>in</strong>g to the <strong>in</strong>formation gathered from group discussion with elders, hay mak<strong>in</strong>g<br />
started only recently. About 10 years ago, there was no <strong>feed</strong> shortage dur<strong>in</strong>g the dry<br />
season because bamboo trees were abundant <strong>and</strong> they shed leaves dur<strong>in</strong>g the dry<br />
season <strong>and</strong> these leafy foliages were the pr<strong>in</strong>cipal sources of livestock <strong>feed</strong>. After the<br />
disappearance of the bamboo forest about 10 years ago, communities were forced to<br />
collect <strong>and</strong> conserve grass hay due to <strong>in</strong>creased human <strong>and</strong> livestock population <strong>and</strong><br />
drought. Hay mak<strong>in</strong>g is practised from end of October up to November <strong>and</strong> cur<strong>in</strong>g takes<br />
place for a period of two week to one month. The quality of hay is often poor <strong>and</strong> is<br />
bleached by the strong sunsh<strong>in</strong>e <strong>in</strong> the area. Farmers have not received any tra<strong>in</strong><strong>in</strong>g on<br />
good practices of hay mak<strong>in</strong>g by the extension service. This poor hay mak<strong>in</strong>g practice<br />
was also reported by Sisay (2006) who estimated hay production per household was only<br />
0.77 t DM/ha. Tesfaye (2008) also reported the percentage of households that practice<br />
hay mak<strong>in</strong>g is lower <strong>in</strong> the sesame–livestock (70.9%) than <strong>in</strong> the cotton–livestock (86.0%)<br />
farm<strong>in</strong>g system.<br />
30
4.7.2 Crop residues production <strong>and</strong> utilization<br />
In the cotton–livestock farm<strong>in</strong>g system, the ma<strong>in</strong> crops grown are cotton, rice, sorghum,<br />
maize, sesame, f<strong>in</strong>ger millet <strong>and</strong> fruits, while <strong>in</strong> the sesame livestock farm<strong>in</strong>g system,<br />
sesame, cotton, sorghum, maize, soya bean, teff, chickpea, groundnut <strong>and</strong> fruits are<br />
grown. Sorghum is the most important cereal crop grown <strong>in</strong> the district <strong>and</strong> constitutes<br />
about 90% of the total crop residues produced <strong>in</strong> the area. Crop residues from maize<br />
(8.4%), teff (1.3%), f<strong>in</strong>ger millet (0.14%), rice (0.25%), soya bean <strong>and</strong> chickpea make<br />
up for the difference (Table 11). Next to natural pastures, crop residues are other ma<strong>in</strong><br />
sources of livestock <strong>feed</strong> dur<strong>in</strong>g the dry season. In the cotton–livestock farm<strong>in</strong>g system,<br />
23.3, 13.3 <strong>and</strong> 58.3% of the crop residues are used for cattle, sheep <strong>and</strong> donkeys,<br />
respectively, while <strong>in</strong> the sesame–livestock farm<strong>in</strong>g system the respective values are<br />
18.8, 11.3 <strong>and</strong> 71.3%. Overall, out of the total amount of crop residues produced <strong>in</strong> the<br />
district, 20.0, 12.1 <strong>and</strong> 65.7% are used for cattle sheep <strong>and</strong> donkeys, respectively. The<br />
value of crop residues produced <strong>in</strong> a particular area depends on the amount <strong>and</strong> type of<br />
crops grown <strong>in</strong> the area.<br />
Table 11. Estimates of gra<strong>in</strong> <strong>and</strong> crop residues production for major crops grown <strong>in</strong> <strong>Metema</strong><br />
Types of crops<br />
Cultivated Gra<strong>in</strong> produced Crop residue G:CR<br />
%<br />
Sources<br />
(ha) (Qt)<br />
(CR) (t)<br />
ratio<br />
Share<br />
Teff 1005 8033 12.1 1.5 MOA (1984) 1.3<br />
F<strong>in</strong>ger millet 365 2555 1.3 2.04 Awassa, Bako 0.14<br />
Sorghum 15,820 329,056 822.6 2.5 Jhanke (1982) 89.5<br />
Maize 1809 40,143 80.3 2.0<br />
Chickpea 86 344 0.41 1.2<br />
Rice 117 2,340 2.34 1 Devendra (1997) 0.25<br />
Soya bean 15.5 93 0.09 1 Devendra (1997)<br />
Total 919.1<br />
Sources: OoARD (2006).<br />
Means with different superscripts differ significantly (P
everse was true for sheep (18.3% vs. 11.3%), respectively. The differences <strong>in</strong> stubble<br />
graz<strong>in</strong>g usage between the two farm<strong>in</strong>g systems could be associated with the types <strong>and</strong><br />
size of cereal crop production. In the cotton–livestock system cereals like sorghum are<br />
extensively produced, while <strong>in</strong> the sesame–livestock system sesame is the dom<strong>in</strong>ant crop<br />
<strong>and</strong> herbicides are extensively used to control important weeds <strong>and</strong> forbs m<strong>in</strong>imiz<strong>in</strong>g<br />
stubble graz<strong>in</strong>g. This f<strong>in</strong>d<strong>in</strong>g agrees with the reports of Sisay (2006).<br />
Table 12. Percentage of respondents us<strong>in</strong>g stubble graz<strong>in</strong>g by farm<strong>in</strong>g system <strong>in</strong> <strong>Metema</strong><br />
Species<br />
CLFS SLFS Overall<br />
HHC % HHC % HHC %<br />
Cattle 9 15.0 11 13.8 20 14.3<br />
Goat 15 25.0 23 28.8 38 27.1<br />
Sheep 11 18.3 9 11.3 20 14.3<br />
Donkey 12 20.0 11 13.8 23 16.4<br />
CLFS = cotton–livestock farm<strong>in</strong>g system; SLFS = sesame–livestock farm<strong>in</strong>g system, HHC = household count.<br />
4.7.4 Supplementary <strong>feed</strong><strong>in</strong>g<br />
The types <strong>and</strong> the amount of supplementary <strong>feed</strong><strong>in</strong>g for livestock are summarized <strong>in</strong><br />
Table 13. Crop residues, sesame oil by-products (‘embaze’), noug cake, hay, wheat bran<br />
<strong>and</strong> local brewery by-product (‘atela’) are the major supplementary <strong>feed</strong> used <strong>in</strong> the dry<br />
season. More number of respondents (28.3%) <strong>in</strong> the cotton–livestock farm<strong>in</strong>g system use<br />
crop residues as supplementary <strong>feed</strong> than those <strong>in</strong> the sesame–livestock farm<strong>in</strong>g system<br />
(20.0%). This could be due to the more availability of residues <strong>and</strong> experiences of the<br />
farmers <strong>in</strong> collect<strong>in</strong>g <strong>and</strong> utilization of residues <strong>in</strong> the cotton–livestock farm<strong>in</strong>g system. As<br />
expected, the use of embaze as a supplementary <strong>feed</strong> is higher <strong>in</strong> the sesame–livestock<br />
(26.3%) than the cotton–livestock farm<strong>in</strong>g system (6.7%), due to availability <strong>and</strong> easy<br />
access <strong>in</strong> the former system.<br />
Amount of supplementation<br />
Data on the amounts of supplementary <strong>feed</strong> offered to livestock are presented <strong>in</strong> Table 13.<br />
Most of the respondents (53%) provide 1 kg of supplementary <strong>feed</strong> per cattle per day, <strong>and</strong><br />
this is slightly higher <strong>in</strong> the cotton–livestock (55%) than <strong>in</strong> the sesame–livestock (51.25%)<br />
farm<strong>in</strong>g system. About 22 <strong>and</strong> 19% of the respondents also <strong>in</strong>dicated that they provide<br />
1.5 <strong>and</strong> 0.5 kg per cattle per day, respectively. About 66 <strong>and</strong> 31% of the respondents also<br />
<strong>in</strong>dicated that they provide 1 kg <strong>and</strong> 1.5 kg of supplementary <strong>feed</strong> per donkey per day,<br />
respectively. This <strong>in</strong>dicates that donkeys are important assets to the household <strong>and</strong> the<br />
community at large <strong>in</strong> <strong>Metema</strong>.<br />
32
Table 13. Percentages of respondents show<strong>in</strong>g the types <strong>and</strong> amount of supplementation of <strong>feed</strong>s <strong>in</strong><br />
the two farm<strong>in</strong>g systems <strong>in</strong> <strong>Metema</strong><br />
Variables<br />
CLFS (N = 60) SLFS (N = 80) Overall (N = 140)<br />
HH % HH % HH %<br />
Types of supplementation<br />
Cattle<br />
Crop residues only 17 28.3 16 20.0 31 12.9<br />
Crop residues + embaze 10 16.7 12 15.0 22 15.7<br />
Embaze (sesame cake) 4 6.7 21 26.3 25 17.7<br />
Noug cake 9 15.0 7 8.8 16 11.4<br />
Grass hay 8 13.3 10 12.5 18 12.9<br />
Wheat bran 5 8.3 9 11.3 14 10.0<br />
Atela 3 5.0 – 5 3.6<br />
Atela + hay 4 6.7 5 6.3 9 6.4<br />
Donkey<br />
Crop residues 20 33.3 29 36.3 49 35.0<br />
Hay only 4 6.7 7 8.8 11 7.9<br />
Gra<strong>in</strong>s 36 60.0 44 55.0 80 57.1<br />
Amount of supplementation, kg/animal per day<br />
Cattle<br />
2 4 6.7 9 11.3 13 5.4<br />
1.5 15 25.0 6 7.5 31 22.1<br />
1 33 55.0 41 51.3 74 52.9<br />
0.5 6 10.0 20 25.0 26 18.6<br />
0.75 2 3.3 4 5.0 6 4.2<br />
Donkey<br />
2 1 1.7 4 5.0 5 3.6<br />
1.5 19 31.7 24 30.0 43 30.7<br />
1 40 66.7 52 65.0 92 65.7<br />
Crop residues only = 1 kg/animal per day; Crop residues + Embaze = 1.5 kg/animal per day; embaze (sesame<br />
cake) = 0.5 kg/animal per day; noug cake = 0.75 kg/animal per day; Grass hay = 2 kg/animal per day.<br />
The amount of wheat bran, atela <strong>and</strong> atela plus hay offered are not estimated due to small<br />
quantity offered to animals. Dur<strong>in</strong>g the field work it was also noted that the amount of<br />
supplementary <strong>feed</strong>s offered, especially sesame cake, noug cake <strong>and</strong> wheat bran was<br />
very small, <strong>and</strong> the major purpose of supplementation is not to <strong>in</strong>crease productivity, but<br />
is focused to those animals that are susceptible to diseases, weak animals, suckl<strong>in</strong>g cows<br />
<strong>and</strong> calves.<br />
4.7.5 Feed<strong>in</strong>g calendar <strong>and</strong> seasonal availability of <strong>feed</strong> <strong>resources</strong><br />
Seasonal availability of <strong>feed</strong> <strong>resources</strong> <strong>in</strong> the study area, as obta<strong>in</strong>ed from group<br />
discussion <strong>and</strong> observation dur<strong>in</strong>g the field work is presented <strong>in</strong> Table 14. The pattern<br />
of <strong>feed</strong> <strong>resources</strong> availability <strong>in</strong> the district is <strong>in</strong>fluenced by season as <strong>in</strong> the highl<strong>and</strong><br />
33
areas (Ahmed 2006) <strong>and</strong> the trend followed similar pattern with the f<strong>in</strong>d<strong>in</strong>gs of Sisay<br />
(2006).<br />
Table 14. Availability of different <strong>feed</strong> <strong>resources</strong> by month <strong>in</strong> the district<br />
Type of <strong>feed</strong><br />
Month<br />
Jun Jul Aug Sep Oct Nov Dec Jan Feb Mar Apr May<br />
Natural pasture * * * * * * ----- ---- ----- ---- ----- -----<br />
Crop residues * * * *<br />
Stubble graz<strong>in</strong>g ---- * * *<br />
Hay * * * *<br />
Supplementation --- * *<br />
Fodder trees * * * *<br />
----- = Availability of few green browse species <strong>and</strong> dry grasses; * = Abundant<br />
4.7.6 Chemical composition of the major <strong>feed</strong> <strong>resources</strong><br />
The effect of species on chemical composition<br />
Chemical composition of different species of <strong>feed</strong> <strong>resources</strong> is given <strong>in</strong> Table 15.<br />
Comparison of the chemical composition of the three major grass species (Pennisetum<br />
spheslatum, Cenchrus ciliaris <strong>and</strong> Pterocarpus lucens) <strong>in</strong>dicated that there is a species<br />
difference <strong>in</strong> nutrient contents.<br />
Table 15. Chemical composition (Mean ± SE) of different <strong>feed</strong>s <strong>in</strong> the study districts<br />
Chemical composition,%<br />
Species<br />
P. spheslatum C. ciliaris P. lucens<br />
DM 90.2 ± 0.14a 89.9 ± 0.14ab 89.0 ± 0.14b<br />
Ash 20.1 ± 2.54a 15.3 ± 2.54ab 7.7 ± 2.54b<br />
OM 79.9 ± 2.54ab 84.7 ± 2.54ab 92.3 ± 2.54a<br />
CP 6.3 ± 0.43ab 6.4 ± 0.43ab 15.8 ± 0.43a<br />
NDF 69.3 ± 0.64b 74.6 ± 0.64a 58.2 ± 0.64c<br />
ADF 45.8 ± 0.55a 45.9 ± 0.55a 43.1 ± 0.55b<br />
ADL 8.1 ± 0.74ab 5.9 ± 0.74ab 21.3 ± 0.74a<br />
IVDMD 45.9 ± 1.18b 39.3 ± 1.18c 47.8 ± 1.18a<br />
Means with different superscripts <strong>in</strong> a row differ significantly (P
than <strong>in</strong> P. spheslatum <strong>and</strong> C. ciliaris. Mean OM, CP <strong>and</strong> IVDMD contents <strong>in</strong> P. lucens<br />
were significantly (P < 0.05) higher than the other two species. The differences <strong>in</strong> nutrient<br />
content between species could be associated with their <strong>in</strong>herent nature, i.e. fodder trees<br />
conta<strong>in</strong> more prote<strong>in</strong> than grass species. As reported by Mathur et al. (1991) most grasses<br />
<strong>and</strong> tree leaves <strong>in</strong> arid environments are low <strong>in</strong> nutritive value because of high contents<br />
of lign<strong>in</strong> <strong>and</strong> relatively <strong>in</strong>digestible (compared with starch) cellulose <strong>and</strong> hemicelluloses.<br />
The effects of season on chemical composition<br />
Data on the effect of season on chemical composition of dom<strong>in</strong>antly grow<strong>in</strong>g two<br />
grass <strong>and</strong> one fodder species are given <strong>in</strong> Table 16. The DM, OM, NDF, ADF <strong>and</strong> ADL<br />
contents of <strong>feed</strong>s were significantly (P < 0.05) higher <strong>in</strong> October than <strong>in</strong> August. Whereas,<br />
the percentages of ash, CP, IVDMD of the <strong>feed</strong>s were significantly (P < 0.05) lower<br />
<strong>in</strong> October than <strong>in</strong> August. This may be associated with the temperature, the stages of<br />
growth <strong>and</strong> the plant species that <strong>in</strong>fluenced the quality of <strong>feed</strong>s. This f<strong>in</strong>d<strong>in</strong>g agrees with<br />
earlier reports (Alemayehu 2006; Sisay 2006), that the structural constituents of plant<br />
materials (lign<strong>in</strong>, cellulose <strong>and</strong> hemicelluloses) <strong>in</strong>crease with maturity. Dur<strong>in</strong>g the growth<br />
stage, plants are most nutritious. Once mature, plants are subject to leach<strong>in</strong>g <strong>and</strong> dilution<br />
of nutrients <strong>and</strong> reduction <strong>in</strong> nutritive value. Decl<strong>in</strong>es <strong>in</strong> nutrient composition <strong>and</strong><br />
leach<strong>in</strong>g are especially serious <strong>in</strong> the case of herbaceous plants. As the plant matures,<br />
the contents of crude prote<strong>in</strong>, the more readily digestible carbohydrates <strong>and</strong> phosphorus<br />
decrease <strong>and</strong> that of fibre, lign<strong>in</strong> <strong>and</strong> cellulose <strong>in</strong>crease. The decl<strong>in</strong>e <strong>in</strong> nutritive value<br />
of these <strong>feed</strong>s <strong>in</strong> October <strong>in</strong>dicates that <strong>feed</strong> conservation practised by the communities<br />
between mid October <strong>and</strong> November is not appropriate time <strong>and</strong> should be done earlier<br />
than <strong>in</strong> mid October.<br />
Table 16. Effect of season on chemical composition (Mean ± SE) of composite samples of dom<strong>in</strong>ant<br />
<strong>feed</strong> species <strong>in</strong> <strong>Metema</strong><br />
Chemical composition, %<br />
Season<br />
Wet (August) Dry (October)<br />
DM 88.9 ± 0.11 b 90.5 ± 0.11 a<br />
ASH 18.2 ± 2.07 a 10.5 ± 2.07 b<br />
OM 81.8 ± 2.07 b 89.5 ± 2.07 a<br />
CP 10.8 ± 0.35 a 8.2 ± 0.35 b<br />
NDF 60.8 ± 0.52 b 73.9 ± 0.52 a<br />
ADF 40.3 ± 0. 45 a 49.6 ± 0.45 a<br />
ADL 10.1 ± 0.60 b 13.5 ± 0.60 a<br />
IVDMD 50.7 ± 0.96 a 37.9 ± 0.96 b<br />
Means with different superscripts <strong>in</strong> a row differ significantly (P
4.7.7 Feed balance<br />
The estimate of the total available <strong>feed</strong>s <strong>in</strong> terms of dry matter (calculated from graz<strong>in</strong>g<br />
l<strong>and</strong>, cultivated l<strong>and</strong> (crop residues <strong>and</strong> stubble), <strong>and</strong> forest l<strong>and</strong>) is presented <strong>in</strong> Table 17.<br />
The total estimated annual DM from crop residues, graz<strong>in</strong>g l<strong>and</strong> <strong>and</strong> stubble is 827.16,<br />
780,750.0 <strong>and</strong> 51,954.0 t; totall<strong>in</strong>g 833,531.16 t. The total livestock population <strong>in</strong> TLU<br />
(tropical livestock unit) is estimated at 103,190. Daily DM requirement for ma<strong>in</strong>tenance<br />
of one TLU is estimated as 2.5% of the body weight (ILCA 1990) that is, 250 × 2.5% =<br />
6.25 kg DM per day <strong>and</strong> (6.25 × 365 = 2280 kg) per annum. Therefore, the total DM<br />
requirement for ma<strong>in</strong>tenance per annum is estimated at 235,273.2 t. Based on this<br />
calculation, the estimated <strong>feed</strong> balance <strong>in</strong> the district is 598,258 t DM. This f<strong>in</strong>d<strong>in</strong>g is<br />
<strong>in</strong> agreement with the estimates of Sisay (2006) who reported that the nutrient balance<br />
<strong>in</strong> <strong>Metema</strong> is sufficient to support the livestock hold<strong>in</strong>gs per household. However, the<br />
quality of the <strong>feed</strong> is poor.<br />
Table 17. Estimates of <strong>feed</strong> balance <strong>in</strong> <strong>Metema</strong> district<br />
Livestock species A<br />
(TLU)<br />
B A × B C C – (A × B) D<br />
Cattle 95,837 2.28 218,508.4<br />
Goat 3202 2.28 7300.6<br />
Sheep 169 2.28 385.3<br />
Donkey 3582 2.28 8167.0<br />
Camel 400 2.28 912.0<br />
Total 103,190 235,273.3 833,531.2 598,257.9 0.00<br />
A = Livestock number <strong>in</strong> the district (TLU), B = Feed requirement of per animal (t Dm/year), A × B = Total <strong>feed</strong><br />
requirement of all animals (t DM/year), C = Estimate of available <strong>feed</strong> <strong>resources</strong> (t DM/year), C–(A × B) = Estimated<br />
<strong>feed</strong> balance of the district, D = Deficit (if any).<br />
4.7.8 Water <strong>resources</strong><br />
Availability of water <strong>in</strong> graz<strong>in</strong>g areas is a good opportunity for livestock <strong>and</strong> human<br />
be<strong>in</strong>gs liv<strong>in</strong>g <strong>in</strong> a lowl<strong>and</strong> agro-ecology like <strong>Metema</strong> district. Based on respondents <strong>and</strong><br />
observations made dur<strong>in</strong>g the study, the major sources of water <strong>in</strong> the district (Table 18)<br />
are rivers (64.3%), spr<strong>in</strong>gs (21.4%) <strong>and</strong> ponds (10.7%). Rivers are equally important<br />
sources of water <strong>in</strong> both farm<strong>in</strong>g systems. There are three large cont<strong>in</strong>uous rivers pass<strong>in</strong>g<br />
through the district <strong>and</strong> used for livestock <strong>and</strong> irrigation activities. Ponds are more<br />
important sources of water <strong>in</strong> the cotton–livestock (18.3%) than <strong>in</strong> the sesame–livestock<br />
(5%) farm<strong>in</strong>g system, while spr<strong>in</strong>gs are more important <strong>in</strong> the sesame–livestock (28%)<br />
than <strong>in</strong> the cotton–livestock (13.3%) farm<strong>in</strong>g system. IPMS (2005) also reported that<br />
farmers <strong>and</strong> agriculturists believe that the underground water table is high <strong>and</strong> <strong>in</strong> some<br />
places sufficient amount of water could be obta<strong>in</strong>ed at less than 10 m depth. The majority<br />
36
of the respondents (69.3%) water their animals once a day, while about 31% water twice<br />
a day (Table 18). This result is <strong>in</strong> agreement with Teshome (2006).<br />
Table 18. Sources of water <strong>and</strong> water<strong>in</strong>g frequency by farm<strong>in</strong>g system for cattle <strong>in</strong> <strong>Metema</strong> (percentage<br />
of respondents)<br />
Parameter<br />
CLFS SLFS Overall<br />
N % N % N %<br />
Sources of water<br />
River 39 65.1 51 63.7 90 64.3<br />
Pond 11 18.3 4 5.0 15 10.7<br />
Spr<strong>in</strong>g 8 13.3 22 27.5 30 21.4<br />
Wells 2 3.3 3 3.8 5 3.6<br />
Water<strong>in</strong>g frequency<br />
Once a day 37 61.7 60 75.0 97 69.3<br />
Twice a day 23 38.3 20 25.0 43 30.7<br />
CLFS = cotton–livestock farm<strong>in</strong>g system; SLFS = sesame–livestock farm<strong>in</strong>g system.<br />
4.7.9 Major constra<strong>in</strong>ts to livestock production<br />
The major problems associated with livestock production as perceived by the respondents<br />
are presented <strong>in</strong> Table 19. About a quarter of the respondents <strong>in</strong>dicated livestock theft as<br />
their major problem <strong>in</strong> both farm<strong>in</strong>g systems. Dur<strong>in</strong>g group discussions, elders reported<br />
that at times up to 90 heads of cattle are stolen. The trend appears to be escalat<strong>in</strong>g from<br />
time to time. The location of the district encourages theft as there is an extensive area<br />
border<strong>in</strong>g the Sudan mak<strong>in</strong>g it easier for cattle rustlers to trek the animals across the<br />
boarder.<br />
Table 19. Percentage of respondents show<strong>in</strong>g major problems to livestock production <strong>in</strong> <strong>Metema</strong><br />
Variables<br />
CLFS (N = 60) SLFS (N = 80) Overall<br />
HH % HH % HH %<br />
Feed shortage 4 15.0 4 5.0 8 5.7<br />
Bit<strong>in</strong>g <strong>in</strong>sects 8 13.3 10 12.5 18 12.9<br />
Livestock diseases 10 16.7 15 18.8 25 17.9<br />
Labour shortage 4 6.7 5 6.3 9 6.4<br />
Drought 5 8.3 7 8.8 12 8.6<br />
Livestock theft 14 23.3 19 23.8 33 23.6<br />
Conflict with highl<strong>and</strong>ers 5 8.3 8 10.0 13 9.3<br />
Crop l<strong>and</strong> encroachment 7 11.7 8 10.0 15 10.7<br />
Shortage of crop residues 3 5.0 4 5.0 7 5.0<br />
HH = Households, CLFS = cotton–livestock farm<strong>in</strong>g system, SLFS = sesame–livestock farm<strong>in</strong>g system.<br />
Livestock diseases (16.7%) <strong>and</strong> bit<strong>in</strong>g <strong>in</strong>sects (13.3%) were the secondly <strong>and</strong> thirdly<br />
prioritized constra<strong>in</strong>ts <strong>in</strong> both CLFS <strong>and</strong> <strong>in</strong> the SLFS, respectively. About 11% of the<br />
respondents <strong>in</strong>dicated that crop l<strong>and</strong> encroachment is affect<strong>in</strong>g livestock production. The<br />
37
possible causes of the crop l<strong>and</strong> encroachment might be due to the human population<br />
pressure through cont<strong>in</strong>uous settlement program by government, <strong>in</strong>creas<strong>in</strong>g number of<br />
voluntary settlers <strong>and</strong> settler’s relatives from the neighbour<strong>in</strong>g highl<strong>and</strong> districts <strong>and</strong> the<br />
natural <strong>in</strong>crease <strong>in</strong> population.<br />
Conflict between transhumants <strong>and</strong> the local <strong>in</strong>habitants for livestock <strong>feed</strong> <strong>resources</strong><br />
was not a major problem <strong>and</strong> was reported by about 9% of the respondents. Feed<br />
shortage, drought <strong>and</strong> shortage of crop residues were m<strong>in</strong>or concerns <strong>and</strong> were reported<br />
by only 5.7, 8.6 <strong>and</strong> 5% of the respondents, respectively. Dur<strong>in</strong>g the group discussion,<br />
it was noted that there are two major varieties of sorghum grown by farmers. These<br />
are ‘wodiaker’ <strong>and</strong> ‘zole’, <strong>and</strong> the former is highly preferred by livestock. The residue<br />
from the later variety is left as mulch or burned <strong>in</strong> the field. Farmers also reported that<br />
the productivity of wodiaker variety is decl<strong>in</strong><strong>in</strong>g at an alarm<strong>in</strong>g rate due to loss of soil<br />
fertility, while the zole variety grows well on less fertile soil <strong>and</strong> is more productive than<br />
the wodiaker variety. This could contribute to <strong>feed</strong> shortage dur<strong>in</strong>g the long dry season.<br />
An alternative dual purpose sorghum variety suitable for the agro-ecology should be<br />
developed <strong>in</strong> the future.<br />
4.8 Floristic composition<br />
4.8.1 Herbaceous species composition<br />
A total of 33 herbaceous species were recorded, <strong>and</strong> out of these, 14 (42.4%) were<br />
grasses, 6 (18.2%) were legumes, <strong>and</strong> 13 (39.4%) were sedges <strong>and</strong> others (Table 20;<br />
Appendix Table 6). Of the grass species identified, 23.1% were categorized as highly<br />
desirable, 38.5% desirable <strong>and</strong> 30.8% less desirable. This might be due to the gradual<br />
disappearance of highly desirable species through over use <strong>and</strong> disturbance by livestock<br />
<strong>and</strong> human be<strong>in</strong>gs. From the discussion held with the farmers, it was understood that the<br />
major factors that cause the decl<strong>in</strong>e <strong>in</strong> the abundance of highly desirable species were<br />
drought followed by overgraz<strong>in</strong>g due to the <strong>in</strong>crease <strong>in</strong> graz<strong>in</strong>g pressure, <strong>in</strong>vader plants<br />
have replaced decreaser <strong>and</strong> <strong>in</strong>creaser plants. Furthermore, overgraz<strong>in</strong>g reduces ground<br />
cover, plant height, forage quality <strong>and</strong> productivity, changes are <strong>in</strong>duced <strong>in</strong> the dom<strong>in</strong>ant<br />
growth forms of herbaceous plants; tall perennial bunch grass species give way to shorter<br />
rhizomatous <strong>and</strong> sotoloniferous perennial grasses which are replaced by annual grass <strong>and</strong><br />
forbs species (Herlocker 1999; Abule et al. 2007a). Besides, overgraz<strong>in</strong>g tends to reduce<br />
perennial grassl<strong>and</strong> vegetation types <strong>and</strong> allows <strong>in</strong>vasion by annual forbs <strong>and</strong> grasses.<br />
Drought <strong>and</strong> overgraz<strong>in</strong>g could be the causal factors for the decl<strong>in</strong>e <strong>in</strong> plant species<br />
composition <strong>and</strong> diversity of plants over time (Admasu 2006; Alemayehu 2006; Amaha<br />
2006; Abule et al. 2007a).<br />
38
Table 20. Common <strong>and</strong> dom<strong>in</strong>ant grass species identified by farm<strong>in</strong>g systems <strong>and</strong> different graz<strong>in</strong>g<br />
types <strong>in</strong> <strong>Metema</strong><br />
Grasses<br />
Category<br />
CLFS<br />
SLFS<br />
CG RS EN CG RS EN<br />
C. ciliars DS D C C C C<br />
P. sphacelatum DS C C D C C<br />
Setaria pumila DS C C C C C<br />
Brachiaria lata DS C C<br />
Urochloa fatamensis LD C C<br />
Rhamphicarpa fistulosa LD C C C<br />
Temeda tri<strong>and</strong>ria HD D<br />
Cynodon dyctlon HD C<br />
Cyprus spp. DS C C<br />
Eleus<strong>in</strong>e floccifolia LD D D C<br />
Hyparrhenia rufa HD D D<br />
Panicum coloratum HD D<br />
Sporobolus pyramidialis DS C<br />
HD = highly desirable; DS = desirable; LD = less desirable; CG = communal graz<strong>in</strong>g; RS = road side; EN =<br />
enclosure; P = present (5% <strong>and</strong> 20% of DM).<br />
4.8.2 Woody species composition<br />
A total of 20 woody species were identified <strong>in</strong> the study district (Table 21; Appendix Table<br />
5), <strong>and</strong> 15, 35, <strong>and</strong> 50% are highly desirable, desirable <strong>and</strong> less desirable, respectively.<br />
The highest proportion of the woody vegetation is composed of different species of acacia<br />
(20%) <strong>and</strong> commbretum (10%). Species such as Anogeissus leiocarpus, P. lucens, <strong>and</strong><br />
Ziziphus sp<strong>in</strong>a-christi are highly desirable <strong>and</strong> they are dom<strong>in</strong>ant <strong>in</strong> enclosure areas.<br />
Besides different species of acacia, Balanites aegyptiaca, Boswelia papyrifera, Combretum<br />
coll<strong>in</strong>um, C. mole, Dichrostachys c<strong>in</strong>erea, Ficus sycomorus, Fluegea virosa, Gardenia<br />
ternifolia, Grewia villosa, Stereospermum kunthianum, Term<strong>in</strong>alia laxiflora <strong>and</strong> Ximenia<br />
Americana are commonly found woody species (Table 21). In sesame based fram<strong>in</strong>g<br />
system, Acacia polyacantha, A. seyal, Balanites aegyptiaca <strong>and</strong> B. papyrifera were the<br />
dom<strong>in</strong>ant species <strong>in</strong> communal graz<strong>in</strong>g areas <strong>and</strong> A. tortilis, A. leiocarpus, A. senegal, C.<br />
coll<strong>in</strong>um, C. mole, D. c<strong>in</strong>erea, F. sycomorus, F. virosa, P. lucens, <strong>and</strong> Z. sp<strong>in</strong>a-christi, were<br />
common species. In road side graz<strong>in</strong>g areas, A. polyacantha <strong>and</strong> D. c<strong>in</strong>erea dom<strong>in</strong>ated<br />
<strong>and</strong> A. seyal, B. aegyptiaca, B. papyrifera, T. laxiflora, C. coll<strong>in</strong>um, C. mole <strong>and</strong> X.<br />
Americana were common species found. From this result, the graz<strong>in</strong>g l<strong>and</strong> <strong>in</strong> the district<br />
could be characterized as acacia dom<strong>in</strong>ated wood l<strong>and</strong> <strong>and</strong> the woody vegetation were<br />
the important sources of <strong>feed</strong> for rum<strong>in</strong>ant animals <strong>in</strong> the area.<br />
39
Table 21. Common <strong>and</strong> dom<strong>in</strong>ant woody species <strong>and</strong> their percentage composition by farm<strong>in</strong>g<br />
system <strong>in</strong> different graz<strong>in</strong>g areas <strong>in</strong> <strong>Metema</strong><br />
Woody species Category<br />
CLFS<br />
SLFS<br />
CG RS EN CG RS EN<br />
G. ternifolia LD C<br />
A. polyacantha DS D D C D D<br />
T. laxiflora C C C<br />
A. tortilis DS C D C C C<br />
A. seyal DS D C D D C C<br />
D. c<strong>in</strong>erea DS D C D<br />
A. leiocarpus DS C C D C D<br />
P. lucens HD C D C D<br />
F. sycomorus DS C C<br />
C. coll<strong>in</strong>um LD C C C<br />
X. Americana LD C<br />
S. kunthianum DS C<br />
B. aegyptiaca DS C C D C C<br />
G. villosa LD C<br />
Z. sp<strong>in</strong>a-christi HD C C D C D<br />
Piliostigma ton<strong>in</strong>gii DS<br />
F. virosa LD C C<br />
B. papyrifera UD C C C D C D<br />
A. senegal DS D C C C<br />
C. mole LD C C<br />
CLFS = cotton–livestock farm<strong>in</strong>g system; SLFS = sesame–livestock farm<strong>in</strong>g system; CG: communal graz<strong>in</strong>g; RS:<br />
road side; EN: enclosure; C = common (>10% <strong>and</strong> 20% density).<br />
Accord<strong>in</strong>g to the result obta<strong>in</strong>ed from group discussions, P. lucens is one of the most<br />
important fodder trees <strong>in</strong> the district. After the long dry season dur<strong>in</strong>g the on set of the<br />
ma<strong>in</strong> ra<strong>in</strong> season, the community practised to search P. lucens to heal their emaciated<br />
animals. The communities take care of this tree species by their own aga<strong>in</strong>st destruction<br />
unlike other species. Thus, woody plants contribute significantly to the sources of<br />
livestock <strong>feed</strong> <strong>in</strong> the district. The f<strong>in</strong>d<strong>in</strong>g is agreed with the report suggested that woody<br />
species are important source of food, fodder, fuel wood, medic<strong>in</strong>e, fibre <strong>and</strong> gums<br />
(Herlocker 1999; Alemayehu 2006; Abule et al. 2007b).<br />
Height classes of woody vegetation<br />
The height class distribution of trees <strong>and</strong> shrubs <strong>in</strong> the farm<strong>in</strong>g systems are presented <strong>in</strong><br />
(Table 22). There is no difference <strong>in</strong> height class category of < 0–1 m between graz<strong>in</strong>g<br />
types found <strong>in</strong> both farm<strong>in</strong>g systems. The highest percentage of distribution of trees <strong>and</strong><br />
shrubs is found <strong>in</strong> height class category of > 1–3 m <strong>in</strong> both farm<strong>in</strong>g systems <strong>and</strong> are also<br />
comparable. Generally, most height classes of the vegetation could be considered at<br />
40
ows<strong>in</strong>g height of the animals. Accord<strong>in</strong>g to Ta<strong>in</strong>ton (1999) height of 1.5 m represents<br />
the mean brows<strong>in</strong>g height for goats.<br />
Table 22. Percentage of height class (metres) distribution of trees <strong>and</strong> shrubs <strong>in</strong> <strong>Metema</strong><br />
Height class<br />
CLFS<br />
SLFS<br />
CG RS EN CG RS EN<br />
< 0–1 m 22.6 25.0 21.1 20.6 23.1 20.8<br />
> 1–3 m 45.2 33.3 42.1 41.2 38.5 33.3<br />
>3–4.5 m 19.4 16.7 15.8 26.5 23.1 12.5<br />
> 4.5 m 12.9 25.0 21.1 11.8 15.4 33.3<br />
CLFS = cotton–livestock farm<strong>in</strong>g system; SLFS = sesame–livestock farm<strong>in</strong>g system; CG = communal graz<strong>in</strong>g; RS<br />
= road side graz<strong>in</strong>g, EN = enclosure.<br />
Hence, these reachable heights of different woody browse species make the area<br />
favourable to raise brows<strong>in</strong>g animal species such as goats <strong>and</strong> at the same time ma<strong>in</strong>ta<strong>in</strong><br />
the balance between the woody <strong>and</strong> herbaceous species. Studies suggested that<br />
<strong>in</strong>tegration of grazers <strong>and</strong> browsers hav<strong>in</strong>g different <strong>feed</strong><strong>in</strong>g habitats makes more efficient<br />
use of natural vegetations. Accord<strong>in</strong>g to Taylor (1985), when cattle were partly replaced<br />
by goats <strong>and</strong>/or sheep, <strong>in</strong>dividual cattle performance <strong>in</strong>creased because forage dem<strong>and</strong><br />
for the grass component was reduced. Likewise, production of ewes <strong>in</strong>creased when<br />
some sheep were replaced by cattle <strong>and</strong> goats because graz<strong>in</strong>g pressure on the forbs<br />
component decl<strong>in</strong>ed. Herd diversification through <strong>in</strong>creas<strong>in</strong>g the number of browsers<br />
such as camels <strong>and</strong> goats would also contribute towards efficient resource utilization <strong>and</strong><br />
decreases woody plant encroachments <strong>in</strong> rangel<strong>and</strong>s (Gemedo 2004).<br />
4.8.3 Vegetation <strong>in</strong> the cotton–livestock farm<strong>in</strong>g system<br />
Herbaceous species composition<br />
From a total of 24 herbaceous species recorded <strong>in</strong> the cotton–livestock farm<strong>in</strong>g system,<br />
50, 20.8 <strong>and</strong> 29.2% are different species of grasses, legumes <strong>and</strong> sedges (Table 23).<br />
Among the grass species identified, 25% are highly desirable, 33.3% are desirable<br />
<strong>and</strong> 41.7% are less desirable, respectively. The ratios of the herbaceous species<br />
(grasses:legumes:sedges) is 12:5:7. Bracheria lata, P. spheslatum, R. fistulosa <strong>and</strong> Seteria<br />
pumila are the common grass species. In the communal graz<strong>in</strong>g areas, C. ciliaris is<br />
the dom<strong>in</strong>ant grass species, while Cyprus spp, Eurochloa fatamensis fistulosa, R. <strong>and</strong><br />
S. pumila, are the common grass species. In the road side graz<strong>in</strong>g areas, E. flocifolia is<br />
dom<strong>in</strong>ant. The enclosure areas have a relatively higher percentage of highly desirable<br />
grass species than the communal <strong>and</strong> road side graz<strong>in</strong>g areas. In the enclosure areas, C.<br />
ciliaris, Cyprus spp, E. fatamensis, P. spheslatum <strong>and</strong> S. pumila, are the common species,<br />
while Themeda teri<strong>and</strong>ra <strong>and</strong> H. rufa are dom<strong>in</strong>ant. This could be attributed to a better<br />
41
management practice <strong>and</strong> a lower livestock impact <strong>in</strong> the enclosure areas. This result is <strong>in</strong><br />
agreement with earlier reports (Admasu 2006; Amaha 2006; Teshome 2006).<br />
Table 23. Herbaceous species composition (% DM biomass) <strong>and</strong> their desirability by graz<strong>in</strong>g type<br />
<strong>in</strong> cotton–livestock farm<strong>in</strong>g system <strong>in</strong> <strong>Metema</strong><br />
Graz<strong>in</strong>g types Herbaceous species Category % composition Remark<br />
Communal C. ciliaris DS 21.2 Grasses<br />
P. sphacelatum DS 5.8<br />
S. pumila DS 10.4<br />
B. lata DS 6.2<br />
U. fatamensis LD 1.4<br />
R. fistulosa LD 16.66<br />
Urochloa cf. brchyura LD 1.2<br />
T. tri<strong>and</strong>ria HD 2.6<br />
C. dyctlon HD 1.4<br />
Ahiya abish (local name) UD Legumes<br />
Alysicarpus quart<strong>in</strong>ianus LD<br />
Vigna membranacea<br />
Chamaecrista mimosoides (L)<br />
Euphhorbia <strong>in</strong>dica UD Sedges<br />
Spermacoce sphaerostima UD 1.3<br />
Hygrophilla schulli UD 10.4<br />
Kedrostis foetidissima LD 0.63<br />
Commel<strong>in</strong>a subula UD 0.5<br />
Road side C. dyctlon HD 3.4 Grasses<br />
Cypres spp. LD 6.7<br />
C ciliaris DS 14.9<br />
S. pumila DS 17.2<br />
U. fatamensis LD 5.3<br />
R. fistulosa LD 5.2<br />
E. floccifolia LD 23.6<br />
Ahiya abish (local name) UD 13.2 Legumes<br />
A. quart<strong>in</strong>ianus LD 8.0<br />
V. membranacea DS<br />
Road side Cyanotis barbata UD Sedges<br />
LD<br />
UD<br />
H. schulli UD<br />
S. sphaerostima UD<br />
Bidens setigera<br />
UD<br />
K. foetidissima LD<br />
Zennia elegans Jaqu<strong>in</strong>.<br />
UD<br />
42
Graz<strong>in</strong>g types Herbaceous species Category % composition Remark<br />
Enclosure P. sphacelatum DS 6.1 Grasses<br />
C. ciliaris DS 6.5<br />
S. pumila DS 5.2<br />
B. lata DS 1.9<br />
U. fatamensis LD 5.2<br />
T. tri<strong>and</strong>ra HD 22.6<br />
H. rufa HD 24.4<br />
C. dyctlon HD 5.8<br />
Indigofera spicata DS Legumes<br />
A. quart<strong>in</strong>ianus LD<br />
Dismodium dichotomum (Kle<strong>in</strong>) DS<br />
Hibiscus articulatus HD Sedges<br />
C. barbata UD<br />
C. subula UD<br />
H. vitifolius L. DS<br />
HD = highly desirable, DS = desirable, LD = less desirable.<br />
Woody vegetation<br />
A total of 17 woody species were recorded (Table 24), <strong>and</strong> 17.7, 41.2, 35.3 <strong>and</strong> 5.9%<br />
are highly desirable, desirable, less desirable <strong>and</strong> undesirable species, respectively. A.<br />
polyacantha, A. seyal, A. senegal <strong>and</strong> B. papirefera are the dom<strong>in</strong>ant species whereas, A.<br />
tortolis, A. leiocarpus, B. aegyptiaca, F. sycomorus, G. ternifolia, P. lucens, T. laxiflora <strong>and</strong><br />
Z. sp<strong>in</strong>a-christi are commonly found <strong>in</strong> communal graz<strong>in</strong>g areas. In road side graz<strong>in</strong>g<br />
areas, A. polyacantha, A. tortilis <strong>and</strong> D. c<strong>in</strong>erea are the dom<strong>in</strong>ant species, while A. seyal,<br />
A. leiocarpus, A. senegal, B. papyrifera, Z. sp<strong>in</strong>a-christi are common. In the enclosure<br />
graz<strong>in</strong>g areas, A. leiocarpus, P. lucens, A. seyal <strong>and</strong> Z. sp<strong>in</strong>a-christi are dom<strong>in</strong>ant woody<br />
plant species <strong>and</strong> A. polyacantha, B. aegyptiaca, B. papyrifera, A. senegal, <strong>and</strong> T. laxiflora<br />
are common. The proportion of desirable species <strong>in</strong> this farm<strong>in</strong>g system is considerably<br />
higher than the highly desirable <strong>and</strong> less desirable species. This could favour rais<strong>in</strong>g<br />
brows<strong>in</strong>g livestock species like goats <strong>and</strong> camels.<br />
4.8.4 Vegetation <strong>in</strong> the sesame–livestock farm<strong>in</strong>g system<br />
Herbaceous species<br />
Herbaceous species obta<strong>in</strong>ed <strong>in</strong> sesame based farm<strong>in</strong>g system <strong>and</strong> their percentage<br />
composition is presented <strong>in</strong> (Table 25).<br />
43
Table 24. Woody species <strong>and</strong> percentage composition <strong>in</strong> different graz<strong>in</strong>g system <strong>in</strong> cotton–livestock<br />
farm<strong>in</strong>g system <strong>in</strong> <strong>Metema</strong><br />
Graz<strong>in</strong>g types Woody species Category % composition<br />
Communal T. laxiflora LD 0.9<br />
G. ternifolia LD 24.8<br />
A. polyacantha DS 1.5<br />
A. tortilis DS 12.1<br />
A. seyal DS 8.5<br />
D. c<strong>in</strong>erea LD 5.5<br />
A. liocarpus HD 15.2<br />
P. lucens HD 7.0<br />
F. sycomorus DS 2.4<br />
C. coll<strong>in</strong>um LD 1.2<br />
S. kunthianum DS 0.6<br />
X. americana LD 0.9<br />
Blanites aegyptyca DS 5.5<br />
Z. sp<strong>in</strong>a-christi HD 1.8<br />
P. ton<strong>in</strong>gii LD 5.2<br />
B. paperiferra UD 0.6<br />
A. senegal DS 3.9<br />
Road side G. ternifolia LD 21.0<br />
A. polyacantha DS 1.1<br />
A. tortilis DS 14.8<br />
A. seyal DS 2.3<br />
D. c<strong>in</strong>erea LD 15.3<br />
A. liocarpus HD 2.8<br />
P. lucens HD 5.7<br />
F. sycomorus DS 14.8<br />
C. coll<strong>in</strong>um LD 1.1<br />
S. kunthianum DS 1.7<br />
X. americana LD 9.1<br />
B. aegyptyca DS 7.5<br />
Z. sp<strong>in</strong>a-christi HD 1.1<br />
P. ton<strong>in</strong>gii LD<br />
Enclosure T. laxiflora LD 31.0<br />
A. liocarpus HD 3.4<br />
A. polyacantha DS 10.3<br />
A. seyal DS 20.7<br />
P. lucens HD 6.9<br />
B. aegyptyca DS 13.8<br />
Z. sp<strong>in</strong>a-christi HD 5.7<br />
B. paperiferra UD 3.4<br />
A. senegal DS 2.8<br />
D = desirable, HD = highly desirable; UD = undesirable; LD = less desirable.<br />
44
Table 25. Herbaceous species composition (% DM biomass) <strong>and</strong> their desirability by graz<strong>in</strong>g type<br />
<strong>in</strong> sesame–livestock farm<strong>in</strong>g system <strong>in</strong> <strong>Metema</strong><br />
Graz<strong>in</strong>g types Herbaceous species Category % composition Species types<br />
Communal U. fatamensis LD 2.6 Grasses<br />
P. sphacelatum DS 22.0<br />
U. bracyra LD 3.2<br />
T. tri<strong>and</strong>ra HD 2.9<br />
C. ciliaris DS 16.5<br />
E. floccifolia LD 18.3<br />
Ahiya abish UD Legumes<br />
A. quart<strong>in</strong>ianus LD<br />
I. spicata DS<br />
C. barbata UD Sedges<br />
E. <strong>in</strong>dica UD<br />
S. sphaerostima UD<br />
C. subul UD<br />
H. schulli UD<br />
Road side P. sphacelatum DS 8.5 Grasses<br />
S. pumila DS 17.4<br />
C. dactylon HD 3.6<br />
R. fistulosa LD 9.2<br />
E. floscifolia LD 23.1<br />
Ahiya abish UD Legumes<br />
C. mimosoides (L) UD<br />
E. <strong>in</strong>dica UD Sedges<br />
H. schulli UD<br />
S. sphaerostima UD<br />
B. setigera UD<br />
Z. elegans Jaqu<strong>in</strong>. UD<br />
C. subula UD<br />
Enclosure P. sphacelatum DS 6.4<br />
T. tri<strong>and</strong>ra HD 2.6<br />
S. pumila DS 5.2<br />
B. lata DS 8.3<br />
P. coloratum HD 20.5<br />
H. rufa HD 25.1<br />
S. pyramidialis DS 5.1<br />
E. flocifolia LD 5.6<br />
I. spicata DS Legumes<br />
A. quart<strong>in</strong>ianus LD<br />
H. articulatus HD<br />
V. membranacea DS<br />
Corchorus trilocularis L DS Sedges<br />
B. setigera UD<br />
C. barbata UD<br />
D = Desirable, HD = highly desirable; UD = undesirable; LD = Less desirable.<br />
45
A total of 25 herbaceous species are recorded <strong>in</strong> this farm<strong>in</strong>g system, <strong>and</strong> the<br />
majority (56%) are grass species, followed by sedges (24%) <strong>and</strong> legumes (20%). In<br />
the communal graz<strong>in</strong>g areas, 13 herbaceous species are identified, out of which 6<br />
(46.2%) are grass species, <strong>and</strong> 3 (23.1%) <strong>and</strong> 4 (30.8%) are legumes <strong>and</strong> sedges/others<br />
species, respectively. From the grass species recorded, 16.7, 33.3 <strong>and</strong> 50.0% are highly<br />
desirable, desirable, <strong>and</strong> less desirable, respectively. In road side graz<strong>in</strong>g area, out of<br />
the recorded 5 species of grasses, 20, 40 <strong>and</strong> 40% are highly desirable, desirable, <strong>and</strong><br />
less desirable, respectively. <strong>in</strong> enclosure graz<strong>in</strong>g area, 8 species of grasses, 4 species of<br />
legumes <strong>and</strong> 2 species of sedges are recorded. From the grass species identified, 37.5%<br />
are highly desirable, 50% desirable <strong>and</strong> 12.5% less desirable. In road side graz<strong>in</strong>g<br />
areas, the less desirable species of Eleun<strong>in</strong>e flocifolia is dom<strong>in</strong>ant (23.1%), followed by<br />
the desirable species of S. pumila (17.4%) <strong>and</strong> P. spheslatem (9.2%). Highly desirable<br />
species accounted for 14.28, 42.86, <strong>and</strong> 42.86% for the desirable <strong>and</strong> less desirable R.<br />
fistulosa species of grasses. In enclosure areas, the highly desirable grass species of H.<br />
rufa (25.1%) <strong>and</strong> P. coloratum (20.5%) are the dom<strong>in</strong>ant specie. There is a relatively high<br />
percentage of highly desirable (decreasers) grass species <strong>in</strong> the enclosure followed by<br />
communal <strong>and</strong> the road side graz<strong>in</strong>g areas. This might suggest that the highly desirable<br />
species are replaced by less desirable <strong>and</strong> unpalatable species as the graz<strong>in</strong>g pressure<br />
<strong>in</strong>creased.<br />
Woody vegetation <strong>in</strong> sesame based farm<strong>in</strong>g system<br />
A total of 18 woody species are identified <strong>in</strong> the sesame–livestock farm<strong>in</strong>g system<br />
(Table 26). These are composed of highly desirable (16.7%), desirable (38.9%), <strong>and</strong> less<br />
desirable (44.4%) species. In the communal graz<strong>in</strong>g areas, A. tortolis, A. leiocarpus, B.<br />
egyptica, P. lucens, T. laxiflora, X. Americana, <strong>and</strong> Z. sp<strong>in</strong>a-christi are the common species,<br />
while A. polyacantha, A. seyal, A. senegale <strong>and</strong> B. papirefera are the dom<strong>in</strong>ant species.<br />
In the road side graz<strong>in</strong>g areas, the frequency of A. polyacantha, A. tortolis, A. seyal <strong>and</strong><br />
D. c<strong>in</strong>erea was dom<strong>in</strong>ant, <strong>and</strong> A. senegal, A. leiocarpus, B. papyrifera, Z. sp<strong>in</strong>a-christi are<br />
common species. In the enclosure areas, highly desirable species like, A. leiocarpus, P.<br />
lucens, Z. sp<strong>in</strong>a-christi <strong>and</strong> the desirable species of A. seyal are dom<strong>in</strong>ant. A. Balanites<br />
egyptica, B. papirefera, A. senegal, A. polyacantha, <strong>and</strong> T. laxiflora are common species.<br />
The proportion of desirable tree species <strong>in</strong> the communal <strong>and</strong> road side is lower than <strong>in</strong><br />
the enclosure areas, probably due to the <strong>in</strong>fluence of people <strong>and</strong> animals. For <strong>in</strong>stance,<br />
group discussions revealed (confirmed dur<strong>in</strong>g the field work) that about 10 years ago,<br />
almost all of the district was covered by bamboo tree species, <strong>and</strong> the rema<strong>in</strong>s of bamboo<br />
trees were observed on steep slope areas <strong>and</strong> undisturbed remote kebeles of Shimele<br />
Gara, Kemechela, Zebach Bahir <strong>and</strong> Lemlem Terara. A. polyacantha was found <strong>in</strong> very<br />
46
low density a decade ago, but currently it is the dom<strong>in</strong>ant species. This result agrees with<br />
the suggestion of Alemayehu (2006).<br />
Table 26. Woody species <strong>in</strong> the sesame based farm<strong>in</strong>g system by graz<strong>in</strong>g type <strong>in</strong> sesame–livestock<br />
farm<strong>in</strong>g system (SLFS)<br />
Woody species Category<br />
SLFS<br />
CG RS EN<br />
A. polyacantha DS C D<br />
T. laxiflora LD P C<br />
A. tortilis DS C C C<br />
A. seyal DS D C C<br />
D. c<strong>in</strong>erea DS C D P<br />
A. leiocarpus DS C P D<br />
P. lucens HD C P D<br />
F. sycomorus DS P P<br />
C. coll<strong>in</strong>um LD C P C<br />
X. Americana LD P – –<br />
B. aegyptiaca DS C C C<br />
G. villosa LD P – C<br />
Z. sp<strong>in</strong>a-christi HD C C D<br />
P. ton<strong>in</strong>gii DS P P<br />
F. virosa LD C<br />
B. papyrifera UD C C D<br />
A. senegal DS C P C<br />
C. mole LD C C<br />
CG: communal graz<strong>in</strong>g; RS: road side; EN: enclosure; P: Present (10% <strong>and</strong> 20% density).<br />
4.9 Range <strong>condition</strong> assessment<br />
4.9.1 Effect of farm<strong>in</strong>g systems on rangel<strong>and</strong> <strong>condition</strong><br />
Communal graz<strong>in</strong>g areas<br />
In the communal graz<strong>in</strong>g areas, basal cover, litter cover <strong>and</strong> grass species composition<br />
were significantly (P
pressure <strong>and</strong> natural hazards. Because vegetation <strong>in</strong>tegrates all environmental factors<br />
act<strong>in</strong>g on a site, knowledge on its type may be used to make <strong>in</strong>ference about prevail<strong>in</strong>g<br />
environmental patterns (Herlocker 1999). Major causes of changes <strong>in</strong> rangel<strong>and</strong>s are<br />
excessive graz<strong>in</strong>g by domestic <strong>and</strong>/or wildlife animals, cultivat<strong>in</strong>g for cropp<strong>in</strong>g <strong>and</strong><br />
harvest<strong>in</strong>g <strong>resources</strong> like firewood, foods <strong>and</strong> build<strong>in</strong>g materials (Teshome 2006; Lishan<br />
2007).<br />
Table 27. Range <strong>condition</strong> score (Mean ± SE) of communal graz<strong>in</strong>g areas by farm<strong>in</strong>g system <strong>in</strong><br />
<strong>Metema</strong><br />
Parameter CLFS SLFS<br />
Grass species composition score 4.64 ± 0.31b 6.62 ± 0.31a<br />
Basal cover 4.80 ± 0.25a 5.20 ± 0.25a<br />
Litter cover 4.62 ± 0.37a 5.15 ± 0.37a<br />
Soil erosion 3.11 ± 0.30a 2.77 ± 0.30a<br />
Soil compaction 2.79 ± 0.28a 3.33 ± 0.28a<br />
Age distribution of grasses 2.36 ± 0.27a 3.25 ± 0.27a<br />
Seedl<strong>in</strong>g distribution 2.91 ± 0.34a 3.22 ± 0.34a<br />
Woody density score 2.25 ± 0.27a 1.50 ± 0.27a<br />
Canopy cover score 8.92 ± 0.77a 6.97 ± 0.77a<br />
Hedg<strong>in</strong>g 1.90 ± 0.25a 2.15 ± 0.25a<br />
Total range <strong>condition</strong> score 38.32 ± 1.21a 40.22 ± 1.21a<br />
Range <strong>condition</strong> Fair Fair<br />
Woody density 3354.17 ± 292.28a 4137.52 ± 292.28a<br />
Canopy cover 146.55 ± 15.98a 179.1 ± 15.98a<br />
CLFS: cotton–livestock farm<strong>in</strong>g system; SLFS: sesame–livestock farm<strong>in</strong>g system.<br />
Means with different superscripts <strong>in</strong> a row differ significantly (P
2004). Based on the results of this study, the communal graz<strong>in</strong>g areas are affected by<br />
bush encroachment.<br />
Woody vegetation reduces grass cover through <strong>in</strong>creas<strong>in</strong>g the competition for available<br />
water <strong>and</strong> nutrients <strong>and</strong> reduces the light reach<strong>in</strong>g the grass layer. In addition to<br />
compet<strong>in</strong>g with grasses, these noxious woody plants are commonly thorny <strong>and</strong> thicket<br />
form<strong>in</strong>g <strong>and</strong> the graz<strong>in</strong>g capacity of the rangel<strong>and</strong> may be extremely reduced (Alemayehu<br />
2004). Factors regulat<strong>in</strong>g the balance between gram<strong>in</strong>oid <strong>and</strong> woody plant life-forms<br />
<strong>in</strong>clude climate, soils, disturbance (e.g. graz<strong>in</strong>g, fire), <strong>and</strong> their <strong>in</strong>teractions. Changes<br />
<strong>in</strong> one or more of these factors may enable woody plants to <strong>in</strong>crease <strong>in</strong> abundance.<br />
Characteristics common to many woody species that <strong>in</strong>crease <strong>in</strong> grazed environments<br />
<strong>in</strong>clude high seed production, seeds that persist <strong>in</strong> soil for many years, ability to disperse<br />
over long distances, ability to sprout follow<strong>in</strong>g top removal, tolerance to low levels of<br />
water <strong>and</strong> nutrients <strong>and</strong> low palatability (Archer 2003). These authors also suggested<br />
that as climate changes occur over time, undesirable woody species vigorously spread<br />
out on communal graz<strong>in</strong>g l<strong>and</strong>s. In semi-arid ecosystems, drought, absence of fire<br />
<strong>and</strong> overgraz<strong>in</strong>g are some of the major factors that cause conversion of grassl<strong>and</strong>s to<br />
woodl<strong>and</strong>s (Coppock 1994; Archer 2003). The <strong>in</strong>crease <strong>in</strong> woody plant encroachment,<br />
loss of palatable grass cover <strong>and</strong> <strong>in</strong>crease of unpalatable forbs are the ma<strong>in</strong> threats to the<br />
communal graz<strong>in</strong>g areas <strong>in</strong> <strong>Metema</strong>. The result of this study revealed that the <strong>condition</strong> of<br />
the communal graz<strong>in</strong>g l<strong>and</strong>s is <strong>in</strong> fair <strong>condition</strong>, <strong>and</strong> this implies that there is need to take<br />
measures to improve the rangel<strong>and</strong>s. Herd diversification through <strong>in</strong>creas<strong>in</strong>g the number<br />
of browsers such as camels <strong>and</strong> goats will contribute towards efficient resource utilization<br />
<strong>and</strong> decrease encroachment of woody plants.<br />
Road side graz<strong>in</strong>g areas<br />
The mean range <strong>condition</strong> scores for herbaceous species variables considered are<br />
presented <strong>in</strong> (Table 28). Grass species composition, basal cover <strong>and</strong> litter cover were<br />
significantly (P
Table 28. Range <strong>condition</strong> score (Mean ± SE) for road side graz<strong>in</strong>g areas found <strong>in</strong> different farm<strong>in</strong>g<br />
systems of the study district<br />
Parameters CLFS SLFS<br />
Grass species composition 4.43 ± 0.22b 5.62 ± 0.22a<br />
Basal cover 4 ± 0.52a 4.25 ± 0.52a<br />
Litter cover 3.51 ± 0.39a 4.87 ± 0.39a<br />
Soil erosion 2.40 ± 0.26a 2.0 ± 0.26a<br />
Soil compaction 2.32 ± 0.27a 2.49 ± 0.27a<br />
Age distribution of grasses 2.25 ± 0.32a 2.71 ± 0.32a<br />
Seedl<strong>in</strong>g distribution 1.96 ± 0.38a 2.18 ± 0.38a<br />
Woody density score 2.75 ± 0.27a 2.5 ± 0.27a<br />
Canopy cover score 3.02 ± 0.79a 1.9 ± 0.79a<br />
Hedg<strong>in</strong>g 1.25 ± 0.29a 2.10 ± 0.29a<br />
Total range <strong>condition</strong> score 27.92 ± 1.42a 30.65 ± 1.42a<br />
Range <strong>condition</strong> Poor Poor<br />
Woody density 2678.33 ± 196.34a 2795.85 ± 196.34a<br />
Canopy cover 68.38 ± 13.04a 75.40 ± 13.04a<br />
CLFS: cotton–livestock farm<strong>in</strong>g system; SLFS: sesame–livestock farm<strong>in</strong>g system.<br />
Means with different superscripts <strong>in</strong> a row differ significantly (P
at the l<strong>and</strong>scape scale; short temporal scales (the <strong>in</strong>itial response of a community to<br />
protection or release from graz<strong>in</strong>g may not represent the long-term response) <strong>and</strong> the<br />
pool of species that are present or able to disperse to the protected area. There was no<br />
significant (P < 0.05) difference <strong>in</strong> the soil erosion, compaction, age distribution, seedl<strong>in</strong>g<br />
count, <strong>and</strong> hedge effects between the two farm<strong>in</strong>g systems (Table 29). Generally, these<br />
parameters suggested that the <strong>condition</strong> of the enclosure sites is <strong>in</strong> a good <strong>condition</strong>. The<br />
number of livestock that graze <strong>in</strong> the enclosure areas limits the graz<strong>in</strong>g pressure <strong>and</strong> had<br />
a positive effect on rangel<strong>and</strong> <strong>condition</strong>. This is considered as a means to protect <strong>and</strong><br />
conserve local resource under threat from <strong>in</strong>creas<strong>in</strong>g human <strong>and</strong> livestock population<br />
pressure <strong>and</strong> <strong>in</strong>terventions.<br />
Table 29. Range <strong>condition</strong> score (LSM ± SE) <strong>in</strong> enclosure graz<strong>in</strong>g areas by farm<strong>in</strong>g system <strong>in</strong><br />
<strong>Metema</strong><br />
Parameter CBFS SBFS<br />
Grass species composition score 7.80 ± 0.61a 8.11 ± 0.50a<br />
Basal cover 6.91 ± 0.46a 7.03 ± 0.37a<br />
Litter cover 6.0 ± 0.33a 7.05 ± 0.27a<br />
Soil erosion 3.88 ± 0.16b 4.89 ± 0.20a<br />
Soil compaction 4.93 ± 0.38a 3.64 ± 0.31a<br />
Age distribution of grasses 3.70 ± 0.44a 3.67 ± 0.35a<br />
Seedl<strong>in</strong>g distribution 4.0 ± 0.21a 4.64 ± 0.17a<br />
Woody density score 3.5 ± 0.28a 3.0 ± 0.23a<br />
Canopy cover score 2.75 ± 0.61a 3.46 ± 0.50a<br />
Hedg<strong>in</strong>g 2.20 ± 0.41a 2.43 ± 0.33a<br />
Total range <strong>condition</strong> score 46.65 ± 0.78a 46.93 ± 0.63a<br />
Range <strong>condition</strong> Good Good<br />
Woody density 2316.7 ± 244.68a 2340.0 ± 199.78a<br />
Canopy cover 64.05 ± 7.27a 71.93 ± 3.44a<br />
CLFS: cotton–livestock farm<strong>in</strong>g system; SLFS: sesame–livestock farm<strong>in</strong>g system.<br />
Means with different superscripts <strong>in</strong> a row differ significantly (P
establish<strong>in</strong>g enclosures is an alternative method of improv<strong>in</strong>g the rangel<strong>and</strong>s. A similar<br />
observation was made by Ayana (1999); Amsalu (2000); Admasu (2006); Amaha (2006);<br />
Teshome (2006); Lishan (2007) who reported that good range <strong>condition</strong> class <strong>in</strong> enclosure<br />
areas <strong>in</strong> Bale, Somali, Borana, Rift valley, Somali <strong>and</strong> Hamer <strong>and</strong> Bena-Tesmay areas of<br />
Ethiopia, respectively.<br />
4.10 Biomass production<br />
4.10.1 Dry matter biomass production <strong>in</strong> different graz<strong>in</strong>g types<br />
by farm<strong>in</strong>g system<br />
Communal graz<strong>in</strong>g areas<br />
Data on dry matter biomass production of highly desirable, <strong>in</strong>termediate <strong>and</strong> less<br />
desirable grasses <strong>in</strong> the communal graz<strong>in</strong>g areas are presented by farm<strong>in</strong>g system <strong>in</strong> Table<br />
30.<br />
Table 30. Dry matter biomass (kg/ha) of the communal graz<strong>in</strong>g areas by farm<strong>in</strong>g system <strong>in</strong> <strong>Metema</strong><br />
district<br />
Parameters<br />
CLFS<br />
Mean ± SE<br />
SLFS<br />
Mean ± SE<br />
Total grasses 2396.6 ± 370.17a 3282.2 ± 598.77b<br />
Highly desirable 143.3 ± 22.14a 145.1 ± 27.46a<br />
Intermediate 1562.8 ± 242.38a 1929.0 ± 352.6b<br />
Less desirable 690.2 ± 106.61a 1206.5 ± 221.29b<br />
Legumes 699.2 ± 56.69a 923.3 ± 213.74b<br />
Others 488.7 ± 128.09a 802.1 ± 163.14b<br />
Total biomass 3584.4 ± 403.34a 5007.6 ± 664.25b<br />
CLFS = cotton–livestock farm<strong>in</strong>g system, SLFS = sesame–livestock farm<strong>in</strong>g system.<br />
Means with different superscripts <strong>in</strong> a row differ significantly (P
Soil compaction also directly restricts root growth because as soils become compacted<br />
only fewer large pores are present <strong>and</strong> so there is little space for roots to enter (Amaha<br />
2006). In semi-arid rangel<strong>and</strong>s, under similar ra<strong>in</strong>fall <strong>condition</strong>s, soil type will have an<br />
effect on plant biomass production. Plant biomass <strong>and</strong> st<strong>and</strong><strong>in</strong>g crop are affected by<br />
species composition <strong>and</strong> density (Alemayehu 2005).<br />
Road side graz<strong>in</strong>g areas<br />
In the road side graz<strong>in</strong>g areas, dry matter biomass production of total grass, legumes,<br />
others <strong>and</strong> total biomass production are significantly (P
Enclosure<br />
In the enclosure areas, total dry matter biomass, dry matter biomass of grasses <strong>and</strong><br />
legumes are significantly higher (P < 0.05) <strong>in</strong> the sesame–livestock than <strong>in</strong> the cotton–<br />
livestock farm<strong>in</strong>g system (Table 32). This may be associated with the presence of more<br />
dom<strong>in</strong>ant herbaceous species <strong>in</strong> the sesame–livestock system that may have contributed<br />
to the higher biomass production. Some literature suggested that the most dom<strong>in</strong>ant<br />
species contributed the highest amount of biomass (Kamau 2004). The total dry matter<br />
biomass value obta<strong>in</strong>ed for the enclosure areas <strong>in</strong> this study is much higher than those<br />
reported by Amsalu (2000), Amaha (2006), <strong>and</strong> Lishan, (2007) for the arid <strong>and</strong> semi-arid<br />
rangel<strong>and</strong>s of Middle Awash Somali Region of Ethiopia. This implies that the productivity<br />
of enclosure areas <strong>in</strong> <strong>Metema</strong> is better than other rangel<strong>and</strong>s <strong>in</strong> Ethiopia <strong>and</strong> can support<br />
livestock population provided that good management practice is applied.<br />
Table 32. Dry biomass (kg/ha) of enclosure graz<strong>in</strong>g areas by farm<strong>in</strong>g system <strong>in</strong> <strong>Metema</strong><br />
Parameters<br />
CLFS<br />
SLFS<br />
Mean ± SE<br />
Mean ± SE<br />
Grasses 4814.9 ± 453.36a 8438.6 ± 598.77b<br />
Highly desirable 3343.0 ± 259a 5161.0 ± 367.21b<br />
Desirable 1165.2 ± 15.55a 2676.7 ± 198.9b<br />
Less desirable 305.7 ± 23.51a 599.1 ± 42.51b<br />
Legumes 697.1 ± 164.73a 1071.3 ± 116.27b<br />
Others 375.6 ± 116.27a 1186.0 ± 203.98b<br />
Total biomass 5887.6 ± 493.9a 10695.8 ± 664.2b<br />
CLFS = cotton–livestock farm<strong>in</strong>g system, SLFS = sesame–livestock farm<strong>in</strong>g system.<br />
Means with different superscripts <strong>in</strong> a row differ significantly (P
Dry matter biomass<br />
18000<br />
16000<br />
14000<br />
12000<br />
10000<br />
8000<br />
6000<br />
y = 282.13x - 4066.4<br />
R 2 = 0.4509<br />
4000<br />
2000<br />
0<br />
0 10 20 30 40 50 60<br />
Range <strong>condition</strong> score<br />
Figure 2. Regression graph of dry matter biomass <strong>and</strong> range <strong>condition</strong>.<br />
There were positive <strong>and</strong> significant correlations between basal cover <strong>and</strong> grass species<br />
composition (P < 0.01); between grass species composition <strong>and</strong> age distribution (P <<br />
0.01) whereas strong negative correlations were noted among basal cover, soil erosion,<br />
soil compaction, woody density <strong>and</strong> canopy cover. Total dry matter biomass was also<br />
negatively correlated with soil erosion, soil compaction, woody density <strong>and</strong> canopy cover<br />
<strong>in</strong> the communal graz<strong>in</strong>g areas found <strong>in</strong> the two farm<strong>in</strong>g systems. Similarly, the total dry<br />
matter biomass was positively correlated with age distribution, basal cover <strong>and</strong> grass<br />
species composition <strong>in</strong> the road side graz<strong>in</strong>g areas (Appendix Tables 5–10).<br />
In the enclosure graz<strong>in</strong>g areas, correlation analysis showed that woody density <strong>and</strong><br />
canopy cover were negatively correlated (P ≤ 0.05) with basal cover, total dry matter<br />
biomass <strong>and</strong> positively correlated (P ≤ 0.05) with soil erosion <strong>and</strong> soil compaction. On<br />
the other h<strong>and</strong>, density of woody vegetation <strong>and</strong> canopy cover were positively correlated<br />
(P ≤ 0.05) with each other (Appendix Tables 5–10). Similarly, total dry matter biomass<br />
production was negatively correlated (P ≤ 0.05) with soil erosion, soil compaction,<br />
woody vegetation density <strong>and</strong> canopy cover. Besides, the total dry matter biomass was<br />
positively correlated (P ≤ 0.05) with basal cover <strong>and</strong> grass species composition.<br />
55
5 Conclusion <strong>and</strong> recommendations<br />
5.1 Conclusion<br />
This study was conducted <strong>in</strong> <strong>Metema</strong> district, <strong>North</strong> Gondar Zone, Amhara National<br />
Regional State of northwestern Ethiopia. The aims of the study were to characterize the<br />
exist<strong>in</strong>g rangel<strong>and</strong>, to determ<strong>in</strong>e the available <strong>feed</strong> <strong>resources</strong> <strong>and</strong> utilization practices,<br />
to assess the natural graz<strong>in</strong>g l<strong>and</strong> based on herbaceous <strong>and</strong> woody biomass <strong>and</strong> soil<br />
<strong>condition</strong> <strong>and</strong> to evaluate the chemical composition of major livestock <strong>feed</strong> <strong>resources</strong><br />
of the area. The <strong>feed</strong> <strong>resources</strong> utilization practice of the district was assessed through<br />
<strong>in</strong>terview<strong>in</strong>g 140 households us<strong>in</strong>g a semi-structured questionnaire, group discussions<br />
<strong>and</strong> personal observations. For the study of rangel<strong>and</strong> <strong>condition</strong>, the district was classified<br />
<strong>in</strong>to cotton–livestock <strong>and</strong> sesame–livestock farm<strong>in</strong>g systems <strong>and</strong> three graz<strong>in</strong>g types<br />
(communal graz<strong>in</strong>g, enclosure <strong>and</strong> road side graz<strong>in</strong>g areas). Data on grass species<br />
composition, basal <strong>and</strong> litter covers, age distribution, soil erosion, soil compaction <strong>and</strong><br />
woody species density, tree height class, canopy cover <strong>and</strong> hedg<strong>in</strong>g effect were collected.<br />
In <strong>Metema</strong>, the mean family size is 5.31 ± 0.20 persons <strong>and</strong> the level of education is<br />
low. Smallholder crop–livestock mixed farm<strong>in</strong>g is dom<strong>in</strong>ant <strong>and</strong> is the ma<strong>in</strong> occupation<br />
of the people. The mean l<strong>and</strong> hold<strong>in</strong>g is 6.78 ± 1.33 ha per household, <strong>and</strong> the l<strong>and</strong> use<br />
pattern <strong>in</strong>cludes annual cropp<strong>in</strong>g, perennial cropp<strong>in</strong>g, communal graz<strong>in</strong>g, fallow<strong>in</strong>g <strong>and</strong><br />
private graz<strong>in</strong>g. Cattle are the dom<strong>in</strong>ant livestock followed by small rum<strong>in</strong>ant (goats <strong>and</strong><br />
sheep), donkeys <strong>and</strong> camel. The mean total livestock hold<strong>in</strong>g per household is 27.58 ±<br />
13.72 TLU, <strong>and</strong> is composed of 12.52 ± 6.23 TLU cattle, 0.80 ± 0.40 TLU goats, 0.13 ±<br />
0.07 TLU sheep, 0.65 ± 0.32 TLU donkeys <strong>and</strong> 0.07 ± 0.04 TLU camels. Female stocks<br />
of cattle <strong>and</strong> goats are dom<strong>in</strong>ant <strong>in</strong> both farm<strong>in</strong>g systems because male stocks are sold<br />
at earlier ages <strong>and</strong> females are reta<strong>in</strong>ed as replacement breed<strong>in</strong>g stock. In addition,<br />
ownership of large number of cows is considered as prestige <strong>and</strong> wealth rank<strong>in</strong>g by the<br />
community.<br />
The major livestock <strong>feed</strong> <strong>resources</strong> <strong>in</strong> <strong>Metema</strong> are natural pasture, crop residues, crop<br />
aftermath <strong>and</strong> fallow l<strong>and</strong>. Natural pasture is the major sources of livestock <strong>feed</strong>,<br />
<strong>and</strong> contributes to 59.3, 72.9, 72.1 <strong>and</strong> 42.1% of the diets of cattle, goat, sheep <strong>and</strong><br />
donkeys, respectively. Although there is surplus <strong>feed</strong> dur<strong>in</strong>g the ra<strong>in</strong>y season, these<br />
pastures can hardly ma<strong>in</strong>ta<strong>in</strong> animals <strong>in</strong> the dry season due to limited availability <strong>and</strong><br />
very low nutritive value. Free graz<strong>in</strong>g, tether<strong>in</strong>g <strong>and</strong> cut-<strong>and</strong>-carry <strong>feed</strong><strong>in</strong>g systems are<br />
the commonly practised <strong>feed</strong><strong>in</strong>g systems <strong>in</strong> both farm<strong>in</strong>g systems. Animals are allowed<br />
to graze <strong>in</strong> communal graz<strong>in</strong>g l<strong>and</strong>, forest l<strong>and</strong> <strong>and</strong> fallow l<strong>and</strong>s (privately owned l<strong>and</strong>)<br />
dur<strong>in</strong>g the wet season <strong>and</strong> from October onwards. From the total area of the district,<br />
56
i.e. 312,300 ha, about 71% is natural pasture <strong>and</strong> forest l<strong>and</strong> <strong>in</strong>dicat<strong>in</strong>g the existence of<br />
extensive graz<strong>in</strong>g l<strong>and</strong> <strong>resources</strong>. The abundantly available <strong>feed</strong>s <strong>in</strong> the wet season are<br />
mostly wasted because of poor <strong>feed</strong> conservation practices. Farmers make hay late <strong>in</strong> the<br />
season between mid-October <strong>and</strong> end of November, when the herbaceous species are<br />
lignified <strong>and</strong> low <strong>in</strong> nutrient quality.<br />
Crop residues are the second major <strong>feed</strong> <strong>resources</strong>. Sorghum is the most important<br />
cereal crop grown <strong>in</strong> <strong>Metema</strong> next to sesame <strong>and</strong> cotton, <strong>and</strong> accounts for about 90%<br />
of the total crop residues produced <strong>in</strong> the district. Crop residues of maize, teff, f<strong>in</strong>ger<br />
millet <strong>and</strong> rice make up for the difference. As observed dur<strong>in</strong>g the field work, there is no<br />
proper collection, h<strong>and</strong>l<strong>in</strong>g, storage <strong>and</strong> utilization of crop residues. The total mean crop<br />
residues utilization as livestock <strong>feed</strong> is low, <strong>and</strong> most of it is either burned <strong>in</strong> the field or<br />
left as mulch. Generally, the <strong>feed</strong> balance estimate of the district on DM basis is sufficient<br />
to support the ma<strong>in</strong>tenance requirement of livestock per household, but the quality of the<br />
<strong>feed</strong>s is very poor.<br />
In the rangel<strong>and</strong>s, a total of 32 herbaceous <strong>and</strong> 20 woody species were recorded.<br />
Among the herbaceous species, 41.9% are different grasses <strong>and</strong> 58.1% are non-grass<br />
species. The non-grass species are comprised of five species of legumes, seven species<br />
of sedges <strong>and</strong> six species of forbs. Of the grass species, 23.1% are highly desirable,<br />
38.5% desirable <strong>and</strong> 30.8% are less desirable. P. spheslatum (J<strong>in</strong>gra) <strong>and</strong> C. ciliaris<br />
(Zemen) are the dom<strong>in</strong>ant <strong>and</strong> desirable grass species found <strong>in</strong> the communal graz<strong>in</strong>g<br />
areas of the sesame–livestock <strong>and</strong> cotton–livestock farm<strong>in</strong>g system, respectively. Of<br />
the identified woody species, 15, 35, <strong>and</strong> 50% are highly desirable, desirable <strong>and</strong> less<br />
desirable, respectively. The largest proportion of the woody vegetation is made up of<br />
different species of acacia (20%) <strong>and</strong> commbretum (10%), hence the rangel<strong>and</strong> can be<br />
categorized as an acacia dom<strong>in</strong>ated graz<strong>in</strong>g l<strong>and</strong>. P. lucens (Charia) is a very important<br />
fodder tree used as a ma<strong>in</strong> livestock <strong>feed</strong> dur<strong>in</strong>g the onset of the ma<strong>in</strong> ra<strong>in</strong>y season. The<br />
woody vegetation falls with<strong>in</strong> the height class of >1–3 m <strong>in</strong> about 41% of the communal<br />
graz<strong>in</strong>g areas, 39% of the road side graz<strong>in</strong>g l<strong>and</strong> <strong>and</strong> 33% of the enclosure areas,<br />
<strong>in</strong>dicat<strong>in</strong>g that most of the vegetation is at the brows<strong>in</strong>g height of the animals.<br />
In cotton–livestock farm<strong>in</strong>g system, a total of 24 herbaceous <strong>and</strong> 17 woody species are<br />
recorded. Among the herbaceous species, 50% are different grass species, 20.8% legumes<br />
<strong>and</strong> 29.2% sedge species. Among the woody species, 17.7, 41.2, <strong>and</strong> 35.3% are highly<br />
desirable, desirable <strong>and</strong> less desirable, respectively, while 5.9% are undesirable. In the<br />
sesame–livestock farm<strong>in</strong>g system, 25 herbaceous <strong>and</strong> 18 woody species were identified.<br />
Among the herbaceous species, 56% are grasses, 20% legumes <strong>and</strong> 24% sedges species.<br />
About 17% of the grass species are highly desirable, while 38.9 <strong>and</strong> 44.4% are desirable<br />
57
<strong>and</strong> less desirable, respectively. In the communal graz<strong>in</strong>g areas, basal cover, litter cover <strong>and</strong><br />
grass species composition are significantly (P
• Transhumance production system is <strong>in</strong>creas<strong>in</strong>gly lead<strong>in</strong>g to poor rangel<strong>and</strong><br />
management <strong>and</strong> social conflicts over <strong>feed</strong> <strong>resources</strong> between the highl<strong>and</strong>ers <strong>and</strong><br />
lowl<strong>and</strong>ers. Balance has to be established between the two systems.<br />
• Settlers <strong>and</strong> <strong>in</strong>vestors or any new comers to the region should be educated ahead of<br />
time about the ecological <strong>and</strong> economic importance of the natural <strong>resources</strong> base <strong>and</strong><br />
should be regulated <strong>in</strong> terms of utilization. There should be regular campaigns of tree<br />
plant<strong>in</strong>g.<br />
• Absence of adequate basel<strong>in</strong>e <strong>in</strong>formation about the rangel<strong>and</strong> <strong>resources</strong>,<br />
unsynchronized seasonal availability of <strong>feed</strong> <strong>resources</strong> <strong>and</strong> cropl<strong>and</strong> encroachment<br />
to the rangel<strong>and</strong> are some of the ma<strong>in</strong> constra<strong>in</strong>ts of the district. Studies on rangel<strong>and</strong><br />
management systems <strong>and</strong> improved livestock production should be <strong>in</strong>itiated.<br />
• The deteriorat<strong>in</strong>g <strong>condition</strong> of the rangel<strong>and</strong>s <strong>in</strong> <strong>Metema</strong> should be reversed through<br />
rangel<strong>and</strong> rehabilitation, proper management <strong>and</strong> clearly demarcated l<strong>and</strong> use system<br />
of the natural graz<strong>in</strong>g l<strong>and</strong>s.<br />
• Provision of <strong>in</strong>tegrated extension service is required on range management, <strong>feed</strong><br />
<strong>resources</strong> development <strong>and</strong> management <strong>and</strong> tra<strong>in</strong><strong>in</strong>g on <strong>feed</strong> collection, storage, <strong>and</strong><br />
proper <strong>feed</strong><strong>in</strong>g systems.<br />
• Balanc<strong>in</strong>g grazer <strong>and</strong> browser livestock species is essential <strong>in</strong> order to keep ecological<br />
balance as well as to <strong>in</strong>crease livestock productivity.<br />
• Introduction of dual purpose food–<strong>feed</strong> crops such as sorghum species should be<br />
considered.<br />
• The <strong>in</strong>fluence of different sub-habitats of woody plants (under canopy, between<br />
canopies) on herbaceous species composition <strong>and</strong> diversity, biomass production <strong>and</strong><br />
their <strong>in</strong>fluence on livestock productivity should be studied.<br />
59
References<br />
Abule, E., Snyman, H.A., Smit, G.N. 2007a. <strong>Rangel<strong>and</strong></strong> evaluation <strong>in</strong> the middle Awash valley of<br />
Ethiopia. I. Herbaceous vegetation cover. Journal of Environments 70:253–271.<br />
Abule, E., Snyman, H.A., Smit, G.N. 2007b. <strong>Rangel<strong>and</strong></strong> evaluation <strong>in</strong> the middle Awash valley of<br />
Ethiopia. II. Woody vegetation. Journal of Environments 70:272–292.<br />
Abule, E., Snyman, H.A., Smit, G.N. 2007c. <strong>Rangel<strong>and</strong></strong> evaluation <strong>in</strong> the middle Awash valley of<br />
Ethiopia. I. Herbaceous vegetation cover. III. Relationship among soil <strong>and</strong> vegetation variables.<br />
Journal of Environments 70:293–303.<br />
Admasu Terefe, 2006. Pastoralists perceptions on range–livestock management practices <strong>and</strong><br />
rangel<strong>and</strong> assessment <strong>in</strong> Hamer <strong>and</strong> Benna-Tsemay districts of South Omo Zone. MSc Thesis.<br />
School of Graduate Studies, Haramaya University, Ethiopia. 159p.<br />
Ahmed Hassen, 2006. Assessment <strong>and</strong> evaluation of utilization practices of natural pastures <strong>and</strong><br />
other forages <strong>in</strong> Basona Worana wereda of <strong>North</strong> Shoa Zone. MSc Thesis. School of Graduate<br />
Studies, Haramaya University, Ethiopia. 174p.<br />
Alemayehu, M. 1998. Natural pasture improvement study around smallholder dairy Areas. MoA,<br />
Small Dairy Development Project (SDDP), Addis Ababa, Ethiopia<br />
Alemayehu, M. 2004. <strong>Rangel<strong>and</strong></strong>s Biodiversity: Concepts, Approaches, <strong>and</strong> the Way Forward. Addis<br />
Ababa, Ethiopia.<br />
Alemayehu Mengistu, 2005. <strong>Rangel<strong>and</strong></strong>s: Biodiversity Conservation <strong>and</strong> Management <strong>and</strong> Inventory<br />
<strong>and</strong> Monitor<strong>in</strong>g. Addis Ababa University, Faculty of Science, Addis Ababa, Ethiopia. 103 pp<br />
Alemayehu Mengistu, 2006. Range Management for East Africa: Concepts <strong>and</strong> Practices, Sponsored<br />
by RPSUD <strong>and</strong> Pr<strong>in</strong>ted by A.A.U Pr<strong>in</strong>ted Press. Addis Ababa, Ethiopia<br />
Association of Official Analytical Chemists (AOAC), 1990. Official methods of analysis. 12th ed.<br />
Wash<strong>in</strong>gton, DC<br />
Amaha Kassahun, 2006. Characterization of rangel<strong>and</strong> <strong>resources</strong> <strong>and</strong> dynamics of the pastoral<br />
production system <strong>in</strong> the Somali region of Eastern Ethiopia. PhD Thesis. University of the Free<br />
State, Bloemfonte<strong>in</strong>, South Africa. 232p.<br />
Amsalu Sisay, 2000. Herbaceous species composition, dry matter <strong>and</strong> <strong>condition</strong> of the major<br />
graz<strong>in</strong>g areas <strong>in</strong> the middle rift valley, Ethiopia. MSc. Thesis, School of Graduate Studies,<br />
Alemaya University, Dire Dewa, Ethiopia<br />
Archer, S. 2003. Proliferation of woody plants <strong>in</strong> grassl<strong>and</strong>s <strong>and</strong> savannas. Retrieved on 15/3/2008<br />
from the <strong>in</strong>ternet: http://cnrit. Tamu. Edu/rlem/ faculy/ archer/ bibliography.htm/.<br />
(AOAC), 1980. Association of Official Analytical Chemists methods of analysis. 12th ed.<br />
Wash<strong>in</strong>gton, DC<br />
Ayana Angasa, 1999. Range <strong>condition</strong> traditional graz<strong>in</strong>g management system <strong>in</strong> Borena. MSc<br />
Thesis. School of Graduate Studies, Alemaya University, Dire Dawa, Ethiopia .55p<br />
Azene Bekele, A. Anne Birnie <strong>and</strong> B. Tengnas, 1993. Useful trees <strong>and</strong> shrubs for Ethiopia,<br />
Identification, Propagation <strong>and</strong> Management for agricultural <strong>and</strong> pastoral communities. English<br />
press, Nairobi, Kenya. 473p.<br />
Baars R. M. T., E.C Chileshe, <strong>and</strong> D .R. Kalokoni, 1997. Technical notes: Range <strong>condition</strong> <strong>in</strong> high<br />
cattle density areas <strong>in</strong> the Western prov<strong>in</strong>ce of Zambia. Tropical grassl<strong>and</strong>s, 31:569–573.<br />
Befekadu Degefe <strong>and</strong> Berhanu Nega. 2000. Annual report on the Ethiopian economy: Volume I,<br />
1999/2000. The Ethiopian Economic Association, Addis Ababa, Ethiopia. 429 pp.<br />
Belaynesh Debalkie, 2006. Floristic composition <strong>and</strong> diversity of the vegetation, soil seed bank<br />
flora <strong>and</strong> <strong>condition</strong> of the rangel<strong>and</strong>s of the Jijiga zone, Somali Regional State, Ethiopia. MSc<br />
Thesis. School of Graduate Studies, Alemaya University. 144p.<br />
60
Beruk Yemane <strong>and</strong> Tafesse Mesif<strong>in</strong>, 2000. Pastoralism <strong>and</strong> agropastoralism: Past <strong>and</strong> present. In:<br />
Proceed<strong>in</strong>g of 8 th annual conference of the Ethiopia Society of Animal Production (ESAP). Addis<br />
Ababa, Ethiopia, 24–26 August 2000.<br />
BoA (Bureau of Agriculture).1999. General basic agricultural data: Woreda level. BOA, Bahir Dar,<br />
Ethiopia. 81 pp.<br />
CACC (Central Agricultural Census Commission). 2002. Ethiopian agricultural sample enumeration<br />
report, held 2001/02 (1994 EC). Addis Ababa, Ethiopia.<br />
Chrisholm. A. <strong>and</strong> R. Dumsday, 1987, L<strong>and</strong> Degradation. Cambridge University Press, Cambridge.<br />
Coppock, D.L., 1994. The Borena Plateau of Southern Ethiopia: Synthesis of Pastoral Research,<br />
Development <strong>and</strong> Changes, 1980–1990. International Livestock Center for Africa (ILCA), Addis<br />
Ababa, Ethiopia .72p.<br />
Coss<strong>in</strong>s, N. <strong>and</strong> M. Upton, 1985. The Productivity <strong>and</strong> Potential of the Southern <strong>Rangel<strong>and</strong></strong>s of<br />
Ethiopia. JESS (Jo<strong>in</strong>t Ethiopian Pastoralists system study).Draft summary report, International<br />
Livestock Centre for Africa, Addis Ababa, Ethiopia.<br />
Coss<strong>in</strong>s, N.J. M. Upton, 1988. Options for Improvement of the Borana Pastoral System’ Agricultural<br />
system 27 pp 251–278.<br />
CSA. 2003. Ethiopian Agricultural Sample Enumeration . 2001/02 results for Amhara region,<br />
statistical report on livestock <strong>and</strong> farm implements, part 4 , Addis Ababa, Ethiopia.<br />
CSA 2005. Statistical Abstracts, Addis Ababa, Ethiopia.<br />
CSA 2009. Statistical Abstracts, Addis Ababa, Ethiopia.<br />
de Leeuw, P.N. <strong>and</strong> B. Rey, 1995. An analysis of the current trends <strong>in</strong> the distribution of rum<strong>in</strong>ant<br />
livestock <strong>in</strong> sub-Saharan Africa. World Animal Review 83: 43–59.<br />
de Leeuw P.N. <strong>and</strong> Toothill J.C. 1993. The concept of rangel<strong>and</strong> carry<strong>in</strong>g capacity <strong>in</strong> sub-Saharan<br />
Africa—Myth or reality. In: Behnke R.H. Jr., Schoones I. <strong>and</strong> Kerven C. (eds), Range ecology at<br />
disequilibrium: New models of natural variability <strong>and</strong> pastoral adaptation <strong>in</strong> African savannas.<br />
ODI (Overseas Development Institute), London, UK. pp. 77–88.<br />
Elias Mulugeta, Berhanu Gebremendih<strong>in</strong>, Hoekstra, D <strong>and</strong> Jabbar M. 2007. Analysis of Ethio–Sudan<br />
cross-border cattle trade: The case of Amhara Regional State. IPMS (Improv<strong>in</strong>g Productivity <strong>and</strong><br />
Market Success) of Ethiopian Farmers Project Work<strong>in</strong>g Paper 4. ILRI (International Livestock<br />
Research Institute), Nairobi, Kenya. 41 pp.<br />
Fleischner, T.L.1994. Ecological costs of livestock graz<strong>in</strong>g <strong>in</strong> Western <strong>North</strong> America. Conservation<br />
Biology 8(3):629–44<br />
Friedel MH, Laycock WA <strong>and</strong> GN. Bast<strong>in</strong>, 2000. Assess<strong>in</strong>g <strong>Rangel<strong>and</strong></strong> Condition <strong>and</strong> Trend. In:<br />
Mannetje, L.’t., <strong>and</strong> Jones RM (Eds.). Field <strong>and</strong> Laboratory Methods for Grassl<strong>and</strong> <strong>and</strong> Animal<br />
Production Research, pp 305–360. CABI International, Wall<strong>in</strong>gford, UK.<br />
Gemedo Dalle, 2004. Vegetation Ecology, <strong>Rangel<strong>and</strong></strong> Condition <strong>and</strong> Forage Resources Evaluation<br />
<strong>in</strong> the Borana Lowl<strong>and</strong>s, Southern Oromia, Ethiopia. PhD Thesis. University of the Gott<strong>in</strong>gen,<br />
Germany. 253 pp.<br />
Herlocker, D.,1999. <strong>Rangel<strong>and</strong></strong> Ecology <strong>and</strong> Resource Development <strong>in</strong> East Africa .GTZ. Nairobi,<br />
Kenya. 393 pp.<br />
Holechek, J. L., R.D. Pieper, <strong>and</strong> C.H., Herbel, 1994. Range Management Pr<strong>in</strong>ciples <strong>and</strong> Practices.<br />
2 nd Edition. Prenticehall. Englewood Cliffs, NJ.<br />
ILCA (International Livestock Center for Africa), 1990. Livestock Systems Research Manual. Vol. 1.<br />
ILCA Work<strong>in</strong>g Paper 1. ILCA, Addis Ababa, Ethiopia.<br />
IPMS. 2005. <strong>Metema</strong> pilot learn<strong>in</strong>g site diagnosis <strong>and</strong> program design. ILRI, Addis Ababa, Ethiopia.<br />
61
Kidane, G. 1993. Effects of Cutt<strong>in</strong>g date on Botanical Composition <strong>and</strong> Nutritive of value of Native<br />
pasture <strong>in</strong> the Central Ethiopian high l<strong>and</strong>s. MSc. Thesis. Alemaya University of Agriculture.<br />
Alemaya, Ethiopia.<br />
Kuchar, P., 1995. Range monitor<strong>in</strong>g, evaluation <strong>and</strong> range survey methods, Southeast Range Project<br />
Technical Report. Addis Ababa, Ethiopia. 92p.<br />
Lishan Tsehay, 2007. Woody <strong>and</strong> herbaceous species composition <strong>and</strong> the <strong>condition</strong> of the<br />
rangel<strong>and</strong>s <strong>in</strong> Sh<strong>in</strong>ile zone of <strong>condition</strong> of the rangel<strong>and</strong>s <strong>in</strong> Sh<strong>in</strong>ile zone of Somali regional<br />
state, Ethiopia. MSc Thesis. School of Graduate Studies, Haramaya University, Ethiopia.136p.<br />
Mannetje L’t, Jones RJ <strong>and</strong> Stobbs TH 1976. Pasture Evaluation by Graz<strong>in</strong>g Experiments. In:<br />
Shaw NH <strong>and</strong> Bryan WW (eds), Tropical pasture research Pr<strong>in</strong>ciples <strong>and</strong> Methods. Bull. 51.<br />
Commonwealth Agricultural Bureaux. Farnham Royal. Bucks. Engl<strong>and</strong>. pp. 222–234.<br />
MoA (M<strong>in</strong>istry of Agriculture). 1984. General Agricultural Survey. Prelim<strong>in</strong>ary Report. 1983/84. Vol.<br />
II MoA, Addis Ababa, Ethiopia.<br />
Osuji P O, Nsahlai I V <strong>and</strong> Khalili H.. 1993. Feed Evaluation. ILCA Manual 5. ILCA (International<br />
Livestock Centre for Africa), Addis Ababa, Ethiopia. 40 pp.<br />
Pratt, D.J <strong>and</strong> M. D. Gwynne, 1977. Range Management <strong>and</strong> Ecology <strong>in</strong> East Africa, Frieger<br />
publish<strong>in</strong>g company, Hunt<strong>in</strong>gton, New York. 391 pp.<br />
Simbaya, J.,1998. Development <strong>and</strong> field evaluation of dry-season <strong>feed</strong> supplementation packages<br />
for smallholder farms, Livestock <strong>and</strong> Pest Research Centre (LPRC), National Institute for<br />
Scientific <strong>and</strong> Industrial Research (NISIR) Annual report, Chilanga, Zambia.<br />
Sisay Amare, 2006. Qualitative <strong>and</strong> quantitative aspects of animal <strong>feed</strong> <strong>in</strong> different agro-ecological<br />
areas of <strong>North</strong> Gonder. MSc. Thesis. Alemaya University, Ethiopia.<br />
van Soest, P. J., 1988. Effect of environment <strong>and</strong> quality of fiber on the nutritive value of crop<br />
residues. In: Reed J D, Capper B S <strong>and</strong> Neate P J H (eds), Plant breed<strong>in</strong>g <strong>and</strong> the nutritive<br />
value of crop residues. Proceed<strong>in</strong>gs of a workshop held at ILCA, Addis Ababa, Ethiopia, 7–10<br />
December 1987. ILCA (International Livestock Centre for Africa), Addis Ababa, Ethiopia. pp.<br />
71–96.<br />
van Soest .P.J. <strong>and</strong> J. B. Robesrtson, 1985. Analysis of forage <strong>and</strong> fibrous <strong>feed</strong>s. A laboratory manual<br />
for animal science, 613. Department of animal sciences, Cornell university, Ithaca, NY, USA.<br />
202 pp.<br />
van Soest, P.J., J. B. Robertson <strong>and</strong> B. A. Lewis, 1991. Methods for dietary fibers, neutral detergent<br />
fibers <strong>and</strong> non-starch polysaccharides <strong>in</strong> relation to animal nutrition. J. Dairy Science. 74.<br />
35883–3597.<br />
SPSS (Statistical Procedure for Social Science). 2003. (Version 12). INC. Chicago, USA.<br />
SRM (Society for Range Management). 1999. A glossary of terms used <strong>in</strong> range management.<br />
Society for Range Management. Denver, Colorado. 20 pp.<br />
Ta<strong>in</strong>ton, N. M., 1981. The Assessment of Veld Condition. In: N.M. Ta<strong>in</strong>ton (ed),Veld <strong>and</strong> pasture<br />
management <strong>in</strong> South Africa. Shutter <strong>and</strong> shooter Ltd: Pietermaritzburg, South Africa. pp.<br />
46–55.<br />
Ta<strong>in</strong>ton, N.M., 1999. Veld management <strong>in</strong> South Africa. In: N.M. Ta<strong>in</strong>ton (ed). University of Natal<br />
Press, Pietermarizburg, South Africa. 532p.<br />
Tesfaye Mengistie. 2008. Characterization of cattle milk <strong>and</strong> meat production, process<strong>in</strong>g <strong>and</strong><br />
market<strong>in</strong>g system <strong>in</strong> <strong>Metema</strong> <strong>District</strong>. MSc Thesis. School of Graduate Studies, Hawasa<br />
University, Ethiopia, 200 pp.<br />
Teshome Abate, 2006. Traditional utilization practices <strong>and</strong> <strong>condition</strong> assessment of the rangel<strong>and</strong>s<br />
<strong>in</strong> Rayitu district of Bale zone, Ethiopia. MSc Thesis. School of Graduate Studies, Haramaya<br />
University, Ethiopia. 129 pp.<br />
62
van der Westhuizen, HC van Rensburg WLJ, Snyman HA 1999. The quantification of rangel<strong>and</strong><br />
<strong>condition</strong> <strong>in</strong> a semi-arid grassl<strong>and</strong> of Southern Africa. African Journal of Range <strong>and</strong> Forage<br />
Science 16:9–21.<br />
van der Westhuizen HC, Snyman HA, van Rensburg WLJ <strong>and</strong> Potgieter JHJ 2001. The quantification<br />
of graz<strong>in</strong>g capacity from graz<strong>in</strong>g <strong>and</strong> production values for species <strong>in</strong> the semi-arid grassl<strong>and</strong><br />
biome of Southern Africa. African Journal of Range <strong>and</strong> Forage science, 18:43–52.<br />
63
Appendices<br />
Appendix Table 1. Criteria for the scor<strong>in</strong>g of the different factors determ<strong>in</strong><strong>in</strong>g range <strong>condition</strong>s (Herbaceous<br />
vegetation <strong>and</strong> soil <strong>condition</strong>)<br />
Score Grasses spp composition Basal cover Number of seedl<strong>in</strong>gs Litter cover Soil erosion Soil compaction Age distribution<br />
10 91–100% decreaser<br />
> 12%, no bare<br />
areas<br />
> 12%, no bare<br />
areas<br />
9 81–90% decreaser – –<br />
8 71–80% decreaser<br />
>9% evenly<br />
>9% evenly<br />
distributed<br />
distributed<br />
7 61–70% decreaser<br />
>9% occasional<br />
>9% occasional<br />
bare spots<br />
bare spots<br />
6 51–60% decreaser<br />
>6% evenly<br />
>6% evenly<br />
distributed<br />
distributed<br />
5 41–50% decreaser >6%, bare spots<br />
4<br />
3<br />
2<br />
1<br />
10–40% decreaser <strong>and</strong><br />
>30% <strong>in</strong>creaser<br />
10-40% decreaser <strong>and</strong><br />
<br />
50% <strong>in</strong>creaser<br />
3%, ma<strong>in</strong>ly<br />
annuals<br />
1–3%<br />
4 seedl<strong>in</strong>gs on<br />
A4 paper<br />
4 seedl<strong>in</strong>gs on<br />
A4 paper<br />
3 seedl<strong>in</strong>gs on<br />
A4 paper<br />
2 seedl<strong>in</strong>gs on<br />
A4 paper<br />
1 seedl<strong>in</strong>g on<br />
A4 paper<br />
>6%, bare spots<br />
>3%, ma<strong>in</strong>ly<br />
perennials<br />
>3%, ma<strong>in</strong>ly annuals<br />
1–3%<br />
No sign of soil<br />
erosion<br />
Slight s<strong>and</strong><br />
mulch<br />
Weak-side<br />
pedestals<br />
Steep-sided<br />
pedestals<br />
50% capp<strong>in</strong>g Only old<br />
>75% capp<strong>in</strong>g Only medium<br />
Almost 100%<br />
capp<strong>in</strong>g<br />
Only young<br />
Source: Baars et al. (1997).<br />
64
Appendix Table 2. Criteria for the scor<strong>in</strong>g of the different factors determ<strong>in</strong><strong>in</strong>g range <strong>condition</strong>s<br />
Parameters Value Total po<strong>in</strong>t Descriptions<br />
Hedg<strong>in</strong>g 3 5 Highly palatable <strong>and</strong> palatable shrubs share dom<strong>in</strong>ance<br />
Most hedge able plants are lightly to moderately hedged<br />
Few or no decadent plants<br />
2 3 Palatable plants dom<strong>in</strong>ant. Hedgeable plants moderately to<br />
Heavily hedged<br />
Some shrubs decadent due to hedg<strong>in</strong>g<br />
1 2 Palatable <strong>and</strong> less palatable plants dom<strong>in</strong>ant<br />
Hedge able plants heavily to very heavily hedged<br />
Considerable numbers of decadents’ shrubs present<br />
Some may be dead due to hedg<strong>in</strong>g<br />
0 1 Less palatable <strong>and</strong> unpalatable shrubs dom<strong>in</strong>ant<br />
Some normally unhedgeable shrubs are hedged<br />
Hedge able shrubs very heavily hedged the crowns often reduced to<br />
Canopy cover 3 5 >45% cover<br />
2 4 36–45% cover<br />
1.5 3 26–35%<br />
1 2 15–25%<br />
0 1 1000–2000/ha<br />
3 >2000–3000/ha<br />
2 >3000–4000/ha,<br />
1 >4000/ha<br />
Source: Kuchar (1995).<br />
65
Appendix Table 3. Common <strong>and</strong>/or dom<strong>in</strong>ant woody species <strong>and</strong> their percentage composition <strong>in</strong> the farm<strong>in</strong>g<br />
system of different graz<strong>in</strong>g areas<br />
Woody species Category<br />
CLFS SLFS<br />
CG RS EN CG RS EN<br />
G. ternifolia LD C – P – – –<br />
A. polyacantha DS D D C C D<br />
T. laxiflora C P C P C<br />
A. tortilis DS C D – C C C<br />
A. seyal DS D C D D C C<br />
D. c<strong>in</strong>erea DS D – C D P<br />
A. leiocarpus DS C C D C P D<br />
P. lucens HD C P D C P D<br />
F. sycomorus DS C P – P P<br />
C. coll<strong>in</strong>um LD P – – C P C<br />
X. Americana LD C – P – –<br />
S. kunthianum DS C P – – P<br />
B. aegyptiaca DS C P C C C C<br />
G. villosa LD – – – – C<br />
Z. sp<strong>in</strong>a-christi HD C C D C C D<br />
P. ton<strong>in</strong>gii DS P P P<br />
F. virosa LD C – – C<br />
B. papyrifera UD C P C C C D<br />
A. senegal DS D P C – P C<br />
C. mole LD – C C<br />
CLFS: cotton livestock farm<strong>in</strong>g system; SLFS: sesame livestock farm<strong>in</strong>g system; CG: communal graz<strong>in</strong>g; RS: road side; EN: enclosure; P: Present (10% <strong>and</strong> 20% density).<br />
66
Appendix Table 4. Herbaceous species identified <strong>in</strong> different farm<strong>in</strong>g system <strong>and</strong> graz<strong>in</strong>g types of the district<br />
Botanical name Local name Category CLFS SLFS<br />
Grasses: CG RS EN CG RS EN<br />
Eriochloa fatamensis (Hochst. <strong>and</strong> Steud.) Metruqe LD P C C P<br />
P. sphacelatum (Nees) J<strong>in</strong>gra DS C C C D C C<br />
Urochloa cf. brachyura (Hack.) Stapf Metruq LD P P<br />
T. tri<strong>and</strong>ra Chechewa HD P D P P<br />
C. ciliaris Zemen DS D C C C<br />
E. floccifolia Ahya dagusa LD D C D C<br />
S. pumila (Poir.) R. <strong>and</strong> S. Dimemo DS C C C C<br />
C. dyctlon Serdo HD P P C P<br />
R.fistulosa (Hochst.) Benth. Ejargew LD C C C<br />
B. lata (Schumach.) C. E. Hub Mashilo DS C P C<br />
P. coloratum L. kok sar HD D D<br />
H. rufa Topas HD D<br />
S. pyramidialis NA DS C<br />
Cyprrus Spp. Gicha LD C<br />
Legumes:<br />
I. spicata Forsk. Kola maget DS C C C<br />
A. quart<strong>in</strong>ianus A. Rich Adoye DS C C C D<br />
C. mimosoides (L) Greene) Ko<strong>in</strong>a UD P C p<br />
------------------- Yeahiya abish UD C D D D<br />
V. membranacea Yeayit guaya DS C P C C<br />
D. dichotomum (Kle<strong>in</strong> ex W) Aborida P D<br />
Sedges <strong>and</strong> others:<br />
C. barbata Mech mesel UD P P C<br />
E. <strong>in</strong>dica Na UD C C C D<br />
S. sphaerostima wuha ankur UD C P C<br />
H. schulli Amakela LD P<br />
67
Botanical name Local name Category CLFS SLFS<br />
K. foetidissima Hareg ressa UD P P<br />
C. subula Yekola mech UD D D C C P<br />
H. articulatus Hoccht. Abo hareg HD P D C<br />
B. setigera (Sch. Bip.) Sherff Yebereha adey UD C C C C<br />
Phyllanthus rotundifolius Willd. UD p p<br />
C. trilocularis L Amirra DS p<br />
H. vitifolius L. Gimel waika DS p P p<br />
Z. elegans Jaqu<strong>in</strong>. Adey abeba UD C C C C<br />
68
Appendix Table 5. Correlation matrix among variables studied <strong>in</strong> the communal graz<strong>in</strong>g areas of CLFS<br />
fs spc bc lc se sc ag sed wds ccs heg tor wd cc<br />
Fs 1<br />
Spc 0.767** 1<br />
Bc 0.758** 0.540** 1<br />
C 0.526** 0.383 0.548** 1<br />
Se 0.571** 0.315 0.744** 0.576** 1<br />
Sc 0.388 0.387 0.335 0.126 0.135 1<br />
Ag 0.462* 0.575** 0.243 0.017 –0.14 0.132 1<br />
Sed 0.234 –0.023 0.179 0.338 0.118 0.228 –0.087 1<br />
Wds –0.203 –0.323 –0.056 –0.314 0.491 –0.691 –0.240 –0.612 1<br />
Ccs 0.664 0.728* 0.312 –0.103 0.121 0.188 0.383 –0.046 0.172 1<br />
Heg 0.887** 0.737** 0.856** 0.383 0.353 0.555 0.716* 0.118 –0.058 0.616 1<br />
Tor 0.666** 0.593** 590** 0.468* 0.497 0.383 0.196 0.345 –0.169 0.649 0.902** 1<br />
Wd 0.612 0.859** 0.490 0.511 0.033 0.807* 0.515 0.219 –0.611 0.410 0.489 0.731* 1<br />
Cc 0.507 0.351 0.303 0.254 0.374 –0.180 0.088 –0.196 0.237 0.576 0.304 0.417 0.170 1<br />
** Correlation is significant at 0.01 levels;* Correlation is significant at 0.05 levels.<br />
Fs: farm<strong>in</strong>g system; Spc: species composition; Bc: basal cover; Lc: litter cover; Se: soil erosion; Sc: soil compaction; Ag: age distribution; Sed: seedl<strong>in</strong>g count; Wds:<br />
woody density score; Ccs: canopy cover score; Heg: hedg<strong>in</strong>g effect; Tor: total range <strong>condition</strong> score; Wd: woody density; Cc: canopy cover.<br />
69
Appendix Table 6. Correlation matrixes among variables studied <strong>in</strong> the road side graz<strong>in</strong>g areas of CLFS<br />
fs spc bc lc se sc ag sed wds ccs heg tor wd cc<br />
Fs 1<br />
Spc 0.707** 1<br />
Bc 0.497* 0.226 1<br />
Lc 0.406* 0.288 0.040 1<br />
Se –0.073 –0.058 –0.057 0.321 1<br />
Sc 0.080 0.108 –0.240 0.021 0.014 1<br />
Ag 0.132 0.138 –0.070 0.507** 0.128 0.197 1<br />
Sed 0.330 0.060 0.426* 0.137 –0.070 –0.154 –0.248 1<br />
Wds 0.460 0.246 0.127 –0.038 0.060 0.185 –0.183 0.395 1<br />
Ccs –0.220 –0.196 0.488 0.025 0.017 0.334 –0.201 0.141 –0.003 1<br />
Heg 0.482 0.306 –0.083 –0.073 0.119 0.030 –0.200 0.198 0.792* –0.275 1<br />
Tor 0.462* 0.523** 0.222 0.418* 0.167 0.271 0.434* 0.235 0.380 0.457 0.199 1<br />
wd 0.142 0.036 0.156 0.150 0.453 –0.295 0.149 0.240 0.392 –0.446 0.374 0.138 1<br />
Cc –0.071 –0.331 0.472 0.445 0.331 0.111 0.061 0.753* –0.002 0.298 –0.310 0.469 –.203 1<br />
**= correlation is significant at 0.01 levels,*= correlation is significant at 0.05 levels.<br />
Fs: farm<strong>in</strong>g system; Spc: species composition; Bc: basal cover; Lc: litter cover; Se: soil erosion; Sc: soil compaction; Ag: age distribution; Sed: seedl<strong>in</strong>g count; Wds:<br />
woody density score; Ccs: canopy cover score; Heg: hedg<strong>in</strong>g effect; Tor: total range <strong>condition</strong> score; Wd: woody density; Cc: canopy cover.<br />
70
Appendix Table 7. Correlation matrixes among variables studied <strong>in</strong> the enclosure areas of CLFS<br />
Fs spc bc lc se sc ag sed wds ccs heg tor wd<br />
Fs 1<br />
Spc 0.339 1<br />
Bc 0.439 0.595** 1<br />
Lc 0.302 –0.229 0.027 1<br />
Se 0.202 0.342 0.089 –0.294 1<br />
Sc 0.013 0.411 –0.050 –0.034 0.197 1<br />
Ag –0.258 –0.494* –0.323 0.235 –0.548* –0.213 1<br />
Sed –0.146 –0.347 –0.066 0.467* –0.115 –0.261 0.214 1<br />
Wds –0.968** –0.289 0.009 –0.639 –0.045 –0.069 –0.163 –0.362 1<br />
Ccs –449 –219 0.747 –0.575 –0.349 –0.170 –0.265 0.180 0.509 1<br />
Heg –425 0.509 –0.071 –0.702 0.730 0.697 0.041 –0.886* 0.360 0.304 1<br />
Tor –0.241 0.198 –0.022 –0.621 0.250 0.155 –0.193 0.105 0.896* 0.360 0.304 1<br />
wd 0.043 –0.405 –0.754 0.631 –0.399 –0.354 0.885* 0.459 –0. 247 –0.603 –0.185 –0.107 1<br />
**= correlation is significant at 0.01 levels;*= correlation is significant at 0.05 levels.<br />
Fs: farm<strong>in</strong>g system; Spc: species composition; Bc: basal cover; Lc: litter cover; Se: soil erosion; Sc: soil compaction; Ag: age distribution; Sed: seedl<strong>in</strong>g count; Wds:<br />
woody density score; Ccs: canopy cover score; Heg: hedg<strong>in</strong>g effect; Tor: total range <strong>condition</strong> score; Wd: woody density; Cc: canopy cover.<br />
71
Appendix Table 8. Correlation matrix among variables studied <strong>in</strong> the graz<strong>in</strong>g areas of CLFS<br />
spc bc lc se sc ag sed wds ccs heg tor wd<br />
Grt 1<br />
Spc 0.665** 1<br />
Bc 0.611** 0.671** 1<br />
Lc 0.583** 0.697** 0.714** 1<br />
Se 0.642** 0.644** 0.582** 0.586** 1<br />
Sc 0.592** 0.600** 0.626** 0.386** 0.521** 1<br />
Ag 0.579** 0.689** 0.802** 0.654** 0.620** 0.648** 1<br />
Sed 0.790** 0.720** 0.477 0.715* 0.820** 0.701* 0.669* 1<br />
Wds 0.124 0.048 –0.087 –0.235 –0.056 0.092 –0.139 0.147 1<br />
Ccs 769** 0.693** 0.426 0.788** 0.866** 0.503 0.669* 0.902** –0.159 1<br />
Heg 0.757** 0.790** 0.747** 0.764** 0.723** 0.660** 0.801** 0.878** 0.043 0.826** 1<br />
Tor –0.281 –0.140 0.112 –0.068 –0.406 –0.096 –0.056 –0.540 0.151 –0.309 –0.233 1<br />
wd 0.214 –0.080 0.137 –0.078 –0.268 –0.216 0.043 –0.490 0.522 –0.299 –0.137 0.657*<br />
**= correlation is significant at 0.01 levels; *= correlation is significant at 0.05 levels.<br />
Fs: farm<strong>in</strong>g system; Spc: species composition; Bc: basal cover; Lc: litter cover; Se: soil erosion; Sc: soil compaction; Ag: age distribution; Sed: seedl<strong>in</strong>g count; Wds:<br />
woody density score; Ccs: canopy cover score; Heg: hedg<strong>in</strong>g effect; Tor: total range <strong>condition</strong> score; Wd: woody density; Cc: canopy cover.<br />
72
Appendix Table 9. Correlation matrixes among variables studied <strong>in</strong> the graz<strong>in</strong>g areas of SLFS<br />
Spc bc lc se sc ag sed wds ccs heg tor wd<br />
Spc 1<br />
Bc 0.631** 1<br />
Lc 0.718** 0.718** 1<br />
Se 0.652** 0.615** 0.728** 1<br />
Sc 0.833** 0.602** 0.807** 0.641** 1<br />
Ag 0.689** 0.0.470** 0.734** 0.617** 0.732** 1<br />
Sed 0.568** 0.784** 0.714** 0.458** 0.699** 0.437** 1<br />
Wds 0.247 0.484 0.516 0.545 0.291 0.052 0.395 1<br />
Ccs 0.143 0.219 –0.019 0.182 0.049 0.125 0.023 –0.624* 1<br />
Heg 0.633* 0.574 0.563 0.718* 0.572 0.401 0.582 0.556 –0.240 1<br />
Tor 0.846** 0.634** 0.811** 0.672** 0.819** 0.685** 0.663** 0.307 0.336 0.591 1<br />
wd 0.162 –0.114 –0.147 –0.054 0.038 0.124 –0.168 –0.835** 0.828** –0.271 0.117 1<br />
**= correlation is significant at 0.01 levels,*= correlation is significant at 0.05 levels.<br />
Fs: farm<strong>in</strong>g system; Spc: species composition; Bc: basal cover; Lc: litter cover; Se: soil erosion; Sc: soil compaction; Ag: age distribution; Sed: seedl<strong>in</strong>g count; Wds:<br />
woody density score; Ccs: canopy cover score; Heg: hedg<strong>in</strong>g effect; Tor: total range <strong>condition</strong> score; Wd: woody density; Cc: canopy cover.<br />
73
Appendix Table 10. Correlation matrix among variables studied <strong>and</strong> their <strong>in</strong>teractions <strong>in</strong> range <strong>condition</strong><br />
assessment <strong>in</strong> <strong>Metema</strong><br />
Fs Grt spc bc lc se sc ag sed wds ccs heg tor<br />
FS 1<br />
Grt 0.078 1<br />
Spc 0.509** 0.345** 1<br />
Bc 0.443** 0.473** 0.726** 1<br />
Lc 0.306** 0.451** 0.690** 0.727** 1<br />
Se 0.247* 0.323** 0.630** 0.677** 0.739** 1<br />
Sc 0.192 0.454** 0.704** 0.634** 0.703** 0.603** 1<br />
Ag 0.157 0.328** 0.615** 0.549** 0.682** 0.513** 0.628** 1<br />
Sed 0.207 0.576** 0.588** 0.733** 0.772** 0.577** 0.669** 0.571** 1<br />
Wds –0.086 0.799** 0.418 0.556** 0.406 0.590** 0.520* 0.411 0.523* 1<br />
Ccs 0.117 –0.678** 0.173 0.169 0.005 0.041 0.040 0.060 –0.024 –0.359 1<br />
Heg 0.285 0.536* 0.719** 0.677** 0.529* 0.702** 0.734** 0.515* 0.633** 0.737** –0.142 1<br />
Tor 0.282* 0.440** 0.797** 0.745** 0.732** 0.773** 0.679** 0.756** 0.634** 0.205 0.770** 1<br />
**= correlation is significant at 0.01 levels’;*= correlation is significant at 0.05 levels.<br />
Fs: farm<strong>in</strong>g system; Spc: species composition; Bc: basal cover; Lc: litter cover; Se: soil erosion; Sc: soil compaction; Ag: age distribution; Sed: seedl<strong>in</strong>g count; Wds:<br />
woody density score; Ccs: canopy cover score; Heg: hedg<strong>in</strong>g effect; Tor: total range <strong>condition</strong> score; Wd: woody density; Cc: canopy cover.<br />
74
Source: IPMS (2005).<br />
Appendix Figure 1. <strong>Metema</strong> district farm<strong>in</strong>g systems.<br />
Source: IPMS (2005).<br />
Appendix Figure 2. L<strong>and</strong> use <strong>and</strong> l<strong>and</strong> cover of <strong>Metema</strong> district.<br />
75
Appendix Figure 3. The view of communal graz<strong>in</strong>g l<strong>and</strong>s at the dry season prior to flash burn<strong>in</strong>g.<br />
Appendix Figure 4. The view of communal graz<strong>in</strong>g l<strong>and</strong>s at peak dry season.<br />
76
Appendix Figure 5. Partial view of communal graz<strong>in</strong>g l<strong>and</strong>s <strong>in</strong> the sesame-based farm<strong>in</strong>g system.<br />
Appendix Figure 6. Hay storage <strong>in</strong> open field.<br />
77
Appendix Figure 7. P. spheslatum grass dom<strong>in</strong>ated communal graz<strong>in</strong>g l<strong>and</strong> at SLFS.<br />
Appendix Figure 8. Part of an enclosure site <strong>in</strong> the sesame–livestock farm<strong>in</strong>g system (Agam wuha).<br />
78
Appendix Figure 9. Communal graz<strong>in</strong>g l<strong>and</strong> after flash burn<strong>in</strong>g.<br />
Appendix Figure 10. H. rufa grass dom<strong>in</strong>ated wood l<strong>and</strong> (Guange river side areas).<br />
79
Canadian International<br />
Development Agency<br />
Agence canadienne de<br />
développement <strong>in</strong>ternational<br />
<br />
<br />
Federal Democratic Republic of Ethiopia<br />
MINISTRY OF AGRICULTURE AND<br />
RURAL DEVELOPMENT