Global Fund: Progress Report 2010 - unaids
Global Fund: Progress Report 2010 - unaids
Global Fund: Progress Report 2010 - unaids

You also want an ePaper? Increase the reach of your titles
YUMPU automatically turns print PDFs into web optimized ePapers that Google loves.
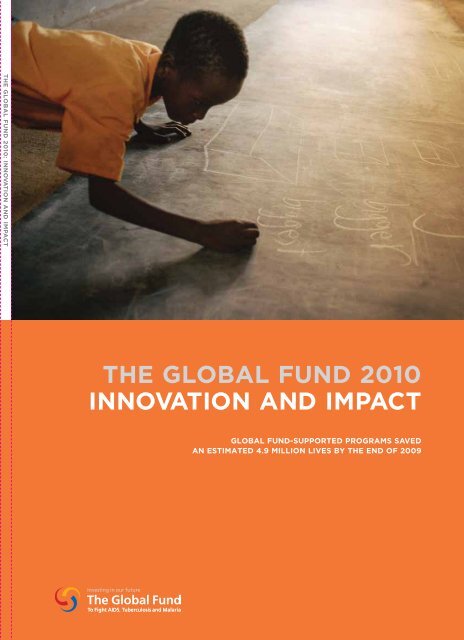
THE GLOBAL FUND <strong>2010</strong>: INNOVATION AND IMPACT<br />
THE GLOBAL FUND <strong>2010</strong><br />
INNOVATION AND IMPACT<br />
GLOBAL FUND-sUPPOrTED prOGrAMs sAVED<br />
AN esTIMATED 4.9 MILLION LIVEs by THE END OF 2009
The <strong>Global</strong> <strong>Fund</strong> <strong>2010</strong>: Innovation and Impact is based on results through the end of 2009.<br />
This report was published in March <strong>2010</strong>.<br />
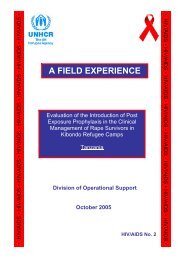
A lab assistant in Delhi catalogues sputum samples before they are<br />
tested. <strong>Global</strong> <strong>Fund</strong> support is increasing the number of smear-positive<br />
tb cases detected and treated in India – the country with the highest<br />
number of tb patients.
TABLE OF<br />
CONTENTS<br />
1 THE GLOBAL FUND <strong>2010</strong>: INNOVATION AND IMPACT<br />
LIST OF TErms ANd ABBREVIATIONS 2<br />
EXECUTIVE SUmmARY 3<br />
1. INTRODUCTION 7<br />
2. rESULTS AND PROGRESS<br />
ON INTERNATIONAL TARGETS 13<br />
2.1 KEY GLOBAL RESULTS OF GLOBAL FUND-SUPPORTED PROGRAMS 15<br />
2.2 KEY RESULTS BY REGION 17<br />
2.3 CONTRIBUTION TO INTERNATIONAL EFFORTS AND BREAKDOWN<br />
OF EXPENDITURES 25<br />
2.4 THE GLOBAL FUND’S CONTRIBUTION TO PROGRESS<br />
ON THE MILLENNIUM DEVELOPMENT GOALS AND OTHER<br />
INTERNATIONAL TARGETS 27<br />
2.5 RESULTS OF PERFORMANCE-BASED FUNDING 44<br />
2.6 ENSURING EQUITABLE ACCESS TO SERVICES 49<br />
2.7 CHALLENGES 57<br />
3. IMPROVING EFFECTIVENESS 61<br />
3.1 AID EFFECTIVENESS 62<br />
3.2 IMPROVING VALUE FOR MONEY 66<br />
3.3 UNIT COSTS FOR KEY INTERVENTIONS IN PROGRAMS 68<br />
3.4 MAXIMIZING IMPACT: COST-EFFECTIVENESS AND ECONOMIC<br />
RETURNS ON INVESTMENT 73<br />
3.5 THE WAY FORWARD: CONTINUING TO IMPROVE AID<br />
EFFECTIVENESS AND VALUE FOR MONEY 74<br />
4. LEARNING AND INNOVATING 77<br />
4.1 LEARNING THROUGH GRANT AND SECRETARIAT OPERATIONS 78<br />
4.2 LEARNING THROUGH EVALUATIONS 80<br />
4.3 LEARNING FROM STUDIES UNDERTAKEN BY THE OFFICE<br />
OF THE INSPECTOR GENERAL 82<br />
4.4 LEARNING THROUGH PARTNERSHIPS 83<br />
4.5 CONTINUING TO UNDERTAKE NEW INITIATIVES AND INNOVATE 84<br />
5. CONCLUSIONS 91<br />
REFERENCES 94<br />
ANNEXES 100<br />
ANNEX 1. LIST OF BOXES, FIGURES AND TABLES 100<br />
ANNEX 2. THE GLOBAL FUND STRUCTURE AND REGIONS 102<br />
ANNEX 3. SUMMARY OF GLOBAL FUND-SUPPORTED PROGRAMS 106
LIST OF TErmS<br />
AND ABBREVIATIONS<br />
ACT<br />
AIDS<br />
AMFm<br />
ART<br />
ARV<br />
CBO<br />
CCM<br />
DOTS<br />
FBO<br />
HIV<br />
IQR<br />
ITN<br />
LLIN<br />
M&E<br />
MDGs<br />
MDR-TB<br />
NGO<br />
OECD<br />
PEPFAR<br />
PMTCT<br />
STI<br />
TB<br />
UNAIDS<br />
UNDP<br />
UNGASS<br />
UNICEF<br />
WHO<br />
artemisinin-based combination therapy<br />
acquired immunodeficiency syndrome<br />
Affordable Medicines Facility – malaria<br />
antiretroviral therapy<br />
antiretroviral<br />
community-based organization<br />
Country Coordinating Mechanism<br />
the basic package that underpins the Stop TB strategy<br />
faith-based organization<br />
human immunodeficiency virus<br />
interquartile range<br />
insecticide-treated net<br />
long-lasting insecticide-treated net<br />
monitoring and evaluation<br />
Millennium Development Goals<br />
multidrug-resistant tuberculosis<br />
nongovernmental organization<br />
Organisation for Economic Co-operation and Development<br />
President’s Emergency Plan for AIDS Relief (U.S.)<br />
prevention of mother-to-child transmission (of HIV)<br />
sexually transmitted infection<br />
tuberculosis<br />
Joint United Nations Programme on HIV/AIDS<br />
United Nations Development Programme<br />
United Nations General Assembly Special Session<br />
United Nations Children’s <strong>Fund</strong><br />
World Health Organization
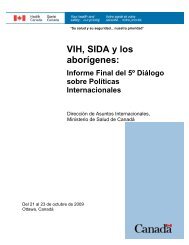
A TRADITIONAL BIRTH ATTENDANT COMFORTS A WOMAN PREPARING TO HAVE HER<br />
FIRST CHILD IN A CLINIC IN SIERRA LEONE. GLOBAL FUND SUPPORT IS CONTRIBUTING<br />
TO NATIONAL EFFORTS TO REDUCE MALARIA MORBIDITY AND MORTALITY IN PREGNANT<br />
WOMEN AND CHILDREN UNDER FIVE.<br />
3 THE GLOBAL FUND <strong>2010</strong>: INNOVATION AND IMPACT executive summary<br />
EXECUTIVE<br />
SUmmARY<br />
The <strong>Global</strong> <strong>Fund</strong>: Preventing<br />
diseases, providing care and<br />
support, and saving lives<br />
1. Every day, programs supported by the <strong>Global</strong><br />
<strong>Fund</strong> save at least 3,600 lives, prevent thousands<br />
of new infections and alleviate untold suffering.<br />
2. The <strong>Global</strong> <strong>Fund</strong> to Fight AIDS, Tuberculosis and<br />
Malaria is a public-private partnership established in<br />
2002 to mobilize and intensify the international response<br />
to three global epidemics and thereby help achieve<br />
the Millennium Development Goals (MDGs). From its<br />
founding through December 2009, the <strong>Global</strong> <strong>Fund</strong><br />
Board approved proposals totaling US$ 19.2 billion,<br />
and disbursed US$ 10 billion for HIV, tuberculosis<br />
(TB) and malaria control efforts. To maximize impact,<br />
every dollar donated goes to fund programs in<br />
country. The <strong>Global</strong> <strong>Fund</strong> has no country offices, and<br />
its operating expenses are almost entirely covered<br />
by the interest earned on the Trustee account at the<br />
World Bank.<br />
3. The results and impact outlined in this report are<br />
the achievements of all the partners that collaborate<br />
as part of the <strong>Global</strong> <strong>Fund</strong> model. The success of the<br />
<strong>Global</strong> <strong>Fund</strong> relies on the financial pledges of donors,<br />
the technical guidance of – and collaboration with –<br />
multilateral partners, and particularly the management<br />
and implementation of programs by in-country partners<br />
including governments, civil society organizations<br />
and the private sector.<br />
4. HIV. At the end of December 2009, programs<br />
financed by the <strong>Global</strong> <strong>Fund</strong> were providing antiretroviral<br />
therapy (ART) to 2.5 million people. Approved<br />
HIV proposals have totaled close to US$ 10.8 billion<br />
covering 140 countries. The <strong>Global</strong> <strong>Fund</strong> is estimated<br />
to have contributed about one-fifth of all disbursements<br />
by bi- and multilaterals for the HIV response in<br />
low- and middle-income countries in 2008. In addition<br />
to pro viding ART, programs funded by the <strong>Global</strong><br />
<strong>Fund</strong> have also distributed 1.8 billion male and female<br />
condoms and have provided 790,000 HIV-positive<br />
pregnant women with treatment to prevent motherto-child<br />
transmission of HIV, as well as 4.5 million basic<br />
care and support services to orphans and other children<br />
made vulnerable by AIDS, and 105 million HIV counseling<br />
and testing sessions. There is a growing body of<br />
evidence showing that <strong>Global</strong> <strong>Fund</strong> financing – alongside<br />
that of other financiers – has resulted in declines<br />
in AIDS mortality in countries in which provision of ART<br />
has been scaled up rapidly, accompanied by other<br />
significant impacts, such as improved survival and productivity<br />
of key professionals and other workers, and<br />
systemwide improvements in health care delivery.
5. Tuberculosis. Through 2009, programs funded by<br />
the <strong>Global</strong> <strong>Fund</strong> have provided treatment to 6 million<br />
people who had active TB. The <strong>Global</strong> <strong>Fund</strong> provides<br />
63 percent of the external financing for TB and multidrug-resistant<br />
TB (MDR-TB) control efforts in low- and<br />
middle-income countries. Approved TB proposals have<br />
totaled close to US$ 3.2 billion covering 112 countries,<br />
contributing 48 percent of the projected coverage<br />
required to achieve the Stop TB Partnership targets<br />
for the detection and treatment of new smear-positive<br />
TB cases. TB programs supported by the <strong>Global</strong> <strong>Fund</strong><br />
have also provided 1.8 million TB/HIV services. In many<br />
countries in which the <strong>Global</strong> <strong>Fund</strong> supports programs,<br />
TB prevalence is declining, as are TB mortality rates.<br />
6. Malaria. By the end of 2009, <strong>Global</strong> <strong>Fund</strong>supported<br />
programs had distributed 104 million<br />
insecticide-treated nets (ITNs) to prevent malaria.<br />
They also supported indoor residual spraying of insecticides<br />
in dwellings more than 19 million times and<br />
treated 108 million cases of malaria in accordance<br />
with national treatment guidelines. Approved malaria<br />
proposals have totaled US$ 5.3 billion covering<br />
83 countries. In 2008, the <strong>Global</strong> <strong>Fund</strong> contributed<br />
57 percent of international disbursements for malaria<br />
control. <strong>Global</strong> <strong>Fund</strong> investments have played a critical<br />
role in introducing and expanding coverage of novel,<br />
effective malaria treatments in many countries where<br />
drug resistance to older treatments is high. In conjunction<br />
with re-energized national and international efforts<br />
to combat malaria, increased <strong>Global</strong> <strong>Fund</strong> financing<br />
is having a substantial impact on malaria morbidity<br />
and mortality worldwide, with an increasing number<br />
of countries reporting a reduction in malaria deaths<br />
of more than 50 percent.<br />
7. The <strong>Global</strong> <strong>Fund</strong> supports community-based<br />
interventions. Since 2003, these efforts have delivered<br />
138 million community outreach prevention services<br />
for at least one of the three diseases and provided<br />
11.3 million “person-episodes” of training for health and<br />
community workers.<br />
8. These combined efforts saved an estimated<br />
4.9 million lives by December 2009 and restored hope<br />
for the 33 million people living with HIV, the hundreds<br />
of millions of people who contract malaria or who are<br />
at risk each year, and the 9.4 million who contract<br />
active TB annually. The coming years will see even more<br />
results, as half of the total disbursements by the <strong>Global</strong><br />
<strong>Fund</strong> were delivered in 2008 and 2009. Much of the<br />
US$ 5.4 billion of financing approved in Rounds 8 and<br />
9 will reach countries in <strong>2010</strong> and 2011, and will continue<br />
to significantly boost health outcomes.<br />
Having a wider impact:<br />
Strengthening health systems and<br />
contributing to progress on the<br />
Millennium Development Goals<br />
9. The <strong>Global</strong> <strong>Fund</strong> investments to combat HIV, TB<br />
and malaria are having a much wider impact – beyond<br />
individuals, their families and communities. They are<br />
major investments in health systems – bolstering infrastructure,<br />
strengthening laboratories, expanding<br />
human resources, augmenting skills and competencies<br />
of health workers, and developing and supporting<br />
monitoring and evaluation (M&E) activities. These<br />
enhancements, in turn, improve the sustainability<br />
of services, increase national capacity to expand programs<br />
further and increase countries’ ability to<br />
improve services for other health issues. Ultimately,<br />
the investments translate into a healthier population<br />
and increased productivity, enabling countries to<br />
further their development.<br />
10. These investments have helped accelerate progress<br />
towards the MDGs by contributing directly to<br />
MDGs 4, 5, 6 and 8, and indirectly to the others. The<br />
US$ 19.2 billion of approved investment by the <strong>Global</strong><br />
<strong>Fund</strong> is a direct contribution to MDG 6 (“Combat<br />
HIV/AIDS and malaria and other diseases”). In addition,<br />
major contributions have also been made to MDG 4<br />
(on child mortality) and MDG 5 (on maternal mortality)<br />
by reducing the largest causes of mortality among<br />
women and children. This is particularly the case in sub-<br />
Saharan Africa, where HIV, TB and malaria are<br />
responsible for 52 percent of deaths among women<br />
of childbearing age and malaria alone accounts for<br />
16 to 18 percent of child deaths.<br />
Achieving results and<br />
promoting equity<br />
11. The <strong>Global</strong> <strong>Fund</strong>’s innovative financing model<br />
was designed to respond quickly and effectively to the<br />
tremendous need for funding in the countries with<br />
the heaviest burdens of AIDS, TB and malaria, while<br />
ensuring transparency and broad accountability to<br />
donors and recipients. This model has continued to<br />
evolve, and in 2009 it tested new ways to strengthen<br />
country ownership and governance, increase access to<br />
lifesaving medicines and other health products, and<br />
promote health equity.
12. Equitable access to services is fundamental<br />
to the mission of the <strong>Global</strong> <strong>Fund</strong>. In making grants,<br />
great weight is assigned to each country’s needs,<br />
as measured by indicators such as disease burden and<br />
poverty level. The <strong>Global</strong> <strong>Fund</strong> also works to ensure<br />
that the programs it finances address the needs of the<br />
poorest, at-risk and marginalized groups, for instance<br />
with its new strategies on gender equality and sexual<br />
minorities. Further, it has become the world’s leading<br />
funder of harm reduction services for people who inject<br />
drugs, with substantial investments in 42 countries.<br />
13. Between 2005 and 2009, nearly four out of five<br />
assessed grants were performing well. Currently, TB<br />
grants are the best performers and civil society organizations<br />
the best performing Principal Recipients.<br />
Continuing to learn, improve<br />
effectiveness and innovate<br />
14. The <strong>Global</strong> <strong>Fund</strong> always seeks to learn, improve<br />
and innovate through its operations, partnerships<br />
and evaluations. One key opportunity for learning comes<br />
from the engagement of different constituencies in<br />
<strong>Global</strong> <strong>Fund</strong> governance – governments, civil society,<br />
the private sector, affected communities and bilateral<br />
and multilateral agencies.<br />
15. The <strong>Global</strong> <strong>Fund</strong> actively contributes to global<br />
efforts to improve aid effectiveness, especially in the<br />
area of managing for results, by playing a leading<br />
role in monitoring effectiveness and sharing experiences<br />
with performance-based funding.<br />
16. Within the <strong>Global</strong> <strong>Fund</strong>, the Board, the Board<br />
committees, the Executive Management Team, the<br />
Technical Evaluation Reference Group and the Office<br />
of the Inspector General help identify key areas of<br />
the organization’s programs and business model in<br />
need of evaluation or improvement. The continuous<br />
attention to evaluation and learning helps the <strong>Global</strong><br />
<strong>Fund</strong> maximize its responsiveness, effectiveness<br />
and cost-effectiveness.<br />
17. Ensuring value for money at every stage of the<br />
financing chain is a critical priority for the <strong>Global</strong> <strong>Fund</strong>.<br />
One of the focus areas is to develop and promote,<br />
with partners, standardized methods for countries to<br />
measure the efficiency and effectiveness of key HIV,<br />
TB and malaria services. The comprehensive performance<br />
review which occurs by year two of each grant<br />
also contributes to value for money by allowing for the<br />
reallocation of funds from poorly performing grants<br />
to better-performing grants as well as for the identification<br />
of efficiency gains. In 2009 alone, nearly<br />
US$ 1 billion was freed up for funding new grants.<br />
Voluntary pooled procurement is reducing the cost<br />
and improving the quality of pharmaceuticals and<br />
health products, and collaboration with technical partners<br />
is assessing the efficiency of service delivery<br />
models in order to expand and optimize access to lifesaving<br />
interventions.<br />
18. Through its portfolio of grants in 144 countries,<br />
the <strong>Global</strong> <strong>Fund</strong> has developed and is strengthening<br />
data analysis of unit costs for HIV, TB and malaria<br />
services. This analysis will institute savings, reveal best<br />
practices and waste, and assist in assessing resourceneed<br />
estimates in future grant applications.<br />
Maintaining the positive momentum<br />
for achieving results and impact<br />
19. The <strong>Global</strong> <strong>Fund</strong> is realizing the extraordinary<br />
vision of its founders, donors and implementers: it has<br />
dramatically intensified the fight against HIV, TB and<br />
malaria while contributing to improving health systems<br />
and to progress on achieving the MDGs. Virtual elimination<br />
of mother-to-child HIV transmission globally<br />
by 2015 can be achieved. Massive scale-up of HIV prevention<br />
programs and of provision of ART continues,<br />
though universal access to comprehensive and evidencebased<br />
HIV prevention, treatment, care and support<br />
remains distant. Prevalence of TB has significantly<br />
decreased over the last decade and the international<br />
target of halving TB prevalence could be met by 2015.<br />
Unprecedented coverage with ITNs and effective<br />
novel treatments have made great inroads in combating<br />
malaria. The rapid scale-up of prevention, treatment,<br />
care and support for these three pandemics has meant<br />
hope and – as the results in this report testify – a positive<br />
impact on millions of lives.<br />
20. Such unprecedented progress would not have<br />
been possible without the support of donors and partner<br />
organizations. In the coming years, continued,<br />
substantial increases in long-term financial commitments<br />
by donors will be needed to consolidate these<br />
gains and to reach the MDGs by 2015 and universal<br />
coverage of HIV, TB and malaria services. <strong>2010</strong> is a<br />
year that should inspire extraordinary commitments<br />
from the public and private sectors to safeguard and<br />
build upon the already substantial achievements made<br />
over the past decade.<br />
5 THE GLOBAL FUND <strong>2010</strong>: INNOVATION AND IMPACT executive summary
GLOBAL FUND ASSISTANCE IN INDIA INCLUDES INCREASING THE NUMBER<br />
OF FACILITIES PROVIDING TREATMENT FOR THE PREVENTION OF MOTHER-TO-CHILD<br />
TRANSMISSION OF HIV.
1. INTRODUCTION<br />
“The <strong>Global</strong> <strong>Fund</strong> was established to make<br />
a difference by tackling head-on three<br />
of the diseases that condemn vast numbers<br />
of people to ill health, discrimination and<br />
other human rights abuses, poverty and<br />
preventable early death. This is the inspiring<br />
and noble vision that unites us in our work<br />
at the <strong>Global</strong> <strong>Fund</strong>.”<br />
— MICHEL KAZATCHKINE<br />
EXECUTIVE DIRECTOR<br />
THE GLOBAL FUND TO FIGHT AIDS, TUBERCULOSIS AND MALARIA<br />
7 THE GLOBAL FUND <strong>2010</strong>: INNOVATION AND IMPACT INtrODuctiON
Hope, innovation, results and<br />
impact – around the world<br />
BOX 1.1 The mILLENNIUm<br />
dEVELOPmENT GOALS<br />
1. The substantial increase in resources dedicated<br />
to health through overseas development assistance<br />
and other sources during the past years has begun<br />
to change the trajectory of AIDS, tuberculosis (TB)<br />
and malaria, and more broadly, of the major health<br />
problems that low- and middle-income countries have<br />
been confronted with. The results and emerging signs<br />
of impact presented in this report paint a hopeful and<br />
encouraging picture.<br />
GOAL 1<br />
GOAL 2<br />
GOAL 3<br />
GOAL 4<br />
GOAL 5<br />
GOAL 6<br />
Eradicate extreme poverty and hunger<br />
Achieve universal primary education<br />
Promote gender equality and empower women<br />
Reduce child mortality<br />
Improve maternal health<br />
Combat HIV/AIDS, malaria and other diseases<br />
2. Ten years ago, virtually no one living with AIDS<br />
in low- and middle-income countries was receiving<br />
lifesaving antiretroviral therapy (ART), although it<br />
had been available since 1996 in high-income countries.<br />
At the end of 2008, over 4 million people had<br />
gained access to AIDS treatment, representing over<br />
40 percent of those in need. AIDS mortality has since<br />
decreased in many high-burden countries. For example,<br />
in Ethiopia’s capital, Addis Ababa, the rollout of<br />
ART has led to a decline of about 50 percent in adult<br />
AIDS deaths over a period of five years.<br />
3. Malaria used to be a neglected disease. Today, at<br />
least ten of the most endemic countries in Africa have<br />
reported declines in new malaria cases and an impressive<br />
decline in child mortality of 50 to 80 percent.<br />
4. Prevalence of TB was 220 per 100,000 in 2000.<br />
Today, the world is on track to meet the international<br />
target of halving TB prevalence by 2015. TB is being<br />
diagnosed much more effectively and 6 million additional<br />
people have gained access to DOTS (the basic<br />
package that underpins the Stop TB strategy) with the<br />
support of the <strong>Global</strong> <strong>Fund</strong>.<br />
5. Much more remains to be done, but significant<br />
reductions in mortality and suffering, as well as in<br />
the economic and social toll these pandemics have<br />
inflicted on families and societies, have been achieved.<br />
6. The world has an extraordinary opportunity<br />
to come close, reach or even exceed the health- related<br />
Millennium Development Goals (MDGs) – the eight<br />
goals that every United Nations member state agreed<br />
to pursue in 2000 (see Box 1.1). Many of the international<br />
targets with regard to MDG 6 (Combat HIV/<br />
AIDS and malaria and other diseases) could be<br />
met, significant progress could be made on MDGs<br />
4 and 5 (reducing child mortality and improving<br />
maternal health), and the other MDGs could also be<br />
positively impacted.<br />
GOAL 7 Ensure environmental sustainability<br />
GOAL 8 Develop a global partnership for development<br />
Source: Reference 1.<br />
7. If the momentum of the last decade is maintained<br />
and countries continue to scale up programs at the<br />
current rate, malaria could be eliminated as a public<br />
health problem in most endemic countries and<br />
indeed there would be hope for a world without malaria<br />
deaths by 2015. Millions more HIV infections may<br />
be prevented and lives otherwise lost to AIDS saved.<br />
The growing threat of multidrug-resistant TB<br />
(MDR-TB) may be contained. And it might be possible<br />
to virtually eliminate transmission of HIV from<br />
mothers to their children. In the process, health systems<br />
would be further strengthened so they can<br />
take on the many other health-related challenges lowand<br />
middle-income countries face.<br />
8. It is rare in the field of international development<br />
to see such rapid correlation between investment<br />
and desired results and impact as has been the case<br />
in the past years’ efforts to fight the three pandemics.<br />
Increased international investments have, with great<br />
speed and efficiency, been turned into health services<br />
on the ground, benefitting hundreds of millions of<br />
people. Despite a lack of facilities, hundreds of thousands<br />
of health workers around the world have used<br />
new resources to save millions of lives.<br />
9. The efforts to provide ART for HIV or effective<br />
treatment for TB and malaria to people in poor and<br />
often inaccessible areas, to provide insecticide-treated<br />
nets (ITNs) to millions of families and to undertake<br />
other efforts to prevent the spread of the three diseases<br />
are significant far beyond the health benefits they<br />
provide. They have been uniting the world around<br />
a common agenda and humanitarian purpose.
A GRANDMOTHER PLAYS WITH HER GRANDSON. SHE HAS BEEN LOOkING AFTER HIM<br />
SINCE HER DAUGHTER MOVED ABROAD TO FIND WORk. In MOLDOVA THE GLOBAL FUND<br />
SUPPORTS TB PREVENTION FOR MOBILE POPULATIONS.<br />
9 THE GLOBAL FUND <strong>2010</strong>: INNOVATION AND IMPACT intrODuctiON
The <strong>Global</strong> <strong>Fund</strong> and its results<br />
and impact<br />
10. The <strong>Global</strong> <strong>Fund</strong> to Fight AIDS, Tuberculosis<br />
and Malaria was established in 2002 to strengthen the<br />
global response to the three major pandemics and<br />
to accelerate progress toward the achievement by 2015<br />
of the health-related MDGs. The <strong>Global</strong> <strong>Fund</strong> is an<br />
independent international financing institution which<br />
raises and disburses resources on a large scale to<br />
countries in need of funding to fight the three diseases<br />
and to strengthen health systems.<br />
11. At its creation, the <strong>Global</strong> <strong>Fund</strong> was designed<br />
drawing on lessons from previous experiences in<br />
development assistance and recent models in international<br />
collaboration. It provides financing based on<br />
high-quality demand and relies on national planning<br />
and priorities to ensure that its funding reaches<br />
those who need it and is invested in the right interventions<br />
to achieve impact against the three diseases.<br />
12. One of the key principles that guide all of its work<br />
(see Box 1.2) is the principle of “performance-based<br />
funding”. From its application process to the decisions<br />
to disburse money and continue funding at key milestones<br />
of each grant, the measurement and assess ment<br />
of results remains the sole deciding factor.<br />
13. Chapter 2, “Results and <strong>Progress</strong> on International<br />
Targets”, summarizes the results of programs supported<br />
by the <strong>Global</strong> <strong>Fund</strong>, globally and in the regions<br />
in which it funds programs, and highlights the challenges<br />
that remain. The chapter – like the report in<br />
general – summarizes the results achieved by December<br />
2009, drawing on analysis that uses the <strong>Global</strong> <strong>Fund</strong>’s<br />
evaluation framework on operational and grant<br />
performance, system effects and evidence of impact.<br />
Chapter 2 also addresses the extent to which the<br />
<strong>Global</strong> <strong>Fund</strong> contributes to the international effort to<br />
respond to HIV, TB and malaria, showing that soon<br />
after its founding, the <strong>Global</strong> <strong>Fund</strong> became the world’s<br />
leading multilateral investor in HIV, TB and malaria<br />
efforts. It now provides 63 percent of all external financing<br />
for TB, 57 percent of external funding for malaria,<br />
and about one-fifth of all HIV funding from donor<br />
countries. The chapter then discusses how <strong>Global</strong> <strong>Fund</strong><br />
investments to combat HIV, TB and malaria have wider<br />
impact by strengthening health systems and contributing<br />
directly to MDGs 4, 5, 6 and 8, and indirectly to<br />
the other MDGs; it examines some of the results of the<br />
<strong>Global</strong> <strong>Fund</strong>’s performance-based funding model;<br />
and it describes a variety of approaches the <strong>Global</strong> <strong>Fund</strong><br />
employs to achieve greater equity in access to<br />
health services, and to improve health outcomes where<br />
inequities persist.<br />
14. The <strong>Global</strong> <strong>Fund</strong> closely tracks the results flowing<br />
from its direct investments in 144 countries – but<br />
also the results and signs of impact of the national programs<br />
it supports. The results and impact presented<br />
in Chapter 2 of the report do not in any way claim to<br />
represent a full picture of progress in health over<br />
the past few years. However, they demonstrate the<br />
changes and improvements global health investments<br />
are achieving.<br />
15. The <strong>Global</strong> <strong>Fund</strong> is a partnership in the fullest<br />
sense. Its success relies on the financial pledges of<br />
donors, the technical guidance of – and collaboration<br />
with – multilateral partners, and particularly the<br />
management and implementation of programs by<br />
in-country partners including governments, civil<br />
society organizations and the private sector. Whenever<br />
“the <strong>Global</strong> <strong>Fund</strong>” is mentioned in this report, this<br />
should therefore be read as including the collective<br />
efforts of all partners who together provide resources<br />
and turn them into services on the ground. All partners<br />
should take full credit for their role in making these<br />
services possible.<br />
16. Chapter 3, “Improving Effectiveness” shows how<br />
the scale and nature of its work as a global financial<br />
institution have enabled the <strong>Global</strong> <strong>Fund</strong> to position<br />
itself as a key partner of other agencies working<br />
towards effective investment in health and development.<br />
The <strong>Global</strong> <strong>Fund</strong> is a signatory of the Paris<br />
Declaration on Aid Effectiveness, and works in close<br />
collaboration with countries and partner agencies<br />
to promote the Declaration’s principles of ownership,<br />
harmonization, alignment, managing for results and<br />
mutual accountability. The chapter describes a number<br />
of initiatives taken by the <strong>Global</strong> <strong>Fund</strong> in 2009 to<br />
improve aid effectiveness and to increase value for<br />
money at every stage of the financing chain, including<br />
by instituting systems to increase value for money by<br />
cost- benefit analyses of the <strong>Global</strong> <strong>Fund</strong>’s investments<br />
in key interventions.<br />
17. Chapter 4, “Learning and Innovating”, shows how<br />
the <strong>Global</strong> <strong>Fund</strong>, taking advantage of the rich experiences<br />
and lessons learned through its investments in<br />
every part of the world, constantly learns, evolves,<br />
undertakes new initiatives and innovates, ensuring that<br />
it can respond quickly to demand and to the changing<br />
health and development challenges. The chapter summarizes<br />
how the <strong>Global</strong> <strong>Fund</strong> is responding to the<br />
results of the Five-Year Evaluation that were reported<br />
to the <strong>Global</strong> <strong>Fund</strong>’s Board in 2009. It then describes<br />
some of the initiatives and innovations the <strong>Global</strong> <strong>Fund</strong><br />
has undertaken since it was established, with a focus<br />
on initiatives that started or were approved in 2009,<br />
including the move to a new grant architecture that<br />
will establish a single stream of funding per Principal<br />
Recipient per disease.
The way forward<br />
18. Chapter 5, “Conclusions”, highlights that the<br />
results and impact described in this report should be<br />
cause for optimism – but points out that the progress<br />
made in the last years is fragile. A reduction – or even<br />
stagnation – of efforts would lead to reversals of<br />
recent progress. Continued, increased investments in<br />
health generally and in HIV, TB and malaria specifically<br />
are more important now, at a time of economic and<br />
financial crisis, than ever. The financial crisis has hit<br />
low- and middle-income countries disproportionately,<br />
and they struggle to maintain their investments in<br />
health. Continued investments are needed not only<br />
to reach or exceed the health-related MDGs, but will<br />
also help to preserve global stability and protect countries<br />
and communities at risk of disease.<br />
19. This report should inspire hope, but first and foremost<br />
it should inspire every sector of society – public<br />
and private – and every individual to make a commitment<br />
to continue scaling up the response to HIV, TB<br />
and malaria, to safeguard and continue building upon<br />
the substantial achievements already made.<br />
BOX 1.2<br />
The GLOBAL FUNd PrINCIPLES<br />
THE GLOBAL FUND TO FIGHT AIDS, TUBERCULOSIS AND MALARIA<br />
WAS FOUNDED ON A SET OF PRINCIPLES THAT GUIDES ALL OF ITS<br />
WORK, FROM GOVERNANCE TO GRANT-MAKING:<br />
• Operate as a financial instrument, not as an implementing entity.<br />
• Make available and leverage additional financial resources.<br />
• Support programs that evolve from national plans and priorities.<br />
• Operate in a balanced manner in terms of different regions,<br />
diseases and interventions.<br />
• Pursue an integrated and balanced approach to prevention<br />
and treatment.<br />
• Evaluate proposals through independent review processes.<br />
• Operate with transparency and accountability.<br />
Source: Reference 2.<br />
11 THE GLOBAL FUND <strong>2010</strong>: INNOVATION AND IMPACT intrODuctiON<br />
A MALARIA OUTREACH WORkER REMINDS PEOPLE TO SLEEP UNDER AN INSECTICIDE-<br />
TREATED NET AND TO SEEk MEDICAL ASSISTANCE IF THEY HAVE a FEVER. SHE WORks<br />
WITH COTTON PICkERS IN a RURAL AREA OF TAJIkISTAN WHERE MALARIA WAS ONCE<br />
ENDEMIC BUT IS CLOSE TO BEING ELIMINATED.
DISEASE PREYS ON PEOPLE LIVING ON POOR DIETS IN CRAMPED CONDITIONS AND<br />
IN PERU THE GLOBAL FUND PROVIDES LOANS FOR INCOME-GENERATING PROJECTS.<br />
THE SMALL INCOME ENCOURAGES ADHERENCE TO TREATMENT AND ALLOWS PATIENTS<br />
TO IMPROVE THE WAY THEY EAT SO THAT THEY RECOVER FASTER.
2. rESULTS AND<br />
PROGRESS ON<br />
INTERNATIONAL<br />
TARGETS<br />
“Before, we used to say this many people died<br />
of malaria. Now we say, this many people got<br />
sick from malaria but received treatment and<br />
got better.”<br />
13 THE GLOBAL FUND <strong>2010</strong>: INNOVATION AND IMPACT INtrODuctiON<br />
— SEGUNDO TESTA RUIZ<br />
VOLUNTEER HEALTH WORKER<br />
PERU
BOX 2.1 hOw credIBLE IS GLOBAL<br />
FUNd grANT dATA<br />
The <strong>Global</strong> <strong>Fund</strong>’s performance-based funding decisions are based on<br />
a transparent assessment of programmatic data against timebound targets.<br />
The assessment relies on a country’s M&E capacity and data reporting, which<br />
Local <strong>Fund</strong> Agents regularly verify. The <strong>Global</strong> <strong>Fund</strong> encourages programs<br />
to spend 5 to 10 percent of their funding on M&E, health information<br />
systems and analytical capacities.<br />
To ensure quality data, a number of initiatives have been developed<br />
to assess grant M&E systems and data quality, including:<br />
• Periodic, systematic assessment of national M&E systems. The results<br />
of the assessment should enhance the national M&E system.<br />
• On-site data verifications, required for every grant at least once a year.<br />
The objective is to assess the quality of programmatic data submitted<br />
to the <strong>Global</strong> <strong>Fund</strong> Secretariat.<br />
• Data quality audits, conducted on selected grants annually. The data<br />
quality audit tool assesses the ability of M&E systems to collect and<br />
report quality data and verifies the accuracy and reporting performance<br />
for key indicators.<br />
• Data harmonization exercises with international partners (such as the<br />
World Health Organization (WHO), the Joint United Nations Programme<br />
on HIV/AIDS (UNAIDS), the United Nations Children’s <strong>Fund</strong> (UNICEF),<br />
and PEPFAR.<br />
According to the analysis of 90 on-site data verification reports, data quality<br />
was strong in 52 percent of grants (47), average in 31 percent of grants<br />
(28), and poor in 17 percent of grants (15).<br />
Working with partners, the <strong>Global</strong> <strong>Fund</strong> is currently developing an overall<br />
strategy for data quality and information use. The strategy calls for identifying<br />
existing and potential data quality issues as well as the root causes<br />
of these issues. It will also provide strategic direction on a number of issues,<br />
including data quality improvement approaches.<br />
Information systems are further scrutinized during the investigations of<br />
the Office of the Inspector General, which operates independently of the<br />
<strong>Global</strong> <strong>Fund</strong> Secretariat and reports directly to the Board. The mission of<br />
the Inspector General is to provide the <strong>Global</strong> <strong>Fund</strong> with independent and<br />
objective assurance of the design and effectiveness of controls in place to<br />
manage key risks, such as data quality, impacting programs and operations.<br />
FIGURE 2.1 GLOBAL FUND-SUPPORTED PROGRAMS,<br />
(2004–2009): CUMULATIVE YEAR-END RESULTS FOR THE<br />
TOP THREE INDICATORS FOR HIV, TB AND MALARIA<br />
(THE NUMBER OF PEOPLE CURRENTLY ON ART, UNDER DOTS AND<br />
NUMBER OF ITNs DISTRIBUTED)<br />
current ART AND CUMULATIVE DOTS UPTAKE (MILLIONS)<br />
7<br />
6<br />
5<br />
4<br />
3<br />
2<br />
1<br />
0<br />
DOTS<br />
ITNs<br />
ART<br />
2004 2005 2006 2007 2008 2009<br />
YEAR<br />
105<br />
100<br />
95<br />
90<br />
85<br />
80<br />
75<br />
70<br />
65<br />
60<br />
55<br />
50<br />
45<br />
40<br />
35<br />
30<br />
25<br />
20<br />
15<br />
10<br />
5<br />
0<br />
CUMULATIVE ITNs DISTRIBUTED (MILLIONS)<br />
Note: Results reported in a year do not necessarily correspond to actual services provided<br />
during that year, since grant reporting cycles do not always follow calendar years.<br />
<strong>Global</strong> <strong>Fund</strong> results may include service and commodity deliverables co-financed by others.<br />
Source: <strong>Global</strong> <strong>Fund</strong>, grant data, 2009 www.theglobalfund.org.<br />
104m<br />
6m<br />
2.5m<br />
TABLE 2.1 GLOBAL FUND-SUPPORTED PROGRAM INTERVENTIONS FOR 2009 AND WORLD TOTALS FOR 2008<br />
PEOPLE ON ART<br />
NEW SMEAR-POSITIVE<br />
TB CASES DETECTED<br />
GLOBAL FUND RESULTS, 2009 2.5 MILLION (CURRENTLY ON THERAPY) 6 MILLION (CUMULATIVE)<br />
1.4 MILLION (REPORTED IN 2009)<br />
ITNs DISTRIBUTED<br />
104 MILLION (CUMULATIVE, ALL REGIONS)<br />
22.5 MILLION (REPORTED IN 2009,<br />
SUB-SAHARAN AFRICA)<br />
TOTAL, 2008 4.03 MILLION (1) 2.7 MILLION (3) 38.1 MILLION (2) (SUB-SAHARAN AFRICA)<br />
COVERAGE, 2008 42% (1) 61% (3) 35% (2) (SUB-SAHARAN AFRICA)<br />
Note: New smear-positive TB cases (reported in 2009) and ITNs (reported in 2009) are the difference between the cumulative results reported as of the end of 2008 and 2009, and do not<br />
necessarily correspond to actual services provided during 2009, since grant reporting cycles do not always follow calendar years. <strong>Global</strong> <strong>Fund</strong> results may include service and commodity<br />
deliverables that are co-financed by others.<br />
The latest results and coverage estimates for low- and middle-income countries are for 2008. The total for 2008 includes both <strong>Global</strong> <strong>Fund</strong> and non-<strong>Global</strong> <strong>Fund</strong> results. “Coverage” is the<br />
total in low- and middle-income countries against the estimated need in those countries.
1. The <strong>Global</strong> <strong>Fund</strong> financed its first four grants at<br />
the end of 2002. Since then, millions of people have<br />
begun ART for HIV, and millions have been treated in<br />
DOTS programs for TB or protected against malaria<br />
with ITNs as a result of programs funded by the <strong>Global</strong><br />
<strong>Fund</strong>. The impact of the initial investments is becoming<br />
increasingly visible. It includes substantial<br />
reductions in the global disease burden of HIV, TB<br />
and malaria, improved health system capacity in<br />
low- and middle-income countries, and progress<br />
toward international health and disease targets –<br />
most notably the MDGs. The coming years will see<br />
even more positive results and greater impact, given<br />
the recent intensification of efforts: large amounts<br />
of fund ing were approved in Rounds 8 and 9 and<br />
will start reaching countries in <strong>2010</strong> and 2011, further<br />
enhancing the achievements made to date.<br />
2. The results and impact outlined in this chapter<br />
are the achievements of all the partners that collaborate<br />
as part of the <strong>Global</strong> <strong>Fund</strong> model. The success<br />
of the <strong>Global</strong> <strong>Fund</strong> relies on the financial contributions<br />
of donors, the technical guidance of – and collaboration<br />
with – multilateral partners, and particularly the<br />
management and implementation of programs by<br />
in-country partners including governments, civil society<br />
organizations and the private sector.<br />
3. The first sections (2.1 and 2.2) of this chapter present<br />
the results from <strong>Global</strong> <strong>Fund</strong>-supported programs<br />
globally and in the various regions of the world.<br />
Section 2.3 provides more details about the <strong>Global</strong><br />
<strong>Fund</strong>’s contribution to international efforts to finance<br />
disease control and about how the funds raised are<br />
spent. Section 2.4 reviews the contribution of <strong>Global</strong><br />
<strong>Fund</strong> investments to progress on the MDGs and other<br />
international targets. Section 2.5 then assesses the<br />
impact of the <strong>Global</strong> <strong>Fund</strong>’s performance-based funding<br />
model. Section 2.6 examines how effective programs<br />
have been in promoting equity in access to health<br />
services and in health outcomes and Section 2.7 sets<br />
out some of the many challenges ahead.<br />
2.1 Key global<br />
rESULTS OF GLOBAL<br />
<strong>Fund</strong>-supported<br />
programs<br />
4. The <strong>Global</strong> <strong>Fund</strong> disbursed a cumulative total<br />
of US$ 5.7 billion for HIV programs, US$ 1.5 billion for<br />
TB programs and US$ 2.8 billion for malaria programs<br />
by the end of 2009. These resources, together with<br />
those provided by key partners such as the U.S.<br />
President’s Emergency Plan for AIDS Relief (PEPFAR)<br />
and other donors, have made a major contribution to<br />
efforts to achieve universal access to prevention, treatment<br />
and care services in the coming years. The year<br />
2009 saw continued impressive increases in service<br />
delivery (Figure 2.1) as well as an increased contribution<br />
of <strong>Global</strong> <strong>Fund</strong>-supported programs towards<br />
inter national targets for HIV, TB and malaria (Table 2.1<br />
and Figure 2.5).<br />
5. Following the approval of Round 9 proposals in<br />
November 2009, nearly all countries eligible for funding<br />
under the <strong>Global</strong> <strong>Fund</strong>’s eligibility criteria had at<br />
least one proposal approved.<br />
6. At the end of 2009, 2.5 million people in these<br />
programs were receiving ART – an increase of 500,000<br />
from the end of 2008. If results were added from<br />
Algeria, South Africa, Thailand and Ukraine (countries<br />
that are excluded or partially excluded because they<br />
have since assumed financial responsibility for covering<br />
ART), the total number of people receiving ART<br />
through <strong>Global</strong> <strong>Fund</strong>-supported programs would be<br />
2.8 million. A total of 4.03 million people in low- and<br />
middle-income countries were receiving ART funded<br />
by all sources by the end of 2008, representing<br />
42 percent of the estimated 9.5 million people in need<br />
of treatment (1).<br />
7. By the end of 2009, 6 million new smear-positive<br />
TB cases had been detected and put on treatment<br />
through DOTS programs – an increase of more than<br />
1.4 million from December 2008.<br />
15 THE GLOBAL FUND <strong>2010</strong>: INNOVATION AND IMPACT results aND progress ON internatiONal targets<br />
8. Financing from the <strong>Global</strong> <strong>Fund</strong> enabled countries<br />
to distribute 104 million ITNs. In 2009 alone, programs<br />
supported by the <strong>Global</strong> <strong>Fund</strong> distributed 34 million<br />
nets – 48 percent more than the previous year. Of these,<br />
22.5 million nets were distributed in sub-Saharan<br />
Africa, where in 2008 a total of 38.1 million bed nets<br />
had been distributed by all sources (2).
9. Through these three interventions, <strong>Global</strong> <strong>Fund</strong>supported<br />
programs had saved an estimated<br />
4.9 million lives by late 2009. 1 In addition, countless<br />
numbers of lives have been saved and suffering<br />
alleviated or avoided through the rapid scale-up of<br />
a range of other services for HIV, TB and malaria<br />
that <strong>Global</strong> <strong>Fund</strong>-supported programs provide.<br />
10. In line with its operating principles (see Box 1.2),<br />
the <strong>Global</strong> <strong>Fund</strong> supports programs that “pursue an<br />
integrated and balanced approach covering prevention,<br />
treatment, care and support in dealing with the<br />
three diseases”. In addition to the top three indicators<br />
described above, a range of additional indicators are<br />
used to measure the success of <strong>Global</strong> <strong>Fund</strong>-supported<br />
programs. From 2004, when the <strong>Global</strong> <strong>Fund</strong> began<br />
measuring results of the programs it supports, to the<br />
end of 2009, the following results were achieved:<br />
• Prevention of mother-to-child transmission (PMTCT)<br />
of HIV. 790,000 HIV-positive pregnant women<br />
received a complete course of antiretroviral (ARV)<br />
prophylaxis to prevent mother-to-child transmission.<br />
This has helped increase coverage of PMTCT to<br />
45 percent (range: 37–57) (1). In 2009 alone, 340,000<br />
pregnant women in low- and middle-income countries<br />
received PMTCT treatment through <strong>Global</strong> <strong>Fund</strong><br />
grants. This represents a substantial increase over<br />
previous years, and corresponds to more than half of<br />
the total number of 630,000 HIV-positive pregnant<br />
women in these countries who received PMTCT treatment<br />
from all donor-supported programs in 2008 (1).<br />
• Behavior change communication interventions.<br />
More than 138 million outreach activities were undertaken,<br />
such as behavior change communication<br />
interventions targeting at-risk populations for HIV,<br />
TB and malaria. This does not include mass media<br />
messages or printed materials.<br />
• Condom distribution. 1.8 billion male (and female)<br />
condoms were distributed.<br />
• HIV counseling and testing. <strong>Global</strong> <strong>Fund</strong>-supported<br />
programs provided 105 million HIV counseling and<br />
testing sessions in various settings including antenatal<br />
clinics, freestanding centers, youth-friendly<br />
reproductive health clinics, TB wards in hospitals,<br />
and clinics for sexually transmitted infections (STIs).<br />
Since 2007, the number of sessions delivered has more<br />
than tripled from 33.5 million to 105 million in 2009.<br />
• Services for orphans and other vulnerable children.<br />
4.5 million basic care and support services were<br />
provided to orphans and other vulnerable children<br />
through <strong>Global</strong> <strong>Fund</strong>-financed programs – 1.3 million<br />
in 2009 alone.<br />
• TB detection and treatment. 1.8 million HIV/TB<br />
services were provided, including TB screening<br />
among people living with HIV, and treatment for<br />
preventing other infectious diseases. This represents<br />
a 150 percent increase since the end of 2008.<br />
Programs also enrolled nearly 30,000 people on<br />
MDR-TB treatment through the end of 2009, an<br />
increase of 85 percent from the cumulative number<br />
of enrollments to the end of 2008. A recent<br />
increased focus on MDR-TB, including in Round 9<br />
approvals, is likely to further increase treatment<br />
enrollments in the future.<br />
• Malaria treatment and prevention. Malaria<br />
programs supported by the <strong>Global</strong> <strong>Fund</strong> achieved<br />
tremendous progress in 2009. By the end of the<br />
year – in addition to distributing 104 million ITNs –<br />
programs provided indoor residual spraying<br />
of insecticides more than 19 million times and<br />
treated 108 million cases of malaria (an increase<br />
of 43 percent since the end of 2008) according to<br />
national treatment guidelines, increasingly using<br />
highly effective artemisinin- based combination<br />
therapies (ACTs).<br />
• Health and community worker training. The <strong>Global</strong><br />
<strong>Fund</strong> also provided significant support to training<br />
programs aimed at building the skills and capacity<br />
of the health work force to ensure effective<br />
delivery of services for the prevention and treatment<br />
of HIV, TB and malaria. It supported 11.3 million<br />
“person-episodes” of training 2 to health and<br />
community workers – 4.3 million in HIV programs,<br />
4.6 million in TB programs and 2.4 million in<br />
malaria programs. In 2009 alone, 2.7 million “personepisodes”<br />
were supported.<br />
1 For a description of the analyses used to calculate lives saved, see Partners in Impact - Results <strong>Report</strong> 2007, The <strong>Global</strong> <strong>Fund</strong>, www.theglobalfund.org/en/publications/progressreports/.<br />
2 “Person-episodes of training” is a cumulative figure that multiplies the number of persons attending a training program by the number of training programs.
2.2 Key results<br />
by region<br />
“In Zambia the community burden of malaria has<br />
declined... we have seen a reduction in the people<br />
who are coming to seek medication. This has given<br />
us a chance to intensify health promotion services.”<br />
– IGNICIOUS BULONGO<br />
HEALTH OFFICER, MOMBA HEALTH CENTRE<br />
ZAMBIA<br />
11. The <strong>Global</strong> <strong>Fund</strong> is making a major difference<br />
and achieving substantial results in each of the regions<br />
in which it funds programs: sub-Saharan Africa, Asia,<br />
Latin America, the Middle East and North Africa, and<br />
Eastern Europe and Central Asia. This section highlights<br />
some of the results achieved in each of these<br />
regions (Tables 2.2 and 2.3). The results for the <strong>Global</strong><br />
<strong>Fund</strong>’s three sub-Saharan Africa regions (East Africa,<br />
Southern Africa, and West and Central Africa) are presented<br />
together as the sub-Saharan Africa region,<br />
and results for the two Asian regions (South and West<br />
Asia and East Asia and Pacific) are presented together<br />
as the Asia region (for a list of countries in each region,<br />
see Annex 2).<br />
2.2.1 SUB-SaharAN AfrICA<br />
12. The 47 countries in East Africa, Southern Africa,<br />
and West and Central Africa (the sub-Saharan Africa<br />
region) have a total population of 818 million, with<br />
50 percent living on less than US$ 1.25 a day (4). The<br />
<strong>Global</strong> <strong>Fund</strong> has invested in 41 countries and territories<br />
in this region (see Annex 2), and the greatest overall<br />
investment has been in this region – where the greatest<br />
need exists. The <strong>Global</strong> <strong>Fund</strong> is the region’s single<br />
largest multilateral financing mechanism for the<br />
health sector.<br />
13. Between 2002 and December 2009, the Board<br />
of the <strong>Global</strong> <strong>Fund</strong> approved US$ 10.9 billion<br />
for the sub-Saharan Africa region (See Table 2.6).<br />
Of this total, the <strong>Global</strong> <strong>Fund</strong> had disbursed<br />
US$ 5.5 billion by the end of 2009 (See Table 2.4).<br />
In 2009 alone, US$ 1.5 billion was disbursed for<br />
the three diseases (See Table 2.5), a 23 percent<br />
increase over 2008 disbursements.<br />
14. Programs supported by the <strong>Global</strong> <strong>Fund</strong><br />
currently provide 1.9 million people with ART. From<br />
2002 to 2009, the <strong>Global</strong> <strong>Fund</strong>-supported programs<br />
in the region treated 1.4 million people with new smearpositive<br />
cases of TB and distributed 72 million ITNs.<br />
Services are being scaled up rapidly: from 2008 to<br />
2009, the cumulative number of people treated for<br />
MDR-TB, while remaining low, increased by 376 percent,<br />
the cumulative number of TB/HIV services delivered<br />
increased by 199 percent, and the cumulative number<br />
of community outreach prevention services provided<br />
to people in the region increased by 90 percent.<br />
17 THE GLOBAL FUND <strong>2010</strong>: INNOVATION AND IMPACT results aND progress ON internatiONal targets<br />
15. HIV. In the region, HIV has had a tremendously<br />
negative impact on most core health indicators,<br />
including adult and child mortality, life expectancy,<br />
morbidity, outpatient visits and inpatient care. In<br />
many countries, PEPFAR and the <strong>Global</strong> <strong>Fund</strong> contribute<br />
the majority of international HIV funding. In<br />
some countries, such as Malawi, where it accounts for<br />
87 percent of the donor pool for HIV funding, the<br />
<strong>Global</strong> <strong>Fund</strong> finances most of the national ART program.<br />
<strong>Global</strong> <strong>Fund</strong> resources have been central to the<br />
development and implementation of the extensive<br />
treatment and prevention programs needed to<br />
respond to the epidemics in countries such as Congo<br />
(Democratic Republic), Ethiopia, Kenya, Nigeria,<br />
Tanzania and Uganda, and to responses to the epidemics<br />
in the highest-prevalence countries of southern<br />
Africa: Angola, Lesotho, Malawi, Mozambique, Namibia,<br />
Swaziland, Zambia and Zimbabwe. Investments made<br />
have facilitated remarkable national scale-ups over the<br />
last four years.
TABLE 2.2 2009 RESULTS ATTRIBUTABLE TO GLOBAL FUND-SUPPORTED PROGRAMS, BY REGION<br />
REGIONS<br />
SERVICES<br />
ADDITIONAL NUMBER OF PEOPLE ON ART<br />
REPORTED IN 2009<br />
SESSIONS OF HIV COUNSELING<br />
AND TESTING PROVIDED<br />
HIV-POSITIVE PREGNANT WOMEN RECEIVING<br />
ARV PROPHYLAXIS FOR PMTCT<br />
BASIC CARE AND SUPPORT SERVICES PROVIDED<br />
TO ORPHANS AND VULNERABLE CHILDREN<br />
EAST AFRICA,<br />
SOUTHERN<br />
AFRICA, WEST<br />
AND<br />
CENTRAL AFRICA<br />
SOUTH AND<br />
WEST ASIA,<br />
EAST ASIA<br />
AND PACIFIC<br />
LATIN AMERICA<br />
AND<br />
CARIBBEAN<br />
NORTH AFRICA<br />
AND<br />
MIDDLE EAST<br />
EASTERN<br />
EUROPE<br />
AND<br />
CENTRAL ASIA<br />
699,500 151,500 11,400 6000 22,400 890,800<br />
12,350,000 13,190,000 4,620,000 301,000 13,780,000 44,241,000<br />
295,300 32,940 3,100 3,000 10,300 344,640<br />
1,300,000 56,800 9,200 8,100 3,500 1,377,600<br />
TOTAL<br />
CONDOMS DISTRIBUTED 325,600,000 63,900,000 156,100,000 23,900,000 49,800,000 619,300,000<br />
CASES OF STIs TREATED 727,000 215,900 969,000 444,000 56,700 2,412,600<br />
TB/HIV SERVICES PROVIDED 964,900 58,100 13,300 2,800 64,600 1,103,700<br />
NEW SMEAR-POSITIVE TB CASES DETECTED<br />
AND TREATED<br />
269,000 969,000 35,400 57,300 66,200 1,396,900<br />
PEOPLE TREATED FOR MDR-TB 4,590 1,150 1,600 150 6,240 13,730<br />
NETS DISTRIBUTED (ITNs AND LLINs) 22,530,000 6,782,000 235,000 4,460,000 24,000 34,031,000<br />
CASES OF MALARIA TREATED 29,547,000 1,465,000 75,000 2,218,000 340 33,305,340<br />
INDOOR RESIDUAL SPRAYING SERVICES 4,480,000 334,100 14,300 270,000 142,000 5,240,400<br />
COMMUNITY OUTREACH PREVENTION SERVICES<br />
(BEHAVIOR CHANGE COMMUNICATION)<br />
20,910,000 13,560,000 3,920,000 3,540,000 6,060,000 47,990,000<br />
CARE AND SUPPORT SERVICES PROVIDED 1,621,000 115,000 302,000 12,000 102,000 2,152,000<br />
“PERSON-EPISODES” OF TRAINING FOR HEALTH<br />
OR COMMUNITY WORKERS<br />
557,000 2,018,000 82,800 40,300 67,400 2,765,500<br />
Sources: Grant Performance <strong>Report</strong>s www.theglobalfund.org; The incremental results are the differences between 2008 reporting and 2009 reporting; for further information on ARV numbers,<br />
www.theglobalfund.org/documents/publications/factsheets/ARV_Factsheet_2009.pdf.<br />
Note: Figures are rounded. Results reported in a year do not necessarily correspond to actual services provided during that year, since grant reporting cycles do not always follow calendar<br />
years. <strong>Global</strong> <strong>Fund</strong> results may include service and commodity deliverables co-financed by others. “Additional Number of People on ART <strong>Report</strong>ed in 2009” in this table includes results from<br />
countries that have since assumed financial responsibility for covering ART. See also paragraph 6, Section 2.1.
TABLE 2.3 CUMULATIVE RESULTS ATTRIBUTABLE TO GLOBAL FUND-SUPPORTED PROGRAMS, BY REGION (2002–2009)<br />
SERVICES<br />
EAST AFRICA,<br />
SOUTHERN<br />
AFRICA, WEST<br />
AND<br />
CENTRAL AFRICA<br />
SOUTH AND<br />
WEST ASIA,<br />
EAST ASIA<br />
AND PACIFIC<br />
LATIN AMERICA<br />
AND<br />
CARIBBEAN<br />
REGIONS<br />
NORTH AFRICA<br />
AND<br />
MIDDLE EAST<br />
EASTERN<br />
EUROPE<br />
AND<br />
CENTRAL ASIA<br />
PEOPLE CURRENTLY ON ART (2009) 1,930,600 383,300 76,000 35,400 74,800 2,500,100<br />
SESSIONS OF HIV COUNSELING<br />
AND TESTING PROVIDED<br />
HIV-POSITIVE PREGNANT WOMEN RECEIVING<br />
ARV PROPHYLAXIS FOR PMTCT<br />
BASIC CARE AND SUPPORT SERVICES PROVIDED<br />
TO ORPHANS AND VULNERABLE CHILDREN<br />
40,284,000 29,100,000 10,000,000 629,000 25,700,000 105,713,000<br />
674,100 65,660 15,000 6,900 28,500 790,160<br />
4,230,000 248,700 13,800 37,400 20,400 4,550,300<br />
CONDOMS DISTRIBUTED 1,057,200,000 238,940,000 356,600,000 62,050,000 125,000,000 1,839,790,000<br />
CASES OF STIs TREATED 1,680,000 1,297,000 2,430,000 1,216,000 177,000 6,800,000<br />
TB/HIV SERVICES PROVIDED 1,450,000 218,400 29,100 3,900 132,400 1,833,800<br />
NEW SMEAR-POSITIVE TB CASES DETECTED<br />
AND TREATED<br />
1,401,000 4,061,000 152,000 178,000 201,000 5,993,000<br />
PEOPLE TREATED FOR MDR-TB 5,800 3,100 10,700 300 9,900 29,800<br />
NETS DISTRIBUTED (ITNs AND LLINs) 72,465,000 21,745,000 1,200,000 8,789,000 139,000 104,338,000<br />
TOTAL<br />
19 THE GLOBAL FUND <strong>2010</strong>: INNOVATION AND IMPACT results aND progress ON internatiONal targets<br />
CASES OF MALARIA TREATED 90,000,000 8,460,000 344,000 9,030,000 9,300 107,843,300<br />
INDOOR RESIDUAL SPRAYING SERVICES 17,180,000 1,086,000 122,000 567,000 432,000 19,387,000<br />
COMMUNITY OUTREACH PREVENTION SERVICES<br />
(BEHAVIOR CHANGE COMMUNICATION)<br />
44,000,000 46,200,000 21,100,000 9,300,000 18,200,000 138,800,000<br />
CARE AND SUPPORT SERVICES PROVIDED 5,030,000 1,446,700 963,000 55,600 389,100 7,884,400<br />
“PERSON-EPISODES” OF TRAINING FOR HEALTH<br />
OR COMMUNITY WORKERS<br />
3,234,000 6,501,000 1,130,000 162,400 320,500 11,347,900<br />
Sources: Grant Performance <strong>Report</strong>s www.theglobalfund.org; for further information on ARV numbers, www.theglobalfund.org/documents/publications/factsheets/ARV_Factsheet_2009.pdf.<br />
Note: Figures are rounded. Results reported in a year do not necessarily correspond to actual services provided during that year, since grant reporting cycles do not always follow calendar<br />
years. <strong>Global</strong> <strong>Fund</strong> results may include service and commodity deliverables co-financed by others.
TABLE 2.4 CUMULATIVE GLOBAL FUND DISBURSEMENTS BY REGION AND DISEASE (2002–2009)<br />
DISBURSEMENT TO DATE (END 2009)<br />
HIV<br />
(IN US$ MILLIONS)<br />
TB<br />
(IN US$ MILLIONS)<br />
MALARIA<br />
(IN US$ MILLIONS)<br />
TOTAL DISBURSEMENT<br />
BY REGION<br />
SUB-SAHARAN AFRICA 3,104 375 1,976 5,455<br />
ASIA 1,093 582 491 2,166<br />
LATIN AMERICA AND CARIBBEAN 603 129 90 822<br />
MIDDLE EAST AND NORTH AFRICA 258 120 214 592<br />
EASTERN EUROPE AND CENTRAL ASIA 669 245 20 934<br />
TOTAL 5,727 1,451 2,791 9,969<br />
Source: The <strong>Global</strong> <strong>Fund</strong>. www.theglobalfund.org.<br />
TABLE 2.5 2009 GLOBAL FUND DISBURSEMENTS BY REGION AND DISEASE<br />
DISBURSEMENT IN 2009<br />
HIV<br />
(IN US$ MILLIONS)<br />
TB<br />
(IN US$ MILLIONS)<br />
MALARIA<br />
(IN US$ MILLIONS)<br />
TOTAL DISBURSEMENT<br />
BY REGION<br />
SUB-SAHARAN AFRICA 663 71 775 1,509<br />
ASIA 346 183 155 684<br />
LATIN AMERICA AND CARIBBEAN 136 26 23 185<br />
MIDDLE EAST AND NORTH AFRICA 70 35 57 162<br />
EASTERN EUROPE AND CENTRAL ASIA 136 72 7 215<br />
TOTAL 1,351 387 1,017 2,755<br />
Source: The <strong>Global</strong> <strong>Fund</strong>. www.theglobalfund.org.<br />
TABLE 2.6 APPROVED FUNDING AND DISBURSEMENT BY ROUND AND DISEASE (AS OF DECEMBER 2009)<br />
APPROVED FUNDING<br />
(IN US$ MILLION)<br />
DISBURSEMENT TOTAL<br />
(IN US$ MILLION)<br />
PERCENTAGE DISBURSED VS.<br />
PLANNED (IN 2009) 1<br />
ROUND 1 1,695 1,374 97%<br />
ROUND 2 2,794 1,724 74%<br />
ROUND 3 1,708 1,328 112%<br />
ROUND 4 3,238 2,174 76%<br />
ROUND 5 1,711 1,120 119%<br />
ROUND 6 1,604 827 93%<br />
ROUND 7 1,111 607 75%<br />
ROUND 8 2,742 815 113%<br />
ROUND 9 2 2,630 – –<br />
HIV 10,778 5,727 84%<br />
TB 3,160 1,451 90%<br />
MALARIA 5,295 2,791 116%<br />
TOTAL 19,233 9,969 95%<br />
Source: The <strong>Global</strong> <strong>Fund</strong>. www.theglobalfund.org.<br />
Notes: 1 Numerators and denominators are not shown in the table; 2 Includes National Strategy Applications (see Section 4.4)
16. TB. The <strong>Global</strong> <strong>Fund</strong> has quickly become the<br />
largest international donor of TB programs in the<br />
region. From 2008 to 2009, approved funding for<br />
TB increased substantially, reflecting an increased<br />
demand by countries for assistance in controlling TB.<br />
The <strong>Global</strong> <strong>Fund</strong> has also played a key role in the<br />
donor community by highlighting the emerging epidemics<br />
of TB/HIV co-infection and MDR-TB, and<br />
the TB funding gap.<br />
17. Malaria. <strong>Global</strong> <strong>Fund</strong> grants account for<br />
60 percent of all international funding for malaria<br />
in sub-Saharan Africa. In the last seven years, these<br />
grants enabled the provision of 72 million long-lasting<br />
insecticide-treated nets (LLINs) and 90 million courses<br />
of malaria treatment in the region. In collaboration with<br />
partner agencies, the <strong>Global</strong> <strong>Fund</strong> is now helping fund<br />
the largest distribution campaign for long-lasting nets<br />
in the history of malaria control. The goal is to achieve<br />
the WHO-recommended target of 80 percent coverage<br />
for ITNs by the end of <strong>2010</strong>. The effort is concentrated<br />
in Nigeria and Congo (Democratic Republic), which<br />
together bear 36 percent of the malaria burden in Africa.<br />
The <strong>Global</strong> <strong>Fund</strong> has signed grant agreements with<br />
Nigeria that will enable the distribution of 30 million<br />
nets by the end of <strong>2010</strong>. In Congo (Democratic<br />
Republic), in a challenging environment, the <strong>Global</strong><br />
<strong>Fund</strong> is financing the distribution of 9.4 million nets<br />
in the same time period.<br />
18. Health systems strengthening. As <strong>Global</strong> <strong>Fund</strong><br />
financing in Africa – and the need for it – has grown<br />
dramatically over the last years, many countries have<br />
requested increased funding to strengthen their<br />
health systems. Following the approval of health system<br />
strengthening grants for Ethiopia, Malawi, Rwanda<br />
and Swaziland in earlier rounds, the <strong>Global</strong> <strong>Fund</strong> has<br />
more recently signed such health system strengthening<br />
grants with Lesotho, Mozambique, Nigeria and<br />
Zimbabwe in Round 8. These grants not only enhance<br />
national responses to the three diseases, but also<br />
address systemic weaknesses in health worker training<br />
and retention, laboratory services, M&E and procurement<br />
systems, as well as addressing critical needs for<br />
capital infrastructure.<br />
2.2.2 ASIA<br />
19. The <strong>Global</strong> <strong>Fund</strong>’s East Asia and Pacific region<br />
consists of 24 countries (see Annex 2) with a total population<br />
of 1.9 billion, of which 18 percent live on less<br />
than US$ 1.25 a day; while the <strong>Global</strong> <strong>Fund</strong>’s South<br />
and West Asia region consists of nine countries<br />
(see Annex 2) with a total population of 1.4 billion, of<br />
which 40 percent live on less than US$ 1.25 a day (4). 3<br />
Results for the two regions are presented together here.<br />
20. Some of the countries in Asia have experienced<br />
the world’s fastest-growing economic advances in<br />
recent times but many countries are still very poor.<br />
Regional investment in health as a percentage of<br />
gross domestic product is lower for Asia than for any<br />
other region in the world. <strong>Global</strong> <strong>Fund</strong> investments<br />
provide the economic backbone of public health efforts<br />
to address HIV, TB and malaria, three of the most<br />
prevalent communicable diseases in the adult population.<br />
Between 2002 and December 2009, the total<br />
budget of approved proposals in the 33 countries of<br />
the East Asia and Pacific and South and West Asia<br />
regions amounted to US$ 4.5 billion. Of this amount,<br />
US$ 2.2 billion has been disbursed.<br />
21. HIV. <strong>Global</strong> <strong>Fund</strong>-supported programs are providing<br />
treatment to two-thirds of the 570,000 people<br />
on ART in the East Asia and Pacific and South and<br />
West Asia regions. In some countries, the <strong>Global</strong> <strong>Fund</strong><br />
finances nearly all HIV treatment services. Coverage<br />
remains low, however, with nearly 1 million additional<br />
people estimated to require ART (1).<br />
22. HIV prevention efforts undertaken in recent years<br />
have had a greater focus on the people most vulnerable<br />
to infection in the region: sex workers, men who have<br />
sex with men, and people who inject drugs. Overall, the<br />
coverage of prevention services remains low, but the<br />
<strong>Global</strong> <strong>Fund</strong> is providing increased funding for prevention<br />
efforts. For example, it has become the single<br />
largest supporter of efforts targeting sex workers in<br />
countries in Asia, with the exception of India. In Lao<br />
(People’s Democratic Republic), one program targeting<br />
sex workers has achieved a coverage level of<br />
80 percent. The <strong>Global</strong> <strong>Fund</strong> also supports a large number<br />
of the harm reduction services for people who<br />
inject drugs. In China and the Philippines, among other<br />
countries, large numbers of men who have sex with<br />
men are being reached by prevention services financed<br />
by the <strong>Global</strong> <strong>Fund</strong>. Coverage of services for men<br />
who have sex with men will increase in the coming years,<br />
thanks to a regional proposal for prevention efforts<br />
among men who have sex with men that was approved<br />
in 2009 and will cover South and West Asian countries.<br />
21 THE GLOBAL FUND <strong>2010</strong>: INNOVATION AND IMPACT results aND progress ON internatiONal targets<br />
3 The 33 countries included in this region are classified by the World Bank into two regions (East Asia and the Pacific and South Asia); however, the World Bank regions are not identical to the<br />
<strong>Global</strong> <strong>Fund</strong> regions of the same names.
2.2.3 LATIN AmerICA ANd CarIBBEAN<br />
23. TB. The Asia region accounts for 11 of the 22 countries<br />
with a high TB burden worldwide, with India,<br />
China and Indonesia reporting the highest number of<br />
new smear-positive TB cases. Ten of these 11 countries<br />
have made good progress toward achieving the Stop<br />
TB Partnership targets for case detection. The region<br />
has seen significant progress in achieving the MDG 6<br />
target of halting and reversing the TB epidemic.<br />
26. The Latin America and Caribbean region consists<br />
of 33 countries with a total population of 559 million.<br />
Approximately 25 percent of the population lives on<br />
less than US$ 2 a day (5). Between 2002 and December<br />
2009, the <strong>Global</strong> <strong>Fund</strong> approved proposals in all<br />
33 countries (see Annex 2), with a total budget of<br />
US$ 1.4 billion, of which US$ 822 million had been disbursed<br />
by the end of 2009.<br />
24. Since the first <strong>Global</strong> <strong>Fund</strong> grants were awarded<br />
in the region, steep increases in TB case detection and<br />
cure rates have been observed. <strong>Global</strong> <strong>Fund</strong>-supported<br />
programs have treated a cumulative total of 4 million<br />
smear-positive TB cases.<br />
25. Malaria. Between 2003 and the end of 2009,<br />
<strong>Global</strong> <strong>Fund</strong>-supported programs distributed 21.7 million<br />
ITNs in the region – an increase of 45 percent over<br />
the number distributed by the end of 2008. As a result<br />
of this and other interventions, the incidence of both<br />
probable and confirmed cases of malaria declined<br />
sharply, with substantial declines in malaria morbidity<br />
and mortality (see section 2.4.4 for more details on<br />
one country: Bhutan).<br />
27. HIV. Latin America and Caribbean is the region<br />
with the highest HIV treatment coverage, thanks in<br />
large part to Brazil, which has been providing ART to<br />
people in need for many years. As of December<br />
2008, 445,000 (54 percent) of the 820,000 people<br />
in the region estimated to need ART were receiving<br />
it (1). <strong>Global</strong> <strong>Fund</strong> investments are helping countries<br />
in the region to provide ART to 76,000 people.<br />
28. The <strong>Global</strong> <strong>Fund</strong> has also fostered close<br />
collaboration between governments and civil society<br />
organi zations, especially those working with mostat-risk<br />
populations. Sixty-one percent of the total<br />
committed amount of funds in this region has been<br />
allocated to grants in which the Principal Recipients<br />
were civil society organizations.<br />
29. TB is a major public health threat in many Latin<br />
American and Caribbean countries. Thanks to programs<br />
supported by the <strong>Global</strong> <strong>Fund</strong>, 152,000 people<br />
in the region have been treated for TB. Peru has the<br />
largest TB program in the region, with one of the<br />
world’s greatest number of clients requiring MDR-TB<br />
and second-line treatment. By December 2009, the<br />
<strong>Global</strong> <strong>Fund</strong> had supported treatment of more than<br />
10,000 people for MDR-TB.<br />
30. In Bolivia, which has the third-highest incidence<br />
rate of TB in the region, about 70 percent of the<br />
Bolivian farmers whose mother tongue is not Spanish<br />
live in extreme poverty, which makes them especially<br />
vulnerable to TB. Their socioeconomic status, coupled<br />
with cultural and language barriers, often hinders<br />
their access to health services. The <strong>Global</strong> <strong>Fund</strong> TB<br />
grant in Bolivia targets indigenous peoples and,<br />
by the end of 2009, treatment had been provided to<br />
3,500 people newly detected as smear-positive for TB.<br />
31. Malaria. Programs supported by the <strong>Global</strong><br />
<strong>Fund</strong> distributed more than 1.2 million ITNs in the<br />
region. Country partners in Guatemala – one of the<br />
countries with the highest incidence rates of malaria<br />
in Central America – distributed 419,465 ITNs and<br />
provided universal access to malaria treatment in 552<br />
Guatemalan communities.<br />
32. Malaria is also endemic in Guyana. As of December<br />
2009, 41,000 nets had been distributed with <strong>Global</strong><br />
<strong>Fund</strong> support in the country, covering an estimated<br />
74,324 people.
2.2.4 mIddLE EAST ANd North AfrICA<br />
33. The 21 countries of Middle East and North Africa<br />
have a total population of 313 million, with 16.9 percent<br />
living on less than US$ 2 a day (6). The <strong>Global</strong> <strong>Fund</strong>’s<br />
Middle East and North Africa region, which comprises<br />
16 of these 21 countries and territories (see Annex 2),<br />
represents a broad range of cultural and human development<br />
profiles. Three countries in the region – Chad,<br />
Mali and Niger – are among the ten lowest-ranking<br />
countries on the Human Development Index (7).<br />
34. Despite conflict and turmoil in countries such<br />
as Chad, Somalia and Sudan, the <strong>Global</strong> <strong>Fund</strong> has<br />
successfully engaged national stakeholders and development<br />
partners in countries throughout the region<br />
to fight HIV, TB and malaria.<br />
35. Between 2002 and 2009, the <strong>Global</strong> <strong>Fund</strong> ap proved<br />
proposals with a total budget of US$ 1 billion, of which<br />
US$ 591 million had been disbursed by the end of 2009.<br />
For some national control efforts, the <strong>Global</strong> <strong>Fund</strong><br />
provides most of the financial resources (e.g. for TB in<br />
most countries and for malaria in some of the countries<br />
in the Sahel), while in countries such as Morocco,<br />
Tunisia and Algeria the <strong>Global</strong> <strong>Fund</strong> has leveraged<br />
funds from other sources.<br />
36. Some countries in the region – including Algeria,<br />
Jordan, Morocco, Syria and Tunisia – have fairly welldeveloped<br />
health systems, but others suffer from poor<br />
health infrastructure and capacity, exacerbated in<br />
some cases by conflict and state failure. In almost all<br />
the countries, people living with HIV, women, men who<br />
have sex with men and members of other vulnerable<br />
groups must contend with high levels of stigmatization<br />
and discrimination.<br />
37. HIV. The <strong>Global</strong> <strong>Fund</strong> has provided critical support<br />
to the response to HIV in the region and helped<br />
break the silence about HIV and AIDS. Nevertheless,<br />
much remains to be done to achieve universal access<br />
targets and reduce stigma and discrimination.<br />
Through the end of 2009, <strong>Global</strong> <strong>Fund</strong>-supported programs<br />
distributed 62 million condoms (an increase<br />
of 24 million from the end of 2008), delivered close<br />
to 9.3 million community outreach services for HIV,<br />
enabled more than 35,000 people to start ART, and<br />
provided 162,000 “person-episodes” of training to<br />
health and community workers.<br />
38. Since the first grant in the region was awarded to<br />
Morocco in Round 1, <strong>Global</strong> <strong>Fund</strong> support has enabled<br />
the Moroccan National AIDS Control Program to create<br />
a positive shift in public attitudes and commitment<br />
towards HIV and most at-risk groups, including people<br />
who inject drugs and sex workers. The first grant<br />
included a treatment component, providing access<br />
to ART for 1,200 people living with HIV, and a prevention<br />
component including condom distribution and<br />
voluntary counseling and testing. A Round 6 grant has<br />
since enabled scale-up of ART coverage, with almost<br />
2,500 patients and 120 HIV-positive pregnant women<br />
receiving treatment in Phase 1 of the grant. The<br />
second phase of this grant provides additional funding<br />
to a pioneering Moroccan harm reduction program<br />
– funded entirely by the <strong>Global</strong> <strong>Fund</strong> – which has<br />
mobilized people who inject drugs and supports opioid<br />
substitution therapy and injecting kits for 400 people<br />
who inject drugs as part of a pilot project undertaken<br />
from 2009 to 2012.<br />
39. TB. <strong>Global</strong> <strong>Fund</strong> support in the region has<br />
contributed to, among other things, the detection and<br />
treatment of nearly 178,000 new-smear positive TB<br />
cases, and treatment of about 3,900 people for TB/HIV<br />
co-infection. Decreases in both TB prevalence and<br />
mortality have been observed (see Section 2.4.3 for<br />
some country examples).<br />
40. Malaria. Malaria is endemic in countries such<br />
as Chad, Djibouti, Mali, Mauritania, Niger and Sudan,<br />
where it is the leading cause of maternal and child<br />
mortality. To date, <strong>Global</strong> <strong>Fund</strong>-supported programs<br />
have been able to treat 9 million malaria cases,<br />
distribute 8.8 million LLINs and carry out indoor residual<br />
spraying in nearly 600,000 locations in the region<br />
– despite the fact that some of the countries in which<br />
the <strong>Global</strong> <strong>Fund</strong> operates are fragile countries. For<br />
example, Niger – a country heavily burdened by malaria<br />
– has substantially increased ITN coverage to approximately<br />
50 percent of all children under five and<br />
pregnant women. Building on this success, the authorities<br />
are now seeking to ensure that, by the end of<br />
2012, 80 percent of all children under five and pregnant<br />
women sleep under LLINs. The <strong>Global</strong> <strong>Fund</strong> is supporting<br />
these efforts with a Round 7 grant to fund the<br />
provision of an additional 3.5 million nets.<br />
41. Finally, regional efforts by the <strong>Global</strong> <strong>Fund</strong> and<br />
national and international partners have supported the<br />
emergence and strengthening of new social forums,<br />
civil society organizations and advocacy groups that<br />
have all contributed to the development of social<br />
capital throughout the region. One example is the<br />
<strong>Global</strong> <strong>Fund</strong>’s collaboration with an important network<br />
of civil society organizations in Mali involved in providing<br />
treatment, care and support to people living<br />
with and affected by HIV. National nongovernmental<br />
organizations (NGOs) are contributing to this work<br />
across Mali with funding from the <strong>Global</strong> <strong>Fund</strong> and<br />
other partners.<br />
23 THE GLOBAL FUND <strong>2010</strong>: INNOVATION AND IMPACT results aND progress ON internatiONal targets
2.2.5 EASTErn EurOPE ANd<br />
CENTrAL ASIA<br />
42. The 30 countries in the Eastern Europe and<br />
Central Asia region have a total population of<br />
441 million, of whom 30 percent are considered either<br />
poor or vulnerable (8). By December 2009, the<br />
<strong>Global</strong> <strong>Fund</strong> had approved proposals in 23 countries<br />
and territories (see Annex 2), with a total budget of<br />
US$ 1.4 billion and disbursements of US$ 0.9 billion by<br />
the end of 2009. <strong>Global</strong> <strong>Fund</strong>-supported programs<br />
have made an important contribution and delivered<br />
vital prevention, treatment, care and support services<br />
for the three diseases.<br />
43. HIV. According to the latest WHO data, 85,000<br />
(23 percent) of the 370,000 people estimated to need<br />
ART were receiving it as of December 2008. While<br />
access remains low, it has significantly expanded across<br />
the region in recent years, with programs supported<br />
by the <strong>Global</strong> <strong>Fund</strong> providing treatment to over<br />
74,000 people as of the end of 2009. In high-burden<br />
countries such as the Russian Federation and Ukraine,<br />
<strong>Global</strong> <strong>Fund</strong> financing complements the domestic<br />
resources for HIV treatment. In countries in Central Asia,<br />
3,400 people are receiving ART, compared to almost<br />
none in 2003.<br />
44. Voluntary testing and counseling services have<br />
greatly expanded in recent years. By the end of<br />
2009, <strong>Global</strong> <strong>Fund</strong>-supported programs had provided<br />
more than 25 million HIV counseling and testing<br />
sessions, more than double the cumulative number<br />
at the end of 2008. Community-based prevention<br />
work has also intensified.<br />
45. By providing the majority of funding for harm<br />
reduction in Eastern Europe and Central Asia, the<br />
<strong>Global</strong> <strong>Fund</strong> has played a central role in expanding<br />
access to, and improving the quality of, services<br />
for people who inject drugs. In Ukraine, prevention<br />
services have reached over 250,000 people who<br />
inject drugs. In the Russian Federation, the Russian Harm<br />
Reduction Network is leading the implementation<br />
of a program that focuses on providing harm reduction<br />
services to people who inject drugs. From Ukraine,<br />
Moldova and the Russian Federation to Romania,<br />
Serbia and Armenia, civil society organizations representing<br />
those most affected by HIV are working in<br />
partnership with governments to implement successful<br />
interventions and sometimes manage grants as<br />
Principal Recipients.<br />
46. Across the region, the <strong>Global</strong> <strong>Fund</strong> has been<br />
instrumental in initiating and scaling up opioid substitution<br />
therapy. In Ukraine, where the first such program<br />
opened in 2004, more than 5,000 people who inject<br />
drugs were enrolled in methadone and buprenorphine<br />
substitution therapy programs at the end of 2009 –<br />
the vast majority in programs supported by the <strong>Global</strong><br />
<strong>Fund</strong>. In Moldova and Kyrgyzstan, the <strong>Global</strong> <strong>Fund</strong><br />
supports needle and syringe programs and opioid substitution<br />
therapy programs operating both in the<br />
community and in prisons. However, the quantity and<br />
quality of services still varies considerably across the<br />
region. The Russian Federation, Turkmenistan and<br />
Armenia still have no substitution therapy programs<br />
in place, while Uzbekistan recently discontinued this<br />
evidence-based intervention.<br />
47. TB. <strong>Global</strong> <strong>Fund</strong>-supported TB programs in the<br />
region have demonstrated many positive results,<br />
contributing to the detection and treatment of more<br />
than 200,000 new TB cases between 2003 and<br />
2009 – almost half of them in 2009 alone. In addition,<br />
TB investments have supported upgrades in laboratory<br />
networks, improved supplies of consumables<br />
and first- and second-line drugs, enhanced surveillance,<br />
trained practitioners and strengthened<br />
health systems.<br />
48. At the end of 2009, almost 10,000 patients had<br />
received treatment for MDR-TB, which remains a major<br />
health challenge in the region. With <strong>Global</strong> <strong>Fund</strong> support,<br />
over 5,500 patients in the Russian Federation<br />
have been enrolled in DOTS-Plus treatment. Coverage<br />
remains low. According to estimates by WHO, nearly<br />
85,000 new cases of MDR-TB occurred in Eastern<br />
Europe and Central Asia in 2007 (3). Fifteen of the<br />
27 high-burden MDR-TB countries in the world are in<br />
this region, which continues to report the highest proportions<br />
of drug-resistant TB globally. The expansion<br />
of high-quality diagnostic and treatment services in<br />
the region is still facing challenges such as insufficient<br />
political will and resources, weak laboratory capacities,<br />
the vertical organization of TB control programs, limited<br />
involvement of key health care providers and, in<br />
some places, inadequately trained human resources.<br />
49. Malaria. <strong>Global</strong> <strong>Fund</strong> support has greatly<br />
increased the prospects for eliminating malaria as<br />
a public health problem in the region. Since 2004,<br />
support from the <strong>Global</strong> <strong>Fund</strong> and its partners has<br />
enabled Azerbaijan, Georgia, Kyrgyzstan, Tajikistan<br />
and Uzbekistan to initiate aggressive interventions targeting<br />
the disease, including the distribution of more<br />
than 139,000 ITNs. With continuing support, these<br />
countries anticipate eliminating malaria within the next<br />
few years.
2.3 Contribution<br />
to international<br />
efforts and<br />
breakdown of<br />
expenditures<br />
“I work hard to give other children a chance<br />
to be HIV-negative, like my own child.”<br />
—NHI, VOLUNTEER COUNSELOR<br />
AT A CENTER FOR HIV-POSITIVE PREGNANT WOMEN<br />
VIET NAM<br />
50. To enable it to fund the programs and achieve<br />
the results described in the first two sections of this<br />
chapter, by the end of 2009, the <strong>Global</strong> <strong>Fund</strong> had<br />
raised US$ 21 billion.<br />
51. Increasing finance and disbursement speed.<br />
Following the approval of Round 9 proposals in<br />
November 2009, the <strong>Global</strong> <strong>Fund</strong> was supporting<br />
programs in 144 countries and had approved proposals<br />
totaling US$ 19.2 billion: close to US$ 10.8 billion<br />
for HIV programs, US$ 3.2 billion for TB programs<br />
and US$ 5.3 billion for malaria programs.<br />
52. The <strong>Global</strong> <strong>Fund</strong> has shown that it can disburse<br />
in a responsive, efficient and predictable manner.<br />
Typically, money is disbursed incrementally based on<br />
program performance. 4 (See Annex 2 for more details.)<br />
As of the end of 2009, the <strong>Global</strong> <strong>Fund</strong> had disbursed<br />
US$ 10 billion: US$ 5.7 billion for HIV programs,<br />
US$ 1.5 billion for TB programs and US$ 2.8 billion for<br />
malaria programs. Table 2.6 provides a detailed<br />
breakdown of funding and disbursements by funding<br />
round. The disbursement rate is measured by comparing<br />
the amount of funding disbursed to that<br />
planned in grants. In 2009, the disbursement rate was<br />
90 percent, with all rounds having a disbursement<br />
rate of nearly 90 percent or greater than 90 percent.<br />
Disbursement rates in 2009 vary by country, depend ing<br />
on the speed at which countries can absorb funds.<br />
Only 40 percent of active grants have a disbursement<br />
rate of less than 75 percent. In these cases, implementers<br />
are provided with appropriate technical<br />
support to improve the disbursement rate.<br />
FIGURE 2.2 ALLOCATION OF CUMULATIVE exPENDITURE<br />
BY SERVICE DELIVERY AREA FOR THREE DISEASES<br />
(THROUGH 2008 exPENDITURE REPORTING CYCLE)<br />
PERCENTAGE OF exPENDITURE<br />
100<br />
90<br />
80<br />
70<br />
60<br />
50<br />
40<br />
30<br />
20<br />
10<br />
0<br />
10<br />
16<br />
16<br />
1<br />
27<br />
30<br />
HIV TUBERCULOSIS MALARIA<br />
CARE AND SUPPORT<br />
supportive ENVIRONMENT<br />
health SYSTEMS STRENGTHENING<br />
TB/HIV COLLABORATIVE ACTIVITIES<br />
TREATMENT<br />
prevention<br />
Source: <strong>Global</strong> <strong>Fund</strong>, unpublished Enhanced Financial <strong>Report</strong>ing data, 2008.<br />
53. Contribution to international financing of<br />
diseases. According to a recent estimate, the <strong>Global</strong><br />
<strong>Fund</strong> contributed about one-fifth of all disbursements<br />
by bi- and multilaterals for the HIV response in lowand<br />
middle-income countries in 2008 (9). According<br />
to other estimates, it contributed 63 percent of external<br />
financing for TB control in these countries in 2009 (10)<br />
and 57 percent of international disbursements<br />
for malaria control in 2008 (11) – making the <strong>Global</strong><br />
<strong>Fund</strong> by far the major source of international funding<br />
in the areas of TB and malaria.<br />
26<br />
15<br />
5<br />
53<br />
1<br />
13<br />
14<br />
31<br />
42<br />
25 THE GLOBAL FUND <strong>2010</strong>: INNOVATION AND IMPACT results aND progress ON internatiONal targets<br />
4 The Principal Recipient regularly reports on the progress to date and requests a disbursement for the next period of implementation. The Local <strong>Fund</strong> Agent reviews the Principal Recipient’s<br />
programmatic and financial reports, verifies reported data, evaluates performance and makes recommendations to the <strong>Global</strong> <strong>Fund</strong> on future disbursements. On receipt of the Local <strong>Fund</strong><br />
Agent-verified <strong>Progress</strong> Update/Disbursement Request, the Secretariat evaluates the overall performance of the grant and gives it a performance rating, which is then linked to disbursement.
FIGURE 2.3 CUMULATIVE exPENDITURE FOR THE THREE<br />
DISEASES BY COST CATEGORY<br />
(THROUGH 2008 exPENDITURE REPORTING CYCLE)<br />
MEDICINES 21%<br />
HEALTH PRODUCTS AND HEALTH EQUIPMENT 18%<br />
HUMAN RESOURCES 13%<br />
PROGRAM MANAGEMENT 12%<br />
TRAINING 11%<br />
INFRASTRUCTURE 10%<br />
OTHER 11%<br />
M&E 4%<br />
Source: <strong>Global</strong> <strong>Fund</strong>, unpublished Enhanced Financial <strong>Report</strong>ing data, 2008.<br />
FIGURE 2.4 CUMULATIVE exPENDITURES<br />
BY IMPLEMENTING ENTITY<br />
(THROUGH 2008 exPENDITURE REPORTING CYCLE)<br />
54. Balance of investments. One principle of the<br />
<strong>Global</strong> <strong>Fund</strong> is a balance in its investments – balance<br />
among regions, among the three diseases it targets,<br />
and among prevention, treatment and care. In the<br />
2008 reporting cycle, the new Enhanced Financial<br />
<strong>Report</strong>ing system on cumulative expenditures<br />
of US$ 5.1 billion for 426 active grants showed that<br />
61 percent of cumulative expenditures went to HIV<br />
programs, 15 percent to TB programs and 24 percent<br />
to malaria programs. Of the amount allocated<br />
to HIV:<br />
• 30 percent was spent on prevention;<br />
• 27 percent on treatment;<br />
• 16 percent on health system strengthening<br />
(including community systems strengthening,<br />
information system and operational research,<br />
infrastructure, human resources, procurement<br />
and supply management, and M&E);<br />
• 16 percent on activities aimed at creating an<br />
enabling environment (including policy development,<br />
civil society strengthening, stigma reduction<br />
efforts, and management and administration); and<br />
• a smaller percentage on other activities, including<br />
care and support.<br />
Of the amount allocated to TB, 53 percent was<br />
spent on detection and treatment, the cornerstones<br />
of TB control.<br />
Of the amount allocated to malaria, 42 percent was<br />
spent on prevention, covering mostly ITN distribution,<br />
indoor residual spraying, and community outreach<br />
(see Figure 2.2 for a more detailed breakdown).<br />
55. A breakdown of expenditures by cost category<br />
for the three diseases (Figure 2.3) reveals that<br />
21 percent was spent on medicines and pharmaceutical<br />
products, 18 percent on health products and equipment,<br />
13 percent on human resources for health (including<br />
salaries, wages and recruitment costs), 12 percent on<br />
program management (planning and administration,<br />
overheads, technical assistance and procurement and<br />
supply management), 11 percent on training of the<br />
health work force (workshops, meetings, training publications<br />
and training-related travel), 10 percent on<br />
health infrastructure, 4 percent on M&E, and the rest<br />
on other cost categories.<br />
MINISTRY OF HEALTH 37%<br />
FBO/NGO/CBO/ACADEMIC INSTITUTION 3 5 %<br />
OTHER GOVERNMENT BODY 1 4 %<br />
UNDP 8 %<br />
OTHER MULTILATERAL ORGANIzATION 5 %<br />
PRIVATE SECTOR 1 %<br />
56. Thirty-five percent of the funds were disbursed<br />
to civil society organizations (4 percent to faith-based<br />
organizations (FBOs)), 37 percent to ministries of<br />
health, 14 percent to other ministries, and 8 percent<br />
to the United Nations Development Programme<br />
(UNDP) (Figure 2.4).<br />
Source: <strong>Global</strong> <strong>Fund</strong>, unpublished Enhanced Financial <strong>Report</strong>ing data, 2008.
2.4 The <strong>Global</strong><br />
<strong>Fund</strong>’s contribution<br />
to progress<br />
on the Millennium<br />
Development<br />
Goals and other<br />
international<br />
targets<br />
“Without the <strong>Global</strong> <strong>Fund</strong>, there is no chance that<br />
we could have started mdr-TB treatment… I worked<br />
in TB in the hard times, I would not want to be doing<br />
anything else now that we are in far better times.”<br />
—TARIEL ENDELADZE<br />
HEAD OF STATE TB HOSPITAL<br />
ABASTUMANI, GEORGIA<br />
57. Programs supported by the <strong>Global</strong> <strong>Fund</strong> have<br />
made an increasingly significant contribution to the<br />
international targets for key services such as provision<br />
of ART, treatment under DOTS and ITNs (See Box 2.2<br />
and Figure 2.5).<br />
58. The international target for malaria as set by the<br />
<strong>Global</strong> Strategic Plan 2005–2015 (12) is to provide<br />
ITNs to 80 percent of the populations most at risk for<br />
contracting malaria by <strong>2010</strong>. The contribution of programs<br />
supported by the <strong>Global</strong> <strong>Fund</strong> towards reaching<br />
this target in sub-Saharan Africa has increased dramatically<br />
in recent years, from 5 percent in 2005 to<br />
58 percent at the end of 2009.<br />
59. Similarly, in 2009, programs supported by the<br />
<strong>Global</strong> <strong>Fund</strong> contributed 48 percent towards international<br />
targets set by the Stop TB partnership for the<br />
detection of TB cases and treatment through DOTS,<br />
compared to 26 percent in 2005.<br />
60. Programs supported by the <strong>Global</strong> <strong>Fund</strong> also<br />
contributed 26 percent towards international targets<br />
for the provision of ART in 2009, compared to<br />
13 percent in 2005 and 31 percent in 2008. Although<br />
the number of people accessing ART thanks to<br />
<strong>Global</strong> <strong>Fund</strong>-supported programs is continuing to<br />
increase substantially in absolute numbers, these<br />
programs’ share of the international target has recently<br />
decreased slightly.<br />
BOX 2.2 CALCULATING GLOBAL<br />
FUNd CONTrIBUTIONS TO KEY<br />
INTErNATIONAL TArGETS<br />
The MDGs are the most prominent global development aims. Covering a wide<br />
spectrum of issues and focusing mainly on impact measurements, specialized<br />
international agencies and partnerships have set targets for more detailed<br />
indicators to better monitor the progress in achieving the MDGs. For each of<br />
the three diseases, the <strong>Global</strong> <strong>Fund</strong> has selected one such service indicator<br />
and compared program results to projected global results.<br />
The first indicator – people currently receiving ART – was formulated by<br />
WHO and UNAIDS in 2002. Projected global results to achieve universal access<br />
(13) were employed in this report for comparison with actual results.<br />
The second indicator is the number of new smear-positive TB cases detected<br />
and treated. The Stop TB Partnership has provided approximate results<br />
required for the next decade (14). The projected global results were then<br />
cumulated from mid-2004 in order to be comparable to targets and results<br />
for <strong>Global</strong> <strong>Fund</strong>-supported programs.<br />
For malaria, the number of ITNs distributed was compared to the 80 percent<br />
coverage target of people at high risk (children under the age of five and<br />
pregnant women), as set by the <strong>Global</strong> Strategic Plan 2005−2015 of the Roll<br />
Back Malaria partnership (12). In 2007, WHO recommended providing ITNs<br />
to all age groups and not only to children under the age of five and pregnant<br />
women. Most of the results reported as of the end of 2009 are from Rounds<br />
1 to 7, prior to this recommendation. Consequently, it was assumed that<br />
ITNs distributed are targeting mainly children under the age of five and<br />
pregnant women. Future estimates will take into account the 2007 guidelines.<br />
FIGURE 2.5 CONTRIBUTIONS OF GLOBAL FUND-SUPPORTED<br />
PROGRAMS TO INTERNATIONAL TARGETS FOR HIV,<br />
TUBERCULOSIS AND MALARIA<br />
PERCENT CONTRIBUTION TO INTERNATIONAL TARGETS<br />
60<br />
50<br />
40<br />
30<br />
20<br />
10<br />
0<br />
ARV TREATMENT<br />
TB DETECTION<br />
ITn DISTRIBUTION<br />
(SUB-SAHARAN AFRICA)<br />
26<br />
13<br />
5<br />
2005 2006 2007 2008 2009<br />
YEAR<br />
Note: <strong>Global</strong> <strong>Fund</strong> figures may include service and commodity deliverables that are<br />
co-financed by others. Contribution is calculated based on projected global results.<br />
See also Box 2.2 for more detail about the international targets.<br />
45<br />
31<br />
58<br />
48<br />
26<br />
27 THE GLOBAL FUND <strong>2010</strong>: INNOVATION AND IMPACT results aND progress ON internatiONal targets<br />
Source: References 12–14; Grant performance report. www.theglobalfund.org.
A PATIENT IS SUPERVISED TAkING HER DAILY MEDICATION ON THE MULTIDRUG-RESISTANT<br />
WARD OF THE ABASTUMANI TB HOSPITAL IN GEORGIA. WITH GLOBAL FUND SUPPORT, THE<br />
COUNTRY FIRST OFFERED MDR-TB MEDICATION IN 2008 AND NOW PROVIDES UNIVERSAL<br />
ACCESS TO MDR-TB TREATMENT.
2.4.1 The <strong>Global</strong> <strong>Fund</strong> contribution<br />
to achievement of the Millennium<br />
Development Goals<br />
61. <strong>Global</strong> <strong>Fund</strong> investments to combat HIV, TB,<br />
and malaria contribute directly to MDGs 4, 5, 6, and 8,<br />
and indirectly to the other MDGs (see Box 1.1). The<br />
three diseases are often rooted in poverty and, as such,<br />
affect development in general and impact on all<br />
eight MDGs (15, 16). The following are some examples<br />
of these contributions.<br />
62. The <strong>Global</strong> <strong>Fund</strong> contributes to achieving<br />
mdG 5, “Improve maternal health” – particularly in sub-<br />
Saharan Africa – by reducing the largest causes of<br />
mortality among women of childbearing age (defined<br />
as between 15 and 44 years of age), reducing major<br />
causes of maternal deaths, and facilitating the integration<br />
of HIV and sexual and reproductive health<br />
services (Table 2.7).<br />
63. The first target under MDG 5 is to reduce by<br />
three quarters the maternal mortality ratio. <strong>Global</strong>ly,<br />
HIV is the major cause of death among all women<br />
of childbearing age (18 percent), followed by maternal<br />
conditions (12 percent) and cardiovascular<br />
diseases (12 percent) (17). However, in sub-Saharan<br />
Africa, HIV accounted for 46 percent of deaths among<br />
women in this age group.<br />
64. HIV and, to a lesser extent, malaria also account<br />
directly for a large proportion of maternal deaths.<br />
In South Africa, at least 38 percent of maternal deaths<br />
are due to HIV, TB and other infections unrelated to<br />
pregnancy (18). As much as 25 percent of severe maternal<br />
anemia – a significant cause of maternal death<br />
– may also be due to malaria (19). An autopsy study<br />
undertaken in Mozambique in 2002 to 2004 attributed<br />
12.9 percent of maternal mortality to HIV-related<br />
conditions and 10.1 percent to severe malaria (20).<br />
65. Universal access to reproductive health is the<br />
second target under MDG 5. Integrating HIV programs<br />
in settings that have not previously offered HIV services<br />
can catalyze the utilization of reproductive health<br />
services. Almost all <strong>Global</strong> <strong>Fund</strong>-supported HIV programs<br />
provide sexual and reproductive health-related<br />
services, including treatment of STIs, behavior change<br />
communication on safer sex practices, distribution<br />
of condoms, HIV counseling and testing, and care and<br />
support to people living with HIV and their families<br />
(21). After HIV services were introduced to primary care<br />
centers in Rwanda, for example, a study found a<br />
significant increase in uptake of primary care services,<br />
such as reproductive health services (22).<br />
66. The <strong>Global</strong> <strong>Fund</strong> contributes to MDG 4,<br />
“Reduce child mortality”, in particular by supporting:<br />
• unprecedented scale-up of activities for prevention<br />
and control of malaria;<br />
• increased access to pediatric HIV treatment<br />
(See Table 2.7) and more comprehensive and<br />
geographically widespread care, support and<br />
treatment for infants and children exposed to and<br />
infected with HIV; and<br />
• scale-up of PMTCT programs.<br />
67. Malaria killed 863,000 people in 2008, 85 percent<br />
of them children (2), and accounted for 16 to 18 percent<br />
of child mortality in sub-Saharan Africa (33, 34).<br />
Data published in 2009 from 22 African countries with<br />
a high malaria burden illustrate the remarkable scale-up<br />
of provision of ITNs in recent years. For example:<br />
• in Rwanda the percentage of children under five<br />
sleeping under an ITN the night before the survey<br />
increased from 4 percent in 2000 to 56 percent<br />
in 2007;<br />
• in Gambia, it increased from 15 percent in 2000 to<br />
49 percent in 2005;<br />
• in Zambia, it increased from 1 percent in 1999 to<br />
41 percent in 2008 (see figure 2.6 for similar data<br />
from additional countries).<br />
Several countries have seen a decline in malaria<br />
mortality and malaria morbidity as well as declines<br />
in child mortality.<br />
68. <strong>Global</strong> <strong>Fund</strong>-supported programs dramatically<br />
scaled up distribution of ITNs from a cumulative<br />
total of 18 million by 2006 to a cumulative total of<br />
104 million by 2009, and countries that have scaled up<br />
the distribution of ITNs and/or indoor residual spraying<br />
and case management with ACT have started to<br />
see a remarkable reduction in child mortality (2). At the<br />
end of 2009, US$ 336 million was disbursed to provide<br />
over 50 million LLINs to Ethiopia, Kenya, Tanzania,<br />
Uganda and Nigeria. By the end of <strong>2010</strong>, <strong>Global</strong> <strong>Fund</strong>supported<br />
programs are set to distribute 136 million<br />
ITNs in sub-Saharan Africa.<br />
69. As mentioned in section 2.1 of the report, as of<br />
the end of 2009, 790,000 HIV-positive pregnant<br />
women in low- and middle-income countries received<br />
a complete course of ARV prophylaxis to prevent<br />
mother-to-child transmission through <strong>Global</strong> <strong>Fund</strong><br />
grants. In 2009 alone, 340,000 pregnant women<br />
received PMTCT treatment, a substantial increase over<br />
previous years. Over the next years, the <strong>Global</strong> <strong>Fund</strong>,<br />
working with its partners, will continue to intensify the<br />
scale-up of PMTCT programs, in an effort to reach the<br />
goal of virtually eliminating transmission from mother<br />
to child in low- and middle-income countries by 2015.<br />
29 THE GLOBAL FUND <strong>2010</strong>: INNOVATION AND IMPACT results aND progress ON internatiONal targets
TABLE 2.7 GLOBAL FUND CONTRIBUTIONS TO ACHIEVING MDGs 4 AND 5<br />
BURDEN OF DISEASE ON WOMEN AND CHILDREN<br />
GLOBAL FUND SUPPORT TO WOMEN AND CHILDREN<br />
HIV<br />
MALARIA<br />
• 50 percent of HIV infections worldwide – and 60 percent in Africa<br />
– are among women (23).<br />
• HIV is the leading cause of death in women aged 15 to 44 years<br />
worldwide, and a leading underlying cause of maternal mortality<br />
in Africa (17, 24, 25).<br />
• 2 million children were living with HIV in 2007, with a majority<br />
infected through mother-to-child transmission (1).<br />
• 5 percent of all deaths among children under five are associated<br />
with HIV.<br />
• More than 14 million children have lost one or more parent to<br />
AIDS, mostly in Africa (26).<br />
• Malaria in pregnancy increases the risk of maternal anemia and<br />
miscarriage; pregnant women with HIV are at increased risk (27, 28).<br />
• Around 10,000 pregnant women and 200,000 infants die each<br />
year of malaria in endemic countries (28).<br />
• About 90 percent of all malaria deaths occur in Africa. Malaria<br />
accounts for nearly one in five deaths among children under five<br />
in this region (28).<br />
• In malaria-endemic areas, nearly 20 percent of low birth weight<br />
is attributable to malaria (28).<br />
• 2.5 million people received ART in 2009, around 60 percent<br />
of whom are women.<br />
• 790,000 HIV-positive pregnant women received ARV prophylaxis<br />
to prevent mother-to-child transmission.<br />
• Around 4.5 million care and support services have been provided<br />
to orphans and vulnerable children since 2004. Currently,<br />
around 1.5 million orphans are receiving support from <strong>Global</strong><br />
<strong>Fund</strong>-financed programs.<br />
• A growing number of children living with HIV are receiving ART.<br />
For example, India’s <strong>Global</strong> <strong>Fund</strong>-supported programs report<br />
that some 15,000 children are on ART. In Cambodia, over 3,300<br />
children are on ART.<br />
• 34 million ITNs were distributed in 2009.<br />
• Between 1999–2004 and 2005–2008, among top 25 <strong>Global</strong> <strong>Fund</strong><br />
malaria recipients: 1<br />
– the median percentage of pregnant women who slept under an<br />
ITN increased from 2 percent to 21 percent;<br />
– the median percentage of children under five who slept under an<br />
ITN increased from 2 percent to 23 percent.<br />
• <strong>Global</strong>ly, ITN use by children under five was 24 percent in<br />
high-burden countries in 2008 (2).<br />
TB • 3.6 million incident TB cases occurred among women in 2008 (3). • 6 million new smear-positive TB cases were detected and treated<br />
between 2004 and 2009 – more than half of all detections<br />
worldwide, with similar case detection rates in men and women (3).<br />
• Women bear a relatively higher burden of TB in countries with<br />
high HIV prevalence (3).<br />
• Studies show that progression from TB infection to disease<br />
is likely to be faster for women compared with men in their<br />
reproductive years (29).<br />
Notes: 1 Based on countries with two successive data points. Pregnant women sleeping under ITN (n=11), Children under five sleeping under ITN (n=18).<br />
TABLE 2.8 GLOBAL PROGRESS ON SELECTED INTERNATIONAL GOALS: AN ANALYSIS OF WHO, UNAIDS AND UNICEF DATA<br />
ART IN LOW- AND MIDDLE-INCOME<br />
UNDER-FIVE MORTALITY<br />
PERCENTAGE OF NEED 1 TB PREVALENCE PER 100,000 2 SUB-SAHARAN AFRICA 3<br />
COUNTRIES: RECIPIENTS AND<br />
PER 1,000 LIVE BIRTHS IN<br />
BASELINE 1.3 MILLION, 20% (2005) (30) 220 (2000) (3) 166 (2000) (32)<br />
INTERNATIONAL TARGET 80% (<strong>2010</strong>) 125 (2015) 61 (2015)<br />
RESULTS 4.03 MILLION, 42% (2008) (1) 170 (2008) (3) 144 (2008) (32)<br />
PROGRESS TOWARD<br />
INTERNATIONAL TARGET<br />
TIMEBOUND PROGRESS<br />
(PROGRESS AS PERCENTAGE<br />
OF RELEVANT INTERIM GOAL)<br />
53% 53% 21%<br />
72% 99% 40% 4<br />
1 Based on the WHO and UNAIDS estimated need to achieve universal access to ART (defined as 80 percent coverage) by <strong>2010</strong> (MDG 6, Target 2). The timebound progress for 2008<br />
was linearly interpolated based on the number of people on ART in 2005 and the 80 percent ART coverage target for <strong>2010</strong>.<br />
2 A Stop TB target is to halve the 1990 prevalence (250 people with any form of TB per 100,000 population) by 2015. The target for 2008, the year for which the latest data were available,<br />
was interpolated linearly.<br />
3 The target for MDG 4 is to reduce by 2015 under-five mortality by two-thirds from its 1990 level. The table shows data for sub-Saharan Africa, the region where child mortality is most<br />
affected by malaria. The baseline target has been linearly interpolated to 2008, the year for which the latest data were available.<br />
4 This figure does not capture recent progress in service scale-up and distribution of ITNs, the impact of which should be visible in 2009 and <strong>2010</strong>.
FIGURE 2.6 PERCENTAGE OF CHILDREN UNDER FIVE SLEEPING UNDER AN ITN THE NIGHT BEFORE THE SURVEY, SUB-SAHARAN AFRICA<br />
PERCENTAGE OF CHILDREN UNDER FIVE SLEEPING UNDER AN ITN<br />
80<br />
60<br />
40<br />
20<br />
0<br />
7<br />
20<br />
BENIN<br />
2001–2002, 2006<br />
Source: Modified from reference 35.<br />
GHANA<br />
2003, 2006<br />
25 26 26<br />
22 23<br />
4 3 2 2 2<br />
MALAWI<br />
2000, 2006<br />
TANzANIA<br />
1999, 2007–2008<br />
SIERRA LEONE<br />
2000, 2008<br />
70. Generally, substantial progress is being made<br />
toward achieving the mdGs and other international<br />
33<br />
ETHIOPIA<br />
2005, 2007<br />
targets, but data from <strong>Global</strong> <strong>Fund</strong> partners (summarized<br />
in Table 2.8) on access to ART, TB prevalence<br />
and under-five child mortality (which is an important<br />
indicator for progress in malaria control in sub-Saharan<br />
Africa) show that scale-up will have to accelerate<br />
in order to reach the targets by 2015.<br />
71. <strong>Global</strong>ly, there is increasing evidence of the direct<br />
impact of HIV treatment on adult mortality. HIV<br />
deaths were roughly 10 percent lower in 2008 than<br />
in 2004 (36). The number of people receiving ART<br />
has trebled between 2005 and 2008 and coverage more<br />
than doubled to 42 percent. Yet the global effort to<br />
scale up ART fell short of the 2008 intermediate target<br />
of 56 percent (Table 2.8).<br />
72. Overall, efforts to fight TB are on track to achieve<br />
some of the international targets under mdG 6.<br />
TB incidence is declining and TB prevalence decreased<br />
to 170 cases per 100,000 in 2008.<br />
2<br />
TOGO<br />
2000, 2006<br />
38 39<br />
7<br />
GUINEA-BISSAU<br />
2000, 2006<br />
1<br />
zAMBIA<br />
1999, 2008<br />
41 42<br />
SAO TOME AND PRINCIPE<br />
2000, 2006<br />
15<br />
GAMBIA<br />
2000, 2005–2006<br />
AROUND 2001<br />
2006–2008<br />
49<br />
4<br />
56<br />
RWANDA<br />
2000, 2007–2008<br />
73. Malaria causes 16 to 18 percent of child mortality<br />
and a large burden of illness in sub-Saharan Africa.<br />
In 2008, under-five mortality was 144 per 1,000<br />
live births in sub-Saharan Africa, when the intermediate<br />
2008 MDG target was 110 per 1,000 live births.<br />
Declines in child mortality are due to various health<br />
interventions such as immunization, antibiotics<br />
for acute respiratory infections, Vitamin A supplements,<br />
oral rehydration for diarrhea, increased<br />
PMTCT and the scale-up of malaria programs. The<br />
<strong>Global</strong> <strong>Fund</strong> malaria investments in sub-Saharan<br />
African countries will increase the total number of<br />
ITNs distributed to reach 136 million by the end<br />
of <strong>2010</strong>, and expand access to ACTs. A number<br />
of countries have reported a reduction in malaria<br />
deaths of more than 50 percent, including Eritrea,<br />
Rwanda, Sao Tome and Principe, Zambia, Namibia<br />
and Swaziland (2).<br />
74. Data on national progress toward the MDGs<br />
reveal important gradients and nuances of regional<br />
progress. The following subsections focus on each<br />
disease in turn, in the 25 countries where <strong>Global</strong> <strong>Fund</strong><br />
investments in that disease are greatest.<br />
31 THE GLOBAL FUND <strong>2010</strong>: INNOVATION AND IMPACT results aND progress ON internatiONal targets
TABLE 2.9 ART ACCESS IN THE 25 COUNTRIES WITH THE GREATEST GLOBAL FUND INVESTMENTS IN HIV EFFORTS<br />
COUNTRY<br />
BASELINE –<br />
2005 ART UPTAKE<br />
2008 RESULT –<br />
ART UPTAKE<br />
PERCENT INCREASE,<br />
2005–2008<br />
INTERIM 2008<br />
TARGET –<br />
ART UPTAKE<br />
2008 RESULT –<br />
ART UPTAKE,<br />
EXPRESSED AS<br />
PERCENTAGE OF<br />
INTERIM 2008<br />
TARGET<br />
GLOBAL FUND<br />
DISBURSEMENTS<br />
TO HIV PROGRAMS<br />
(MILLIONS OF<br />
US$, BY END<br />
OF 2009)<br />
ETHIOPIA 21,000 132,000 544 157,000 82 405.8<br />
INDIA 52,000 235,000 356 321,000 68 353.0<br />
TANZANIA 22,000 154,000 616 220,000 67 288.5<br />
MALAWI 33,000 147,000 345 152,000 95 248.2<br />
CHINA 19,000 48,300 154 99,000 37 225.3<br />
RUSSIAN FEDERATION 5,000 55,000 1000 93,000 57 220.6<br />
ZAMBIA 49,000 226,000 366 178,000 137 225.3<br />
UKRAINE 4,000 11,000 206 45,000 17 151.5<br />
THAILAND 82,000 180,000 121 153,000 139 150.7<br />
NIGERIA 41,000 239,000 483 376,000 59 142.1<br />
RWANDA 19,000 63,000 232 40,000 >200 151.2<br />
HAITI 7,000 19,000 186 20,000 95 130.9<br />
CONGO<br />
(DEMOCRATIC REPUBLIC)<br />
8,000 25,000 216 61,000 32 130.4<br />
GHANA 5,000 22,000 378 44,000 44 107.7<br />
CAMBODIA 13,000 32,000 156 24,000 167 102.2<br />
SOUTH AFRICA 207,000 701,000 239 899,000 71 97.2<br />
MOZAMBIQUE 20,000 128,000 540 186,000 65 98.0<br />
NAMIBIA 29,000 59,000 103 40,000 >200 87.6<br />
KENYA 66,000 243,000 268 252,000 95 87.4<br />
CAMEROON 24,000 60,000 155 96,000 50 78.0<br />
UGANDA 75,000 164,000 119 198,000 72 76.8<br />
SWAZILAND 13,000 33,000 152 34,000 96 72.7<br />
SUDAN 500 2,000 360 42,000 4 67.1<br />
ZIMBABWE 25,000 148,000 504 283,000 48 66.6<br />
INDONESIA 4,000 11,000 203 22,000 38 60.4<br />
Note: Universal access to ART is defined in this report as coverage of 80 percent. Targets for 2008 (column 5) were interpolated linearly between the 2005 baseline (column 2) and 80 percent<br />
coverage in <strong>2010</strong> (not shown). <strong>Progress</strong> towards interim 2008 targets (column 6) was calculated as the ratio of observed percent increase (column 4) over expected percent increase<br />
(column 5 from column 2). Therefore, 100 percent means right on track to achieve <strong>2010</strong> targets under the linear increase assumption. Disbursements cover all HIV-related activities.<br />
Source: 2005 baseline data, 2007 estimated need and 2008 result data from references 1, 30, 37.
2.4.2 <strong>Progress</strong> on meeting HIV<br />
targets: country examples<br />
75. Achieving universal access to comprehensive<br />
HIV prevention, treatment, care and support would<br />
make a major contribution towards achieving the<br />
MDGs and, in particular, MDG 6. Data on progress in<br />
providing universal access to ART by the end of <strong>2010</strong><br />
in the 25 countries accounting for 65 percent of <strong>Global</strong><br />
<strong>Fund</strong> investments in HIV programs shows that five<br />
of these countries are on track to meet the targets they<br />
set in relation to universal access to ART: Cambodia,<br />
Namibia, Rwanda, Thailand and Zambia. Four more –<br />
Haiti, Kenya, Malawi and Swaziland – have also been<br />
increasing ART access but will require an intensification<br />
of effort to achieve the targets they set. At the other<br />
end of the spectrum, several countries, most notably<br />
Sudan and Ukraine, will require a substantial scale-up<br />
if they are to achieve the targets (see Table 2.9 for<br />
more details).<br />
76. Although many challenges remain on the road<br />
to achieving MDG 6, country data nevertheless show<br />
that the rapid scale-up of HIV prevention, treatment,<br />
care and support is having a major impact. Even in the<br />
most resource-constrained and fragile settings, steady<br />
declines in AIDS mortality within five years of a rapid<br />
scale-up in ART have been documented, especially<br />
when accompanied by health education campaigns and<br />
easily accessible voluntary counseling and testing<br />
services. <strong>Report</strong>s show that scale-up of ART has led<br />
not only to a significant reduction in AIDS mortality<br />
rates, but also to improved survival and productivity<br />
among teachers, health professionals and other<br />
workers, and systemwide improvements in health care<br />
delivery. The following are some examples of how<br />
interventions have been scaled up in countries, and<br />
of their impact.<br />
77. Tanzania. HIV prevention and control efforts<br />
in Tanzania have been supported with substantial<br />
fund ing from the <strong>Global</strong> <strong>Fund</strong>, the World Bank,<br />
PEPFAR and others. Of the total approved amount<br />
of US$ 528.4 million for HIV and US$ 83.5 million<br />
for HIV/TB control, US$ 234 million and US$ 55 million,<br />
respectively, had been disbursed as of the end of<br />
2009 by the <strong>Global</strong> <strong>Fund</strong>. Tanzania has rapidly scaled<br />
up HIV prevention and treatment activities since<br />
2004 (38–40). Between 2003, when Tanzania first<br />
received funding from the <strong>Global</strong> <strong>Fund</strong>, and the end<br />
of 2009:<br />
• 103,000 HIV-positive pregnant mothers received<br />
a complete course of ARV prophylaxis for PMTCT –<br />
up from 1,800 in 2003;<br />
• 383,000 care and support services were provided<br />
to orphans and other vulnerable children;<br />
• 5.4 million people were counseled and tested for<br />
HIV; and<br />
• as of the end of 2009, approximately 203,000 adults<br />
and children (46 percent of those eligible) were<br />
receiving ART, compared to just over 1,500 in 2003.<br />
78. A comparison between two population-based<br />
surveys shows that between 2003 and 2008, HIV prevalence<br />
declined from 4 to 3 percent among 15 to<br />
24-year-old women and from 3.6 to 1.1 percent among<br />
15 to 24-year-old men (Figure 2.7) (36, 40).<br />
FIGURE 2.7 HIV PREVALENCE TRENDS AMONG MEN AND<br />
WOMEN AGED 15 TO 24, TANzANIA (2003–2008)<br />
33 THE GLOBAL FUND <strong>2010</strong>: INNOVATION AND IMPACT results aND progress ON internatiONal targets<br />
PREVALENCE (PERCENTAGE), ADULTS AGED 15–24 YEARS<br />
5<br />
4<br />
3<br />
2<br />
1<br />
women<br />
men<br />
0<br />
2003–2004 2007–2008<br />
year<br />
Source: Reference 40.
FIGURE 2.8 ESTIMATED NUMBER OF AIDS DEATHS<br />
IN ADDIS ABABA, ETHIOPIA (2004–2007)<br />
NUMBER OF AIDS DEATHS<br />
5,000<br />
4,000<br />
3,000<br />
2,000<br />
1,000<br />
0<br />
Note: The whiskers represent 95 percent confidence intervals of the estimates.<br />
Source: Reference 42.<br />
ART SCALE-UP<br />
2004 2005 2006 2007<br />
year<br />
women<br />
men<br />
79. Ethiopia. Massive investment by the <strong>Global</strong> <strong>Fund</strong><br />
has enabled the Ethiopian government – with strong<br />
support from various international agencies and civil<br />
society organizations – to rapidly scale up HIV prevention<br />
and treatment activities. Of the total approved<br />
amount of US$ 948.8 million, US$ 405.8 million had<br />
been disbursed by the <strong>Global</strong> <strong>Fund</strong> by the end of 2009,<br />
supporting the following programs and interventions:<br />
• 163,000 adults and children (53 percent of those<br />
eligible) were receiving ART, compared to 900<br />
at the beginning of 2005 (41);<br />
• 5.6 million young people benefited from community<br />
outreach health education programs in schools;<br />
• 51,000 teachers benefited from health education<br />
programs; and<br />
• 5.3 million people were counseled and tested for<br />
HIV in 2009 alone.<br />
Recent reports show that ART scale-up in Ethiopia has<br />
resulted in a 50 percent decline in population-level<br />
AIDS mortality in the country’s capital between 2002<br />
and 2007 (Figure 2.8), and substantially improved<br />
the survival of patients on ART, with 60 percent (range:<br />
57–63 percent) of the expected number of AIDS<br />
deaths in 2007 averted as a result of ART availability<br />
(42, 43).<br />
FIGURE 2.9 ART COVERAGE AND ALL-CAUSE MORTALITY<br />
IN SOUTH AFRICA (2003–2006)<br />
ART COVERAGE PER 100,000 HIV-POSITIVE POPULATION<br />
40<br />
35<br />
30<br />
25<br />
20<br />
15<br />
10<br />
5<br />
0<br />
Source: Reference 1.<br />
ARt COVERAGE<br />
MORTALITY<br />
2003<br />
2004 2005 2006<br />
year<br />
15<br />
14.5<br />
14<br />
13.5<br />
13<br />
12.5<br />
12<br />
11.5<br />
11<br />
10.5<br />
10<br />
MORATLITY RATE PER 1,000 PEOPLE 15 TO 49 YEARS<br />
80. Dominican Republic. Of the approved amount<br />
of US$ 87.5 million, the HIV prevention and control<br />
efforts in the Dominican Republic had received<br />
US$ 56.7 million from the <strong>Global</strong> <strong>Fund</strong> by the end<br />
of 2009, allowing the country to scale up the response<br />
to HIV. As of December 2009 (36, 44):<br />
• 2 million people, including 800,000 people belonging<br />
to high-risk populations (sex workers, men<br />
who have sex with men, migrants, youth and prisoners)<br />
were reached through HIV prevention activities;<br />
• 1.4 million people (including 3,800 pregnant women)<br />
were counseled and tested for HIV in 155 counseling<br />
and testing centers throughout the country;<br />
• 6,400 HIV-positive pregnant women received PMTCT<br />
treatment; and<br />
• 13,000 people were on ART.<br />
81. Malawi. Of the approved amount of<br />
US$ 375.2 million for HIV programs in Malawi,<br />
US$ 248.2 million had been disbursed by the end<br />
of 2009. A countrywide scale-up of ART and other<br />
interventions began in June 2004, primarily funded<br />
by the <strong>Global</strong> <strong>Fund</strong>. As of end 2009, 37,000 HIVpositive<br />
pregnant mothers had received PMTCT<br />
treat ment and 170,000 adults and children (45 percent<br />
of those eligible) were receiving ART. In 2009 alone,<br />
3.7 million people were counseled and tested for HIV.
82. <strong>Report</strong>s indicate that the rapid scale-up of ART<br />
in the country has had many positive results, including:<br />
• between 2002 and 2006, scale-up of ART allowed<br />
2,380 HIV-positive teachers to access life-prolonging<br />
treatment. Around 70 percent of the teachers who<br />
started treatment during this period were alive and<br />
on treatment at the end of 2006 (45);<br />
• 12 months after treatment initiation, 250 deaths<br />
had been averted among health workers in a country<br />
with scarce human resources. This translated to<br />
a combined work-time of over 1,000 staff-days per<br />
week – equivalent to the human resources needed<br />
to provide ART at national level (46); and<br />
• within eight months of the introduction of ART,<br />
overall adult mortality declined by 10 percent, and<br />
mortality among those with better access to ART<br />
services declined by 35 percent (47).<br />
83. South Africa. South Africa has stepped up<br />
a rapid expansion of HIV prevention, care and treatment<br />
services. Of the total approved amount<br />
of US$ 271.3 million, the <strong>Global</strong> <strong>Fund</strong> disbursed<br />
US$ 97.2 million for HIV grants and US$ 87.2 million<br />
for TB/HIV grants by the end of 2009 to support<br />
the South African efforts to respond to HIV. The support<br />
focused mainly on behavior change communication,<br />
provision of ART and TB/HIV collaborative activities.<br />
84. The Provincial Health Department of the Western<br />
Cape has been implementing an HIV/AIDS program<br />
with the support of the <strong>Global</strong> <strong>Fund</strong> since 2004, reaching<br />
1.7 million youths with peer education through<br />
17,500 trained volunteer peer educators. Other <strong>Global</strong><br />
<strong>Fund</strong>-supported projects provided 6,750 orphans and<br />
other vulnerable children with basic care and support<br />
and reached 2,800 people with income-generating<br />
activities. Initially, the <strong>Global</strong> <strong>Fund</strong> financed much of<br />
the scale-up of ART, but more recently the government<br />
has assumed financial responsibility for provision<br />
of ART.<br />
85. Through the <strong>Global</strong> <strong>Fund</strong>, the U.S.-based<br />
energy corporation Chevron – the <strong>Global</strong> <strong>Fund</strong>’s first<br />
Corporate Champion – is contributing US$ 5 million<br />
to the HIV/AIDS program in the Western Cape, as part<br />
of a larger US$ 30 million contribution to efforts<br />
to address the three diseases.<br />
86. Between December 2007 and December 2008,<br />
the number of people receiving ART in South Africa<br />
increased by 53 percent, from 458,951 to 700,500 (1).<br />
As ART coverage has increased, mortality rates, which<br />
had been rapidly increasing in previous years, stabilized<br />
(Figure 2.9).<br />
FIGURE 2.10 PREVALENCE OF HIV AMONG YOUNG WOMEN<br />
ATTENDING ANTENATAL CLINICS, NAMIBIA (2002–2008)<br />
PREVALENCE (PERCENTAGE TESTING HIV-POSITIVE)<br />
20<br />
20<br />
15<br />
10<br />
5<br />
0<br />
Note: The whiskers represent 95 percent confidence intervals of the estimates<br />
Source: Reference 48.<br />
15 TO 19 YEARS<br />
20 TO 24 YEARS<br />
2002 2004 2006 2008<br />
YEAR<br />
87. Namibia. Of the total approved amount of<br />
US$ 213.1 million for HIV programs in Namibia, the<br />
<strong>Global</strong> <strong>Fund</strong> had disbursed US$ 87.6 million by the<br />
end of 2009. Namibia initiated ART scale-up in 2004,<br />
with significant support from the <strong>Global</strong> <strong>Fund</strong> and<br />
PEPFAR, and achieved 69.5 percent ART coverage as<br />
of the end of 2009 for adults and children in need<br />
of treatment – up from nearly zero in 2003. At the end<br />
of 2009, 70,577 people were receiving ART. In addition,<br />
through <strong>Global</strong> <strong>Fund</strong>-supported programs, by the<br />
end of 2009:<br />
• 15,031 HIV-positive pregnant women had received<br />
PMTCT treatment;<br />
• 808,000 young people had been reached through<br />
extensive school-based and out-of-school youth<br />
HIV programs;<br />
• 625,000 adults had been reached through HIV/AIDS<br />
awareness community outreach services;<br />
• nearly 400,000 people had been counseled and<br />
tested for HIV;<br />
• over 91 million condoms had been distributed<br />
through social marketing and public outlets.<br />
88. As shown in Figure 2.10, HIV prevalence among<br />
young women declined between 2002 and 2008 (48),<br />
from 11 to 5.1 percent in women aged 15 to 19, and<br />
from 22 to 13.9 percent in women aged 20 to 24.<br />
Many of these declines have occurred since 2006.<br />
35 THE GLOBAL FUND <strong>2010</strong>: INNOVATION AND IMPACT results aND progress ON internatiONal targets
2.4.3 <strong>Progress</strong> on meeting TB<br />
targets: country examples<br />
89. Of the 25 countries with the greatest <strong>Global</strong><br />
<strong>Fund</strong> TB investments, 12 are on track to halve their<br />
TB prevalence by 2015 (Table 2.10). Seven of these<br />
countries are in Asia, two in Africa (Somalia and Zambia),<br />
one in America (Peru) and two in Eastern Europe<br />
(Romania and Tajikistan). Another four countries have<br />
reduced TB prevalence but need to intensify their<br />
efforts to achieve the 2015 target. In the remaining<br />
nine countries, all of which are in sub-Saharan Africa,<br />
TB prevalence has increased since 2000 because<br />
of the growth of the HIV epidemic in the region.<br />
90. <strong>Global</strong> <strong>Fund</strong> investments in TB/HIV services are<br />
increasing in a major way and this is expected to<br />
help address current shortcomings, but major efforts<br />
will be needed to more effectively treat and prevent<br />
TB/HIV co-infection. Some of the countries most in<br />
need are starting to benefit from grants approved<br />
in Rounds 8 and 9. For example, the Round 9 TB proposal<br />
of Nigeria was approved in November 2009<br />
for an amount of US$ 113 million. This is in addition to<br />
the US$ 64 million already approved for the country’s<br />
Round 5 TB proposal. In Congo (Democratic Republic),<br />
a Round 9 TB proposal will increase almost eight-fold<br />
the value of TB proposals approved by the <strong>Global</strong><br />
<strong>Fund</strong> there, from US$ 45 million to US$ 352 million.<br />
Afghanistan’s Round 8 TB proposal has added<br />
US$ 32.3 million to the country’s Round 4 proposal<br />
of US$ 3.5 million, while the Round 8 TB proposal<br />
of Bangladesh has nearly doubled approved TB funding<br />
from the <strong>Global</strong> <strong>Fund</strong> for the country from<br />
US$ 86 million to US$ 162 million.<br />
91. Although many challenges remain on the road to<br />
achieving MDG 6 and the Stop TB Partnership targets,<br />
many encouraging examples of national success are<br />
nevertheless emerging, including in countries where<br />
the <strong>Global</strong> <strong>Fund</strong> has made large disbursements for TB<br />
grants. By addressing financing gaps needed to expand<br />
national TB programs, the <strong>Global</strong> <strong>Fund</strong> has contributed<br />
to the positive results achieved in these countries.<br />
92. Bangladesh. The National TB Program of<br />
Bangladesh has made great strides in the scaling up of<br />
DOTS over the last decade, in part due to the active<br />
collaboration between the public health system and<br />
NGOs. Since 2004, the program has secured funding<br />
from the <strong>Global</strong> <strong>Fund</strong>. Of the total approved amount<br />
of US$ 90.5 million, US$ 54.3 million had been disbursed<br />
by the end of 2009, accounting for nearly half<br />
of the total National TB Program budget. The case<br />
detection rates for new smear-positive cases improved<br />
from 26 percent in 2000 to 66 percent in 2007, and<br />
treatment success improved from 81 to 92 percent<br />
FIGURE 2.11 TRENDS IN TB PREVALENCE AND MORTALITY,<br />
CHINA (2000–2008)<br />
INCIDENCE AND PREVALENCE, PER 100,000<br />
140<br />
120<br />
100<br />
80<br />
60<br />
40<br />
20<br />
0<br />
Source: References 49, 50.<br />
among such cases. During the same period, there has<br />
been an annual decline in estimated incidence<br />
(from 239 to 223 per 100,000 population), prevalence<br />
(from 500 to 387 per 100,000 population) and mortality<br />
(from 58 to 44 per 100,000 population) (10).<br />
Bangladesh represents a unique model where NGOs<br />
have traditionally supported the national program<br />
in expanding the outreach and quality of DOTS through<br />
the involvement of communities.<br />
93. China. The <strong>Global</strong> <strong>Fund</strong> has made a substantial<br />
contribution to China’s TB control efforts, with a total<br />
approved amount of US$ 452.3 million, of which<br />
US$ 165.6 million was disbursed by the end of 2009,<br />
accounting for about 15 percent of the national TB<br />
program budget. In 2007, China had achieved 100 percent<br />
DOTS coverage and an 80 percent case detection<br />
rate for new smear-positive cases (10, 49). Treatment<br />
success reached 93 percent, exceeding the international<br />
target of at least 85 percent (10, 50).<br />
94. The TB burden in China has been steadily declining<br />
(49, 51) (Figure 2.11). Between 2000 and 2008:<br />
• smear-positive TB incidence decreased from 47.4 to<br />
44.2 per 100,000 population;<br />
• smear-positive TB prevalence declined steadily from<br />
122 to 87 per 100,000 population; and<br />
• the TB mortality rate declined from 9.8 to 5.4 per<br />
100,000 population.<br />
tb INCIDENCE, ALL<br />
smear-POSITIVE TB PREVALENCE<br />
TB MORTALITY<br />
2000 2008<br />
YEAR<br />
12<br />
10<br />
8<br />
6<br />
4<br />
2<br />
0<br />
MORTALITY, PER 100,000
A YOUNG MAN VISITS a DISPENSARY FOR HIS DAILY TB TREATMENT. CHINA HAS THE<br />
WORLD’s SECOND-HIGHEST NUMBER OF TB PATIENTS BUT WITH GLOBAL FUND ASSISTANCE<br />
80 PERCENT OF NEW CASES ARE TREATED.<br />
37 THE GLOBAL FUND <strong>2010</strong>: INNOVATION AND IMPACT results aND progress ON internatiONal targets
TABLE 2.10 TB PREVALENCE IN THE 25 COUNTRIES WITH THE GREATEST CUMULATIVE GLOBAL FUND INVESTMENTS<br />
IN TB EFFORTS<br />
COUNTRY<br />
BASELINE – 2000<br />
TB PREVALENCE<br />
PER 100,000<br />
2007 RESULT – TB<br />
PREVALENCE PER<br />
100,000<br />
PERCENT DECLINE,<br />
2000–2007<br />
2007 INTERIM<br />
TARGET – TB<br />
PREVALENCE PER<br />
100,000<br />
2007 RESULT – TB<br />
PREVALENCE,<br />
EXPRESSED AS<br />
PERCENTAGE OF<br />
INTERIM 2007<br />
TB PREVALENCE<br />
TARGET<br />
GLOBAL FUND<br />
DISBURSEMENTS<br />
TO TB PROGRAMS,<br />
MILLIONS OF US$<br />
CHINA 269 194 28 220 152 165.6<br />
RUSSIAN FEDERATION 164 115 30 104 81 97<br />
INDIA 443 283 36 373 > 200 91.5<br />
INDONESIA 326 244 25 277 168 89.1<br />
SOUTH AFRICA 515 692 -34 454 -291 87.2<br />
TANZANIA 391 426 -9 259 -26 70<br />
BANGLADESH 500 387 23 416 134 54.3<br />
PERU 210 136 35 204 > 200 44.3<br />
PHILIPPINES 600 500 17 506 107 44.3<br />
SUDAN 375 402 -7 295 -34 42.5<br />
CONGO<br />
(DEMOCRATIC REPUBLIC)<br />
592 666 -13 380 -35 35<br />
ETHIOPIA 486 579 -19 332 -60 34.9<br />
PAKISTAN 413 223 46 321 > 200 33.8<br />
ZAMBIA 658 387 41 453 132 32<br />
NIGERIA 489 521 -7 327 -20 31.7<br />
GHANA 368 353 4 321 32 29.9<br />
RWANDA 442 590 -33 280 -91 27.7<br />
THAILAND 223 192 14 197 121 24.1<br />
ROMANIA 197 128 35 133 107 23.1<br />
MOLDOVA 215 151 30 139 84 21.8<br />
ZIMBABWE 479 714 -49 351 -183 20.4<br />
SOMALIA 414 352 15 360 115 18.7<br />
TAJIKISTAN 56 33 41 75 > 200 16.5<br />
BURKINA FASO 338 403 -19 222 -56 16.2<br />
CAMBODIA 758 664 12 621 69 16.2<br />
Notes: A key target from the Stop TB Partnership is to halve the 1990 TB prevalence (not shown) by 2015. This was used to set 2015 target (not shown). Targets for 2007<br />
(column 5) were interpolated linearly between 2000 baseline figures (column 2) and the 2015 target. <strong>Progress</strong> towards interim 2007 targets (column 6) was calculated as the<br />
ratio of observed percent decline (column 4) over expected percent decline (column 5 from column 2). Therefore, 100 percent means on track to achieve 2015 targets,<br />
assuming there will be a linear decline. Disbursement refers to all TB activities.<br />
Source: Reference 10.
95. However, MDR-TB is increasing in some parts<br />
of China and is becoming a major challenge.<br />
96. Cambodia. Cambodia, one of the 22 high-burden<br />
TB countries in the world, has intensified TB control<br />
efforts with support from the <strong>Global</strong> <strong>Fund</strong>. Of the total<br />
approved amount of US$ 22.8 million for TB programs<br />
in Cambodia, US$ 16.2 million had been disbursed by<br />
the end of 2009. With full geographic coverage with<br />
DOTS, Cambodia has achieved a 61 percent case detection<br />
rate for new smear-positive TB cases and achieved<br />
treatment success in 93 percent of cases (10). Consequently,<br />
TB prevalence and mortality rates in Cambodia<br />
have declined since 2000 (Figure 2.12).<br />
97. Viet Nam. Since 2004, the <strong>Global</strong> <strong>Fund</strong> has been<br />
one of the major sources of funding for TB control<br />
efforts in Viet Nam. Of the total approved amount of<br />
US$ 19.1 million, US$ 10.6 million had been disbursed<br />
by the end of 2009. TB case detection rates of 82 percent<br />
and treatment success rates of 92 percent exceed<br />
international targets, and Viet Nam has seen TB prevalence<br />
and mortality decline consistently (Figure 2.13).<br />
98. Somalia. Since 2004, the <strong>Global</strong> <strong>Fund</strong> has been<br />
able to channel substantial amounts of funding to support<br />
TB control efforts in Somalia, despite the country<br />
being in a state of civil war. The Principal Recipient<br />
has been World Vision Somalia. Of US$ 22.6 million<br />
approved to support the TB program, US$ 18.7 million<br />
was disbursed by the end of 2009. TB efforts have<br />
had impressive results. The smear-positive TB case<br />
detection rate has reached 64 percent and treatment<br />
success is achieved in 89 percent of cases (10). TB<br />
prevalence declined from 414 per 100,000 population<br />
in 2000 to 352 in 2007. Over the same period, TB<br />
mortality decreased from 67 to 55 per 100,000.<br />
99. Philippines. The TB control program in the<br />
Philippines has received support from the <strong>Global</strong> <strong>Fund</strong><br />
to support DOTS expansion as well as treatment<br />
of MDR-TB and TB/HIV. Of the approved amount of<br />
US$ 123.5 million, US$ 44.3 million had been disbursed<br />
by the end of 2009. Some encouraging results have<br />
been accomplished. Between 2000 and 2007, TB<br />
incidence declined from 329 to 290 per 100,000 population.<br />
In the same time period, the estimated<br />
prevalence of (all forms of) TB also declined, from<br />
600 to 500 per 100,000 population (10).<br />
FIGURE 2.12 TRENDS IN TB PREVALENCE AND MORTALITY,<br />
CAMBODIA (2000–2007)<br />
TB PREVALENCE PER 100,000 POPULATION<br />
780<br />
760<br />
740<br />
720<br />
700<br />
680<br />
660<br />
640<br />
620<br />
600<br />
Source: Reference 10.<br />
FIGURE 2.13 TRENDS IN TB PREVALENCE AND MORTALITY,<br />
VIET NAM (2000–2007)<br />
TB PREVALENCE PER 100,000 POPULATION<br />
260<br />
250<br />
240<br />
230<br />
220<br />
210<br />
200<br />
2000 2001 2002 2003 2004 2005 2006 2007<br />
YEAR<br />
tb PREVALENCE<br />
TB MORTALITY<br />
2000 2001 2002 2003 2004 2005 2006 2007<br />
YEAR<br />
tb PREVALENCE<br />
TB MORTALITY<br />
84<br />
82<br />
80<br />
78<br />
76<br />
74<br />
72<br />
24<br />
23<br />
22<br />
21<br />
20<br />
19<br />
18<br />
TB MORTALITY PER 100,000 POPULATION<br />
TB MORTALITY PER 100,000 POPULATION<br />
39 THE GLOBAL FUND <strong>2010</strong>: INNOVATION AND IMPACT results aND progress ON internatiONal targets<br />
Source: Reference 10.
2.4.4 <strong>Progress</strong> on meeting malaria<br />
targets: country examples<br />
100. In countries where malaria is endemic, it causes<br />
a large proportion of child deaths. Of the 25 countries<br />
of sub-Saharan Africa where the <strong>Global</strong> <strong>Fund</strong> has<br />
made the greatest investments to fight malaria, Malawi<br />
and Rwanda have made remarkable progress towards<br />
reducing their under-five mortality rate by two-thirds<br />
by 2015. Child mortality in 20 of the other countries<br />
has declined, with Ethiopia, Ghana, Mozambique and<br />
Niger making substantial progress towards the target.<br />
In contrast, child mortality rates have not decreased<br />
in Kenya, Congo (Democratic Republic) and Somalia<br />
(Table 2.11).<br />
101. The <strong>Global</strong> <strong>Fund</strong> continues to be the major international<br />
funder of the rapid scale-up of malaria vector<br />
control activities, notably the distribution of ITNs and<br />
indoor residual spraying. <strong>Fund</strong>ing it has provided has<br />
also played a key role in introducing and scaling up<br />
ACT as a first-line malaria treatment in many countries<br />
where drug resistance to other treatments is high. In<br />
Africa, Swaziland and some island states and territories<br />
are now aspiring to enter the malaria pre-elimination<br />
stage. The <strong>Global</strong> <strong>Fund</strong> also provides resources outside<br />
of Africa to eliminate malaria. Of ten countries where<br />
malaria elimination programs are underway, five have<br />
TABLE 2.11 CHILD MORTALITY IN THE 25 COUNTRIES WITH THE GREATEST GLOBAL FUND CUMULATIVE INVESTMENTS<br />
IN MALARIA EFFORTS<br />
COUNTRY<br />
BASELINE – 2000<br />
CHILD MORTALITY<br />
PER 1,000 LIVE<br />
BIRTHS<br />
2008 RESULT –<br />
CHILD MORTALITY<br />
PER 1,000 LIVE<br />
BIRTHS<br />
PERCENT DECLINE,<br />
2000–2008<br />
2008 INTERIM<br />
TARGET – CHILD<br />
MORTALITY PER<br />
1,000 LIVE BIRTHS<br />
2008 RESULT –<br />
CHILD MORTALITY,<br />
AS PERCENTAGE OF<br />
2008 INTERIM CHILD<br />
MORTALITY TARGET<br />
GLOBAL FUND<br />
DISBURSEMENTS TO<br />
MALARIA PROGRAMS<br />
(MILLIONS OF US$,<br />
DEC. 2009)<br />
NIGERIA 207 186 10 137 30 296.4<br />
ETHIOPIA 148 109 26 106 93 250.1<br />
TANZANIA 139 104 25 92 75 186.9<br />
UGANDA 158 135 15 106 45 121.1<br />
CONGO<br />
(DEMOCRATIC REPUBLIC)<br />
199 199 0 128 0 120.8<br />
RWANDA 186 112 40 117 108 107.5<br />
KENYA 128 128 0 78 0 107.2<br />
SUDAN 115 109 5 75 15 100.3<br />
MADAGASCAR 132 106 20 91 63 76.1<br />
GHANA 111 76 32 73 91 74.8<br />
ZAMBIA 169 148 12 109 35 70.5<br />
ANGOLA 239 220 8 157 23 50.8<br />
NIGER 227 167 26 160 89 50.4<br />
ZIMBABWE 102 96 6 62 15 48.3<br />
SENEGAL 131 108 18 87 53 42.3<br />
CAMEROON 147 131 11 95 31 36.4<br />
MOZAMBIQUE 183 130 29 129 99 36.6<br />
BURUNDI 178 168 6 116 16 33.6<br />
MALAWI 162 100 38 115 132 36.6<br />
BURKINA FASO 188 169 10 123 29 29.2<br />
GAMBIA 131 106 19 88 58 26.2<br />
SOMALIA 200 200 0 129 0 25.1<br />
TOGO 122 98 20 83 62 21.8<br />
LIBERIA 174 145 17 120 53 21.4<br />
CÔTE D'IVOIRE 138 114 17 91 51 20.5<br />
Note: The target for MDG 4 is to reduce under-five mortality by 2015 two-thirds from its 1990 level. The 2008 targets (column 5) were interpolated linearly between the<br />
2000 baseline (column 2) and the 2015 target. <strong>Progress</strong> towards interim 2008 targets (column 6) was calculated as the ratio of observed percent decline (column 4)<br />
over expected percent decline. Therefore, 100 percent means a country is on track to achieve 2015 targets assuming a linear decline. Disbursement totals cover all<br />
malaria-related activities.<br />
Source: data on 1990 baselines, 2000 baselines and 2008 results data are from reference 32.
eceived malaria investments from the <strong>Global</strong> <strong>Fund</strong><br />
totaling US$ 19 million: Azerbaijan, Georgia, Kyrgyzstan,<br />
Tajikistan and Uzbekistan. US$ 16 million has been<br />
disbursed to Sri Lanka, which has now entered the<br />
malaria pre-elimination stage. An increasing number of<br />
<strong>Global</strong> <strong>Fund</strong>-supported malaria programs are demonstrating<br />
reductions in malaria morbidity and mortality.<br />
102. Zambia. Malaria control efforts in Zambia received<br />
substantial support from the <strong>Global</strong> <strong>Fund</strong> to increase<br />
coverage of both vector control interventions and<br />
malaria case management. Of the total approved<br />
amount of US$ 99.7 million, as of the end of 2009<br />
US$ 70.5 million had been disbursed. Results achieved<br />
in Zambia include:<br />
• ACT was adopted as the first-line therapy in 2003<br />
and became available nationwide in 2004;<br />
• 5.6 million ITNs were distributed between 2003<br />
and the end of 2009. In 2008, 62 percent of<br />
Zambian households had at least one ITN, compared<br />
to 38 percent in 2006. In households with at least<br />
one net, 61 percent of children under the age of five<br />
and 50 percent of pregnant women slept under<br />
a mosquito net (52);<br />
• coverage of indoor residual spraying, in terms<br />
of the number of dwellings sprayed, increased nearly<br />
ten-fold between 2003 and 2008 (52);<br />
• anemia prevalence in children declined from<br />
14 percent in 2006 to 4 percent in 2008 (52); and<br />
• the number of inpatient malaria cases declined<br />
by 61 percent between 2001 and 2008. In the same<br />
period, the number of malaria deaths fell by<br />
66 percent. The decline between 2003 and 2006<br />
was 30 percent, compared to a 2 percent<br />
decrease between 2001 and 2003 (53).<br />
103. Trends in malaria and anemia prevalence in children<br />
under five years of age from two population-based<br />
surveys and malaria mortality trends from health facility<br />
data in Zambia are shown in Figure 2.14.<br />
104. Sao Tome and Principe. Sao Tome and Principe,<br />
two small African islands, have succeeded in reducing<br />
the malaria burden to the pre-elimination level.<br />
The <strong>Global</strong> <strong>Fund</strong> continues to support efforts in Sao<br />
Tome and Principe, with approved grants totaling<br />
US$ 7.6 million and disbursements of US$ 4.8 million<br />
by the end of 2009. Positive results and impacts<br />
achieved include:<br />
• the introduction of ACT as the first-line antimalarial<br />
drug in 2003 (54);<br />
• high population coverage with indoor residual<br />
spraying (70 to 80 percent in 2007) (54);<br />
• targeted ITN distribution to pregnant women and to<br />
children under the age of five, resulting in 78.3 percent<br />
of households owning at least one ITN in 2007;<br />
FIGURE 2.14 ANNUAL TRENDS IN MALARIA INFECTION<br />
PREVALENCE, MALARIA-ATTRIBUTABLE DEATHS AND<br />
ANEMIA PREVALENCE IN zAMBIA (2001–2007)<br />
NUMBER OF DEATHS<br />
10,000<br />
8,000<br />
6,000<br />
4,000<br />
2,000<br />
0<br />
Source: Reference 52, 53.<br />
2001 2002 2003 2004 2005 2006 2007 2008<br />
YEAR<br />
MALARIA ATTRIBUTABLE DEATHS (ALL AGE GROUPS)<br />
MALARIA AS PERCENTAGE OF ALL DEATHS<br />
(ALL AGE GROUPS)<br />
MALARIA IN CHILDREN UNDER FIVE<br />
ANEMIA IN CHILDREN UNDER FIVE<br />
• an increase in the percentage of children sleeping<br />
under ITNs from 1 percent in 1996 to 40 percent<br />
in 2004 and 57.9 percent in 2005; and<br />
• a 98 percent reduction in malaria mortality (from<br />
116 per 100,000 population in 2004 to 2 per 100,000<br />
in 2007) and a 95 percent decline in malaria incidence<br />
(from 465 per 100,000 population in 2004<br />
to 22 per 100,000 in 2007) (55).<br />
105. Namibia. Namibia is one of only a few southern<br />
African nations that are on the verge of entering the<br />
malaria pre-elimination phase (56). Of the approved<br />
amount of US$ 22.7 million for malaria programs,<br />
US$ 14.7 million had been disbursed by the end of<br />
2009. The national malaria control program has used<br />
<strong>Global</strong> <strong>Fund</strong> contributions to help it achieve the<br />
following results:<br />
• 52 percent population coverage with indoor residual<br />
spraying in 2008;<br />
• nearly 600,000 LLINs distributed during 2005–<br />
2008, with a further 151,000 in 2009;<br />
• ACT introduced as the first-line antimalarial treatment<br />
in 2005;<br />
• steep declines in malaria incidence (Figure 2.15)<br />
and mortality in recent years (56, 57).<br />
30<br />
25<br />
20<br />
15<br />
10<br />
5<br />
0<br />
MALARIA AND ANEMIA PREVALENCE<br />
41 THE GLOBAL FUND <strong>2010</strong>: INNOVATION AND IMPACT results aND progress ON internatiONal targets
THE NUMBER OF CASES OF PEOPLE DYING OF MALARIA IN NIGER WAS REDUCED<br />
BY HALF FOLLOWING a MASSIVE INSECTICIDE TREATED NET CAMPAIGN.<br />
THE GLOBAL FUND FINANCED THE FREE DISTRIBUTION OF MORE THAN 2 MILLION<br />
INSECTICIDE-TREATED NETS.
FIGURE 2.15 ANNUAL TRENDS OF MALARIA INCIDENCE, NAMIBIA (1996–2007)<br />
300<br />
250<br />
INCIDENCE PER 1,000<br />
200<br />
150<br />
100<br />
50<br />
0<br />
1996 1997 1998 1999 2000 2001 2002 2003 2004 2005 2006 2007<br />
YEAR<br />
43 THE GLOBAL FUND <strong>2010</strong>: INNOVATION AND IMPACT INtrODuctiON<br />
Source: References 56, 57.<br />
106. Rwanda. In 2006, the Rwandan Ministry of Health<br />
launched a massive scale-up of LLINs and ACT. Of an<br />
approved amount of US$ 131.1 million for malaria grants,<br />
the <strong>Global</strong> <strong>Fund</strong> had disbursed US$ 107.5 million as<br />
of the end of 2009. The massive scale-up of malaria<br />
interventions has led to a rapid decline in malaria<br />
cases and has freed up capacity in the health system<br />
to manage other health problems. Data from selected<br />
health facilities show that inpatient malaria cases in<br />
2007 declined by 56 percent compared to the annual<br />
average for the years 2001–2006. At the same time,<br />
there was a 59 percent increase in non-malaria inpatient<br />
cases in 2007, as hospital beds became available<br />
for the treatment of other diseases (58).<br />
107. Bhutan. Malaria control efforts in Bhutan have<br />
benefited from <strong>Global</strong> <strong>Fund</strong> investments, with approved<br />
funding of US$ 3.8 million, of which US$ 3.1 million<br />
had been disbursed as of the end of 2009. This has<br />
helped the country achieve high intervention coverage<br />
levels, although providing interventions in some<br />
remote and inaccessible rural areas remains a challenge<br />
(59). As of the end of 2009, 110,000 ITNs had<br />
been distributed thanks to funds provided by the<br />
<strong>Global</strong> <strong>Fund</strong>, and indoor residual spraying was undertaken<br />
in 83,000 dwellings. The incidence of both<br />
probable and confirmed cases of malaria declined<br />
sharply between 2005 and 2008 (Figure 2.16) Malaria<br />
morbidity and mortality also declined, by 20 and<br />
28 percent, respectively (60).<br />
FIGURE 2.16 MALARIA INCIDENCE In BHUTAN (2005–2008)<br />
NUMBER OF CONFIRMED MALARIA CASES<br />
2,000<br />
1,800<br />
1,600<br />
1,400<br />
1,200<br />
1,000<br />
800<br />
600<br />
400<br />
200<br />
0<br />
Source: Reference 60.<br />
2005<br />
2006<br />
YEAR<br />
2007<br />
MICROSCOPY-CONFIRMED MALARIA<br />
slide POSITIVITY RATE<br />
2008<br />
3.5<br />
3<br />
2.5<br />
2<br />
1.5<br />
1<br />
0.5<br />
0<br />
slide POSITIVITY RATE, PERCENTAGE
BOX 2.3 GrANT PErFOrmANCE rATING<br />
ANd dISBUrSEmENT dECISION-mAKING<br />
mEThodOLOGY<br />
The <strong>Global</strong> <strong>Fund</strong> makes decisions based on performance to ensure that<br />
investments are made where impact in alleviating the burden of HIV, TB<br />
and malaria can be achieved. Consistent with its performance-based funding<br />
model, the <strong>Global</strong> <strong>Fund</strong> Secretariat routinely assesses grant performance<br />
and links the outcome of this assessment to a disbursement decision.<br />
In 2008, the <strong>Global</strong> <strong>Fund</strong> introduced a new Grant Performance Rating and<br />
Disbursement Decision-making Methodology in order to: 1) ensure a more<br />
consistent assessment of grant performance; and 2) strengthen the relationship<br />
between grant performance and disbursement decisions.<br />
This methodology comprises two major steps:<br />
1. Assigning a performance rating: The performance rating of a grant<br />
is based on: 1) the overall progress achieved against time-bound targets<br />
for key output indicators; and 2) an assessment of management<br />
performance (notably in the areas of M&E, financial management and<br />
systems, pharmaceutical and health products management, and program<br />
management). The programmatic achievements are the primary<br />
factor in deriving the grant performance rating; however this initial<br />
rating based on programmatic performance may be downgraded due<br />
to critical management issues (e.g. poor data quality, procurement<br />
delays and ineligible expenditures).<br />
2.5 Results of<br />
performancebased<br />
funding<br />
108. Performance of <strong>Global</strong> <strong>Fund</strong> programs is measured<br />
against country-owned targets that are ambitious<br />
yet realistic for the country context. A review of performance<br />
is undertaken at the time of each disbursement,<br />
and a more comprehensive review including outcomes<br />
and impact occurs by year two of the grant. The performance-based<br />
funding approach is part of the <strong>Global</strong><br />
<strong>Fund</strong>’s application of the principle of “managing for<br />
results” to all its financing, agreed by donors and countries<br />
as central to improving the effectiveness of aid.<br />
109. This section assesses the results of performancebased<br />
funding in three areas: overall program<br />
performance (Section 2.5.1), learning from program<br />
performance (Section 2.5.2) and contributions to<br />
value for money (Section 2.5.3).<br />
A1 A2 B1 B2 C<br />
EXCEEDING<br />
EXPECTATIONS<br />
MEETS<br />
EXPECTATIONS<br />
ADEQUATE<br />
INADEQUATE<br />
BUT POTENTIAL<br />
DEMONSTRATED<br />
>100% 100–90% 60–89% 30–59%
2.5.1 Overall program<br />
performance<br />
110. By 2009, 436 grants had been reviewed for further<br />
funding in year two of implementation. Overall,<br />
78 percent of programs were assessed as performing<br />
well (and were rated A or B1, see Box 2.3 for a description<br />
of the grant performance rating methodology).<br />
Nineteen percent were assessed as performing inadequately,<br />
but demonstrating potential and requiring<br />
strong strengthening actions. These programs were<br />
rated B2. Three percent of programs were assessed<br />
as demonstrating unacceptable performance and rated<br />
C (Figure 2.17).<br />
111. Trends in grant performance. Over the years, an<br />
increasing number of grants have been rated A or B1<br />
(“performing well”) and fewer grants have been rated<br />
B2 or C (Figure 2.18).<br />
112. Performance against key programmatic targets.<br />
Performance against targets for the <strong>Global</strong> <strong>Fund</strong>’s top<br />
ten programmatic areas (See Figure 2.19) shows that,<br />
on average, the HIV programs performed well against<br />
the targets set in the four programmatic areas relating<br />
to HIV, namely the number of people currently on ART<br />
(99 percent of the target reached), counseling and<br />
testing (122 percent of the target reached), PMTCT<br />
(84 percent of the target reached), and orphans and<br />
other vulnerable children supported (140 percent of<br />
the target reached). TB programs also performed well,<br />
with DOTS coverage and treatment reaching<br />
101 percent and MDR-TB treatment reaching 84 percent.<br />
Malaria programs were not performing as well.<br />
While programs achieved 83 percent of targets for<br />
distribution of ITNs, they only reached 61 percent of<br />
the target for antimalarial treatment.<br />
113. Currently, the <strong>Global</strong> <strong>Fund</strong> is devoting particular<br />
attention to further improving the performance of<br />
malaria programs and PMTCT programs. With several<br />
partners, it is undertaking an effort to accelerate scaleup<br />
of PMTCT services (see Section 2.7 for more<br />
information). With regard to malaria programs, the<br />
<strong>Global</strong> <strong>Fund</strong> is hosting the “Affordable Medicines<br />
Facility – malaria” (AMFm – see Section 4.4 for more<br />
information) and, together with its partners, undertaking<br />
other initiatives to increase access to antimalarial<br />
treatment, including improving diagnostic capacities<br />
and implementing strategies for home-based management<br />
of fevers in endemic countries (61).<br />
FIGURE 2.17 CUMULATIVE DISTRIBUTION OF PROGRAM<br />
PERFORMANCE (2005–2009)<br />
number OF GRANTS<br />
240<br />
200<br />
160<br />
120<br />
80<br />
40<br />
78 PERCENT ARE<br />
PERFORMING WELL<br />
111<br />
230<br />
14<br />
26% 52% 19% 3%<br />
0<br />
A B 1 B 2 C<br />
81<br />
grant PERFORMANCE RATING<br />
Source: Grant scorecards for grants reviewed at Phase 2 from 2005 through December 2009,<br />
www.theglobalfund.org.<br />
FIGURE 2.18 GRANT PERFORMANCE RATINGS AT PHASE 2<br />
REVIEW, BY YEAR (2005–2009)<br />
percentage<br />
100<br />
80<br />
60<br />
40<br />
20<br />
A B1 B2/C<br />
45 THE GLOBAL FUND <strong>2010</strong>: INNOVATION AND IMPACT results aND progress ON internatiONal targets<br />
0<br />
2005 2006 2007 2008 2009<br />
YEAR<br />
Source: Grant scorecards, www.theglobalfund.org.
FIGURE 2.19 ACHIEVEMENT AGAINST TARGETS FOR KEY PROGRAMMATIC AREAS, CUMULATIVE, FOR ALL PHASE 2 GRANT<br />
EVALUATIONS (2005–2009)<br />
PEOPLE CURRENTLY ON ART<br />
COUNSELING & TESTING<br />
99%<br />
122%<br />
PMTCT<br />
SUPPORT FOR ORPHANS<br />
& OTHER VULNERABLE CHILDREN<br />
84%<br />
140%<br />
DOTS<br />
101%<br />
MDR-TB TREATMENT<br />
84%<br />
ITNs DISTRIBUTED<br />
antimalarial TREATMENT<br />
61%<br />
83%<br />
CARE & SUPPORT<br />
PEOPLE TRAINED<br />
105%<br />
113%<br />
0% 50% 100%<br />
150%<br />
Note: Grant scorecards, www.theglobalfund.org.<br />
FIGURE 2.20 GRANT PERFORMANCE BY DISEASE,<br />
CUMULATIVE TO THE END OF 2009<br />
FIGURE 2.21 GRANT PERFORMANCE BY TYPE OF PRINCIPAL<br />
RECIPIENT, CUMULATIVE TO THE END OF 2009<br />
HIV<br />
18<br />
27<br />
52<br />
A<br />
b1<br />
b2<br />
c<br />
government<br />
21<br />
22<br />
53<br />
A<br />
b1<br />
b2<br />
c<br />
3<br />
4<br />
29<br />
36<br />
TB<br />
14<br />
55<br />
civil SOCIETY<br />
14<br />
48<br />
2<br />
2<br />
19<br />
22<br />
MALARIA<br />
25<br />
51<br />
UNDP<br />
20<br />
57<br />
5<br />
1<br />
0 20<br />
40 60<br />
PERCENTAGE OF GRANTS BY RATING<br />
0 20<br />
40 60<br />
PERCENTAGE OF GRANTS BY RATING<br />
Note: HIV includes HIV/TB, integrated, and Round 5 health system strengthening components.<br />
Source: Grant scorecards, www.theglobalfund.org.<br />
Source: Grant scorecards, www.theglobalfund.org.
2.5.2 Learning from grant<br />
performance: trends by disease,<br />
implementer and region<br />
114. The <strong>Global</strong> <strong>Fund</strong> aims to learn from trends in<br />
program performance by disease, Principal Recipient<br />
and region, and monitors developments carefully<br />
to ensure that performance-based funding does not<br />
penalize poorer countries and those with weaker<br />
health systems.<br />
115. Performance by disease. TB grants tend to perform<br />
slightly better (84 percent with A or B1 ratings)<br />
than HIV and malaria grants (with 79 percent and<br />
70 percent, respectively) (Figure 2.20). This could be<br />
because TB programs can often build on existing national<br />
strategies which, in many countries, have been<br />
in place for more than 20 years. In addition, they<br />
benefit from a coordinated partnership approach to<br />
technical assistance for TB. The Stop TB Partnership,<br />
hosted by WHO, provides a comprehensive package<br />
of technical assistance to programs, with well-coordinated<br />
and well-defined partner roles within national<br />
TB strategies.<br />
116. Performance by implementer. On average,<br />
84 percent of grants managed by civil society organizations<br />
are rated A or B1, demonstrating the ability<br />
of civil society organizations to deliver services, particularly<br />
to at-risk and vulnerable populations. Seventyfive<br />
percent of grants managed by government<br />
Principal Recipients, and 79 percent of those managed<br />
by UNDP are rated A or B1 (Figure 2.21). It should<br />
be noted that UNDP usually implements grants in difficult<br />
situations and fragile states, where local capacity<br />
is lacking.<br />
FIGURE 2.22 GRANT PERFORMANCE BY REGION,<br />
CUMULATIVE TO THE END OF 2009<br />
ASIA<br />
EASTERN EUROPE<br />
AND CENTRAL ASIA<br />
LATIN AMERICA<br />
AND CARIBBEAN<br />
MIDDLE EAST AND<br />
NORTH AFRICA<br />
SUB-SAHARAN AFRICA<br />
2<br />
3<br />
3<br />
5<br />
14<br />
16<br />
20<br />
21<br />
23<br />
25<br />
25<br />
29<br />
36<br />
49<br />
51<br />
52<br />
61<br />
A<br />
b1<br />
b2<br />
c<br />
66<br />
47 THE GLOBAL FUND <strong>2010</strong>: INNOVATION AND IMPACT results aND progress ON internatiONal targets<br />
117. Performance by region. Most programs in sub-<br />
Saharan Africa perform well, with 70 percent rated<br />
A or B1. However, in some regions, 85 percent of programs<br />
are rated A or B1 and the proportion of poorly<br />
performing programs rated B2 or C in sub-Saharan<br />
Africa, at 30 percent, is higher than in any other region<br />
(Figure 2.22). The reasons for these differences are<br />
being investigated by the <strong>Global</strong> <strong>Fund</strong> Secretariat<br />
to inform measures to further strengthen support to<br />
countries with poorly performing grants.<br />
0 10 20 30 40 50 60 70<br />
PERCENTAGE OF GRANTS BY RATING<br />
Source: Grant scorecards, www.theglobalfund.org.
TABLE 2.12 FUNDING REALLOCATION AT PHASE 2 BY GRANT PERFORMANCE RATING (2005–2009)<br />
GRANT PERFORMANCE<br />
RATING<br />
ORIGINAL PHASE 2 AMOUNT<br />
(US$ MILLIONS)<br />
PERCENTAGE OF “NO GO”<br />
DECISIONS<br />
REDUCTIONS IN GRANT<br />
FUNDING AT PHASE 2<br />
(US$ MILLIONS) 1<br />
PERCENTAGE OF FUNDING<br />
REALLOCATED TO OTHER<br />
GRANTS<br />
A 1,644 0 135 8.2<br />
B1 3,916 0 377 9.6<br />
B2 1,327 5.0 361 27.2<br />
C 108 59.1 82 76.1<br />
OVERALL 6,996 1.9 956 13.7<br />
1 Reductions due to performance and efficiency gains, as well as “No Go” decisions.<br />
Note: Figures have been rounded.<br />
118. Performance in fragile states. According to the<br />
World Bank, the world’s 48 fragile states (62) have<br />
a total population of about 1 billion. By the end of<br />
2009, the <strong>Global</strong> <strong>Fund</strong> had committed US$ 5.9 billion<br />
(41 percent of its overall portfolio) and disbursed<br />
US$ 4 billion to programs in fragile states. Programs<br />
in fragile states have enabled 883,000 people to<br />
access ART, identified and treated 1.9 million new<br />
smear-positive TB cases under DOTS, and distributed<br />
60 million ITNs. This represents 31 to 58 percent of<br />
the total <strong>Global</strong> <strong>Fund</strong> results, which is roughly in line<br />
with the monetary commitment.<br />
119. Grants in fragile states are performing only slightly<br />
less well than grants in other countries – 73 percent<br />
of grants are rated A or B1, compared to 82 percent of<br />
grants in other countries.<br />
120. Learning from poor performance. Countries with<br />
poorly performing grants have usually been able<br />
to respond rapidly to address the problems which led<br />
to poor performance. With a few exceptions, country<br />
programs that have had a “No Go” grant have shown<br />
significant improvements and have since signed new<br />
and more successful grants.<br />
2.5.3 CONTrIBUTIONS OF<br />
PErFOrmANCE-BASEd FUNdING<br />
TO VALUE-FOr-mONEY<br />
122. Improving value-for-money through Phase 2<br />
reviews. Each grant is initially awarded for a two-year<br />
period, the so-called Phase 1 of a grant. The Country<br />
Coordinating Mechanism (CCM) then requests funding<br />
beyond that period, and the <strong>Global</strong> <strong>Fund</strong> Board<br />
approves continued funding for Phase 2 of a grant<br />
based on a detailed assessment of results against<br />
targets and the availability of funds. Phase 2 reviews<br />
also allow for identification of unused funds and<br />
efficiency savings in grants that have underperformed<br />
in the first two years of implementation. This, in turn,<br />
allows for increases in efficiency for subsequent years,<br />
and also for the reallocation of funds that are not<br />
used elsewhere. This process has enabled the reallocation<br />
between grants of more than US$ 950 million<br />
between 2005 and December 2009 (Table 2.12), contributing<br />
to new programs and additional services<br />
for people in need.<br />
121. In many funding systems for development, problems<br />
may lie hidden or difficult decisions can be<br />
delayed for years, preventing corrective action until<br />
a full failure occurs. The advantage of the <strong>Global</strong><br />
<strong>Fund</strong>’s performance-based funding system is that difficult<br />
issues can be discovered and addressed rapidly,<br />
transparently and constructively.
2.6 Ensuring<br />
equitable access<br />
to services<br />
“The <strong>Global</strong> <strong>Fund</strong> has been useful in giving visibility<br />
and recognition [of HIV] and raising the awareness of<br />
populations that are most vulnerable to the epidemic.<br />
Above all it helped mitigate prejudices.”<br />
– MARIELA CASTRO<br />
PRESIDENT OF NATIONAL CENTER FOR SEX EDUCATION<br />
CUBA<br />
123. Equity (see Box 2.4) is fundamental to the <strong>Global</strong><br />
<strong>Fund</strong>’s mission of saving lives. The <strong>Global</strong> <strong>Fund</strong><br />
supports a variety of approaches to achieve equity<br />
in access to health services, and to improve health<br />
outcomes where inequities persist. These approaches<br />
are described in more detail in this section and include:<br />
• promoting equity in funding by linking country<br />
eligibility criteria to disease burden and income level<br />
(see Section 2.6.1);<br />
• scaling up the response to HIV, TB and malaria<br />
to achieve universal access to prevention, treatment<br />
and care services for all people – regardless of<br />
economic, social and migration status or geographical<br />
location (see Section 2.6.2);<br />
• implementing specific strategies to meet the needs<br />
of people most vulnerable or at risk from one or more<br />
of the diseases, including women and girls, sexual<br />
minorities, sex workers, people who inject drugs and<br />
other groups with higher rates of disease prevalence<br />
or incidence (see Section 2.6.3);<br />
• supporting health systems interventions to improve<br />
access to services, with <strong>Global</strong> <strong>Fund</strong> investments<br />
in human resources, infrastructures and risk pooling<br />
mech anisms to improve access to HIV treatment services<br />
and primary care services (see Section 2.6.4); and<br />
• strengthening community systems to mobilize<br />
community demand for services and access to populations<br />
that have traditionally been marginalized<br />
or ignored by service providers (see Section 2.6.5).<br />
2.6.1 Equity in funding across<br />
countries and regions<br />
BOX 2.4<br />
INEqUITIES IN dISEASE BUrdENS<br />
The impact of HIV, TB and malaria is often most severe on those who are<br />
poorest and most marginalized.<br />
Africa bears most of the burden, including an estimated 80 percent of the<br />
global HIV burden and 91 percent of the malaria burden (31). The three<br />
epidemics are also concentrated in fragile and conflict-affected states, where<br />
malaria mortality is nearly 13 times higher and HIV prevalence four times<br />
higher than elsewhere in the developing world (63). In sub-Saharan Africa<br />
HIV, TB and malaria disproportionately affect people of working age and<br />
account for 40 percent of deaths among women of reproductive age (24).<br />
HIV/AIDS worsens pregnancy outcomes and is a leading underlying cause<br />
of maternal mortality in Africa (25). Malaria and HIV are responsible for about<br />
21 percent of child deaths in sub-Saharan Africa, where over 45 percent of<br />
child mortality in the world occurs (31).<br />
Men who have sex with men, transgender people, sex workers and people<br />
who inject drugs face a disproportionately high risk of HIV infection in<br />
all parts of the world. Stigma, discrimination and the criminalization of risk<br />
behaviors further impede effective responses to HIV for these groups in<br />
many settings.<br />
HIV, TB and malaria place a high burden on the health systems in low-income<br />
countries where they are concentrated. In the poorest countries,<br />
HIV can account for nearly 50 percent of inpatients (64) and malaria for<br />
about half of outpatient visits (65).<br />
In many African countries, HIV is a major cause of morbidity and mortality<br />
among health workers themselves, placing a dual burden on weak health<br />
systems (66–68). Six African countries (Malawi, Zimbabwe, Mozambique,<br />
Zambia, Lesotho and Central African Republic) with a health worker crisis<br />
have an estimated adult HIV prevalence exceeding 10 percent (69).<br />
FIGURE 2.23 BURDEN OF DISEASE DUE TO HIV, TB AND<br />
MALARIA, (2004), AND TOTAL GLOBAL FUND-APPROVED<br />
INVESTMENTS IN ROUNDS 1–9, BY REGION<br />
PERCENTAGE SHARE<br />
80<br />
70<br />
60<br />
50<br />
40<br />
30<br />
20<br />
PERCENTAGE SHARE OF GLOBAL<br />
BURDEN OF HIV, TB AND MALARIA<br />
PERCENTAGE SHARE OF APPROVED<br />
GLOBAL FUND BUDGET<br />
49 THE GLOBAL FUND <strong>2010</strong>: INNOVATION AND IMPACT results aND progress ON internatiONal targets<br />
124. In its grant eligibility criteria, the <strong>Global</strong> <strong>Fund</strong><br />
assigns the greatest weight to two factors: 1) a country’s<br />
disease burden for HIV, TB and malaria; and 2)<br />
a country’s income level as measured by per capita<br />
gross national income.<br />
10<br />
0<br />
EASTERN AND<br />
CENTRAL EUROPE<br />
latin AMERICA<br />
eastern<br />
MEDITERRANEAN<br />
western PACIFIC<br />
southeast ASIA<br />
sub-SAHARAN<br />
AFRICA<br />
125. An analysis of the proposals approved by the <strong>Global</strong><br />
<strong>Fund</strong> to date shows that the share of investments in<br />
each region has been broadly in line with that region’s<br />
share of the global burden of HIV, TB and malaria<br />
(see Figure 2.23).<br />
Source: Reference 31 and <strong>Global</strong> <strong>Fund</strong>-approved grant budgets, www.theglobalfund.org.<br />
Note: The regions in the figure do not correspond exactly to the eight <strong>Global</strong> <strong>Fund</strong><br />
regions. The regional share of <strong>Global</strong> <strong>Fund</strong>-approved budget has been estimated using<br />
the WHO regions employed in reference 31.
A PREVENTION PROGRAM IN AN AREA OF HIGH HIV PREVALENCE IN CUBA CAPITALIzED<br />
ON THE TRUST CLIENTS PLACE IN THEIR HAIRDRESSERS BY TRAINING SALON STAFF TO<br />
DISCREETLY PROVIDE CONDOMS AND INFORMATION ON STIs.
2.6.2 Ensuring access for<br />
all people<br />
126. One way to ensure equitable access to necessary<br />
services is to make them accessible to everyone<br />
in need. To achieve universal access, programs need<br />
to be accessible for everyone, including rural populations,<br />
the poorest, prisoners and pre-trial detainees,<br />
and other vulnerable and marginalized groups. The<br />
<strong>Global</strong> <strong>Fund</strong> investments support interventions aimed<br />
at these groups, including the provision of free or<br />
highly subsidized services and products.<br />
127. Subsidized and free ART has had a noticeable<br />
effect in Rwanda, Zambia and Tanzania, where, between<br />
2002 and 2006, differences in out-of-pocket spending<br />
on health care between the general population and<br />
people living with HIV have narrowed considerably. In<br />
Zambia, out-of-pocket health expenses for people<br />
living with HIV in 2002 were nearly five times higher<br />
than for the general population, but only 23 percent<br />
higher in 2006. Similarly, in Rwanda and Tanzania, the<br />
difference in out-of-pocket spending between the<br />
general population and people living with HIV declined<br />
from 257 percent to 28 percent and from 136 percent<br />
to 75 percent, respectively (70).<br />
128. The <strong>Global</strong> <strong>Fund</strong> has been supporting the national<br />
malaria strategy in Kenya, where a key intervention<br />
was the free distribution of 3.4 million LLINs in 2006<br />
to pregnant women and children. The proportion of<br />
children sleeping under an ITN increased from 7 percent<br />
in 2004–2005 to 67 percent in 2006–2007, with<br />
about two-thirds of them using a net obtained during<br />
the free distribution campaign. The campaign was<br />
successful in reaching children from the poorest<br />
households (71).<br />
BOX 2.5 GENder-rESPONSIVE<br />
prOGrammING OF GLOBAL<br />
FUNd grANTS<br />
Countries are required to provide epidemiological and behavioral data<br />
in grant proposals and specify how the proposed interventions will reach<br />
affected populations. However, the overall availability of disaggregated<br />
data is currently limited and implementation strategies do not always address<br />
inequities and barriers faced by women and key affected populations.<br />
For example, a study of 211 <strong>Global</strong> <strong>Fund</strong>-financed proposals in sub-Saharan<br />
Africa from Rounds 1 to 7 found that the majority of proposals included<br />
targeted services for women and girls, such as malaria prevention for pregnant<br />
women or ARV prophylaxis for HIV-positive pregnant women.<br />
However, only a few proposals addressed underlying sociocultural barriers<br />
to care (74). This shortcoming is well recognized and the Board of the<br />
<strong>Global</strong> <strong>Fund</strong> has adopted a gender strategy, recognizing that a concerted,<br />
long-term effort is required to address it (75, 76).<br />
In Rounds 8 and 9, the grant proposal forms and guidelines were improved<br />
to encourage applicants to address gender and equity issues. Around<br />
67 percent of eligible proposals in Round 8 provided data disaggregated by<br />
sex and age. Implementation of the gender strategy includes analysis of<br />
disaggregated data by sex in order to improve gender responsive programming<br />
in grant implementation (72). The Secretariat monitors the extent<br />
to which programs include gender and social equity analyses as part of the<br />
grant reviews.<br />
130. In Rounds 8 and 9, nearly four out of five HIV<br />
proposals submitted to the <strong>Global</strong> <strong>Fund</strong> included at<br />
least one activity targeting men who have sex with<br />
men, transgender persons or male, female and transgender<br />
sex workers. Among proposals recommended<br />
for funding by the Technical Review Panel, the percentage<br />
of proposals including at least one element<br />
related to sexual orientation and gender identity<br />
increased from 74 percent in Round 8 to 87 percent<br />
in Round 9.<br />
51 THE GLOBAL FUND <strong>2010</strong>: INNOVATION AND IMPACT results aND progress ON internatiONal targets<br />
2.6.3 Strategies to address<br />
the needs of the most<br />
affected communities<br />
129. The <strong>Global</strong> <strong>Fund</strong> is committed to ensuring that<br />
its policies and grants prioritize the needs of the groups<br />
who are most affected by – or vulnerable to – HIV,<br />
TB and malaria. In 2008 and 2009 the <strong>Global</strong> <strong>Fund</strong><br />
adopted two complementary strategies – one promoting<br />
gender equality in the response to HIV, TB and<br />
malaria (72) (see Box 2.5) and one focusing on the<br />
special needs of sexual minorities, including men who<br />
have sex with men, transgender people and sex workers<br />
(73). Both strategies promote inclusiveness and<br />
diversity in <strong>Global</strong> <strong>Fund</strong> procedures and decisionmaking<br />
structures, and both emphasize the importance<br />
of linking funding decisions to evidence and measurable<br />
results.<br />
131. The number of proposals that address issues of<br />
stigma and rights promotion is also increasing. Overall,<br />
25 percent of all proposals received in Round 8 and<br />
33 percent of all proposals received in Round 9<br />
included at least one activity aimed at addressing<br />
stigma or promoting rights, targeting any or all of the<br />
key, at-risk population groups. Among funded proposals,<br />
13 percent in Round 8 included at least one such<br />
activity, compared to 42 percent in Round 9.<br />
132. Table 2.13 presents examples of successful<br />
Round 8 and 9 proposals addressing needs of key<br />
affected populations. While some progress is being<br />
made, in many countries greater political commitment<br />
and sustained support from the <strong>Global</strong> <strong>Fund</strong> and<br />
other partners will be needed to ensure that HIV services<br />
are provided to those who need them most.
TABLE 2.13 EqUITY ANALYSES AND PROPOSED ACTIONS IN SELECTED ROUND 8 AND 9 PROPOSALS<br />
AFFECTED<br />
POPULATION PROPOSAL BURDEN OF DISEASE<br />
WOMEN<br />
AND GIRLS<br />
Swaziland<br />
(HIV, Round 8)<br />
Adult HIV prevalence:<br />
• women: 31%<br />
• men: 20%<br />
ISSUES IDENTIFIED IN<br />
THE PROPOSAL<br />
Gender-based<br />
violence<br />
Low uptake of<br />
public HIV treatment<br />
services by men<br />
ACTIONS PROPOSED TO IMPROVE EQUITY<br />
IN ACCESS TO SERVICES<br />
• Post-exposure prophylaxis for women<br />
• Shelters for victims of gender-based violence<br />
• Training for health care workers on sexual and<br />
reproductive rights<br />
• Outreach services in rural clinics<br />
• Free ART through the private sector<br />
Côte d’Ivoire<br />
(HIV, Round 9)<br />
Adult HIV prevalence:<br />
• women: 6.4%<br />
• men: 2.9%<br />
• Low HIV awareness<br />
and service<br />
coverage<br />
• Post-conflict sexual<br />
violence<br />
• Free distribution of condoms through community<br />
organizations<br />
• Training for health professionals on gender-based<br />
violence and HIV<br />
• Routine offer of HIV testing to women and integration<br />
of PMTCT services into antenatal care sites<br />
SEX<br />
WORKERS<br />
Côte d’Ivoire<br />
(HIV, Round 9)<br />
HIV prevalence<br />
among female sex<br />
workers: 44%<br />
• High rates of HIV<br />
infection<br />
• Poor access to<br />
health services<br />
• Testing and prevention of STIs through mobile clinics<br />
• Empowerment of sex workers by raising their HIV<br />
awareness and reducing their illiteracy<br />
• HIV seroprevalence survey among sex workers<br />
MEN WHO HAVE SEX<br />
WITH MEN<br />
Thailand<br />
(HIV, Round 8)<br />
HIV prevalence<br />
among men who<br />
have sex with men:<br />
8% to 21%<br />
Poor access to the<br />
formal health care<br />
system<br />
• Training outreach workers and peer educators<br />
in HIV prevention and referral<br />
• Creating “safe spaces” with basic services in<br />
community-run centers<br />
• Free distribution of condoms and lubricants<br />
• Sensitization of health care workers and law enforcement<br />
officers<br />
• Free TB diagnosis and treatment<br />
• Longer opening hours in clinics, including one day on<br />
the weekend<br />
• Treatment support through the workplace<br />
Stigma and<br />
discrimination<br />
INTERNAL MIGRANTS<br />
China<br />
(TB, Round 8)<br />
National TB<br />
prevalence: 194 per<br />
100,000 population<br />
Low TB detection<br />
rate and frequent<br />
migration among<br />
migrant workers<br />
PRISONERS<br />
China<br />
(TB, Round 8)<br />
National detection<br />
rate of new smearpositive<br />
TB cases:<br />
77.81%<br />
High TB rate in<br />
prisons<br />
• Mobile units for TB screening and treatment services<br />
• Collaboration between health and justice ministries to<br />
develop an implementation plan<br />
GENERAL POPULATION,<br />
INCLUDING REFUGEES<br />
AND NOMADS<br />
Djibouti<br />
(Malaria, Round 9)<br />
37% of Djiboutians<br />
live in regions<br />
with a high risk<br />
of malaria<br />
• High risk of malaria<br />
due to climatic<br />
conditions, urban<br />
growth and population<br />
movement<br />
• Low coverage of<br />
malaria prevention<br />
and treatment<br />
• Free distribution of ITNs through community-based<br />
organizations<br />
• Rapid diagnosis kits and training for paramedical and<br />
community health workers, of whom 50 percent<br />
are women<br />
• Raising awareness through peer educators<br />
working with nomadic populations<br />
Sources: <strong>Global</strong> <strong>Fund</strong> proposals, www.theglobalfund.org. For burden of disease see references 31, 77–79.<br />
TABLE 2.14 GLOBAL FUND SUPPORT IN 2008 FOR INCREASING AVAILABILITY OF HUMAN RESOURCES IN GOVERNMENT<br />
HEALTH SERVICES IN MALAWI<br />
HUMAN RESOURCES<br />
AVAILABILITY<br />
2003 1 2008 2<br />
GLOBAL FUND SUPPORT IN 2008 2<br />
DOCTORS 90 177 160<br />
NURSES 1932 3185 3025<br />
LAB TECHNICIANS 76 143 143<br />
HEALTH SURVEILLANCE ASSISTANTS 4324 10127 10127<br />
Source: 1 Reference 90. 2 <strong>Global</strong> <strong>Fund</strong> Portfolio Survey, 2009, www.theglobalfund.org.<br />
Note: Support includes salaries, “top up” of salaries and/or incentives.
133. The <strong>Global</strong> <strong>Fund</strong> has become the largest contributor<br />
to harm reduction programs for people who inject<br />
drugs worldwide (see Box 2.6). In 2008, the <strong>Global</strong><br />
<strong>Fund</strong> approved the first grant in the sub-Saharan region<br />
that includes targeted programs for people who inject<br />
drugs. The grant, worth more than US$ 10 million, was<br />
awarded to Mauritius, which has the highest per capita<br />
injecting drug use in Africa and where injecting drug<br />
use has become the main mode of HIV transmission<br />
in recent years.<br />
134. In addition to financing harm reduction programs,<br />
the <strong>Global</strong> <strong>Fund</strong> has facilitated dialogue between<br />
people who use drugs and governments as a result<br />
of broad stakeholder involvement in CCMs and the<br />
Board. Since its inception, the <strong>Global</strong> <strong>Fund</strong> has urged<br />
countries to adopt evidence-based approaches, including<br />
harm reduction interventions, in policy-making.<br />
Eighty-four countries now support harm reduction in<br />
policy or practice – including countries with strict drug<br />
laws and policies (such as China and Viet Nam) (80).<br />
2.6.4 StrENGThENING hEALTh SYSTEms<br />
135. Achieving universal access and equity requires<br />
efforts to strengthen health systems in order to deliver<br />
services to all those in need, including to those in<br />
rural areas and to marginalized and criminalized populations.<br />
Often rooted in gender, socioeconomic or<br />
ethnic differences, inequities are closely linked to health<br />
care access and benefits (86).<br />
BOX 2.6 PrOVIdING harm<br />
redUCTION SErVICES TO PEOPLE<br />
whO INJECT drUGS<br />
Injecting drug use accounts for 10 percent of all HIV cases globally<br />
(representing 3.3 million people) – and in the countries of Asia and Eastern<br />
Europe, prevalence rates among people who use drugs are as high as<br />
50 percent (80). In Africa, drug use is also emerging as an additional risk<br />
for HIV transmission – with 90 percent of HIV cases in Mauritius resulting<br />
from injecting drug use (81). Harm reduction interventions are an essential<br />
component of efforts to prevent the further spread of HIV (and other<br />
harms such as hepatitis and overdose) among people who inject drugs.<br />
At the same time, they have benefits for society at large and can reduce<br />
both demand for drugs and levels of crime. Examples of this approach include<br />
needle and syringe programs and opioid substitution therapy<br />
programs – both of which have been shown to reverse HIV epidemics related<br />
to injecting drug use (82). Yet uptake has been slow in many countries<br />
with persistent inequities (83, 84).<br />
The <strong>Global</strong> <strong>Fund</strong> has become the largest funder of harm reduction services<br />
in the world, investing around US$ 180 million to date in 42 countries (85).<br />
By initiating such services and expanding their coverage, <strong>Global</strong> <strong>Fund</strong><br />
grants have also helped reduce inequity in access to HIV prevention and<br />
treatment services. Of the 16 million prevention services that <strong>Global</strong> <strong>Fund</strong>supported<br />
programs had provided by the end of 2009 to people most at<br />
risk for HIV, at least 1 million were for people who inject drugs. Several<br />
grant recipients in Eastern Europe and Central Asia have reported coverage<br />
rates of more than 30 percent among this group. Yet such successes fall far<br />
short of need, as this group has difficulty accessing ART around the world.<br />
53 THE GLOBAL FUND <strong>2010</strong>: INNOVATION AND IMPACT results aND progress ON internatiONal targets<br />
136. Investing in human resources. Expanding disease<br />
programs in low-income settings requires increased<br />
human resource capacity. Successful disease programs<br />
can release capacity in health systems by reducing the<br />
burden of the three diseases. Sub-Saharan Africa faces<br />
the greatest health work force challenges as it has only<br />
3 percent of the world’s health workers, with 11 percent<br />
of the world’s population and 24 percent of the global<br />
burden of disease (68). 5 There is a positive correlation<br />
between health work force density, service coverage<br />
and health outcomes such as maternal mortality and<br />
child mortality (87). The <strong>Global</strong> <strong>Fund</strong> has invested in<br />
both pre-service and in-service training, supported task<br />
shifting to maximize utilization of existing workers,<br />
and helped develop informal cadres of health and<br />
community workers.<br />
5 For more information, see www.who.int/mediacentre/factsheets/fs302/en/index.html.
FIGURE 2.24 ExPANSION OF FACILITIES PROVIDING BASIC<br />
HEALTH SERVICES IN RWANDA (2001–2007)<br />
NUMBER OF FACILITIES<br />
450<br />
400<br />
350<br />
300<br />
250<br />
200<br />
150<br />
100<br />
50<br />
0<br />
Source: Reference 88, 89.<br />
34 42<br />
170<br />
389<br />
19<br />
2001<br />
2007<br />
FIGURE 2.25 UTILIzATION OF CURATIVE HEALTH SERVICES<br />
IN RWANDA, (2001–2007)<br />
0.8<br />
0.7<br />
hospitals<br />
health CENTERS/<br />
POLYCLINICS<br />
107<br />
dispensaries<br />
137. In Rwanda, the <strong>Global</strong> <strong>Fund</strong> has approved a fiveyear<br />
proposal of US$ 77.8 million to strengthen human<br />
resources (salaries and training). This investment has<br />
supported efforts of the government and other development<br />
partners such as PEPFAR to expand service<br />
availability and utilization between 2001 and 2007<br />
(88, 89). During this period, the number of facilities<br />
providing basic health services increased substantially<br />
(Figure 2.24), with those providing STI services increasing<br />
133 percent. 6 Utilization of curative services<br />
increased by 170 percent (Figure 2.25).<br />
138. Malawi, which has a severe human resource<br />
shortage, has used <strong>Global</strong> <strong>Fund</strong> support to improve<br />
the availability of key human resources in government<br />
health services (see Table 2.14). <strong>Global</strong> <strong>Fund</strong> grants<br />
have been used to support recruitment, retention,<br />
deployment, pre-service and in-service training of<br />
health personnel.<br />
139. Health system bottlenecks due to persistent<br />
short ages of human resources in Malawi have been<br />
partially alleviated through the achievement of a<br />
significant level of “task shifting” in a relatively short<br />
period of time using health surveillance assistants<br />
(91). The <strong>Global</strong> <strong>Fund</strong>-supported assistants have played<br />
a critical role in scaling up HIV testing and<br />
counseling services and home-based services such as<br />
adherence monitoring and dispensing of ART (92).<br />
(See Table 2.14)<br />
CURATIVE HEALTH SERVICES UTILIzATION RATE<br />
0.6<br />
0.5<br />
0.4<br />
0.3<br />
0.2<br />
0.1<br />
0<br />
2001 2002 2003 2004 2005 2006 2007<br />
YEAR<br />
Source: Reference 88, 89.<br />
140. Risk pooling. The <strong>Global</strong> <strong>Fund</strong> also supports<br />
risk pooling (so that the risk of having to pay for health<br />
care is not borne by each contributor individually)<br />
to increase equity of access to health services. Without<br />
risk-pooling mechanisms, the poor spend out<br />
of pocket to meet health care costs, exacerbating<br />
their poverty (93).<br />
141. In Rwanda, a <strong>Global</strong> <strong>Fund</strong> grant supported the<br />
establishment of community-based social insurance to<br />
cover people living with HIV, indigents and orphans.<br />
The insurance covered around 2.9 million indigents,<br />
520,000 people living with HIV and 296,000 orphans<br />
across the country. The overall utilization rate at district<br />
hospitals increased from 35 percent in 2005 to<br />
68 percent in June 2009, exceeding expectations (94).<br />
142. In Peru, where nearly 90 percent of HIV treatment<br />
was financed out of pocket, <strong>Global</strong> <strong>Fund</strong> grants<br />
helped set up the national HIV treatment program<br />
in 2004. As a result of this investment and the subsequent<br />
rollout of ART, out-of-pocket spending on HIV<br />
treatment dropped to a negligible proportion of total<br />
household expenditure by 2007 (95). The number of<br />
persons covered by ART increased from around 2,000<br />
in 2004 (23) to 9,400 by the end of 2006 (96).<br />
6 Basic services: outpatient services for sick children, STI, temporary methods of contraception,<br />
antenatal care, immunization, child growth monitoring.
TABLE 2.15 IMPROVEMENTS IN HEALTH SERVICE DELIVERY IN ETHIOPIA (2005–2008)<br />
SERVICE DELIVERY INDICATOR 2005 2008<br />
CHILD IMMUNIZATION RATE DPT3 (%) 1 70 82<br />
MEASLES IMMUNIZATION (%) 1 61 76.6<br />
BIRTHS ATTENDED BY HEALTH PROFESSIONALS (%) 1 13 24.9<br />
CONTRACEPTIVE ACCEPTOR RATE (%) 1 25 56.2<br />
NUMBER OF ART CLIENTS 2 20,000 132,000<br />
PROPORTION OF WOMEN AND CHILDREN AMONG ART CLIENTS (%) 3 25 55<br />
PROPORTION OF ART CLIENTS OUTSIDE NATIONAL CAPITAL (%) 3 35 75<br />
OPERATIONAL INDOOR RESIDUAL SPRAYING COVERAGE (%) 4 7.3 51.4<br />
OPERATIONAL ITN COVERAGE (%) 4 15.8 71.3<br />
Source: 1 Data pertains to 2005 and 2008–2009, reference 100; 2 Reference 1; 3 Reference 98; 4 References 2, 59.<br />
2.6.5 Strengthening<br />
community systems<br />
143. Working with communities to scale up the<br />
response to disease is a cornerstone of the <strong>Global</strong><br />
<strong>Fund</strong> model. Investments in community systems have<br />
been critical in engaging affected populations and<br />
local leaders, mobilizing public awareness and demand<br />
for services, tailoring programs to local needs, and<br />
delivering services to hard-to-reach, at-risk and vulnerable<br />
populations (97).<br />
144. Ethiopia – one of the top five countries in terms<br />
of <strong>Global</strong> <strong>Fund</strong> investments – is accelerating the<br />
expansion of primary care infrastructure and the workforce<br />
under the country’s Health Extension Program.<br />
Over 30,000 health extension workers, recruited from<br />
the community, have been trained and deployed in<br />
the health services between 2004 and 2009. This program<br />
has played a critical role in the rapid scaling-up<br />
of HIV and malaria programs as well as reproductive<br />
and child health services, especially in rural areas of<br />
the country (91, 98, 99) (Table 2.15).<br />
145. HIV grants to Ethiopia in Rounds 2 and 4 have<br />
also supported the training of some 64,000 voluntary<br />
community dialogue facilitators to deliver behavior<br />
change communication in households and “kebeles”<br />
(local communities). Working with health extension<br />
workers deployed in health services, these facilitators<br />
had reached over 87 percent of the adult population<br />
by 2007. Community mobilization also enabled the<br />
expanded provision of testing and counseling services<br />
to cover more than 650 health facilities and the management<br />
of sexually transmitted diseases in over<br />
350 clinics across the country (97).<br />
146. The <strong>Global</strong> <strong>Fund</strong> has also helped communities<br />
expand service coverage in populations with poor<br />
access to the health system. In Cambodia, a grant<br />
allowed the Khmer HIV/AIDS NGO Alliance to provide<br />
financial, technical and capacity-building support<br />
to local community organizations for providing homebased<br />
care to people living with HIV, as well as to<br />
orphans and other vulnerable children. This experience<br />
is being used to extend HIV outreach to men who<br />
have sex with men and people who inject drugs through<br />
a subsequent grant, including Cambodia’s first national<br />
network of men who have sex with men (101).<br />
55 THE GLOBAL FUND <strong>2010</strong>: INNOVATION AND IMPACT results aND progress ON internatiONal targets
SISTER ASTER WEIGHS IN a THREE-MONTH-OLD CHILD AT a CLINIC IN THE SOUTH<br />
OF ETHIOPIA. GLOBAL FUND INVESTMENTS IN ETHIOPIA HAVE BEEN EXTENDED<br />
TO INCLUDE STRENGTHENING MATERNAL AND CHILD HEALTH PROGRAMS.
2.7 Challenges<br />
147. Though these results demonstrate remarkable<br />
progress, significant challenges remain. In the coming<br />
years, a rapid increase in investments should help<br />
address at least some of them. Around half of the total<br />
funds disbursed by the <strong>Global</strong> <strong>Fund</strong> were disbursed<br />
during 2008 and 2009, benefiting programs that are<br />
starting to have an effect on the ground and will show<br />
concrete results in the coming years. However, much<br />
more will be required to achieve universal access goals.<br />
148. In most countries, access to ART remains far<br />
below universal access levels. The estimated coverage<br />
of ART in low- and middle-income countries reached<br />
42 percent in 2008. Coverage varied between regions,<br />
with Latin America and Caribbean having the highest<br />
coverage (54 percent) while in Middle East and North<br />
Africa the coverage is as low as 14 percent (1). New<br />
WHO treatment recommendations that call for treating<br />
people living with HIV at an earlier stage of the<br />
disease will further increase the number of people<br />
in need of treatment globally. Further, changing<br />
drug regimens may increase costs and make scale-up<br />
more expensive.<br />
149. Coverage of HIV prevention also remains too low,<br />
particularly among population groups at high risk of<br />
HIV. As highlighted in the 2009 universal access progress<br />
report (1), these groups continue to face technical,<br />
legal and sociocultural barriers in accessing health care<br />
services. In low- and middle-income countries, only<br />
a median of 37.5 percent of people who inject drugs,<br />
27 percent of men who have sex with men and 56 percent<br />
of sex workers were reached with HIV prevention<br />
programs in the past 12 months (1). Prevention is the<br />
pre-condition for a sustainable HIV response and comprehensive<br />
and evidence-based prevention programs<br />
will have to be vastly scaled up.<br />
150. There are, however, significant challenges to further<br />
scaling up prevention and treatment programs,<br />
including barriers to access to treatment for most-atrisk<br />
groups, the poor integration of ART and drug<br />
dependence services, the lack of an adequate response<br />
to TB/HIV co-infections, stigma, ideological barriers<br />
(particularly regarding the scaling-up of harm reduction<br />
programs), laws and regulations or police practices<br />
limiting access to evidence-based interventions, and<br />
limited access to prevention and treatment services<br />
in prisons.<br />
151. PMTCT coverage is improving, yet lags far behind<br />
needs and targets. The <strong>Global</strong> <strong>Fund</strong>, together with<br />
its technical partners (including UNAIDS, UNICEF and<br />
WHO), is intensifying the scale-up of PMTCT programs<br />
throughout <strong>2010</strong> and 2011. In her speech delivered<br />
to the United Nations in September 2009, First Lady<br />
of France Carla Bruni-Sarkozy – the <strong>Global</strong> <strong>Fund</strong>’s<br />
ambassador for the protection of mothers and children<br />
against HIV – appealed to world leaders to double the<br />
number of HIV-positive pregnant women on effective<br />
ART in the following 18 months (102).<br />
152. The HIV epidemic has fueled the TB epidemic,<br />
particularly in sub-Saharan African countries, and several<br />
critical challenges remain. Chief among them<br />
are TB/HIV co-infection in sub-Saharan Africa, and<br />
MDR-TB, particularly in Eastern Europe and parts<br />
of Asia. While the latest global estimates are 1.37 million<br />
TB/HIV co-infections and 0.5 million cases of MDR-TB<br />
(3, 10), service coverage remains very low, with only<br />
15 percent of the estimated HIV-positive TB patients<br />
currently on co-trimoxazole prophylaxis (10). While<br />
an increasing number of proposals approved by the<br />
<strong>Global</strong> <strong>Fund</strong> have included TB/HIV services over the<br />
past five years, there is a need to further strengthen<br />
the linkages between TB and HIV programs.<br />
153. MDR-TB, which is difficult and expensive to treat,<br />
poses serious public health risks. The <strong>Global</strong> <strong>Fund</strong><br />
is the major donor for responses to MDR-TB, providing<br />
the vast majority of international funding for treatment<br />
based on international standards in low- and middleincome<br />
countries. Of 24 countries with a high<br />
MDR-TB burden eligible for <strong>Global</strong> <strong>Fund</strong> grants, the<br />
<strong>Global</strong> <strong>Fund</strong> supports 23 countries for MDR-TB related<br />
activities. This has resulted in a rapid scale-up of<br />
treatment; however, there remain significant needs,<br />
with only 36,500 of the estimated 500,000 MDR-TB<br />
cases expected to be treated in 2009 (3).<br />
154. With regard to malaria, more and more countries<br />
are now using quality-assured rapid malaria diagnostic<br />
test kits, thereby reducing the unnecessary use of<br />
medicines. Over 50 percent of suspected malaria cases<br />
in Angola, Burundi, Equatorial Guinea, Gabon, Liberia,<br />
Madagascar, Niger, Rwanda and Senegal – where the<br />
<strong>Global</strong> <strong>Fund</strong> has significant investments – are now<br />
tested (2). However, it remains important to increase<br />
access to ACTs, which many children in endemic countries<br />
still lack, and to improve diagnostic capacities.<br />
155. Countries’ health information systems and<br />
M&E activities still have much room for improvement<br />
in terms of quality and timeliness.<br />
156. The contribution to key services to address the<br />
three diseases is closely monitored to ensure that programs<br />
are progressing towards international targets<br />
set by partners (see Box 2.2). In addition to the current<br />
contributions, there are efforts to project future<br />
results to identify gaps. Table 2.16 shows the current<br />
contributions to international targets and projections<br />
for 2012 for three services: ART, detection of TB cases,<br />
and ITN distribution.<br />
57 THE GLOBAL FUND <strong>2010</strong>: INNOVATION AND IMPACT results aND progress ON internatiONal targets
157. <strong>Global</strong> <strong>Fund</strong>-supported HIV programs ambitiously<br />
aim to increase ART provision to 3.9 million people<br />
in 2012. However, globally, the number of people in need<br />
is growing much faster than the pace of ART expansion.<br />
As international and national protocols recommend<br />
starting treatment earlier, this will further increase<br />
the number of people in need, while the introduction<br />
of new drug regimens could increase drug costs.<br />
158. The detection and treatment of new smearpositive<br />
TB cases will continue to increase in <strong>Global</strong><br />
<strong>Fund</strong>-supported programs from a cumulative total<br />
of 6 million as of the end of 2009 to a projected total<br />
of 10.1 million by 2012, thereby contributing 54 percent<br />
of the projected global target for 2012 in order to make<br />
a major impact. However, MDR-TB and TB/HIV coinfection<br />
remain major challenges for all countries.<br />
159. The distribution of ITNs targeted by <strong>Global</strong><br />
<strong>Fund</strong>-supported programs is more ambitious, aiming<br />
to more than double the cumulative total to date<br />
to 230 million by 2012. Of these, 125 million nets will<br />
go to sub-Saharan Africa, enabling countries there<br />
to deliver 93 percent of the projected global results to<br />
achieve the Roll Back Malaria Partnership target of<br />
80 percent coverage of most-at-risk populations in sub-<br />
Saharan Africa. However, as ITNs, even long-lasting<br />
ones, will eventually wear out, countries need to carefully<br />
plan when, where and how best to replace them.<br />
The <strong>Global</strong> <strong>Fund</strong> partnership will need to expand and<br />
sustain the high level of malaria prevention efforts.<br />
160. To reach international targets, countries will<br />
need to accelerate efforts even more to provide ART<br />
to those in need, to effectively deliver TB treatment<br />
(including that for MDR-TB) and to increase access<br />
to effective antimalarial diagnostics and drugs.<br />
161. Weak health systems remain a key challenge<br />
to the scale-up of HIV, TB and malaria programs, and<br />
to the attainment of the health MDGs overall. The<br />
need to invest more in strengthening health system<br />
capacity has also been acknowledged by world<br />
leaders: the High-Level Taskforce on Innovative International<br />
Financing for Health Systems, launched in<br />
September 2008, outlined new ways of raising and<br />
channeling funds to address current resource gaps<br />
in poor countries in order to help them achieve the<br />
health MDGs (103). One recommendation was to<br />
develop a joint platform for health systems funding<br />
between the <strong>Global</strong> <strong>Fund</strong>, the GAVI Alliance, the<br />
World Bank and others – work which is underway,<br />
facilitated by WHO (see Section 4.4).<br />
162. As the first decade of the 21st century draws to<br />
a close, the race to achieve the MDGs demands heightened<br />
momentum for global and local action. Despite<br />
the achievements of the <strong>Global</strong> <strong>Fund</strong> partnership over<br />
the past eight years, the many lessons learned and<br />
the innovations introduced, the challenges ahead continue<br />
to be formidable.<br />
TABLE 2.16 GLOBAL FUND AND WORLD RESULTS FOR 2009, AND 2012 ESTIMATES TO MEET INTERNATIONAL TARGETS<br />
PEOPLE CURRENTLY ON ART<br />
CUMULATIVE NUMBER OF NEW<br />
SMEAR-POSITIVE TB CASES DETECTED<br />
ITNs DISTRIBUTED<br />
2009<br />
PROJECTED GLOBAL RESULTS BASED<br />
ON INTERNATIONAL TARGETS<br />
9.7 MILLION 2 12.5 MILLION 3 124.6 MILLION 5 (SUB-SAHARAN<br />
AFRICA)<br />
GLOBAL FUND RESULTS 2.5 MILLION 6 MILLION 4 104 MILLION 6 (ALL REGIONS)<br />
72.5 MILLION (SUB-SAHARAN AFRICA)<br />
GLOBAL FUND CONTRIBUTION 1 26% 48% 58% (SUB-SAHARAN AFRICA)<br />
2012<br />
PROJECTED GLOBAL RESULTS BASED<br />
ON INTERNATIONAL TARGETS<br />
11.9 MILLION 2 18.8 MILLION 3 134.5 MILLION 5 (SUB-SAHARAN<br />
AFRICA)<br />
GLOBAL FUND TARGETS 3.9 MILLION 10.1 MILLION 230 MILLION (ALL REGIONS)<br />
125 MILLION 6 (SUB-SAHARAN AFRICA)<br />
GLOBAL FUND CONTRIBUTION 1 33% 54% 93% (SUB-SAHARAN AFRICA)<br />
Notes: <strong>Global</strong> <strong>Fund</strong> figures may include service and commodity deliverables that are co-financed by others. The international indicator on ART is people currently on therapy,<br />
and the <strong>Global</strong> <strong>Fund</strong> does not capture cumulative total. For TB and ITNs, the <strong>Global</strong> <strong>Fund</strong> has been collecting and reporting cumulative results.<br />
1 <strong>Global</strong> <strong>Fund</strong> results or targets compared to estimated international results or targets.<br />
2 Reference 13.<br />
3 Reference 14.<br />
4 Country reporting might include non-new smear-positive cases up to 10 percent.<br />
5 Reference 12.<br />
6 <strong>Global</strong> <strong>Fund</strong> targets for 2012 exclude ITNs distributed four years earlier, assuming they will be worn out.
INDIA HAS, WITH GLOBAL FUND ASSISTANCE, SUCCEEDED IN SCALING UP ARV PROVISION,<br />
MOST NOTABLY BY INCREASING THE NUMBER OF CENTERS WHERE DRUGS ARE AVAILABLE.<br />
MORE HIV-POSITIVE CHILDREN ARE BEING TREATED AS a RESULT.<br />
59 THE GLOBAL FUND <strong>2010</strong>: INNOVATION AND IMPACT results aND progress ON internatiONal targets
THIS COMMUNITY LEADER SET UP a SUPPORT GROUP FOR WOMEN WIDOWED BY AIDS<br />
IN HER VILLAGE IN NEPAL. THE COMMUNITY ASSOCIATION OFFERS HOME-BASED CARE<br />
AND BENEFITS FROM GLOBAL FUND FINANCING.
3. IMPROVING<br />
EFFECTIVENESS<br />
“One of the biggest challenges of development<br />
at the moment is how to put countries in the<br />
driver’s seat and the <strong>Global</strong> <strong>Fund</strong> is the one<br />
institution that does actually put countries<br />
in the driver’s seat.”<br />
—JOY PHUMAPHI<br />
FORMER MINISTER OF HEALTH OF BOTSWANA<br />
AND VICE-PRESIDENT OF THE WORLD BANK
1. The <strong>Global</strong> <strong>Fund</strong> was designed to provide<br />
countries with assistance in fighting major diseases<br />
effectively and efficiently. This chapter focuses<br />
on the effectiveness of the <strong>Global</strong> <strong>Fund</strong>, including its<br />
work with partners and its grants to country programs.<br />
As part of the demand-driven approach, the<br />
<strong>Global</strong> <strong>Fund</strong> supports country-owned solutions, in<br />
which local stakeholders identify the most appropriate<br />
ways to manage their programs. In addition to<br />
mobilizing more funding for health, the <strong>Global</strong> <strong>Fund</strong><br />
must invest responsibly in order to improve health<br />
and development outcomes.<br />
2. To continually improve effectiveness, the <strong>Global</strong><br />
<strong>Fund</strong> has focused on two priority areas in its investment:<br />
optimizing aid effectiveness and achieving value<br />
for money.<br />
3. The <strong>Global</strong> <strong>Fund</strong> has integrated the principles<br />
of aid effectiveness into its operations, from corporate<br />
performance to the review of the grant progress,<br />
and routinely measures aid effectiveness in all of the<br />
programs it supports.<br />
4. In 2009, a value-for-money framework was<br />
introduced to improve the efficiency of <strong>Global</strong> <strong>Fund</strong><br />
investments in administration, grant-making and<br />
service delivery, with clear targets for operational<br />
expenditures, as well as for efficiency savings in<br />
grant budgeting, implementation and procurement.<br />
3.1 Aid<br />
effectiveness<br />
3.1.1 Increasing aid effectiveness<br />
5. The <strong>Global</strong> <strong>Fund</strong> has been acting on its<br />
commitments to the 2005 Paris Declaration on Aid<br />
Effectiveness and the 2008 Accra Agenda for<br />
Action. The Paris Declaration outlines five key principles:<br />
1) country ownership of program design and<br />
implementation; 2) alignment with country priorities<br />
and systems; 3) harmonization of donor efforts;<br />
4) managing for results and 5) mutual accountability –<br />
all firmly in line with the <strong>Global</strong> <strong>Fund</strong>’s principles<br />
(see Box 1.2).<br />
6. Following an independent evaluation of its<br />
progress against the Paris Declaration undertaken<br />
in 2008 and participation in the 2007 Paris<br />
Declaration monitoring round (Table 3.1), the <strong>Global</strong><br />
<strong>Fund</strong> undertook the following three actions in<br />
2009 to boost aid effectiveness:<br />
• institutionalizing aid effectiveness monitoring in<br />
its grant portfolio on an annual basis, and including<br />
aid effectiveness as a part of the organization’s<br />
key performance indicators (1);<br />
• systematizing feedback and support to country<br />
programs to ensure aid effectiveness is incorporated<br />
into grant management;<br />
• integrating aid effectiveness reviews into performancebased<br />
funding. Grants are now assessed for aid<br />
effectiveness at the Phase 2 grant renewals process<br />
in order to identify actions for improvement.<br />
These actions are described in more detail below.<br />
7. Aid effectiveness monitoring. The <strong>Global</strong> <strong>Fund</strong><br />
measured its progress on Paris Declaration commitments<br />
in 2005, 2007 and 2009 (for the 2008 fiscal year)<br />
by employing processes and methodology developed<br />
by the Organisation for Economic Co-operation and<br />
Development (OECD) (Table 3.1).<br />
8. The scorecard in Table 3.1 shows progress on<br />
13 aid effectiveness targets that the <strong>Global</strong> <strong>Fund</strong> established<br />
in consultation with the OECD for <strong>2010</strong>. 7<br />
Six targets have been met, one nearly met and three<br />
are within reach. However, further improvements are<br />
needed to reach three targets towards which progress<br />
has been limited, namely joint missions with other<br />
donors, recording aid in national budgets and recording<br />
aid as scheduled.<br />
7 The <strong>Global</strong> <strong>Fund</strong> tracks its implementation of the Paris Declaration by measuring progress toward its <strong>2010</strong> targets. A 2005 baseline assessment was followed up in 2007. Country<br />
involvement grew in that period, from 32 to 54 countries now committed to measuring progress on the Paris Declaration. In 2009, the monitoring was integrated in the annual <strong>Global</strong> <strong>Fund</strong><br />
Portfolio Survey and completed by 79 percent of all recipient countries, with facilitation by Local <strong>Fund</strong> Agents. Principal Recipients and Local <strong>Fund</strong> Agents reviewed the survey data jointly,<br />
followed by the Secretariat. In 2008, the 54 Paris Declaration monitoring countries represented 67 percent of <strong>Global</strong> <strong>Fund</strong> disbursements in that year and 68 percent of disbursements to<br />
government recipients.
TABLE 3.1 THE GLOBAL FUND AID EFFECTIVENESS SCORECARD 8<br />
PARIS DECLARATION<br />
PRINCIPLE<br />
OWNERSHIP AND<br />
ALIGNMENT<br />
AID IS PREDICTABLE<br />
AND UNTIED<br />
HARMONIZATION<br />
WITH PARTNERS<br />
MANAGING FOR<br />
RESULTS AND<br />
ACCOUNTABILITY<br />
INDICATOR<br />
2005 RESULT<br />
(N=32)<br />
2007 RESULT<br />
(N=54)<br />
2008 RESULT<br />
(N=54)<br />
<strong>2010</strong> TARGET<br />
2008 RESULT AS<br />
PERCENTAGE OF<br />
<strong>2010</strong> TARGET<br />
AID RECORDED IN NATIONAL BUDGETS 15% 23% 29% 85% 34%<br />
GRANTS ALIGNED WITH COUNTRY CYCLES 62% 62% 75% 90% 83%<br />
AID USING PUBLIC FINANCIAL MANAGEMENT SYSTEMS 39% 39% 42% 59% 71%<br />
AID USING NATIONAL PROCUREMENT SYSTEMS 33% 56% 87% 55% >100%<br />
COUNTRIES WITH PARALLEL IMPLEMENTATION UNITS 1 16% 13% 0% 5% >100%<br />
RATIO OF ACTUAL VERSUS EXPECTED DISBURSEMENTS 90% 95% 106% 95% >100%<br />
AID RECORDED AS SCHEDULED 16% 30% 29% 60% 48%<br />
UNTIED AID 100% 100% 100% 100% 100%<br />
AID PROVIDED IN SUPPORT FOR PROGRAM-BASED APPROACHES 2 74% 68% 79% 66% >100%<br />
JOINT MISSIONS WITH OTHER DONORS 15% 14% 14% 40% 36%<br />
JOINT ANALYTIC REPORTS WITH OTHER DONORS 50% 22% 33% 50% 65%<br />
GRANTS WITH TRANSPARENT AND MONITORABLE<br />
PERFORMANCE FRAMEWORKS<br />
100% 100% 100% 100% 100%<br />
GRANTS ALIGNED TO NATIONAL M&E SYSTEMS 73% 82% 84% 90% 94%<br />
Color legend: Orange: 30 to 59 percent of <strong>2010</strong> target achieved in 2008; Blue: 60 to 89 percent of <strong>2010</strong> target achieved in 2008; Green: More than 89 percent of <strong>2010</strong> target achieved in 2008<br />
63 THE GLOBAL FUND <strong>2010</strong>: INNOVATION AND IMPACT imprOviNG EFFectiveNess<br />
1 This indicator aims at reducing the number of parallel implementation units. The target is met when less than 5 percent of countries have parallel implementation units.<br />
2 Excludes aid to UNDP and other multilaterals.<br />
Source: 2005 and 2007 data from references 1, 2; 2008 data collected through the 2009 <strong>Global</strong> <strong>Fund</strong> Portfolio Survey, www.theglobalfund.org.<br />
9. The <strong>Global</strong> <strong>Fund</strong>’s strengths in aid effectiveness<br />
include performance-based funding to manage programs<br />
for results in alignment with national M&E systems,<br />
strong country accountability through transparent performance<br />
frameworks and a program-based approach<br />
with fewer parallel implementation structures.<br />
10. Of the three targets where progress has been<br />
limited, particular attention will have to be devoted<br />
to the recording of aid in national budgets; in 2008,<br />
only 29 percent of <strong>Global</strong> <strong>Fund</strong> aid was reported in<br />
national budgets, compared to the target of 85 percent.<br />
This is partly due to limited communications between<br />
ministries of finance and ministries of health in implementing<br />
countries.<br />
11. Providing feedback to program stakeholders.<br />
Monitoring data are used to provide feedback to<br />
program stakeholders and to actively support country<br />
initiatives to improve aid effectiveness. In Rwanda,<br />
for example, the <strong>Global</strong> <strong>Fund</strong> and the CCM participated<br />
in a country-led monitoring exercise to clarify why<br />
national budget execution and national audit procedures<br />
were not being used, thereby providing the<br />
government with an opportunity to change implementation<br />
arrangements.<br />
12. Implementing countries have expressed interest<br />
in improving aid transparency. Responding to countryled<br />
initiatives, the <strong>Global</strong> <strong>Fund</strong> worked with Principal<br />
Recipients in Burkina Faso, Cambodia, Malawi and<br />
Rwanda to improve the reporting of aid, providing<br />
ministries of finance with information on financing<br />
already received and financing expected for the coming<br />
fiscal years.<br />
13. Integrating aid effectiveness into performancebased<br />
funding. Since Round 8, the <strong>Global</strong> <strong>Fund</strong>’s<br />
proposal form and guidelines have reflected the commitment<br />
to aid effectiveness, providing guidance<br />
on how to improve the alignment of funded activities.<br />
In addition, the Technical Review Panel uses aid effectiveness<br />
monitoring results to guide its review of grant<br />
proposals. The <strong>Global</strong> <strong>Fund</strong> has furthermore introduced<br />
an aid effectiveness support tool as part of the<br />
Phase 2 evaluation (see Annex 2 for a more complete<br />
explanation of the grant renewal process).<br />
8 The <strong>Global</strong> <strong>Fund</strong> Aid Effectiveness Scorecard is based on the Paris Declaration indicators. It omits four indicators that are not measured by donors and a fifth that is not applicable, but<br />
includes four additional indicators describing <strong>Global</strong> <strong>Fund</strong> overall performance against the full set of Paris Declaration principles: grants aligned with country cycles, actual versus expected<br />
disbursements, grants with transparent performance frameworks that can be monitored and grants aligned to national M&E systems.
A WORkER FROM THE COMMUNITY HOSPITAL SPRAYS INSECTICIDE ONTO THE BREEDING<br />
GROUNDS OF MALARIA-CARRYING MOSQUITOES IN THE NORTHERN ANSEBA PROVINCE<br />
OF ERITREA. THE GLOBAL FUND SUPPORTS THE PROGRAM THROUGH THE ERITREAN<br />
MINISTRY OF HEALTH.
14. As part of the grant renewal process, the<br />
Secretariat analyzes the effectiveness of grants based<br />
on the five Paris Declaration principles. This review<br />
informs implementation arrangements for Phase 2.<br />
Thirty-two grants were reviewed between May and<br />
December 2009. Recommendations mainly focused on<br />
improving transparency and alignment at the country<br />
level, such as including <strong>Global</strong> <strong>Fund</strong> financing in country<br />
budgets, recording received disbursements in national<br />
accounting books and aligning grants to the country<br />
fiscal cycle.<br />
3.1.2 Policy adjustments to improve<br />
aid effectiveness<br />
15. In 2009, the <strong>Global</strong> <strong>Fund</strong> adjusted its policies<br />
in order to improve aid effectiveness at the country<br />
level. This included: 1) coordination of country program<br />
salaries; 2) support for aligning grants with<br />
country systems and cycles and 3) improved financial<br />
transparency and accountability of <strong>Global</strong> <strong>Fund</strong><br />
finances in implementing countries. These changes are<br />
described below.<br />
16. Coordinated country program salaries.<br />
A coordinated approach to compensate health workers<br />
and other in-country program staff was designed<br />
and imple mented in 2009. Countries are now asked<br />
to provide evidence in their proposals about how<br />
salaries are harmonized with national levels or an interagency<br />
framework.<br />
17. Alignment with country systems and cycles.<br />
A framework has been developed to encourage the<br />
alignment of <strong>Global</strong> <strong>Fund</strong> financing with existing<br />
national cycles, particularly for financial management<br />
and results reporting. It also supports the increased<br />
use of country systems for procurement, financial<br />
management and M&E, where these are of sufficient<br />
quality.<br />
BOX 3.1<br />
CONTrIBUTING TO GLOBAL dIALOGUE<br />
The <strong>Global</strong> <strong>Fund</strong> convenes the <strong>Global</strong> Programs Learning Group – founded<br />
in 2006 – to share best practices and responses to the Paris Principles<br />
among major international development donors. Members include the GAVI<br />
Alliance, the Fast Track Initiative for Education, the <strong>Global</strong> Environment<br />
Facility, the Consultative Group on International Agricultural Research, the<br />
Cities Alliance and PEPFAR, with additional input from the Health Metrics<br />
Network and the Bill and Melinda Gates Foundation. Collectively, members<br />
account for a significant portion of global development financing, and<br />
they have advanced the Paris principles substantially, particularly by promoting<br />
the principles of country ownership and of managing for results.<br />
The group provides a forum to identify strengths and weaknesses in<br />
dif ferent models and to exchange lessons learned on improving aid effective -<br />
ness. In addition to member programs’ individual work plans, the learning<br />
group has a joint work plan for 2009−<strong>2010</strong>. Its five priority areas are:<br />
1. Transparency and predictability of financing; 2. Monitoring; 3. Results and<br />
impact; 4. Ownership and alignment; and 5. Innovation. The Learning<br />
Group reported mid-term progress on actions taken to address these priorities<br />
to the OECD Working Party on Aid Effectiveness in December 2009.<br />
18. Improved financial transparency and<br />
accountability of <strong>Global</strong> <strong>Fund</strong> finances to country<br />
budgets. To strengthen communication and<br />
information sharing between government health<br />
sector recipients, planning authorities, and<br />
national treasuries, guidelines have been developed<br />
to improve aid reporting in countries.<br />
19. In conclusion, in 2009 the <strong>Global</strong> <strong>Fund</strong> played<br />
an active role in the international movement to<br />
advance aid effectiveness and, within its own processes,<br />
integrated aid effectiveness from the<br />
proposal to the grant renewals stage (see Box 3.1).<br />
Remaining true to its principles of country-owned<br />
implementation, the <strong>Global</strong> <strong>Fund</strong> will continue to<br />
strengthen actions at the country level and will<br />
introduce further aid effectiveness improvements<br />
and policy adjustments across its portfolio within<br />
the new grant architecture that will be introduced<br />
in 2011 (see Section 4.4 for more information<br />
on the new grant architecture).<br />
65 THE GLOBAL FUND <strong>2010</strong>: INNOVATION AND IMPACT INtrODuctiON
3.2 Improving<br />
value for money<br />
20. Ensuring value for money at every stage of the<br />
financing chain is a critical priority, extending from<br />
donors to the people who benefit from program services<br />
directly. This is achieved by improving resource<br />
utilization within the Secretariat and equipping program<br />
managers to enact efficiencies at the implementation<br />
level. Together with national and international<br />
partners, the <strong>Global</strong> <strong>Fund</strong> has promoted the routine<br />
measurement of unit delivery costs for key interventions<br />
to enable countries to compare costs and pursue<br />
gains in efficiency. Examples of the measures taken<br />
to improve value for money are listed in Table 3.2.<br />
21. Increasing value for money at the institutional<br />
level. Every dollar donated to the <strong>Global</strong> <strong>Fund</strong> goes<br />
to fund programs in country. There are no country<br />
offices, and cumulative interest earned on the Trustee<br />
account at the World Bank has almost entirely covered<br />
the operating expenses for the <strong>Global</strong> <strong>Fund</strong> Secretariat<br />
operations and Local <strong>Fund</strong> Agent fees (see Annex 2<br />
for a description of the role of Local <strong>Fund</strong> Agents).<br />
In 2009, administrative costs amounted to no more<br />
than 5.3 percent of the <strong>Global</strong> <strong>Fund</strong>’s total expenditures<br />
(Table 3.2). For the grants themselves, planning,<br />
administration and overhead typically accounted for<br />
12 percent of reported expenditures in 2008.<br />
22. Increasing value for money: the portfolio<br />
management level. The grant management model<br />
is designed to achieve value for money in country<br />
programs through budget reviews, performance-based<br />
funding and efficient procurement.<br />
23. Ensuring value for money in grant budgets.<br />
In evaluating proposals, the Technical Review Panel<br />
assesses whether “interventions chosen are evidencebased<br />
and represent good value for money” (4). Since<br />
Round 8, the Technical Review Panel has requested<br />
external financial reviews to scrutinize the budgets of<br />
large proposals for potential cost efficiencies. In three<br />
approved Round 8 proposals, such reviews identified<br />
savings of more than US$ 190 million. In Round 9,<br />
the budgets of all proposals exceeding US$ 100 million<br />
were reviewed, and this practice will continue as part<br />
of the proposal evaluation process.<br />
TABLE 3.2 ExAMPLES OF GLOBAL FUND MEASURES TO INCREASE VALUE FOR MONEY<br />
MEASURES INDICATOR 2009 TARGET 2009 RESULTS<br />
INSTITUTIONAL<br />
• Efficient management of<br />
Secretariat<br />
PORTFOLIO MANAGEMENT: BUDGETING<br />
• Budget review and adjustment<br />
by Technical Review Panel and<br />
Secretariat when new grants<br />
are signed<br />
• Budget reviews and adjustments<br />
during Rolling Continuation Channel<br />
evaluations<br />
• Return of unused funds at end<br />
of grant<br />
PORTFOLIO MANAGEMENT:<br />
PERFORMANCE<br />
• Performance-based funding in<br />
Phase 2<br />
• Budget reviews and adjustments<br />
during Phase 2 Reviews<br />
PORTFOLIO MANAGEMENT:<br />
PROCUREMENT<br />
• Improved price and quality reporting<br />
• Secretariat operational<br />
expenditures<br />
(includes Local <strong>Fund</strong> Agent fees)<br />
•
24. Grant negotiation provides another opportunity<br />
to review budgets and identify efficiencies by comparing<br />
unit costs to benchmarks. By December 2009, when<br />
grants for 85 percent of the approved Round 8 funds<br />
had been signed, this process had yielded an overall<br />
efficiency gain of 13 percent (US$ 403 million) compared<br />
to proposal budgets for the round, with minimal<br />
impact on service delivery targets. Adjustments varied<br />
across the portfolio, with gains of 2 to 20 percent for<br />
most grants.<br />
25. Performance-based funding. The comprehensive<br />
Phase 2 performance review including outcomes and<br />
impact which occurs by year two of each grant allows<br />
for the reallocation of funds from poorly performing<br />
grants to better-performing grants as well as for the<br />
identification of efficiency gains.<br />
26. From 2005 to November 2008, 12 percent of<br />
the funds from poorly performing grants were deducted<br />
during Phase 2 reviews and allocated to betterperforming<br />
grants. In 2009, efficiency gains identified<br />
in Phase 2 grants amounted to about 22 percent of<br />
the original proposed Phase 2 budgets (US$ 317 million),<br />
due to an intensified focus on efficiencies. Similarly,<br />
approved Rolling Continuation Channel grants achieved<br />
an average saving of 7.4 percent. As a result, more<br />
than US$ 970 million in efficiency savings in grants<br />
were identified in 2009 alone for reinvestment in<br />
other programs.<br />
27. Procurement. Approximately 39 percent of grant<br />
expenditures are used to procure medicines and other<br />
health-related products.<br />
BOX 3.2 COLLABOrATION wITh<br />
TEChNICAL PArTNErs TO SUPPOrt<br />
STANdardIZEd SErVICE COSTINGS<br />
BY NATIONAL prOGrams<br />
The <strong>Global</strong> <strong>Fund</strong>, with partners, is developing and promoting standardized<br />
methods for countries to measure the efficiency and effectiveness of key<br />
HIV, TB and malaria services (7). Development of costing methods, as well<br />
as in-country technical support for data collection and analysis are carried<br />
out together with partners such as WHO and PEPFAR.<br />
In 2009 and <strong>2010</strong>, the focus is on measurement of per-unit expenditures<br />
for ART, DOTS and ITN distribution. In a common approach across all services,<br />
cost measurement is embedded in existing national disease M&E systems.<br />
For ART, national program-level costing for key cost components will be<br />
piloted in 20 countries with a high HIV burden, under the guidance of the<br />
WHO HIV/AIDS Department and UNAIDS, and with support from PEPFAR.<br />
The focus will be on key cost drivers that are amenable to efficiency gains,<br />
such as the prices of drugs and laboratory commodities and health staffing.<br />
For DOTS, the <strong>Global</strong> <strong>Fund</strong> supports further improvement of national budget<br />
and expenditure reporting by national TB programs to the WHO Stop TB<br />
department, which started in 2002 (8) – including validation of the topdown<br />
costing approach against bottom-up costing studies conducted in<br />
selected countries.<br />
For conventional ITNs and LLINs, financial reporting is now included in<br />
the questionnaire that national malaria programs submit annually to the<br />
WHO <strong>Global</strong> Malaria Program. Alongside the number of nets distributed,<br />
expenditure data will allow for the calculation of unit distribution costs for<br />
ITNs from <strong>2010</strong>.<br />
For all services, national-level data are triangulated with data from in-depth<br />
special costing studies, procurement price reporting through the <strong>Global</strong><br />
Price <strong>Report</strong>ing and <strong>Global</strong> <strong>Fund</strong> Price and Quality <strong>Report</strong>ing systems, and<br />
grant-specific expenditure tracking through the <strong>Global</strong> <strong>Fund</strong>’s Enhanced<br />
Financial <strong>Report</strong>ing.<br />
67 THE GLOBAL FUND <strong>2010</strong>: INNOVATION AND IMPACT imprOviNG EFFectiveNess<br />
28. Grant recipients are required to conduct procurement<br />
through a transparent and competitive process<br />
(except in the case of small or emergency orders),<br />
to achieve the lowest possible price for products of<br />
assured quality (5). They are also required to report<br />
price information for key products (ARVs, malaria and<br />
TB drugs, ITNs, condoms and rapid diagnostic kits)<br />
to the Price and Quality <strong>Report</strong>ing system, which is<br />
linked to the publicly accessible global price-reporting<br />
mechanism hosted by WHO (6). These publicly accessible<br />
databases facilitate price comparisons, giving<br />
grant recipients additional information and leverage<br />
to negotiate prices.<br />
29. Programs supported by the <strong>Global</strong> <strong>Fund</strong> collectively<br />
have the potential to influence prices and market<br />
dynamics. With the launch of voluntary pooled<br />
procurement in June 2009 (see Section 4.4 for more<br />
information), countries can access a collective<br />
purchasing facility established to provide Principal<br />
Recipients with greater purchasing power. The<br />
prices of comparable services such as LLINs and firstline<br />
ARVs are followed (as of 2009) as part of the<br />
corporate key performance indicators. A target of an<br />
annual 5 percent decrease has been set for both of<br />
these items.<br />
30. Increasing value for money: the service level.<br />
In conjunction with technical partners, the <strong>Global</strong> <strong>Fund</strong><br />
has initiated standardized measurement and reporting<br />
of the per-person or per-unit cost of delivering key HIV,<br />
TB and malaria intervention services (7) (see Box 3.2).<br />
Analysis and benchmarking of unit costs is helping program<br />
managers understand cost drivers and enables<br />
them to seek out efficiency gains. Service unit costs will<br />
be linked to data on service quality and health impact,<br />
thereby forming the basis for evaluation of program<br />
cost-effectiveness.
3.3 Unit costs for<br />
KEY INTErVENTIONS<br />
in programs<br />
31. In addition to regularly improving administrative<br />
and programmatic cost efficiencies, the <strong>Global</strong> <strong>Fund</strong><br />
monitors the unit costs of DOTS, ART and LLINs in<br />
order to identify areas for improved cost-efficiencies.<br />
The range of costs across the <strong>Global</strong> <strong>Fund</strong> portfolio<br />
is listed in Table 3.3.<br />
3.3.1 DOTS – UNderPINNING the STOP<br />
TB STrATEGY<br />
32. Annual expenditure reporting by national TB<br />
programs shows that the cost of DOTS per patient varies<br />
markedly with national income levels (Figure 3.1).<br />
These variations are a result of the fact that the cost<br />
of key inputs in TB control – particularly the cost<br />
of program staff and hospital care – is strongly tied to<br />
a country’s per capita income level. Among 22 highburden<br />
TB countries, overall, the median DOTS cost<br />
per patient in 2006–2008 was US$ 173 (interquartile<br />
range (IQR) 9 : US$ 140 – US$ 283).<br />
9 The interquartile range is the middle range within which 50 percent of values fall. i.e. the range from the 25th percentile to the 75th percentile of a distribution.<br />
TABLE 3.3 INITIAL ESTIMATES OF UNIT COSTS FOR KEY INTERVENTIONS IN GLOBAL FUND PROGRAMS (2008)<br />
SERVICE AND COST UNIT<br />
NATIONAL INCOME LEVEL AND UNIT COST ESTIMATE (RANGE), US$<br />
LLIN DISTRIBUTED TO A PERSON OR FAMILY AT RISK FOR MALARIA ALL INCOMES: 1 7.3 (6.8–7.8)<br />
DOTS PER TB PATIENT LOW INCOME: 150 (138–191)<br />
LOWER-MIDDLE INCOME: 173 (151–177)<br />
UPPER-MIDDLE INCOME: 1,023 (956–3,148)<br />
ART PER PERSON PER YEAR (FIRST-LINE) LOW INCOME: 526 (513–543)<br />
LOWER-MIDDLE INCOME: 645 (627–675)<br />
UPPER-MIDDLE INCOME: 740 (699–763)<br />
ART PER PERSON PER YEAR (SECOND-LINE) LOW INCOME: 1,220 (1,197–1,339)<br />
LOWER-MIDDLE INCOME: 1,626 (1,391–2,086)<br />
UPPER-MIDDLE INCOME: 2,939 (2,159–4,607)<br />
Notes: The estimated unit costs are for the median and the interquartile range. Country income levels are based on the 2007 World Bank list of economies (9).<br />
1 For LLINs, there was limited variation by country income level.<br />
Sources: LLINs (10–14); DOTS (15, 16); ART (6, 10, 17–25).<br />
FIGURE 3.1 NATIONAL DOTS exPENDITURES PER PATIENT TREATED<br />
COST PER PATIENT TREATED (uS$)<br />
1,000<br />
800<br />
600<br />
400<br />
200<br />
GENERAL HEALTH SERVICES<br />
other<br />
LAB SUPPLIES AND EQUIPMENT<br />
program STAFF, MANAGEMENT AND SUPERVISION<br />
first-LINE DRUGS<br />
5,000<br />
4,000<br />
3,000<br />
2,000<br />
1,000<br />
0<br />
0<br />
MYANMAR<br />
bangLADESH<br />
pakISTAN<br />
UGANDA<br />
kENYA<br />
ethiopia<br />
afghanistan<br />
zIMBABWE<br />
tanzANIA<br />
cambodia<br />
viet NAM<br />
CONGO (DR)<br />
NIGERIA<br />
MozAMBIQUE<br />
india<br />
indonesia<br />
philippines<br />
china<br />
thailand<br />
brazIL<br />
SOUTH AFRICA<br />
LOW INCOME LOWER-MIDDLE INCOME UPPER-<br />
MIDDLE<br />
INCOME<br />
RUSSIAN FEDERATION<br />
Notes: Cost per patient treated was obtained by dividing total country-reported expenditures by the total number of TB notifications, both smear-positive and smear-negative, averaged over<br />
2006–2008 (15, 16). Data were available for 22 high-TB burden countries, which collectively account for 80 percent of incident TB cases globally. All these countries have TB grants from the<br />
<strong>Global</strong> <strong>Fund</strong>. For each estimate, the WHO Stop TB Department added a mark-up representing average expenditure on general health services utilization (mainly hospitalization and outpatient<br />
clinic visits) to the reported costs, using country estimates from the WHO Choosing Interventions That Are Cost Effective (WHO-CHOICE) project (16, 26). Expenditures on treatment of MDR-TB<br />
and TB/HIV were not included in these unit cost estimates. Country income levels are based on the 2008 World Bank list of economies (9).<br />
Sources: References 15, 16.
In PARAGUAY, a HEALTH COORDINATOR MONITORS THE HEALTH OF PRISON INMATES.<br />
PEOPLE IN PRISON ARE MORE LIkELY TO CONTRACT TB DUE TO OVERCROWDED<br />
CONDITIONS. THE GLOBAL FUND SUPPORTS EFFORTS TO TREAT THE DISEASE AND<br />
PREVENT IT FROM SPREADING WHEN THE PRISONER IS RELEASED.<br />
69 THE GLOBAL FUND <strong>2010</strong>: INNOVATION AND IMPACT imprOviNG EFFectiveNess
33. The distribution of program costs varied substantially<br />
among countries. In most countries, the utilization<br />
of general health services (inpatient and outpatient<br />
use of facilities not specific to the TB program) was<br />
a major contributor to overall DOTS costs, at a median<br />
29 percent of the overall cost per patient.<br />
34. Between 2003 and 2008, DOTS costs per patient<br />
fluctuated from year to year in most countries, in<br />
part due to variations in program expenditures, notably<br />
investment costs. For example, in 2003 Ethiopia<br />
used initial <strong>Global</strong> <strong>Fund</strong> support to purchase substantial<br />
capital goods. In general, the cost per patient tended<br />
to increase slightly each year in the 22 countries, by<br />
a median amount of 4 percent per year.<br />
35. These unit costs will be reported by the <strong>Global</strong><br />
<strong>Fund</strong> Secretariat to countries and to the Technical<br />
Review Panel as part of a benchmarking exercise to<br />
enable countries to explore areas for efficiency gains.<br />
The wide variations demonstrated suggest room for<br />
improvement in program costs, especially in relation<br />
to cost of service delivery.<br />
FIGURE 3.2 PRICES PAID FOR FIRST-LINE ADULT ARV DRUGS<br />
BY COUNTRY INCOME LEVEL<br />
MEDIAN PRICE (US$, 2008)<br />
600<br />
400<br />
200<br />
0<br />
LOW INCOME<br />
LOWER-MIDDLE INCOME<br />
UPPER-MIDDLE INCOME<br />
d4T+3TC+NVP 30-<br />
40+150+200MG<br />
ZDV+3TC NVP<br />
300+150+200MG<br />
ZDV+3TC<br />
300+150mg + EFV<br />
600MG<br />
d4T+3TC 30-<br />
40+150mg + EFV<br />
600MG<br />
FTC+TDF<br />
300+200MG + NVP<br />
200MG<br />
FTC+TDF<br />
300+200mg + EFV<br />
600MG<br />
Notes: Prices are medians across 103 <strong>Global</strong> <strong>Fund</strong>-supported countries, but include all<br />
procurements reported by national AIDS programs irrespective of their financing, which<br />
includes the <strong>Global</strong> <strong>Fund</strong>, domestic resources, PEPFAR and other sources. For the different<br />
regimens and years, between four and 70 countries reported data, totaling 8,069 orders,<br />
for a total amount of US$ 614 million, over 2006–2008. Country income levels were based<br />
on the 2008 World Bank list of economies (9). Compared to UNAIDS’ country estimates<br />
of patients on ART, these procurement reports cover around 67 percent of the estimated<br />
total first-line ARV procurement volume in low- and middle-income countries by the end<br />
of 2008 (27).<br />
Country-reported prices varied in the extent of including charges for freight/shipping,<br />
insurance, handling etc., but the reporting systems did not separate out these different<br />
price components. Therefore, the analyses did not adjust for the varying definitions on a<br />
country-by-country basis, which can account for up to 15 percent of the price (28, 29).<br />
3.3.2 ANTIrETrOVIrAL therAPY:<br />
COST OF FIrST-LINE trEATmENT<br />
IN adULTS<br />
36. To generate the data on ART costs, the <strong>Global</strong><br />
<strong>Fund</strong> is using a phased approach that initially focuses<br />
on the prices that countries pay for ARV drugs. In<br />
<strong>2010</strong>, it is developing approaches to routinely measure<br />
additional cost components – such as laboratory<br />
services and health staffing – to improve cost estimates<br />
for delivering ART.<br />
37. In 2008, the overall median price of commonly<br />
used drug regimens for all countries with <strong>Global</strong> <strong>Fund</strong><br />
programs was US$ 188 (IQR: US$ 171 – $US 209).<br />
The median price increased with national income level<br />
(Figure 3.2).<br />
38. The median price of all first-line regimens has<br />
fallen by an average of 12 percent per year between<br />
January 2007 and May 2009 (Figure 3.3). This<br />
suggests that as global demand for ARVs increases,<br />
country programs are gradually procuring them<br />
with greater efficiency. It is important to note, however,<br />
that the most common regimens differ considerably<br />
in their prices, so that actual ARV cost depends on how<br />
many patients use the different regimens. Between<br />
2006 and 2009, countries increased the use of the more<br />
effective, yet more expensive, efavirenz and tenofovirbased<br />
regimens, and have begun phasing out the<br />
use of stavudine (d4T), in line with WHO 2009 treatment<br />
recommendations (30). As a result, despite the<br />
decreas ing price of individual drugs, the average cost<br />
of first-line drugs per patient has remained stable<br />
(Figure 3.3).<br />
39. In addition to the cost of ARVs, other costs<br />
involved in delivering ART include laboratory services,<br />
medical staff, infrastructure, M&E, program management<br />
and overhead costs. In-depth costing studies from<br />
selected programs have estimated that, between<br />
2001 and 2009, these costs averaged about US$ 350,<br />
US$ 450, and US$ 500 per patient per year in low-,<br />
lower-middle, and upper-middle income countries,<br />
respectively (17–23). Adding these estimated costs<br />
to the country-specific ARV prices enables computation<br />
of an overall median cost per patient-year.<br />
40. Based on these estimates, in 2008, the overall<br />
median cost of providing first-line ART for <strong>Global</strong><br />
<strong>Fund</strong> programs was around US$ 588 per patient-year<br />
(IQR: US$ 571 – US$ 609): US$ 526 in low-income<br />
countries, US$ 645 in lower-middle income countries<br />
and US$ 740 in upper-middle income countries.<br />
Abbreviations: 3TC: lamivudine; d4T: stavudine; EFV: efavirenz; FTC: emtricitabine;<br />
NVP: nevirapine; TDF: tenofovir; ZDV: zidovudine.<br />
Source: Country procurement reports to the <strong>Global</strong> <strong>Fund</strong> Price and Quality <strong>Report</strong>ing<br />
system and the WHO <strong>Global</strong> Price <strong>Report</strong>ing system for the year 2008 (6, 10).
FIGURE 3.3 PRICES PAID FOR FIRST-LINE ADULT ARV DRUGS DECREASING OVER TIME<br />
PRICE PER PATIENT-YEAR (US$)<br />
600<br />
400<br />
200<br />
0<br />
2006 2007 2008 JAN-MAY 2009<br />
year<br />
FTC+TDF 300+200MG + EFV 600MG<br />
FTC+TDF 300+200MG + NVP 200MG<br />
ZDV+3TC 300+150MG + EFV 600MG<br />
D4T+3TC 30-40+150MG + EFV 600MG<br />
WEIGHTED AVERAGE, WITH TIME-VARYING<br />
DISTRIBUTION OF REGIMENS<br />
ZDV+3TC+NVP 300+150+200MG<br />
D4T+3TC+NVP 30-40+150+200MG<br />
Notes: The averages weigh the six regimen prices according to their global-level share of patients, using regimen distribution data from 2006, 2007 (31) and 2008 data<br />
(32) (thick black line).<br />
Abbreviations: 3TC: lamivudine; d4T: stavudine; EFV: efavirenz; FTC: emtricitabine; NVP: nevirapine; TDF: tenofovir; ZDV: zidovudine.<br />
71 THE GLOBAL FUND <strong>2010</strong>: INNOVATION AND IMPACT imprOviNG EFFectiveNess<br />
3.3.3 Antiretroviral therapy:<br />
cost of second-line treatment<br />
in adults<br />
3.3.4 Antiretroviral therapy:<br />
overall average cost per<br />
adult patient<br />
41. In order to improve the effectiveness of both<br />
development aid and the available therapeutic options,<br />
grant implementers are encouraged to invest in<br />
adherence support for first-line treatment. Sticking<br />
to a treatment regimen for life that involves taking<br />
daily medication, with potential side effects, presents<br />
many challenges that must be overcome if patients<br />
are to successfully remain on treatment. If drug resistance<br />
occurs through failure to adhere to ART, far<br />
more expensive second-line therapy may be necessary.<br />
44. If, on average, 3 percent of adults on ART<br />
require second-line regimens (32), the overall average<br />
cost per patient-year would be around US$ 612<br />
(IQR: US$ 591 – US$ 645) in 2008. These estimates are<br />
in line with expenditure data reported by national<br />
HIV programs reporting on progress in implementing<br />
the 2001 Declaration of Commitment on HIV/AIDS<br />
(United Nations General Assembly Special Session on<br />
HIV/AIDS (UNGASS) reporting) for the year 2007<br />
(24, 25).<br />
42. The median price of the six second-line ARV<br />
combination regimens most commonly used for adult<br />
treatment in 2008 was US$ 982 per patient-year<br />
(IQR: US$ 858 – US$ 1,413) in reporting countries<br />
in 2008: US$ 870 in low-income countries, US$ 1,176<br />
in lower-middle income countries and US$ 2,439<br />
in upper-middle income countries.<br />
43. Assuming that the fixed non-drug costs are<br />
the same as for first-line treatment, the overall cost<br />
of providing second-line ART is approximately<br />
US$ 1,382 (IQR: US$ 1,258 – US$ 1,813) per patient-year<br />
of treatment.<br />
45. The expenditures included in the UNGASS reports<br />
suggest that program age and size influence the perpatient<br />
cost of ART, as has also been shown for HIV<br />
prevention services (33). Countries with smaller numbers<br />
of patients tend to have higher unit costs. This may<br />
reflect the fact that ART involves high investment<br />
costs (infrastructure, training and equipment) in a program’s<br />
start-up phase when only few patients are<br />
treated, as well as the fact that drug prices and costs<br />
tend to fall at higher procurement volumes.
FIGURE 3.4 DISTRIBUTION COSTS FOR INSECTICIDE-TREATED NETS (BOTH CONVENTIONAL AND LONG-LASTING) BY DELIVERY CHANNEL<br />
8<br />
6<br />
OTHER<br />
EQUIPMENT<br />
VEHICLES<br />
training<br />
building<br />
overhead<br />
vehicle RUNNING COST<br />
staff<br />
insecticide<br />
iec<br />
itn<br />
COST PER ITN DISTRIBUTED (US$)<br />
4<br />
2<br />
0<br />
SENEGAL<br />
kENYA, URBAN<br />
kENYA, RURAL, 2007<br />
kENYA, RURAL, 2008<br />
BURkINA FASO<br />
tanzANIA<br />
kENYA<br />
malawi<br />
kENYA<br />
eritrea<br />
burkINA FASO<br />
zANzIBAR<br />
dr CONGO<br />
zANzIBAR, 2005–2006<br />
zANzIBAR, 2008–2009<br />
COMMERCIAL VARYING ANC, FOR a FEE ANC, FREE<br />
MASS CAMPAIGN<br />
Note: Costs represent economic (annualized) costs.<br />
Abbreviations: ANC: antenatal clinics; IEC: information, education and communication, ITN: insecticide-treated nets.<br />
Sources: References 11–14.<br />
3.3.5 Conventional and longlasting<br />
insecticide-treated nets<br />
46. National malaria programs began routine reporting<br />
of program expenditures by service delivery area<br />
to the WHO <strong>Global</strong> Malaria Programme in 2009. This<br />
will allow for the calculation of unit costs for the procurement<br />
and distribution of ITNs from <strong>2010</strong> onwards.<br />
For earlier years, data is available chiefly on the prices<br />
paid for ITNs, which is the main cost driver.<br />
47. For the 55 countries reporting on procurement<br />
of LLINs, the median price decreased over time,<br />
from US$ 5.7 in 2004 (IQR: US$ 5.2 – US$ 7.0) to<br />
US$ 5.3 in 2009 (IQR: US$ 4.8 – $US 5.8). For conventional<br />
nets, which require regular re-treatment with<br />
insecticide, no clear trend was apparent in the small<br />
number of price reports, in which the overall median<br />
price in 2004–2007 was approximately US$ 3.6<br />
(IQR: US$ 2.2 – $US 5.4). No procurements of conventional<br />
ITNs were reported after 2007, in line with<br />
the WHO recommendation to distribute only the more<br />
cost-effective LLINs. These figures are based on<br />
procurement records of 51 million and 4.6 million purchases<br />
for LLINs and conventional ITNs, respectively,<br />
from 2004 to November 2009 (10). They cover around<br />
35 percent of the total estimated global purchases (34).<br />
48. According to several in-depth, program-level<br />
cost ing studies, all of which were undertaken in sub-<br />
Saharan Africa, the cost of the ITNs is itself the largest<br />
cost driver. Cost patterns do not vary consistently<br />
by delivery channel (11–14). Other costs, such as distribution,<br />
communication activities, and program<br />
management, typically add up to US$ 2.0 per distributed<br />
net (IQR: US$ 1.7 – $US 3.4, Figure 3.4). As<br />
a result, the median overall cost per LLIN distributed<br />
in sub-Saharan Africa in 2008 was estimated at<br />
around US$ 7.3 (IQR: US$ 6.8 – $US 7.8).
3.4 Maximizing<br />
impact: costeffectiveness<br />
and economic<br />
returns on<br />
investment<br />
49. The <strong>Global</strong> <strong>Fund</strong> seeks to maximize the costeffectiveness<br />
of supported interventions for obtaining<br />
given health outcomes, from proposal selection<br />
by the Technical Review Panel to the measurement<br />
of service unit costs that will enable country-specific<br />
cost-effectiveness evaluations. Research and evaluations<br />
show that ITNs, ACT, DOTS and HIV prevention<br />
interventions are highly cost-effective in low- and<br />
middle-income settings (11, 13, 21, 23, 35–42). ART<br />
and treatment of MDR-TB are somewhat less costeffective,<br />
but essential for a comprehensive response.<br />
By investing in the most cost-effective interventions<br />
(e.g. prevention) now, it is also possible to save<br />
resources in the longer term by reducing the need<br />
for more costly interventions such as treatment.<br />
50. For ITNs, DOTS and ART, the estimates of unit<br />
costs in <strong>Global</strong> <strong>Fund</strong>-supported programs presented<br />
in Table 3.3 are in line with the assumptions employed<br />
in cost-effectiveness analyses, confirming the costeffectiveness<br />
of these interventions in most <strong>Global</strong><br />
<strong>Fund</strong>-supported programs.<br />
51. In addition to contributing to the health MDGs,<br />
supported interventions have important ancillary benefits<br />
to national economies. The WHO Commission on<br />
Macroeconomics and Health estimated that significant<br />
investments in health could lead to a direct return<br />
of over eight times the investment made per year (43).<br />
The wider returns on investments to respond to HIV,<br />
TB and malaria include:<br />
• reductions in direct health care costs due to effective<br />
diagnosis, prevention and treatment, reducing<br />
cases and hospitalizations;<br />
• reduced burden on the health system over time,<br />
by reducing mortality among health care workers<br />
and reducing the inpatient and outpatient burden<br />
of these diseases;<br />
• microeconomic contributions such as reduced<br />
absen teeism, recruitment costs, improved<br />
productivity among the workforce and increased<br />
household income;<br />
• macroeconomic contributions to economic and<br />
human development.<br />
52. Direct savings within health systems have been<br />
noted as a result of investment in disease-specific programs.<br />
In South Africa, for example, the monthly cost<br />
to the health system decreased as adherence to ART<br />
increased (44). Effective malaria prevention has led to<br />
declining demand for treatment, for example, in <strong>Global</strong><br />
<strong>Fund</strong>-supported programs in Rwanda and Ethiopia (45).<br />
53. The wider health system benefits of effective<br />
disease programs include increased capacity in both<br />
inpatient and outpatient settings, and the improved<br />
working capacity of health workers. In Rwanda, effective<br />
malaria prevention resulted in a 56 percent decline<br />
in inpatient malaria cases, releasing the capacity of<br />
hospital beds (45). <strong>Global</strong> <strong>Fund</strong>-supported ART in<br />
Malawi contributed an additional 1,000 health worker<br />
days per week to the health care system by keeping<br />
HIV-positive staff alive (46).<br />
54. At the microeconomic level, dollars spent on<br />
disease interventions – notably ART and malaria control<br />
– have brought economic returns in the form of<br />
improved worker efficiency, reduced absenteeism from<br />
work and reduced recruitment and re-training costs<br />
to employers (36, 47, 48). For example, in Cambodia,<br />
the rapid scale-up of free ART doubled the number<br />
of people living with HIV who worked full-time (49).<br />
The implementation of the <strong>Global</strong> <strong>Fund</strong>-supported<br />
HIV program in Malawi resulted in a decline in worker<br />
absenteeism by 40 percent (50), and made possible<br />
the enrolment and retention of 1,850 teachers by the<br />
end of September 2006 (51), by allowing them to<br />
remain alive and in the classroom.<br />
55. Investments in public health have the ability to<br />
stabilize households. ART extends the lives of parents<br />
living with HIV, allowing them to care for their children<br />
and allowing children, who may themselves benefit<br />
from ART (52), to stay in school. Every year in India<br />
more than 300,000 children leave school to do household<br />
or income-generating work as a result of their<br />
parents’ TB (53).<br />
56. The potential macroeconomic return on health<br />
investments to countries is substantial. By strategically<br />
investing in health, countries contribute to the<br />
development of their economies and contribute to<br />
MDG 1 (“eradicate extreme poverty and hunger”).<br />
International comparisons and modeling studies suggest<br />
that:<br />
• Malaria reduces economic growth by up to<br />
1.3 percent in endemic countries (36).<br />
• AIDS lowers national gross domestic product growth<br />
by up to 2.6 percent in high-HIV-prevalence countries<br />
in sub-Saharan Africa (47). 2.6 percent per year<br />
leads to a gross domestic product which is 67 percent<br />
lower than it would have been without AIDS.<br />
73 THE GLOBAL FUND <strong>2010</strong>: INNOVATION AND IMPACT imprOviNG EFFectiveNess
• Scaling up DOTS implementation according to the<br />
<strong>Global</strong> Plan to Stop TB would generate an economic<br />
gain of US$ 1.6 trillion in the 22 high-TB burden<br />
countries alone. In sub-Saharan Africa, economic<br />
benefits would outweigh the initial costs by ten- fold<br />
within ten years, despite the challenges that HIV/TB<br />
co-infection poses (54). The potential societal benefits<br />
of DOTS implementation in India have been<br />
estimated to equal 4 percent of the gross domestic<br />
product (38).<br />
57. By strategically investing in health, programs<br />
supported by the <strong>Global</strong> <strong>Fund</strong> have the potential to<br />
bolster developing economies. Initial evidence from<br />
selected programs shows that this generates economic<br />
returns that can, in the longer term, partially or even<br />
fully compensate the current costs and greatly extend<br />
the value of the investments beyond their basic costeffectiveness<br />
(55).<br />
58. Over 50 percent of disbursements of the <strong>Global</strong><br />
<strong>Fund</strong> have occurred in the last two years, and recent<br />
rounds of funding (Rounds 8 and 9) are contributing<br />
to a more comprehensive response in countries. The<br />
full economic returns and development benefits of<br />
these programs will become increasingly apparent as<br />
investments are realized in the period from <strong>2010</strong>–2015.<br />
3.5 The way<br />
forward:<br />
CONT INUING to<br />
improve aid<br />
effectiveness<br />
and value<br />
for money<br />
60. As countries shift toward using the more effective<br />
yet more expensive ART regimens that WHO is now<br />
recommending for first-line treatment (30), the perperson<br />
cost of ART regimens may increase in the<br />
coming years, despite the falling prices of individual<br />
drugs. Increasing use of second-line treatment may<br />
also affect the median cost of treatment per patient.<br />
This prospect underscores the importance of combining<br />
the evaluation of costs with an assessment of<br />
service quality, to determine whether a given intervention<br />
or strategy is justified by health outcomes as well<br />
as costs, and the importance of investing in activities<br />
aimed at improving adherence to first-line regimens.<br />
61. Routine expenditure reporting by national TB programs<br />
has revealed considerable variation in cost<br />
per patient treated under DOTS (Figure 3.1), consistent<br />
with the findings of several in-depth costing studies<br />
(56–59). Country income levels explained some of the<br />
variations in unit costs, but another major driver was<br />
the approach to hospitalization during treatment (16).<br />
This presents an opportunity for efficiency gains<br />
through collaboration with partners and implementers.<br />
62. For ART and ITNs, the full ranges of cost variations<br />
have yet to be determined. The observed<br />
variations in drug and commodity prices by country<br />
income level nevertheless already indicate that the<br />
benchmarking of unit costs will have to be pursued<br />
with caution, taking into account country contexts<br />
such as local wages and program circumstances.<br />
63. Careful use of unit cost estimates allow countries,<br />
grant recipients and the <strong>Global</strong> <strong>Fund</strong> Secretariat to<br />
compare service costs and improve the value of investments<br />
by reducing costs to the level achieved in<br />
comparable countries, without compromising the quality<br />
of service delivery or equitable access. In turn, this<br />
will enable program managers and Principal Recipients<br />
to develop sustainable packages of prevention, treatment<br />
and care services and ultimately to procure more<br />
money for health, and more health for the money.<br />
59. Initial assessments of both aid effectiveness and<br />
value for money have identified important opportunities<br />
for improving program outcomes, and the <strong>Global</strong><br />
<strong>Fund</strong> and its partners are supporting country actions<br />
in these areas. The <strong>Global</strong> <strong>Fund</strong> will increasingly rely<br />
on assessments of the unit costs of key interventions<br />
integrated in existing M&E systems.
In RWANDA THE GLOBAL FUND SUPPORTED THE ESTABLISHMENT OF COMMUNITY-BASED<br />
SOCIAL INSURANCE TO COVER ORPHANS AND PEOPLE LIVING WITH HIV.<br />
75 THE GLOBAL FUND <strong>2010</strong>: INNOVATION AND IMPACT imprOviNG EFFectiveNess
A CHILD STUDIES AT THE STAR CHILDREN’S HOME IN POKHARA, NEPAL, WHICH<br />
RECEIVES FINANCING FROM THE GLOBAL FUND. ALL 15 CHILDREN RECEIVING<br />
CARE FROM THE HOME ARE LIVING WITH HIV.
4. LEARNING AND<br />
INNOVATING<br />
“The <strong>Global</strong> <strong>Fund</strong> is not only the place where<br />
we create partnerships, but it’s the one<br />
where we have actually been able to do that<br />
differently – to set the pattern and learn.<br />
Maybe it’s the place where we, more than<br />
anything, have learned to listen.”<br />
— SIGRUN MÖGEDAL<br />
HIV/AIDS AMBASSADOR<br />
NORWAY<br />
DURING THE THIRD PARTNERSHIP FORUM, 2008<br />
77 THE GLOBAL FUND <strong>2010</strong>: INNOVATION AND IMPACT INtrODuctiON
1. The <strong>Global</strong> <strong>Fund</strong> is committed to remaining responsive<br />
to countries and to continuing to improve the<br />
efficiency of its operations and the effectiveness of its<br />
investments. It learns through grant and Secretariat<br />
operations; evaluations; from studies undertaken by the<br />
Office of the Inspector General and through its partnerships.<br />
Each of these areas is discussed below.<br />
4.1 Learning<br />
through grant<br />
and Secretariat<br />
operations<br />
2. Learning throughout the grant life cycle. The<br />
<strong>Global</strong> <strong>Fund</strong> grant-making process has built-in feedback<br />
mechanisms that allow for ongoing learning<br />
and improvements. The grant-making process starts<br />
with the preparation of proposals by countries,<br />
supported by technical partners. Next, the Technical<br />
Review Panel 10 evaluates proposals on technical<br />
merit. This is follow-ed by a clarification process based<br />
on the panel review before recommendations are<br />
made to the <strong>Global</strong> <strong>Fund</strong> Board for approval for funding.<br />
Once approved, the grants are implemented by the<br />
Principal Recip ients (see Figure 4.1). Implementation<br />
is carefully monitored using the performance-based<br />
funding approach, with a major review after 18 to 24<br />
months (Phase 2 assessment), where decisions are<br />
made to approve funding for an additional three years.<br />
Each stage of the grant life cycle process provides<br />
an opportunity for the <strong>Global</strong> <strong>Fund</strong> Partnership to learn<br />
and innovate. (For a more complete explanation of<br />
the grant process, see Annex 2.)<br />
FIGURE 4.1 THE GLOBAL FUND GRANT PROCESS<br />
3. Proposal development. CCMs are responsible<br />
for preparing and delivering grant proposals and this<br />
process presents learning opportunities for both the<br />
countries and the <strong>Global</strong> <strong>Fund</strong>. For example, countries<br />
learn by reviewing their national disease programs<br />
to identify the progress, gaps and constraints that will<br />
form the basis for preparing grant proposals. They<br />
also learn from the engagement with civil society, the<br />
private sector and affected communities that is<br />
required as part of the proposal development. Technical<br />
partners such as the STOP TB Partnership, the Roll<br />
Back Malaria Partnership and UNAIDS have mobilized<br />
their resources to support countries to prepare<br />
technically sound proposals.<br />
4. The <strong>Global</strong> <strong>Fund</strong> Secretariat refines its policies<br />
and guidelines in response to lessons emerging from<br />
the proposals and recommendations made by the<br />
Technical Review Panel. Some of the important contributions<br />
and learning emerging from proposal<br />
development include the introduction of dual-track<br />
financing in 2008 (see section 4.5) and the inclusion<br />
of cross-cutting health systems strengthening components<br />
in grant proposals. To reflect Board policies<br />
and guidance from the Technical Review Panel, the<br />
Secretariat has also continuously improved the<br />
guidelines for proposal development.<br />
5. Proposal review. The large number of grant<br />
proposals reviewed by the Technical Review Panel<br />
provides a rich source of comparative information<br />
to identify strengths and weaknesses of the proposals<br />
submitted. The Technical Review Panel provides<br />
written feedback to applicants that can be used to<br />
improve the technical merit of subsequent proposals<br />
and programs. At the same time, country needs are<br />
identified – for example, the need to further simplify<br />
the proposal submission process, which over time has<br />
become too onerous for some countries. Recommendations<br />
from Technical Review Panel reports have<br />
informed several major innovations and reforms in<br />
the <strong>Global</strong> <strong>Fund</strong> (see Table 4.1).<br />
COUNTRY COORDINATING<br />
MECHANISMS<br />
OVERSIGHT<br />
PRINCIPAL<br />
RECIPIENT<br />
5 DISBURSEMENT<br />
4 INSTRUCTIONS<br />
OF GRANT FUNDS<br />
1 REQUEST FOR<br />
DISBURSEMENT WITH<br />
DOCUMENTED RESULTS<br />
GLOBAL FUND TRUSTEE<br />
THE WORLD BANK<br />
5 REPORTING<br />
SUB-RECIPIENTS<br />
LOCAL FUND AGENTS<br />
3 INSTRUCTIONS<br />
TO DISBURSE<br />
2 DATA VERIFICATION<br />
AND ADVICE OF<br />
RELEASE OF<br />
FUNDS<br />
SECRETARIAT<br />
10 The Technical Review Panel is an independent group of international experts in health and<br />
development, established by the <strong>Global</strong> <strong>Fund</strong> Board to review grant proposals for technical<br />
merit and then make funding recommendations to the Board.
6. Grant implementation. In the Secretariat, learning<br />
and continuous improvement occur through the management<br />
and transfer of knowledge. The Secretariat<br />
provides information on all aspects of the grant cycle,<br />
through fact sheets, guidelines and other relevant<br />
technical materials and makes them publicly available<br />
on the <strong>Global</strong> <strong>Fund</strong> website. In addition, the Secretariat<br />
expects that the Enhanced Financial <strong>Report</strong>ing system<br />
and the recent development of an internal knowledge<br />
hub will facilitate rapid and easy access to the latest<br />
information related to <strong>Global</strong> <strong>Fund</strong> operations. To im -<br />
prove its own processes and to facilitate planning, the<br />
Secretariat has created working groups and task<br />
forces on themes such as data quality, gender equality,<br />
sexual orientation and gender identities, harm reduction,<br />
health systems strengthening, and grant signing.<br />
7. Phase 2 reviews. The Phase 2 review process<br />
is an important point for reflection and learning in the<br />
grant life cycle. Countries take stock of their grant<br />
performance at 18 to 24 months and develop a revised<br />
proposal for the next three years. A Phase 2 Panel<br />
consisting of representatives from various clusters of<br />
the <strong>Global</strong> <strong>Fund</strong> Secretariat evaluates the Phase 2<br />
requests to determine whether funds are spent efficiently,<br />
programs are well managed and achieving<br />
the expected results, and funding requests are justified.<br />
On the basis of this evaluation, the panel makes recommendations<br />
for Board consideration and for funding<br />
decisions. The Phase 2 process offers countries the<br />
opportunity to address weaknesses and to refine strategies<br />
for scaling up interventions. In a few cases,<br />
non-performing grants have been suspended.<br />
8. Secretariat review of key performance indicators.<br />
Reviewing the key performance indicators provides<br />
the <strong>Global</strong> <strong>Fund</strong> with another major source of learning<br />
(1). These indicators and their associated targets<br />
enable the comprehensive assessment of various<br />
aspects of the <strong>Global</strong> <strong>Fund</strong>’s performance including:<br />
• the operational performance of the Secretariat<br />
(resource mobilization, administrative effectiveness,<br />
portfolio management and special initiatives);<br />
• grant performance (programmatic achievements<br />
including health and community systems strengthening<br />
and the performance of the <strong>Global</strong> <strong>Fund</strong> grant<br />
portfolio);<br />
• effectiveness (aid effectiveness, transparency<br />
and accountability and overall health and community<br />
systems strengthening); and<br />
• impact (the success of the <strong>Global</strong> <strong>Fund</strong>, its partners<br />
and implementing countries in fighting HIV, TB and<br />
malaria, and in helping attain the MDGs).<br />
9. The Board, through its Policy and Strategy and<br />
Portfolio Implementation committees, reviews the<br />
performance of the Secretariat against the key performance<br />
indicators and their associated targets every<br />
six months. This internal review of progress, achievements<br />
and challenges enables the <strong>Global</strong> <strong>Fund</strong> to<br />
learn and refine its strategies regularly and to focus<br />
on ways to improve grant performance and the<br />
<strong>Global</strong> <strong>Fund</strong>’s overall effectiveness and impact.<br />
79 THE GLOBAL FUND <strong>2010</strong>: INNOVATION AND IMPACT learNING AND INNOvatiNG<br />
TABLE 4.1 ExAMPLES OF INNOVATIONS AND REFORMS BEING IMPLEMENTED IN RESPONSE TO RECOMMENDATIONS<br />
BY THE TECHNICAL REVIEW PANEL<br />
ISSUES RECOMMENDATIONS RESPONSE<br />
Procurement systems and supply management of<br />
health products are major constraints to improved<br />
performance.<br />
Existing national strategies are of variable quality,<br />
and donor-supported programs are frequently<br />
not aligned to national planning cycles.<br />
Increased complexity of <strong>Global</strong> <strong>Fund</strong> grants<br />
leading to:<br />
- fragmented, project-style resource planning;<br />
- multiple grants in the same disease area;<br />
- multiple budgets and performance frameworks;<br />
and<br />
- different grant-specific timelines for phase 2<br />
reviews.<br />
Existing Phase 2 grant performance reviews<br />
are focused on specific grants rather than the<br />
broader national situation.<br />
Address key procurement “bottlenecks”, e.g.<br />
ensuring transparency and cost efficiency in<br />
procurement process and reducing lead time and<br />
delays in procurement and deliveries.<br />
Support robust, inclusive and country-owned national<br />
strategies and thereby improve alignment<br />
to national programs and planning cycles.<br />
Simplify grant implementation and management<br />
for both program implementers and the<br />
Secretariat.<br />
Reduce transaction costs related to reporting and<br />
disbursements.<br />
Facilitate the support of national programs.<br />
Improve performance-based funding through<br />
a more transparent and holistic view of <strong>Global</strong><br />
<strong>Fund</strong>-financed activities in a country.<br />
Introduction of Voluntary Pooled Procurement<br />
and of the associated capacity building services<br />
program (see Section 4.5).<br />
Development of the First Learning Wave of the<br />
National Strategy Applications (see Section 4.5).<br />
Implementation of the new grant architecture<br />
designed to lead to a single stream of funding<br />
per Principal Recipient, per disease, and a fixed<br />
three-year review and commitment cycle (see<br />
Section 4.5).<br />
Redesign of grant performance report and Phase<br />
2 process introduced in <strong>2010</strong>.
4.2 Learning<br />
through<br />
evaluations<br />
10. In 2003, the <strong>Global</strong> <strong>Fund</strong> Board established the<br />
Technical Evaluation Reference Group to provide<br />
independent technical advice and assessment on the<br />
<strong>Global</strong> <strong>Fund</strong>’s work in M&E. The Technical Evaluation<br />
Reference Group is composed of nine Board-appointed<br />
and four ex-officio members from WHO, UNAIDS,<br />
the Roll Back Malaria Partnership and the <strong>Global</strong> <strong>Fund</strong><br />
Secretariat, representing a broad range of disciplines<br />
relevant to M&E. Most recently, it has overseen the Five-<br />
Year Evaluation of the <strong>Global</strong> <strong>Fund</strong>.<br />
11. The Five-Year Evaluation. In 2006, the <strong>Global</strong> <strong>Fund</strong><br />
Board approved a comprehensive external evaluation<br />
of its overall performance with respect to its goals and<br />
principles after five years of operation (i.e. after the<br />
first full grant cycles had been completed). The Board<br />
requested that the Technical Evaluation Reference<br />
Group oversee the design and implementation of the<br />
evaluation and present the final Synthesis <strong>Report</strong> to<br />
the Board in May 2009.<br />
12. The Five-Year Evaluation found that the <strong>Global</strong><br />
<strong>Fund</strong> has made significant contributions towards<br />
its original aims (2). It concluded that the <strong>Global</strong> <strong>Fund</strong><br />
has mobilized and made available high levels of<br />
funding to countries within a relatively short timeframe<br />
and is making an important contribution to the<br />
scaling-up of key interventions for the prevention and<br />
control of HIV, TB and malaria and the strengthening<br />
of health systems.<br />
13. The evaluation also identified a number of unresolved<br />
policy and strategic challenges that needed to<br />
be addressed (see Table 4.2). The Secretariat carefully<br />
scrutinized the evaluation’s 100-plus recommendations<br />
and developed a management response, including<br />
a set of strategies and timebound actions to further<br />
improve the efficiency and effectiveness of its operations.<br />
In addition, the Board established a subcom mittee<br />
of the Policy and Strategy Committee to follow up on<br />
the recommendations of the evaluation (see Table 4.2).<br />
14. The Five-Year Evaluation also recommended that,<br />
rather than embarking on large-scale, multicountry<br />
evaluations every five years, the <strong>Global</strong> <strong>Fund</strong> and its<br />
partners should establish frequent, rigorous and continuous<br />
evaluations of the business model and national<br />
programs for the control of the three diseases and<br />
health systems strengthening.<br />
TABLE 4.2 KEY RECOMMENDATIONS FROM THE FIVE-YEAR EVALUATION AND THE RESPONSE FROM THE GLOBAL FUND SECRETARIAT<br />
RECOMMENDATION<br />
RESPONSE<br />
RESOURCE MOBILIZATION<br />
Address concerns about the sustainability, predictability and<br />
additionality of further funding<br />
• Developed resource mobilization strategy to diversify funding sources<br />
• Initiated measures to achieve efficiency gains in grants portfolio and<br />
within the Secretariat<br />
• Established working group to address tension between resource demand<br />
and supply<br />
THE GLOBAL FUND PORTFOLIO OF INVESTMENTS<br />
Address gaps in the portfolio of investments to move toward universal<br />
access to AIDS, TB and malaria interventions, further strengthen health<br />
systems, and improve equity and gender equality<br />
• Review of portfolio of investments to identify gaps in collaboration<br />
with partners<br />
• Collaboration with CCMs, Principal Recipients and partners to<br />
re-program existing grants to address service gaps<br />
THE GLOBAL FUND BUSINESS MODEL<br />
Develop a corporate strategy that reconciles the inherent tensions within<br />
the principles that underpin the <strong>Global</strong> <strong>Fund</strong>’s business model and refine<br />
the performance-based funding system<br />
• Board review of <strong>Global</strong> <strong>Fund</strong> principles to address tensions that<br />
have emerged<br />
• Introduced new grant rating methodology<br />
GRANT-MAKING MECHANISM<br />
Innovate and simplify grant architecture<br />
• Implemented First Learning Wave of National Strategy Applications<br />
• Board-approved architecture review for a single stream of funding,<br />
per Principal Recipient, per disease<br />
BUILDING AN EFFICIENT AND EFFECTIVE ORGANIZATION<br />
Improve efficiency and effectiveness of the <strong>Global</strong> <strong>Fund</strong><br />
• Restructured Secretariat to improve human resource and operational<br />
efficiency<br />
• Prioritized and began implementing mission-critical systems<br />
(such as deployment of information technology, strengthening<br />
procurement, and enhancing internal and external communications)<br />
• Introduced Risk Management Framework
In EGYPT, THE GLOBAL FUND SUPPORTS THE NATIONAL TUBERCULOSIS CONTROL<br />
PROGRAM. THE COUNTRY HAS SUCCEEDED IN ACHIEVING THE GLOBAL TARGETS FOR<br />
TB CASE DETECTION AND TREATMENT SUCCESS.<br />
81 THE GLOBAL FUND <strong>2010</strong>: INNOVATION AND IMPACT learNING AND INNOvatiNG
15. In response, the Secretariat is developing a<br />
systematic approach to evaluation, knowledge generation<br />
and learning, and working with key technical<br />
partners and countries to conduct continuous monitoring<br />
of the programs it finances, including evaluations<br />
in five to seven countries each year. These evaluations<br />
will assist:<br />
• efforts to strengthen country health information,<br />
surveillance, and M&E systems, along with analytic<br />
capacity and the use of evidence for program<br />
management;<br />
• in identifying optimal service delivery designs to<br />
effectively scale up HIV, TB and malaria services; and<br />
• in measuring epidemiological impact and health<br />
systems effects of <strong>Global</strong> <strong>Fund</strong> investments.<br />
16. The <strong>Global</strong> <strong>Fund</strong> commissions independent<br />
evaluations to complement its own evaluations and<br />
those conducted by country partners. The Board,<br />
Board committees, Executive Management Team and<br />
Technical Evaluation Reference Group decide annually<br />
on the focus of these evaluations.<br />
17. The <strong>Global</strong> <strong>Fund</strong> adheres to the following fundamental<br />
principles for conducting evaluations:<br />
• Be a joint learning process with mutual accountability.<br />
• Use existing systems.<br />
• Align with country governance cycles.<br />
• Build institutional capacity.<br />
• Develop staff member competencies.<br />
• Use standardized tools to allow for comparability<br />
among countries and over time.<br />
• Balance scientific rigor and feasibility.<br />
• Seek to be objective.<br />
4.3 Learning<br />
from studies<br />
undertaken<br />
by the Office<br />
of the Inspector<br />
General<br />
18. The Office of the Inspector General was established<br />
by the Board of the <strong>Global</strong> <strong>Fund</strong> in July 2005<br />
and began work in December 2005. The Office of<br />
the Inspector General operates as an independent unit<br />
of the <strong>Global</strong> <strong>Fund</strong>, reporting directly to the Board.<br />
19. Led by the Inspector General, the mission of the<br />
Office of the Inspector General is to provide the <strong>Global</strong><br />
<strong>Fund</strong> with independent and objective assurance over<br />
the design and effectiveness of controls in place to<br />
manage the key risks impacting the <strong>Global</strong> <strong>Fund</strong>’s programs<br />
and operations.<br />
20. The scope of work of the Inspector General<br />
encompasses all aspects of the <strong>Global</strong> <strong>Fund</strong>’s activities.<br />
All systems, processes, operations, functions and<br />
activities within the <strong>Global</strong> <strong>Fund</strong> are subject to the<br />
Inspector General’s review. The activities of the Office<br />
of the Inspector General include audit, inspection,<br />
counter-fraud and promotion of ethical conduct, investigations,<br />
assurance validation, and functional reviews.<br />
In performing these activities the Inspector General has<br />
the authority to access all books and records maintained<br />
by the <strong>Global</strong> <strong>Fund</strong>, including all records relating<br />
to grants funded by the <strong>Global</strong> <strong>Fund</strong>, whether maintained<br />
by Principal Recipients, sub-recipients, Local <strong>Fund</strong><br />
Agents or Local <strong>Fund</strong> Agent subcontractors, where<br />
permitted under applicable arrangements. The Inspector<br />
General can seek any information he needs from any<br />
personnel involved in the <strong>Global</strong> <strong>Fund</strong>’s projects and<br />
require personnel to cooperate with any reasonable<br />
request made by the Office of the Inspector General.<br />
In addition he may obtain independent professional<br />
advice and secure the involvement of outside persons<br />
with relevant experience and expertise if and when<br />
determined necessary.
21. Since its inception, the Office of the Inspector<br />
General, as part of its mandate to provide assurance<br />
on grant processes and other main business processes,<br />
has undertaken a number of country audits and<br />
reviews of processes at the <strong>Global</strong> <strong>Fund</strong> Secretariat.<br />
As part of its 2009 work plan, the Office of the<br />
Inspector General synthesized the issues arising from<br />
the audits/reviews undertaken to identify common<br />
issues emerging as well as their likely causes. In a report<br />
published in September 2009, the Office made a<br />
number of concrete recommendations aimed at strengthening<br />
grant processes.<br />
22. The Secretariat has put in place new systems<br />
to further strengthen its approach to managing risk.<br />
In particular, this involves a systematic approach<br />
and dedicated resources to follow up on the findings<br />
and recommendations of the Office of the Inspector<br />
General. The Secretariat analyses the recommendations<br />
in each of the Office’s reports and allocates responsibility<br />
for implementing them within a certain timeline.<br />
Senior management monitors progress of implementation.<br />
For example, the Secretariat is finalizing Principal<br />
Recipient Financial Audit Guidelines in response to<br />
the Office’s recommendations on Principal Recipient<br />
audit arrangements.<br />
4.4 LEARNING<br />
THROUGH<br />
PARTNERSHIPS<br />
23. The <strong>Global</strong> <strong>Fund</strong> is a public-private partnership<br />
of donor and recipient governments, technical agencies,<br />
NGOs, the private sector (including businesses and<br />
philanthropic foundations) and affected communities.<br />
This diversity is reflected in its Board and Committee<br />
structures, the Partnership Forum and the CCMs.<br />
24. Country Coordinating Mechanisms. At the country<br />
level, the CCM embodies the <strong>Global</strong> <strong>Fund</strong> principles<br />
of inclusiveness, country ownership and partnership<br />
through multistakeholder collaboration. CCMs include<br />
NGOs, governments, multilateral and bilateral agencies,<br />
academic institutions, private businesses, and people<br />
living with and affected by the three diseases.<br />
BOX 4.1 The Third ParTNErshIP<br />
Forum, dAKAr, dECEmBEr 2008<br />
The overarching theme of the Third Partnership Forum was “Listening to<br />
the voices: stronger and more effective partnership for sustained impact”.<br />
The forum examined this theme in five areas: partnership and gender<br />
(women and girls), partnership and gender (sexual minorities), partnership<br />
and demand, partnership and coordination, and partnership and implementation.<br />
The process culminated in a meeting in Dakar attended by<br />
around 500 delegates.<br />
The Partnership Forum generated 28 recommendations that are being used<br />
by the Secretariat, the Board and its committees to develop new strategies<br />
and improve the effectiveness of the <strong>Global</strong> <strong>Fund</strong>. Examples of these recommendations<br />
include ensuring that partnership agreements of the <strong>Global</strong><br />
<strong>Fund</strong> have a component on technical assistance and capacity building, and<br />
that countries should work within the frameworks of “know your epidemic”<br />
and “know your response” strategies. The Partnership Forum also requested<br />
the <strong>Global</strong> <strong>Fund</strong> to develop an accountability framework and action plan<br />
to prevent grants from performing poorly and to support those that do.<br />
25. The CCM serves as an interface between the<br />
national situation and <strong>Global</strong> <strong>Fund</strong> policies and funding.<br />
By providing a broad platform for national dialogue,<br />
the CCM is better able to assess implementation challenges<br />
and to recommend solutions that are informed by<br />
local context. Through regular interactions with the<br />
Secretariat, supported programs and <strong>Global</strong> <strong>Fund</strong><br />
partners, CCMs bring the voice of local communities to<br />
<strong>Global</strong> <strong>Fund</strong> policy.<br />
26. The Partnership Forum. The Partnership Forum<br />
is an integral part of <strong>Global</strong> <strong>Fund</strong> governance and<br />
is designed to enable a platform for frank discussion<br />
of strategies and policies, providing stakeholders –<br />
including some actors who are not currently involved<br />
in <strong>Global</strong> <strong>Fund</strong> work – an opportunity to learn from<br />
and debate issues with each other. The objectives of<br />
the Partnership Forum are to:<br />
• review and provide feedback on <strong>Global</strong> <strong>Fund</strong> progress;<br />
• develop recommendations for strategy, policy and<br />
practice; and<br />
• mobilize and sustain political commitment for action<br />
on HIV, TB and malaria, including sustainable, longterm<br />
financing (3).<br />
27. The Partnership Forum takes place every two<br />
years. It consists of online discussions, consultations<br />
on certain themes at a variety of internal and external<br />
events, and a large stakeholder meeting. Partnership<br />
fora were held in Bangkok in 2004 (4), in Durban in<br />
2006 (5), and in Dakar in 2008 (see Box 4.1) (6).<br />
83 THE GLOBAL FUND <strong>2010</strong>: INNOVATION AND IMPACT INtrODuctiON
4.5 Continuing<br />
to undertake<br />
new initiatives<br />
and innovate<br />
28. From the start, the <strong>Global</strong> <strong>Fund</strong> has sought to<br />
adopt key innovations in the field of development, such<br />
as country-driven demand and performance-based<br />
funding, and to evolve them further, beyond what other<br />
organizations have done before. It has continued to<br />
undertake new initiatives and to introduce other major<br />
innovations. Some of these developments are summarized<br />
in Table 4.3 and described below.<br />
29. Country-driven demand. For the first time, a global<br />
institution allowed its resource mobilization goals<br />
to be determined primarily by country demand, linking<br />
grant eligibility to participatory proposal development<br />
and program oversight by the stakeholders themselves.<br />
The demand-driven approach has encouraged not<br />
only the public sector but also civil society to address<br />
the health and health system problems of those<br />
most in need: low-income countries, countries with<br />
high disease burdens, and vulnerable, at-risk and<br />
marginalized groups.<br />
30. Country-driven demand improves planning at the<br />
national level by starting the process with assessments<br />
of realizable needs rather than second-guessing<br />
available resources. It has also enabled global resource<br />
planning by introducing a new element between the<br />
traditional, global “needs estimates” for each disease<br />
on the one hand and expressions of resources available<br />
made by individual donors on the other. By introducing<br />
a figure for “fundable, high-quality demand”<br />
the <strong>Global</strong> <strong>Fund</strong> country-driven demand process has<br />
been able to convince donors to place substantial<br />
additional resources on the table in exchange for reassurances<br />
of a positive return on investment.<br />
32. Performance-based funding. In less than five<br />
years, the <strong>Global</strong> <strong>Fund</strong> has developed an operational<br />
platform to implement performance-based funding<br />
in 144 countries. It has learned and progressively<br />
strengthened its performance-based funding model<br />
to invest strongly in M&E systems, include impact<br />
data, and consolidate reporting. This model has been<br />
recognized by the Five-Year Evaluation and other<br />
independent evaluations as unique in terms of its innovativeness<br />
and the scale at which it has been<br />
implemented (2,7).<br />
33. At the same time, challenges and opportunities<br />
for improvement have been identified. For example,<br />
the simplification of reporting into one-year and threeyear<br />
cycles could increase alignment and reduce<br />
transaction costs. The <strong>Global</strong> <strong>Fund</strong> is also placing<br />
a greater emphasis on impacts, outcomes, value for<br />
money, equity and the quality of services. The implementation<br />
of a new grant architecture (described<br />
below) will address some of these challenges through<br />
single streams of funding, a more holistic assessment<br />
of program performance and impact, and increased<br />
alignment to national program cycles.<br />
34. Country Coordinating Mechanisms. A CCM’s<br />
capa city for oversight is critical in ensuring that the<br />
country uses its grant resources effectively to<br />
achieve its program goals in a sustainable manner<br />
(see Annex 2 for more about the role of CCMs).<br />
In 2009, the <strong>Global</strong> <strong>Fund</strong> continued its efforts to<br />
strengthen the governance and grant oversight capacities<br />
of CCMs. The Board approved a new CCM<br />
funding policy that applies the principle of performancebased<br />
funding to CCMs’ key governance functions.<br />
To date, the <strong>Global</strong> <strong>Fund</strong> has provided each CCM with<br />
a maximum of US$ 43,000 per year to support its<br />
governance functions. Under the new policy, a CCM<br />
will be able to access more funds, provided that it<br />
invests them in oversight, constituency engagement<br />
and alignment with suitable in-country bodies or<br />
activities to strengthen its own capacities, particularly<br />
those related to gender equality.<br />
31. The response to the first nine funding rounds<br />
(2002–2009) underscores the huge demand for assistance<br />
in low- and middle-income countries, yielding<br />
a total of 1,610 eligible proposals for review by the<br />
independent Technical Review Panel.<br />
35. Dual-track financing. Based on evidence that<br />
civil society organizations and the private sector play<br />
a critical role in scaling up programs and reaching<br />
at-risk populations, a process dubbed “dual-track<br />
financing” was introduced in Round 8 (2008) as the<br />
default approach to program partnership. Through this<br />
new mechanism, CCMs are encouraged to nominate<br />
both a government entity and an NGO to be Principal<br />
Recipients in a grant. As a result, around 40 percent<br />
of Principal Recipients in Rounds 8 and 9 are nongovernmental,<br />
compared to just 23 percent over the<br />
previous seven rounds.
A SOCIAL WORkER MAkES HOME VISITS TO SUPERVISE PATIENTS TAkING THEIR TB<br />
MEDICINE IN JORDAN. THE GLOBAL FUND SUPPORTS JORDAN IN OPENING UP TREATMENT<br />
FOR ALL, INCLUDING Palestinian SETTLERS AND NON-JORDANIAN NATIONALS –<br />
WHO COLLECTIVELY MAke UP MORE THAN ONE-THIRD OF THE POPULATION.<br />
85 THE GLOBAL FUND <strong>2010</strong>: INNOVATION AND IMPACT learNING AND INNOvatiNG
TABLE 4.3 INNOVATION MILESTONES AT THE GLOBAL FUND (2002−2008)<br />
YEARS STRATEGIC AREA INNOVATION<br />
2002–2005 • GLOBAL FUND PRINCIPLES • The key principles are established and disseminated: a demand-driven approach,<br />
performance-based funding, inclusiveness, and independent technical review.<br />
2006–2007 • RESOURCE MOBILIzATION • (PRODUCT) red , a source of private funding, is launched. The first Debt2Health<br />
agreement is signed between Germany and Indonesia.<br />
2008 • Partnerships • Dual-track financing is introduced in Round 8, enabling governments and NGOs<br />
to expand service delivery.<br />
• EQUITY<br />
• The Board approves the Gender Equality Strategy and pushes for increased<br />
representation of vulnerable groups in CCMs.<br />
36. Health systems strengthening. The <strong>Global</strong> <strong>Fund</strong><br />
has supported health systems strengthening efforts<br />
since its inception, recognizing that to ensure the longterm<br />
effectiveness of investments in disease-specific<br />
programs, it is necessary to strengthen health systems.<br />
However, until 2005 the ways in which <strong>Global</strong> <strong>Fund</strong>supported<br />
programs contributed to strengthening health<br />
systems could not be explicitly tracked. Round 5 made<br />
the first call for separate health systems strength ening<br />
grant applications. That option was discontinued<br />
because of low uptake. Since Round 7, countries have<br />
been able to include funding for strategic health systems<br />
strengthening activities as an explicit part of<br />
disease-specific grant applications. Health systems elements<br />
eligible for funding include human resources,<br />
infrastructure and equipment, and M&E. The strategic<br />
actions are coordinated with in-country partners<br />
as well as with national health plans. To date, a total<br />
of US$ 1.2 billion has been approved for cross-cutting<br />
health systems strengthening interventions.<br />
37. (PRODUCT) RED is the best known of the initiatives<br />
and partnerships that has enabled the <strong>Global</strong> <strong>Fund</strong> to<br />
significantly increase private sector resource mobilization<br />
in recent years. Initiated in 2006 by rock musician<br />
Bono and Bobby Shriver (Chair of Debt, AIDS, Trade<br />
and Africa (DATA)), (RED) supports the <strong>Global</strong> <strong>Fund</strong><br />
through the sale of popular brand-name products bearing<br />
the (PRODUCT) RED logo. Up to 50 percent of the<br />
gross profits from the sale of these products are then<br />
directed to the <strong>Global</strong> <strong>Fund</strong>. Current partners include<br />
American Express (UK), Apple, Converse, Dell, Emporio<br />
Armani, Gap, Hallmark, Microsoft and Starbucks. New<br />
partner launches in 2009 included Bugaboo and Nike.<br />
Bugaboo, the Netherlands-based pushchair manufacturer,<br />
became the first company to support the <strong>Global</strong><br />
<strong>Fund</strong> by offering 1 percent of net revenues across its<br />
entire product range. Nike became the first partner to<br />
sell (RED) products in Africa. In 2009 (RED) also<br />
launched an exclusive concert series – (RED)NIGHTS –<br />
benefiting the <strong>Global</strong> <strong>Fund</strong>. (PRODUCT) RED has raised<br />
US$ 140 million as of the end of 2009 to support programs<br />
in Rwanda, Ghana, Lesotho and Swaziland,<br />
and continues to be an innovative source of sustainable,<br />
additional private funding.<br />
38. Debt2Health. In 2007, the <strong>Global</strong> <strong>Fund</strong> launched<br />
an initiative which facilitates debt swap agreements<br />
between creditors and recipient countries. While debt<br />
swaps are known development financing instruments,<br />
the innovative feature of Debt2Health is that creditors<br />
agree to relinquish interest payments on a country’s<br />
debt on the condition that the recipient country invests<br />
the freed-up resources in public health using the<br />
<strong>Global</strong> <strong>Fund</strong> system. By the end of 2009, two agreements<br />
had been signed and a third was pending<br />
signature. These three agreements cover debts with<br />
a face value of US$ 146 million and will eventually<br />
raise US$ 80 million to fight disease. Another three<br />
agreements with a face value of US$ 110 million are<br />
being negotiated, with the potential to generate additional<br />
resources of US$ 74 million.<br />
39. In 2009 the <strong>Global</strong> <strong>Fund</strong> launched a number of<br />
innovations and other initiatives aimed at strengthening<br />
country governance and health systems and addressing<br />
access issues (Table 4.4). They are described in the<br />
following sections.<br />
40. New grant architecture. As the <strong>Global</strong> <strong>Fund</strong> has<br />
grown in size and capacity, demand for financing from<br />
countries with heavy disease burdens has accelerated<br />
to a point where streamlining procedures and simplifying<br />
grant management is critical to ensure operations<br />
are efficient. Under the <strong>Global</strong> <strong>Fund</strong>’s current model,<br />
each newly approved proposal results in a separate<br />
grant agreement. By contrast, under a new grant architecture<br />
approved by the Board of the <strong>Global</strong> <strong>Fund</strong> in<br />
November 2009, the <strong>Global</strong> <strong>Fund</strong> will establish a single<br />
stream of funding per Principal Recipient per disease.<br />
It will then maintain this grant agreement, updating it<br />
each time the Board approves a new funding proposal<br />
for the same country and disease. It is anticipated that<br />
this new architecture will enable Principal Recipients<br />
to manage their programs and finances more efficiently,<br />
as well as improve program M&E. By streamlining the<br />
grant process, the Secretariat also expects to manage<br />
its grant portfolio more efficiently and effectively.
41. National Strategy Applications. A first “learning<br />
wave” of so-called “National Strategy Applications”<br />
was launched in 2009 on a pilot basis, offering a new<br />
way to apply for financing based on a country’s<br />
national disease strategy, rather than the standard<br />
proposal-based grant applications.<br />
42. The anticipated benefits of National Strategy<br />
Applications are:<br />
• improved alignment of <strong>Global</strong> <strong>Fund</strong> financing with<br />
national priorities, program cycles and budgetary<br />
cycles, and reduced transaction costs for countries;<br />
• improved harmonization with donors that use similar<br />
criteria for reviewing national strategies;<br />
• an opportunity to promote broad stakeholder<br />
participation in national strategy development and<br />
implementation; and<br />
• encouraging national strategies to focus on managing<br />
for results and accountability.<br />
43. In November 2009, the Board approved five<br />
National Strategy Applications worth US$ 434 million<br />
over two years (and US$ 756 million over the lifetime<br />
of the proposals). 11 The <strong>Global</strong> <strong>Fund</strong> will negotiate and<br />
manage these grants in a manner that maximizes their<br />
alignment with national policy and budget cycles while<br />
maintaining its core principles, including the principle<br />
of performance-based funding. Grants that result from<br />
this first learning wave will be managed as part of the<br />
new grant architecture.<br />
44. Services to prevent vertical transmission. A new<br />
<strong>Global</strong> <strong>Fund</strong> initiative aims to improve the quality and<br />
coverage of services to prevent vertical transmission.<br />
The percentage of HIV-positive women who received<br />
ART to prevent transmission of HIV to their children<br />
increased from 35 percent globally at the end of 2007<br />
to 45 percent at the end of 2008. While the improved<br />
global coverage and rate of scale-up of programs to<br />
prevent vertical transmission (commonly referred to as<br />
PMTCT services) is encouraging, coverage remains<br />
low in many of the countries with the highest need and<br />
nearly a third of women received sub-optimal ARV<br />
prophylaxis (single-dose Nevirapine).<br />
45. The <strong>Global</strong> <strong>Fund</strong> has supported access to PMTCT<br />
services for 340,000 HIV-positive pregnant women<br />
in 2009 alone – over five times the number of pregnant<br />
women reached two years ago by <strong>Global</strong> <strong>Fund</strong>supported<br />
programs. As part of a PMTCT initiative, the<br />
<strong>Global</strong> <strong>Fund</strong> is committed to improving the quality<br />
of ARV regimens being offered to pregnant women,<br />
newborns and families, increasing the resources<br />
directed at PMTCT and ensuring that current funding<br />
in this area is being used effectively and efficiently.<br />
In order to achieve this, the <strong>Global</strong> <strong>Fund</strong> has set two<br />
ambitious but achievable targets:<br />
• Target 1: In the next 18 months, the <strong>Global</strong> <strong>Fund</strong><br />
will work to ensure that at least 80 per cent of HIVpositive<br />
mothers reached through <strong>Global</strong>-<strong>Fund</strong><br />
supported programs receive the most optimal regimen<br />
to prevent transmission.<br />
• Target 2: In the next 18 months, PMTCT coverage<br />
will be scaled up to reach at least 60 percent of<br />
HIV-positive mothers in countries in sub-Saharan<br />
Africa with the highest burden of mother-to-child<br />
transmission and pediatric AIDS: Nigeria, South<br />
Africa, Mozambique, Kenya, Tanzania, Uganda,<br />
Zambia, Malawi, Zimbabwe, Ethiopia. (While this<br />
is not an official UN target, the <strong>Global</strong> <strong>Fund</strong> will work<br />
with all partners, including the UN, PEPFAR, implementing<br />
countries and others to increase coverage<br />
and impact).<br />
46. The Affordable Medicines Facility – malaria<br />
(AMFm). Improving access to affordable medicines<br />
and other health products is a critical component<br />
of efforts to improve health outcomes. AMFm is a pioneering<br />
financing mechanism that the <strong>Global</strong> <strong>Fund</strong><br />
is hosting. It was originally proposed in a committee<br />
report from the U.S. Institute of Medicine (8) in 2004.<br />
The AMFm technical design was developed with guidance<br />
from the Roll Back Malaria Partnership.<br />
47. Launched in April 2009, AMFm will expand<br />
access to ACT for the treatment of malaria through the<br />
public, private and civil society sectors. In addition<br />
to substantially reducing the burden of disease due to<br />
malaria, this is expected to retard the resistance of<br />
malaria to artemisinin by replacing artemisinin monotherapy<br />
with ACT. AMFm has two key elements:<br />
• reducing prices by negotiating with drug manufacturers<br />
and subsidizing a part of the resulting price<br />
with a “co-payment”; and<br />
• supporting the proper use of ACT.<br />
48. After negotiating lower drug prices with manufacturers,<br />
the AMFm will pay a large part of the resulting<br />
price (i.e. make a substantial co-payment) on behalf of<br />
eligible first-line buyers – international and national<br />
buyers that purchase the drugs directly from the manufacturer,<br />
as well as procurement agents acting for<br />
them. ACT will then be delivered through a combination<br />
of public, nongovernmental and private channels.<br />
49. Public sector and nongovernmental outlets will<br />
continue their practice of distributing the treatment<br />
for free or for a modest charge. For people who purchase<br />
malaria treatment from the private sector, the<br />
price of co-paid ACT drugs should be comparable to<br />
the price of other antimalarial drugs, such as chloroquine<br />
and sulfadoxine-pyrimethamine. The price of ACT<br />
is expected to drop from US$ 11 per treatment to less<br />
than US$ 1.<br />
87 THE GLOBAL FUND <strong>2010</strong>: INNOVATION AND IMPACT learNING AND INNOvatiNG<br />
11 The successful National Strategy Applications were China (malaria), Nepal (TB), Rwanda (HIV and TB) and Madagascar (malaria).
TABLE 4.4<br />
INNOVATION MILESTONES AT THE GLOBAL FUND (2009)<br />
STRATEGIC AREA<br />
AID EFFECTIVENESS<br />
COUNTRY OWNERSHIP<br />
ACCESS TO MEDICINES AND<br />
RELATED COMMODITIES<br />
HEALTH SYSTEMS<br />
STRENGTHENING<br />
INNOVATION<br />
• A new grant architecture to streamline<br />
grant design, implementation, and M&E<br />
• National Strategy Applications<br />
• First Learning Wave of National<br />
Strategy Applications<br />
• Affordable Medicines Facility – malaria<br />
• Voluntary Pooled Procurement<br />
• Proposal for a joint platform for funding<br />
and technical support of health systems<br />
strengthening<br />
50. In early <strong>2010</strong>, ten pilot projects (in Cambodia,<br />
Ghana, Kenya, Madagascar, Niger, Nigeria, Rwanda,<br />
Uganda and in the United Republic of Tanzania<br />
(mainland and Zanzibar)) will participate in Phase 1<br />
of the AMFm and implement interventions to promote<br />
appropriate use of ACT drugs. Financial support<br />
for the pilot projects comes from UNITAID, the<br />
government of the United Kingdom, and the Bill and<br />
Melinda Gates Foundation.<br />
51. Voluntary pooled procurement, also launched<br />
in June 2009, revolves around collective purchasing<br />
of drugs and related commodities. This initiative aims<br />
to influence characteristics such as price, quality and<br />
supply by bulk purchasing, thereby facilitating ready<br />
access to medicines and other products. Four product<br />
categories constitute the initiative’s initial focus: firstline<br />
ARVs, second-line ARVs, ACT drugs and LLINs. The<br />
short-term strategy includes monitoring the prices, cost<br />
savings and market share, while the long-term strategy<br />
will focus on strengthening national procurement<br />
systems and supply chain management. Procurement<br />
transactions worth US$ 271.4 million have been processed<br />
so far for 16 countries and 24 grants. Another<br />
18 countries have registered for voluntary pooled<br />
procurement and have submitted requests for procurement<br />
assistance. To date, ten countries have expressed<br />
interest in receiving capacity building and supply chain<br />
management assistance.<br />
52. A common platform for health systems strengthening.<br />
Another new initiative is the proposed common<br />
funding platform for health systems strengthening<br />
with the World Bank and the GAVI Alliance, facilitated<br />
by WHO. Collectively, working with partners and countries<br />
during <strong>2010</strong>, the four agencies will elaborate the<br />
policy, operational and financial implications of this<br />
platform. Among the platform components to be<br />
develop ed are common funding policies for health<br />
systems strengthening, common country eligibility<br />
criteria, joint review mechanisms for proposals, program<br />
oversight, harmonization of technical support and<br />
a common framework for measuring performance. For<br />
the first time, these major global agencies have proposed<br />
to jointly use their resources for health systems<br />
strengthening in low- and middle-income countries.<br />
Some of the expected benefits of the joint platform<br />
are reduced transaction costs for countries in accessing<br />
funding for this strategic area; increased global focus<br />
on health systems strengthening; better long-term<br />
predictability of donor funding and improved harmonization<br />
and alignment of funding and programming<br />
for health systems strengthening at the global and<br />
country levels.
GLOBAL FUND ASSISTANCE TO WOMEN AND CHILDREN LIVING WITH HIV IN TANzANIA<br />
HAS HELPED INCREASE UPTAke OF COUNSELING AND TESTING, PROVISION OF ART, AND<br />
USE OF PMTCT SERVICES, AND HAS ALSO SUPPORTED PROGRAMS FOR ORPHANS AND<br />
OTHER VULNERABLE CHILDREN.<br />
89 THE GLOBAL FUND <strong>2010</strong>: INNOVATION AND IMPACT learNING AND INNOvatiNG
A VILLAGE DOCTOR IN CHINA MONITORS THE HEALTH OF RECOVERING TB PATIENTS,<br />
WALkING AN HOUR EACH DAY TO VISIT THEM IN THEIR HOMES AND MONITOR THEIR<br />
MEDICATION. THE GLOBAL FUND SUPPORTS THE EXPANSION OF DOTS IN CHINA.
5. CONCLUSIONS<br />
“The <strong>Global</strong> <strong>Fund</strong> program has been a good<br />
supplement to government programs.<br />
The coverage area for prevention activities<br />
and treatment has been expanded a great<br />
deal and now reaches as far out as the villages.<br />
Thanks to the village clinics and doctors<br />
everybody has access to services in TB, malaria<br />
and HIV.”<br />
— DR XU<br />
YUNNAN PROVINCE, CHINA<br />
91 THE GLOBAL FUND <strong>2010</strong>: INNOVATION AND IMPACT INtrODuctiON
1. In recent years, the world has made remarkable<br />
progress in many areas of global public health. In particular,<br />
there are signs of a dramatic turnaround<br />
in the fight against AIDS, TB and malaria. The coming<br />
years will doubtless see even more positive results<br />
and greater impact, given the recent intensification<br />
of efforts – more than half of all the services financed<br />
by the <strong>Global</strong> <strong>Fund</strong> so far were delivered in 2008 and<br />
2009 and are only just now starting to show results<br />
in terms of lives saved and infections averted.<br />
2. The global effort to fight AIDS, TB and malaria<br />
has a wider impact and benefits everyone. The three<br />
diseases are directly responsible for enormous burdens<br />
of death and disability, but they also have major<br />
repercussions for human development and society.<br />
<strong>Global</strong> <strong>Fund</strong> programs contribute substantially to the<br />
achievement of the MDGs. The MDG 6 targets for<br />
combating HIV, malaria and other diseases can be<br />
met, and some can even be exceeded, if progress<br />
is allowed to continue at the current rate. Malaria can<br />
be eliminated as a public health problem in most<br />
endemic countries, the growing threat of MDR-TB can<br />
be contained, and transmission of HIV from mothers<br />
to their children can be virtually eliminated.<br />
3. <strong>Global</strong> efforts to fight AIDS, TB and malaria,<br />
as channeled through the <strong>Global</strong> <strong>Fund</strong>, also contribute<br />
to achieving mdGs 1, 4, 5 and 8, addressing extreme<br />
poverty and hunger, child health, maternal health and<br />
global partnership, respectively. The efforts supported<br />
by the <strong>Global</strong> <strong>Fund</strong> to improve children’s and women’s<br />
health are particularly important, as they support the<br />
scale-up of basic services for women and children, in<br />
addition to fighting AIDS and malaria, two of the main<br />
causes of death among women and children in many<br />
regions of the world.<br />
4. Investments that have been made have also<br />
strengthened health systems. By setting ambitious<br />
tar gets and making funding flows dependent<br />
on achieving these, the performance-based funding<br />
model of the <strong>Global</strong> <strong>Fund</strong> has exposed health<br />
systems’ weaknesses and provided an incentive and<br />
the funding to address them. Investments undertaken,<br />
while focused on achieving progress in the fight<br />
against the three diseases, have helped strengthen<br />
the overall capacity of health systems by expanding<br />
community and district health facilities, improving<br />
procurement and administration capacity and retaining<br />
health workers.<br />
5. For the last eight years, the <strong>Global</strong> <strong>Fund</strong> has been<br />
a major engine driving dramatic advances in the<br />
fight against HIV, TB and malaria. The programs it has<br />
funded have saved 4.9 million lives and improved the<br />
quality of life of many of the some 33 million people<br />
living with HIV, hundreds of millions of people who<br />
contract or are at risk of contracting malaria each year,<br />
and 9.4 million who contract active TB annually. The<br />
<strong>Global</strong> <strong>Fund</strong> has also been a driver for increased funding.<br />
It has proven itself as an efficient channel for<br />
this funding to health programs in 144 countries. It has<br />
focused international efforts of dozens of public,<br />
private and multilateral institutions towards achieving<br />
ambitious, measurable targets.
6. In this sense, the <strong>Global</strong> <strong>Fund</strong> is driving a<br />
major global effort that is on the road to achieving<br />
impressive successes in the fight for global health.<br />
All partners and stakeholders should take considerable<br />
pride in the role they play in this work.<br />
7. As the economic crisis of the past two years has<br />
led to considerable pressure on government budgets<br />
and to tremendous hardship for hundreds of millions<br />
of people around the world, the <strong>Global</strong> <strong>Fund</strong>’s work to<br />
improve value for money, increase efficiency and<br />
to channel resources to where they achieve the best<br />
results has become even more important than before.<br />
8. The past year’s economic crisis dropped millions<br />
of people below the poverty line. It followed a period<br />
of solid economic growth in many places that lifted<br />
millions out of poverty. Through its programs, the <strong>Global</strong><br />
<strong>Fund</strong> and its partners can help provide a safety net<br />
for some of the poorest and most vulnerable populations,<br />
thereby partly alleviating the impact of the<br />
financial crisis. These programs can also help bridge<br />
the health gaps that often accompany income gaps,<br />
for example by helping to retain health workers in impoverished<br />
areas where they are needed most, and<br />
by providing prevention, treatment and care services<br />
to people who are otherwise unable to afford them.<br />
In addition, the <strong>Global</strong> <strong>Fund</strong> brings together North and<br />
South in decision-making, thereby encouraging them<br />
to create a shared vision and common purpose.<br />
9. The <strong>Global</strong> <strong>Fund</strong> strives to be a 21st-century<br />
international development agency – efficient, transparent<br />
and adaptable. Established as a public-private<br />
partnership, it has introduced numerous major advances<br />
and best practices to its systems, policies, infrastructure<br />
and operations, allowing it to leverage its resources<br />
substantially in scaling up the fight against HIV, TB<br />
and malaria. The <strong>Global</strong> <strong>Fund</strong> is country-focused, and<br />
its organizational structure allows it to rapidly respond<br />
to the needs of its partners and the people affected<br />
by the three diseases.<br />
10. This report describes the gaining of great<br />
momentum in global health. Goals that only a few years<br />
ago seemed utopian are within reach. Now is the time<br />
to further intensify efforts and to make a commitment<br />
to continue scaling up the response to HIV, TB and<br />
malaria, to safeguard and continue building upon the<br />
substantial achievements already made. While the<br />
results and impact described in this report should be<br />
cause for optimism, the progress made in the last<br />
years is fragile. A reduction – or even stagnation –<br />
of efforts would lead to reversals of recent progress.<br />
Continued, increased investments in health generally<br />
and in HIV, TB and malaria specifically, are needed,<br />
not only to reach or exceed the health-related MDGs,<br />
but also to preserve global stability and protect<br />
countries and communities at risk of disease.<br />
93 THE GLOBAL FUND <strong>2010</strong>: INNOVATION AND IMPACT CONclusiONS
REFERENCES<br />
CHAPTER 1<br />
1 Millennium Development Goals [Internet]. Geneva: United Nations; <strong>2010</strong><br />
[cited <strong>2010</strong> Feb 23]. Available from: http://www.un.org/millenniumgoals/<br />
2 The framework document of the <strong>Global</strong> <strong>Fund</strong> to Fight AIDS, Tuberculosis<br />
and Malaria [Internet]. Geneva: <strong>Global</strong> <strong>Fund</strong> to Fight AIDS, Tuberculosis<br />
and Malaria; <strong>2010</strong> [cited <strong>2010</strong> Feb 23]. Available from: http://www.theglobalfund.org/documents/TGF_Framework.pdf<br />
CHAPTER 2<br />
1 WHO, UNAIDS, UNICEF. Towards universal access: scaling up priority HIV/<br />
AIDS interventions in the health sector: progress report 2009. Geneva:<br />
World Health Organization; 2009.<br />
2 World malaria report 2009. Geneva: World Health Organization; 2009.<br />
3 <strong>Global</strong> tuberculosis control: a short update to the 2009 report. Geneva:<br />
World Health Organization; 2009.<br />
4 New data show 1.4 billion live on less than US$1.25 a day, but progress<br />
against poverty remains strong [Internet]. Washington, DC: World Bank;<br />
2008 [cited <strong>2010</strong> Feb 23]. Available from: http://go.worldbank.org/<br />
MCYYF1MKN0<br />
5 Policy analysis brief: poverty in Latin America and the Caribbean<br />
[Internet]. Washington, DC: World Bank; 2007 [cited <strong>2010</strong> Feb 23].<br />
Available from: http://go.worldbank.org/8AIMC3BX50<br />
6 Poverty data: a supplement to World Development Indicators 2008.<br />
Washington, DC: World Bank; 2008.<br />
7 Human development report 2009: overcoming barriers: human mobility<br />
and development. New York: United Nations Development Programme;<br />
2009.<br />
8 Europe and Central Asia overview [Internet]. Washington, DC: World<br />
Bank; 2009 [cited <strong>2010</strong> Feb 23]. Available from: http://go.worldbank.org/<br />
YHJ7OKM8E0<br />
9 kates J, Lief E, Avila C. Financing the response to AIDS in low- and<br />
middle-income countries: international assistance from the G8, European<br />
Commission and other donor governments, 2008. Geneva: Kaiser Family<br />
Foundation, Joint United Nations Programme on HIV/AIDS; 2009.<br />
10 <strong>Global</strong> tuberculosis control: epidemiology, strategy, financing: WHO report<br />
2009. Geneva: World Health Organization; 2009.<br />
11 Malaria country funding and resource utilization – the first decade of Roll<br />
Back Malaria. Geneva: Roll Back Malaria Partnership; <strong>2010</strong>.<br />
12 Roll Back Malaria global strategic plan 2005–2015. Geneva: Roll Back<br />
Malaria Partnership; 2005.<br />
13 Financial resources required to achieve universal access to HIV prevention,<br />
treatment, care and support. Geneva: Joint United Nations Programme on<br />
HIV/AIDS; 2007.<br />
14 Stop TB Partnership, WHO. <strong>Global</strong> plan to stop TB 2006–2015. Geneva:<br />
World Health Organization; 2006.<br />
15 Hecht R, Alban A, Taylor K, et al. Putting it together: AIDS and the millennium<br />
development goals. PLoS Med. 2006;3(11):e455.<br />
16 Russell S. The economic burden of illness for households in developing<br />
countries: a review of studies focusing on malaria, tuberculosis, and<br />
human immunodeficiency virus/acquired immune deficiency syndrome.<br />
Am J Trop Med Hyg. 2004;71(2 Suppl):147–55.<br />
17 Women and health: today’s evidence tomorrow’s agenda. Geneva: World<br />
Health Organization; 2009.<br />
18 Bradshaw D, Chopra M, Kerber K, et al. Every death counts: use of mortality<br />
audit data for decision making to save the lives of mothers, babies,<br />
and children in South Africa. Lancet. 2008;371(9620):1294–304.<br />
19 WHO, UNICEF, UNFPA, World Bank. Maternal mortality in 2005: estimates<br />
developed by WHO, UNICEF, UNFPA, and the World Bank. Geneva: World<br />
Health Organization; 2007.<br />
20 Menendez C, Romagosa C, Ismail MR, et al. An autopsy study of maternal<br />
mortality in Mozambique: the contribution of infectious diseases. PLoS<br />
Med. 2008;5(2):e44.
21 Lusti-Narasimhan M, Collin C, Mbizvo M. Sexual and reproductive health<br />
in HIV-related proposals supported by the <strong>Global</strong> <strong>Fund</strong> to Fight AIDS,<br />
Tuberculosis and Malaria. Bull World Health Organ. 2009;87:816–23.<br />
22 Price JE, Leslie JA, Welsh M, et al. Integrating HIV clinical services into primary<br />
health care in Rwanda: a measure of quantitative effects. AIDS Care.<br />
2009;21(5):608–14.<br />
23 <strong>Report</strong> on the global AIDS epidemic 2008. Geneva: Joint United Nations<br />
Programme on HIV/AIDS; 2008.<br />
24 WHO report on the health of women: AIDS leading cause of death globally<br />
in women of reproductive age [Internet]. Geneva: Joint United Nations<br />
Programme on HIV/AIDS; 2009 [cited <strong>2010</strong> Feb 23]. Available from<br />
http://www.<strong>unaids</strong>.org/en/KnowledgeCentre/Resources/FeatureStories/<br />
archive/2009/20091109_Women.asp<br />
25 khan K, Wojdyla D, Say L, et al. WHO analysis of causes of maternal<br />
deaths: a systematic review. Lancet. 2006;367(9516):1066–74.<br />
26 UNAIDS, UNICEF. Framework for the protection, care and support of<br />
orphans and vulnerable children living in a world with HIV and AIDS.<br />
Geneva: Joint United Nations Programme on HIV/AIDS, United Nations<br />
Children’s <strong>Fund</strong>; 2004.<br />
27 Malaria fact sheet 2009. Geneva: World Health Organization; 2009.<br />
28 The world health report 2005: make every mother and child count.<br />
Geneva: World Health Organization; 2005.<br />
29 Ottmani SE, Uplekar MW. Gender and TB: pointers from routine records<br />
and reports. Int J Tuberc Lung Dis. 2008;12(7):827–8.<br />
30 WHO, UNAIDS. <strong>Progress</strong> on global access to HIV antiretroviral therapy:<br />
a report on “3 by 5” and beyond, March 2006. Geneva: World Health<br />
Organization, Joint United Nations Programme on HIV/AIDS; 2006.<br />
31 The global burden of disease: 2004 update. Geneva: World Health<br />
Organization; 2008.<br />
32 Child info: Under-five mortality rate [Internet]. New York: United Nations<br />
Children’s <strong>Fund</strong>; 2009 (cited <strong>2010</strong> Feb 23]. Available from: http://www.<br />
childinfo.org/mortality_underfive.php<br />
33 World health statistics 2009. Geneva: World Health Organization; 2009.<br />
34 The state of Africa’s children 2008: child survival. New York: United<br />
Nations Children’s <strong>Fund</strong>; 2008.<br />
35 UNICEF, Roll Back Malaria Partnership, <strong>Global</strong> <strong>Fund</strong> to Fight AIDS,<br />
Tuberculosis and Malaria. Malaria and children: progress in intervention<br />
coverage. New York: United Nations Children’s <strong>Fund</strong>; 2009.<br />
36 UNAIDS, WHO. AIDS epidemic update 2009. Geneva: Joint United Nations<br />
Programme on HIV/AIDS; 2009.<br />
37 WHO, UNAIDS, UNICEF. Towards universal access: scaling up priority HIV/<br />
AIDS interventions in the health sector: progress report 2008. Geneva:<br />
World Health Organization; 2008.<br />
38 Ifakara Health Institute. Highlights from the Tanzania HIV/AIDS and Malaria<br />
Indicator Survey. Spotlight. 2008;1:1–5.<br />
39 UNGASS country progress report: Tanzania mainland. Dar es Salaam:<br />
Tanzania Commission for AIDS; 2008.<br />
40 Tanzania HIV/AIDS and Malaria Indicator Survey. Dar es Salaam: Tanzania<br />
Commission for AIDS; 2008.<br />
41 Assefa Y, Jerene D, Lulseged S, et al. Rapid scale-up of antiretroviral<br />
treatment in Ethiopia: successes and system-wide effects. PLoS Med.<br />
2009;6(4):e1000056.<br />
42 Reniers G, Araya T, Davey G, et al. Steep declines in population-level AIDS<br />
mortality following the introduction of antiretroviral therapy in Addis<br />
Ababa, Ethiopia. AIDS. 2009;23(4):511–8.<br />
43 Seyoum E, Mekonnen Y, Kassa A, et al. ART scale-up in Ethiopia: success<br />
and challenges. Addis Ababa: Federal Ministry of Health HIV/AIDS<br />
Prevention and Control Office; 2009.<br />
44 Halperin D, de Moya E, Perez-Then E, et al. Understanding the HIV epidemic<br />
in the Dominican Republic: a prevention success story in the Caribbean<br />
J Acquir Immune Defic Syndr. 2009;51(Suppl 1):S52–9.<br />
45 Makombe SD, Jahn A, Tweya H, et al. A national survey of teachers on<br />
antiretroviral therapy in Malawi: access, retention in therapy and survival.<br />
PLoS One. 2007;2(7):e620.<br />
46 Makombe SD, Jahn A, Tweya H, et al. A national survey of the impact<br />
of rapid scale-up of antiretroviral therapy on health-care workers in<br />
Malawi: effects on human resources and survival. Bull World Health Organ.<br />
2007;85(11):851–7.<br />
47 Jahn A, Floyd S, Crampin AC, et al. Population-level effect of HIV on adult<br />
mortality and early evidence of reversal after introduction of antiretroviral<br />
therapy in Malawi. Lancet. 2008;371(9624):1603–11.<br />
48 <strong>Report</strong> on the 2008 national HIV sentinel survey. Windhoek: Namibian<br />
Ministry of Health and Social Services; 2008.<br />
49 National Center for TB Control and Prevention. <strong>Report</strong> on TB prevention<br />
and control in China (2001–2007). Beijing: Chinese Center for Disease<br />
Control and Prevention; 2008.<br />
50 <strong>Progress</strong> report of China <strong>Global</strong> <strong>Fund</strong> TB program round 4 (July 2005 to<br />
June 2008). Beijing: China <strong>Global</strong> <strong>Fund</strong> TB Program Office; 2008.<br />
51 National Center for TB Control and Prevention. Analysis of data on TB epidemic<br />
in China. Beijing: Chinese Center for Disease Control and Prevention; 2008.<br />
52 zambia national malaria indicator survey. Lusaka: Ministry of Health; 2008.<br />
53 Barnes KI, Chanda P, Ab Barnabas G. Impact of the large-scale deployment<br />
of artemether/lumefantrine on the malaria disease burden in Africa: case<br />
studies of South Africa, Zambia and Ethiopia. Malar J. 2009;8(Suppl 1):S8.<br />
54 Evaluation of the Sao Tome and Principe malaria control strategic plan<br />
(2001 & <strong>2010</strong>). Geneva: World Health Organization; 2008.<br />
55 Teklehaimanot HD, Teklehaimanot A, Kiszewski A, et al. Malaria in Sao<br />
Tome and Principe: on the brink of elimination after three years of effective<br />
antimalarial measures. Am J Trop Med Hyg. 2009;80(1):133–40.<br />
56 Malaria Namibia. Windhoek: World Health Organization Country Office<br />
in Namibia; 2008.<br />
57 SADC malaria report 2007. Gaborone (Botswana): Southern African<br />
Development Community; 2008.<br />
58 Otten M, Aregawi M, Were W, et al. Initial evidence of reduction of malaria<br />
cases and deaths in Rwanda and Ethiopia due to rapid scale-up of malaria<br />
prevention and treatment. Malar J. 2009;8:14.<br />
59 World malaria report 2008. Geneva: World Health Organization; 2008.<br />
60 Malaria control programme report. New Delhi: World Health Organization<br />
Regional Office for South-East Asia; 2009.<br />
61 Scaling up for impact: results report, March 2009. Geneva: <strong>Global</strong> <strong>Fund</strong><br />
to Fight AIDS, Tuberculosis and Malaria; 2009.<br />
62 Fragile states: list of fragile states. Washington, DC: World Bank; 2007.<br />
63 Why we need to work more effectively in fragile states. London: UK<br />
Department for International Development; 2005.<br />
64 The impact of HIV/AIDS on the health workforce in developing countries:<br />
background paper prepared for the world health report 2006 – working<br />
together for health. Geneva: World Health Organization; 2006.<br />
65 zanzibar malaria control programme: overview of malaria situation in<br />
Zanzibar. Zanzibar: Ministry of Health and Social Welfare; 2006.<br />
66 Connelly D, Veriava Y, Roberts S, et al. Prevalence of HIV infection and<br />
median CD4 counts among health care workers in South Africa. S Afr Med<br />
J. 2007;97(2):115–20.<br />
67 HIV/AIDS and work: global estimates, impact and response. Geneva:<br />
International Labour Organization; 2004.<br />
68 The world health report 2006: working together for health. Geneva: World<br />
Health Organization; 2006.<br />
95 THE GLOBAL FUND <strong>2010</strong>: INNOVATION AND IMPACT reFereNces
69 McCoy D, McPake B, Mwapasa V. The double burden of human resource and<br />
HIV crises: a case study of Malawi. Hum Resour Health. 2008;6(1):16.<br />
70 Susna D, Wang W, Wright J. What happens to HIV/AIDS funds at the<br />
country level: a comparative analysis of before and after the donor influx<br />
in Kenya, Malawi, Rwanda, Tanzania and Zambia. Bethesda, MD: Health<br />
Systems 20/20 Project, Abt Associates Inc; 2009.<br />
71 Noor AM, Amin AA, Akhwale WS, et al. Increasing coverage and decreasing<br />
inequity in insecticide-treated bed net use among rural Kenyan children.<br />
PLoS Med. 2007;4(8):e255.<br />
72 The <strong>Global</strong> <strong>Fund</strong>’s strategy for ensuring gender equality in the response to<br />
HIV/AIDS, TB and malaria. Geneva: <strong>Global</strong> <strong>Fund</strong> to Fight AIDS, Tuberculosis<br />
and Malaria; 2008.<br />
73 The <strong>Global</strong> <strong>Fund</strong> strategy in relation to sexual orientation and gender<br />
identities (SOGI). Geneva: <strong>Global</strong> <strong>Fund</strong> to Fight AIDS, Tuberculosis and<br />
Malaria; 2009.<br />
74 Do <strong>Global</strong> <strong>Fund</strong> grants work for women Nairobi: AIDSPAN; 2008.<br />
75 <strong>Global</strong> <strong>Fund</strong> Board decision point GF/B19/DP7 on the <strong>Global</strong> <strong>Fund</strong>’s strategy<br />
in relation to sexual orientation and gender identities. Geneva: <strong>Global</strong><br />
<strong>Fund</strong> to Fight AIDS, Tuberculosis and Malaria; 2009.<br />
76 <strong>Global</strong> <strong>Fund</strong> Board decision point GF/B18/DP18 on the <strong>Global</strong> <strong>Fund</strong>’s strategy<br />
for ensuring gender equality in the response to HIV/AIDS, TB and malaria.<br />
Geneva: <strong>Global</strong> <strong>Fund</strong> to Fight AIDS, Tuberculosis and Malaria; 2008.<br />
77 Malaria country profile for Djibouti [Internet]. Cairo: WHO Regional Office<br />
for the Eastern Mediterranean; 2009 [cited <strong>2010</strong> Feb 23]. Available from:<br />
http://www.emro.who.int/rbm/CountryProfiles-dji.htm<br />
78 Swaziland demographic and health survey 2006–07. Mbabane: Central<br />
Statistical Office, Macro International Inc; 2008.<br />
79 Li A, Varangrat A, Wimonsate W, et al. Sexual behavior and risk factors<br />
for HIV infection among homosexual and bisexual men in Thailand. AIDS<br />
Behav. 2009;13(2):318–27.<br />
80 Cook C, Kanaef N. <strong>Global</strong> state of harm reduction 2008: mapping the<br />
response to drug-related HIV and hepatitis C epidemics. London:<br />
International Harm Reduction Association; 2008.<br />
81 Abdool R, Sulliman FT, Dhannoo MI. The injecting drug use and HIV/AIDS<br />
nexus in the Republic of Mauritius. Afr J Drug Alcohol Stud. 2006;5(2):107–116.<br />
82 Ball AL, Rana S, Dehne KL. HIV prevention among injecting drug users:<br />
responses in developing and transitional countries. Public Health Rep.<br />
1998;113(Suppl 1):170–81.<br />
83 Atun RA, McKee M, Coker R, et al. Health systems’ responses to 25 years<br />
of HIV in Europe: inequities persist and challenges remain. Health Policy.<br />
2008;86(2–3):181–94.<br />
84 Sarang A, Stuikyte R, Bykov R. Implementation of harm reduction<br />
in Central and Eastern Europe and Central Asia. Int J Drug Policy.<br />
2007;18(2):129–35.<br />
85 Atun R, Kazatchkine M. The <strong>Global</strong> <strong>Fund</strong>’s leadership on harm reduction:<br />
2002–2009. Int J Drug Policy. <strong>2010</strong>;21(In Press).<br />
86 Commission on Social Determinants of Health. Closing the gap in a generation:<br />
health equity through action on the social determinants of health.<br />
Geneva: World Health Organization; 2008.<br />
87 WHO Maximizing Positive Synergies Collaborative Group. An assessment of<br />
interactions between global health initiatives and country health systems.<br />
Lancet. 2009;373:2137–69.<br />
88 Rwanda service provision assessment survey 2007. Calverton, Maryland:<br />
National Institute of Statistics, Ministry of Health, Macro International; 2008.<br />
89 Rwanda service provision assessment survey 2001. Calverton, Maryland:<br />
Ministry of Health, National Population Office, ORC Macro; 2003.<br />
90 Human resources and financing for the health sector in Malawi. Tunis-<br />
Belvedère (Tunisia): African Development Bank; 2004.<br />
91 Celletti F, Wright A, Palen J, et al. Can the deployment of community<br />
health workers for the delivery of HIV services represent an effective and<br />
sustainable response to health workforce shortages: results of a multicountry<br />
study. AIDS. <strong>2010</strong>;24(Suppl 1):S45–S57.<br />
92 Increasing access to antiretroviral care in rural Malawi: 2003–2009<br />
programme report. Limbe: Medecins Sans Frontieres; 2009.<br />
93 Xu K, Evans DB, Carrin G, et al. Protecting households from catastrophic<br />
health spending. Health Aff. 2007;26(4):972–83.<br />
94 Collin C. Health systems strengthening to fight AIDS, tuberculosis and<br />
malaria: a case study of Rwanda (draft). Geneva: <strong>Global</strong> <strong>Fund</strong> to Fight<br />
AIDS, Tuberculosis and Malaria; 2009.<br />
95 Cáceres CF, Girón M, Sandoval C, et al. Peru: effects of the implementation<br />
of <strong>Global</strong> <strong>Fund</strong>-supported HIV/AIDS projects on health systems, civil<br />
society and affected communities, 2004–2007 – Country case summary<br />
prepared as part of the academic consortium of the WHO Maximizing<br />
Positive Synergies between health systems and GHIs initiative. Geneva:<br />
World Health Organization; 2009.<br />
96 Cáceres CF, Mendoza W. The national response to the HIV/AIDS epidemic in<br />
Peru: accomplishments and gaps – a review. J Acquir Immune Defic Syndr.<br />
2009;51:S60–S66.<br />
97 Atun R, Kazatchkine M. Promoting country ownership and stewardship<br />
of health programs: the <strong>Global</strong> <strong>Fund</strong> experience. J Acquir Immune Defic<br />
Syndr. 2009;52(Suppl 1):S67–8.<br />
98 Assefa Y, Jerene D, Lulseged S, et al. Rapid scale-up of antiretroviral<br />
treatment in Ethiopia: successes and system-wide effects. PLoS Med.<br />
2009;6(4):e1000056.<br />
99 Abraha M, Nigatu T. Modeling trends of health and health related indicators<br />
in Ethiopia (1995–2008): a time-series study. Health Res Policy Syst.<br />
2009;7(1):29.<br />
100 Alebachew A, Huws D, Marie A. Interaction between GF supported<br />
programs and health systems: pathways and effects – the Ethiopian experience<br />
and country experiences (draft). Geneva: <strong>Global</strong> <strong>Fund</strong> to Fight AIDS,<br />
Tuberculosis and Malaria; 2009.<br />
101 <strong>Global</strong> <strong>Fund</strong> to Fight AIDS, Tuberculosis and Malaria, International HIV/<br />
AIDS Alliance. Civil society success on the ground: community systems<br />
strengthening and dual track financing – nine illustrative case studies.<br />
Geneva: <strong>Global</strong> <strong>Fund</strong> to Fight AIDS, Tuberculosis and Malaria; 2008.<br />
102 Bruni-Sarkozy C. A call to action: protecting mothers and children against<br />
AIDS [Internet]. Geneva: <strong>Global</strong> <strong>Fund</strong> to Fight AIDS, Tuberculosis and<br />
Malaria; 2009 [cited <strong>2010</strong> Feb 23]. Available from: http://www.theglobalfund.org/content/pressreleases/pr_090922_en.pdf<br />
103 McCoy D. The high level taskforce on innovative international financing for<br />
health systems. Health Policy Plan. 2009;24(5):321–3.
CHAPTER 3<br />
1 2009 key performance indicators [Internet]. Geneva: <strong>Global</strong> <strong>Fund</strong> to Fight<br />
AIDS, Tuberculosis and Malaria; 2009 [cited <strong>2010</strong> Feb 23]. Available from:<br />
http://theglobalfund.org/en/performance/kpi/<br />
2 2006 survey on monitoring the Paris Declaration: overview of the results.<br />
Paris: Organization for Economic Co-operation and Development; 2007.<br />
3 Scaling up for impact: results report, March 2009. Geneva: <strong>Global</strong> <strong>Fund</strong> to<br />
Fight AIDS, Tuberculosis and Malaria; 2009.<br />
4 Terms of reference of the Technical Review Panel [Internet]. Geneva:<br />
<strong>Global</strong> <strong>Fund</strong> to Fight AIDS, Tuberculosis and Malaria; 2009 [cited <strong>2010</strong><br />
Feb 23]. Available from: http://www.theglobalfund.org/documents/trp/<br />
TRP_TOR_en.pdf<br />
5 Guide to the <strong>Global</strong> <strong>Fund</strong>’s policies on procurement and supply management.<br />
Geneva: <strong>Global</strong> <strong>Fund</strong> to Fight AIDS, Tuberculosis and Malaria; 2006.<br />
6 WHO AIDS Medicines and Diagnostic Service. <strong>Global</strong> Price <strong>Report</strong>ing<br />
Mechanism [Internet]. Geneva: World Health Organization; 2009 [cited<br />
<strong>2010</strong> Feb 23]. Available from: http://www.who.int/hiv/amds/gprm/en/<br />
7 korenromp EL. Value for money in <strong>Global</strong> <strong>Fund</strong>-supported HIV, TB and<br />
malaria programmes: framework and proposed 2008–9 work plan.<br />
Geneva: <strong>Global</strong> <strong>Fund</strong> to Fight AIDS, Tuberculosis and Malaria; 2008.<br />
8 Floyd K, Pantoja A, Dye C. Financing tuberculosis control: the role<br />
of a global financial monitoring system. Bull World Health Organ.<br />
2007;85(5):334–40.<br />
9 History of World Bank’s analytical country income classifications<br />
[Internet]. Washington, DC: World Bank; 2009 [cited <strong>2010</strong> Feb 23].<br />
Available from: http://go.worldbank.org/U9BK7IA1J0<br />
10 Price and quality reporting system [Internet]. Geneva: <strong>Global</strong> <strong>Fund</strong> to<br />
Fight AIDS, Tuberculosis and Malaria; <strong>2010</strong> [cited <strong>2010</strong> Feb 23]. Available<br />
from: http://pqr.theglobalfund.org/PQRWeb/Screens/PQRLogin.<br />
aspxLang=en-GB<br />
11 Yukich J, Tediosi F, Lengeler C. Operations, costs and cost-effectiveness of<br />
five ITN programs (Eritrea, Malawi, Tanzania, Togo, Senegal) and two IRS<br />
programs (Kwa-Zulu Natal, Mozambique). Basel: Swiss Tropical Institute;<br />
2007.<br />
12 WHO <strong>Global</strong> Malaria Program. In-depth, bottom-up program-level ITN<br />
costing studies in Tanzania, Zanzibar and Uganda. Geneva: World Health<br />
Organization (Unpublished).<br />
13 Becker-Dreps SI, Biddle AK, Pettifor A, et al. Cost-effectiveness of<br />
adding bed net distribution for malaria prevention to antenatal services<br />
in Kinshasa, Democratic Republic of the Congo. Am J Trop Med Hyg.<br />
2009;81(3):496–502.<br />
14 De Allegri M, Marschall P, Flessa S, et al. Comparative cost analysis of<br />
insecticide-treated net delivery strategies: sales supported by social<br />
marketing and free distribution through antenatal care. Health Policy Plan.<br />
<strong>2010</strong>;25(1):28–38.<br />
15 <strong>Global</strong> tuberculosis control: epidemiology, strategy, financing: WHO report<br />
2009. Geneva: World Health Organization; 2009.<br />
16 <strong>Global</strong> tuberculosis control: a short update to the 2009 report. Geneva:<br />
World Health Organization; 2009.<br />
17 kombe G, Galaty D, Nwagbara C. Scaling-up antiretroviral treatment in the<br />
public sector in Nigeria: a comprehensive analysis of resource requirements:<br />
Maryland: Partners for Health Reform plus; 2004.<br />
18 koenig SP, Riviere C, Leger P, et al. The cost of antiretroviral therapy in<br />
Haiti. Cost Eff Resour Alloc. 2008;6:3.<br />
19 Financial resources required to achieve universal access to HIV prevention,<br />
treatment, care and support. Geneva: Joint United Nations Programme on<br />
HIV/AIDS; 2007.<br />
20 Jaffar S, Amuron B, Foster S, et al. Rates of virologic failure among<br />
patients treated in a home-based compared with a facility-based HIV<br />
case model in Jinja, SE Uganda: a cluster-randomized trial. Lancet.<br />
2009;374(9707):2080–9.<br />
21 Marseille E, Kahn J, Pitter C, et al. The cost-effectiveness of home-based<br />
provision of antiretroviral therapy in rural Uganda. Appl Econ Health<br />
Policy. 2009;7(4):229–43.<br />
22 Badri M, Maartens G, Mandalia S, et al. Cost-effectiveness of highly active<br />
antiretroviral therapy in South Africa. PLoS Med. 2006;3(1):e4.<br />
23 Cleary SM, McIntyre D, Boulle AM. The cost-effectiveness of antiretroviral<br />
treatment in Khayelitsha, South Africa: a primary data analysis. Cost Eff<br />
Resour Alloc. 2006;4:20.<br />
24 <strong>Report</strong> on the global AIDS epidemic 2008. Geneva: Joint United Nations<br />
Programme on HIV/AIDS; 2008.<br />
25 Izazola-Licea JA, Wiegelmann J, Aran C, et al. Financing the response to<br />
HIV in low-income and middle-income countries. J Acquir Immune Defic<br />
Syndr. 2009;52(Suppl.2):S119–S26.<br />
26 WHO Health Systems Financing Department. Choosing interventions<br />
that are cost effective (WHO-CHOICE) [Internet]. Geneva: World Health<br />
Organization; <strong>2010</strong> [cited <strong>2010</strong> Feb 23]. Available from: http://www.who.<br />
int/choice/en/index.html<br />
27 WHO, UNAIDS, UNICEF. Towards universal access: scaling up priority HIV/<br />
AIDS interventions in the health sector: progress report 2008. Geneva:<br />
World Health Organization; 2008.<br />
28 International drug price indicator guide. Massachussets: Management<br />
Sciences for Health; 2008.<br />
29 US Government Accountability Office. Selection of antiretroviral medications<br />
provided under US emergency plan is limited. Washington, DC: United<br />
States Government; 2005.<br />
30 Rapid advice: antiretroviral therapy for HIV infection in adults and adolescents.<br />
Geneva: World Health Organization; 2009.<br />
31 Renaud-Théry F, Nguimfack BD, Vitoria M, et al. Use of antiretroviral<br />
therapy in resource-limited countries in 2006: distribution and uptake of<br />
first- and second-line regimens. AIDS. 2007;21(Suppl 4):S89–95.<br />
32 WHO, UNAIDS, UNICEF. Towards universal access: scaling up priority HIV/<br />
AIDS interventions in the health sector: progress report 2009. Geneva:<br />
World Health Organization; 2009.<br />
33 Marseille E, Dandona L, Marshall N, et al. HIV prevention costs and program<br />
scale: data from the PANCEA project in five low- and middle-income countries.<br />
BMC Health Serv Res. 2007;7:108.<br />
34 Milliner J. Net mapping project. Washington, DC: Alliance for Malaria<br />
Prevention, President’s Malaria Initiative, United States Agency for<br />
International Development; 2009.<br />
35 Jamison DT, Breman JG, Measham AR, et al. Disease control priorities<br />
in developing countries. 2nd ed. New York: World Bank, World Health<br />
Organization, Fogarty International Center of the National Institutes of<br />
Health; 2006.<br />
36 Breman JG, Mills A, Snow RW, et al. Conquering malaria. In: Jamison DT,<br />
editor. Disease control priorities in developing countries. New York: World<br />
Bank, World Health Organization, Fogarty International Center of the<br />
National Institutes of Health; 2006.<br />
37 Baltussen R, Floyd K, Dye C. Cost effectiveness analysis of strategies for<br />
tuberculosis control in developing countries. BMJ. 2005;331(7529):1364.<br />
38 Dye C, Floyd K. Tuberculosis. In: Jamison DT, editor. Disease control<br />
priorities in developing countries. New York: World Bank, World Health<br />
Organization, Fogarty International Center of the National Institutes of<br />
Health; 2006.<br />
97 THE GLOBAL FUND <strong>2010</strong>: INNOVATION AND IMPACT reFereNces
39 Bertozzi S, Padian N, Wegbreit J, et al. HIV/AIDS prevention and treatment.<br />
In: Jamison DT, editor. Disease control priorities in developing countries.<br />
New York: World Bank, World Health Organization, Fogarty International<br />
Center of the National Institutes of Health; 2006.<br />
40 Goldie SJ, Yazdanpanah Y, Losina E, et al. Cost-effectiveness of HIV treatment<br />
in resource-poor settings: the case of Cote d’Ivoire. N Engl J Med.<br />
2006;355(11):1141–53.<br />
41 Freedberg KA, Kumarasamy N, Losina E, et al. Clinical impact and costeffectiveness<br />
of antiretroviral therapy in India: starting criteria and<br />
second-line therapy. AIDS. 2007;21(Suppl 4):S117–28.<br />
42 Galarraga O, Colchero MA, Wamai RG, et al. HIV prevention cost-effectiveness:<br />
a systematic review. BMC Public Health. 2009;9(Suppl.1):S5.<br />
43 Commission on Macroeconomics and Health. Macroeconomics and health:<br />
investing in health for economic development. Geneva: World Health<br />
Organization; 2001.<br />
44 Nachega JB, Leisegang R, Bishai D, et al. Association of antiretroviral therapy<br />
adherence and health care costs. Ann Intern Med. <strong>2010</strong>;152(1):18–25.<br />
45 Otten M, Aregawi M, Were W, et al. Initial evidence of reduction of malaria<br />
cases and deaths in Rwanda and Ethiopia due to rapid scale-up of malaria<br />
prevention and treatment. Malar J. 2009;8:14.<br />
46 Makombe SD, Jahn A, Tweya H, et al. A national survey of the impact<br />
of rapid scale-up of antiretroviral therapy on health-care workers in<br />
Malawi: effects on human resources and survival. Bull World Health Organ.<br />
2007;85(11):851–7.<br />
47 Hecht R, Alban A, Taylor K, et al. Putting it together: AIDS and the<br />
Millennium Development Goals. PLoS Med. 2006;3(11):e455.<br />
48 Beard J, Feeley F, Rosen S. Economic and quality of life outcomes of<br />
antiretroviral therapy for HIV/AIDS in developing countries: a systematic<br />
literature review. AIDS Care. 2009;21(11):1343–56.<br />
49 Morineau G, Vun MC, Barennes H, et al. Survival and quality of life among<br />
HIV-positive people on antiretroviral therapy in Cambodia. AIDS Patient<br />
Care STDS. 2009;23(8):669–77.<br />
50 <strong>Global</strong> <strong>Fund</strong>-supported Malawi HIV program: Unpublished data. Malawi:<br />
Electricity Supply Corporation of Malawi; 2007.<br />
51 Makombe SD, Jahn A, Tweya H, et al. A national survey of teachers on<br />
antiretroviral therapy in Malawi: access, retention in therapy and survival.<br />
PLoS One. 2007;2(7):e620.<br />
52 Mermin J, Were W, Ekwaru JP, et al. Mortality in HIV-infected Ugandan<br />
adults receiving antiretroviral therapy and survival of their HIV-uninfected<br />
children: a prospective cohort study. Lancet. 2008;371(9614):752–9.<br />
53 Maher D. Implications of the global financial crisis for the response to<br />
diseases of poverty within overall health sector development: the case of<br />
tuberculosis. Trop Med Int Health. <strong>2010</strong>;15(1):11–17.<br />
54 Laxminarayan R, Klein EY, Darley S, et al. <strong>Global</strong> investments in TB control:<br />
economic benefits. Health Aff. 2009;28(4):w730–42.<br />
55 Moatti JP, Marlink R, Luchini S, et al. Universal access to HIV treatment in<br />
developing countries: going beyond the misinterpretations of the ‘costeffectiveness’<br />
algorithm. AIDS. 2008;22(Suppl.1):S59–66.<br />
56 Atun RA, Samyshkin Y, Drobniewski F, et al. Costs and outcomes of tuberculosis<br />
control in the Russian Federation: retrospective cohort analysis.<br />
Health Policy Plan. 2006;21(5):353–64.<br />
57 Sinanovic E, Floyd K, Dudley L, et al. Cost and cost-effectiveness of<br />
community-based care for tuberculosis in Cape Town, South Africa. Int<br />
J Tuberc Lung Dis. 2003;7(9 Suppl 1):S56–62.<br />
58 Okello D, Floyd K, Adatu F, et al. Cost and cost-effectiveness of community-based<br />
care for tuberculosis patients in rural Uganda. Int J Tuberc Lung<br />
Dis. 2003;7(9 Suppl 1):S72–9.<br />
59 Nganda B, Wang’ombe J, Floyd K, et al. Cost and cost-effectiveness of<br />
increased community and primary care facility involvement in tuberculosis<br />
care in Machakos District, Kenya. Int J Tuberc Lung Dis. 2003;7(9 Suppl<br />
1):S14–20.<br />
CHAPTER 4<br />
1 2009 key performance indicators [Internet]. Geneva: <strong>Global</strong> <strong>Fund</strong> to Fight<br />
AIDS, Tuberculosis and Malaria; 2009 [cited <strong>2010</strong> Feb 23]. Available from:<br />
http://www.theglobalfund.org/en/performance/kpi<br />
2 The five year evaluation of the <strong>Global</strong> <strong>Fund</strong> [Internet]. Geneva: <strong>Global</strong><br />
<strong>Fund</strong> to Fight AIDS, Tuberculosis and Malaria; <strong>2010</strong> [cited <strong>2010</strong> Feb 23].<br />
Available from: http://www.theglobalfund.org/en/terg/evaluations/5year<br />
3 Partnership forum [Internet]. Geneva: <strong>Global</strong> <strong>Fund</strong> to Fight AIDS,<br />
Tuberculosis and Malaria; <strong>2010</strong> [cited <strong>2010</strong> Feb 23]. Available from:<br />
http://www.theglobalfund.org/en/partnershipforum<br />
4 2004 partnership forum [Internet]. Geneva: <strong>Global</strong> <strong>Fund</strong> to Fight AIDS,<br />
Tuberculosis and Malaria; 2004 [cited <strong>2010</strong> Feb 23]. Available from:<br />
http://www.theglobalfund.org/en/partnershipforum/2004<br />
5 2006 partnership forum [Internet]. Geneva: <strong>Global</strong> <strong>Fund</strong> to Fight AIDS,<br />
Tuberculosis and Malaria; 2006 [cited <strong>2010</strong> Feb 23]. Available from:<br />
http://www.theglobalfund.org/en/partnershipforum/2006<br />
6 2008 partnership forum [Internet]. Geneva: <strong>Global</strong> <strong>Fund</strong> to Fight AIDS,<br />
Tuberculosis and Malaria; 2008 [cited <strong>2010</strong> Feb 23]. Available from:<br />
http://www.theglobalfund.org/en/partnershipforum/2008<br />
7 Oomman N, Bernstein M, Rosenzweig S. Following the funding for HIV/<br />
AIDS: a comparative analysis of the funding practices of PEPFAR, the<br />
<strong>Global</strong> <strong>Fund</strong> and World Bank MAP in Mozambique, Uganda and Zambia.<br />
Washington, DC: HIV/AIDS Monitor & Center for <strong>Global</strong> Development; 2007.<br />
8 Committee on the Economics of Antimalarial Drugs. Saving lives, buying<br />
time: economics of malaria drugs in an age of drug resistance.<br />
Washington, DC: Institute of Medicine; 2004.
THE GLOBAL FUND SUPPORTS HEALTH AUTHORITIES IN VIET NAM TO STRENGTHEN<br />
AND IMPROVE THE MANAGEMENT OF MALARIA CONTROL AT ALL LEVELS, INCLUDING<br />
ENSURING ADEQUATE PROVISION OF DRUG SUPPLIES.<br />
99 THE GLOBAL FUND <strong>2010</strong>: INNOVATION AND IMPACT reFereNces
Annex 1<br />
LIST OF BOXES, FIGURES AND TABLES<br />
BOXES<br />
BOX 1.1<br />
The Millennium Development Goals<br />
Box 1.2<br />
The <strong>Global</strong> <strong>Fund</strong> Principles<br />
Box 2.1<br />
How credible is <strong>Global</strong> <strong>Fund</strong> Grant data<br />
Box 2.2<br />
Calculating <strong>Global</strong> <strong>Fund</strong> contributions to key international targets<br />
Box 2.3<br />
Grant performance rating and disbursement decision-making methodology<br />
Box 2.4<br />
Inequities in disease burdens<br />
Box 2.5<br />
Gender-responsive programming of <strong>Global</strong> <strong>Fund</strong> grants<br />
Box 3.1<br />
Contributing to global dialogue<br />
Box 3.2<br />
Collaboration with technical partners to support standardized service costings by national programs<br />
Box 4.1 The Third Partnership Forum, Dakar, December 2008<br />
FIGUrES<br />
FIGURE 2.1<br />
<strong>Global</strong> <strong>Fund</strong>-supported programs, 2004–2009: Cumulative year-end results for the top three indicators for HIV/TB and malaria<br />
(the number of people currently on ART, treatment under DOTS and number of ITNs distributed)<br />
FIGURE 2.2 Allocation of cumulative expenditure by service delivery area for three diseases<br />
FIGURE 2.3 Cumulative expenditure for the three diseases by cost category<br />
FIGURE 2.4 Cumulative expenditures by implementing entity<br />
FIGURE 2.5 Contributions of <strong>Global</strong> <strong>Fund</strong>-supported programs to international targets for HIV, TB and malaria<br />
FIGURE 2.6 Percentage of children under five sleeping under an ITN the night before the survey, sub-Saharan Africa<br />
FIGURE 2.7 HIV prevalence trends among men and women aged 15−24, Tanzania (2003−2008)<br />
FIGURE 2.8 Estimated number of AIDS deaths in Addis Ababa, Ethiopia (2004−2007)<br />
FIGURE 2.9 ART coverage and all-cause mortality in South Africa (2003−2006)<br />
FIGURE 2.10 Prevalence of HIV among young women attending antenatal clinics, Namibia (2002−2008)<br />
FIGURE 2.11 Trends in TB Prevalence and Mortality, China (2000–2008)<br />
FIGURE 2.12 Trends in TB Prevalence and Mortality, Cambodia (2000–2007)<br />
FIGURE 2.13 Trends in TB prevalence and mortality, Viet Nam (2000−2007)<br />
FIGURE 2.14 Annual trends in malaria infection prevalence, malaria-attributable deaths and anemia prevalence in Zambia (2001–2007)<br />
FIGURE 2.15 Annual trends of malaria incidence, Namibia (1996–2007)<br />
FIGURE 2.16 Malaria incidence in Bhutan (2005–2008)<br />
FIGURE 2.17 Cumulative distribution of program performance (2005–2009)<br />
FIGURE 2.18 Grant performance ratings at Phase 2 review, by year (2005–2009)<br />
FIGURE 2.19 Achievement against targets for key programmatic areas, cumulative, for all Phase 2 grant evaluations (2005–2009)<br />
FIGURE 2.20 Grant performance by disease, cumulative to the end of 2009<br />
FIGURE 2.21 Grant performance by type of Principal Recipient, cumulative to the end of 2009<br />
FIGURE 2.22 Grant performance by region, cumulative to the end of 2009<br />
FIGURE 2.23 Burden of disease due to HIV, TB and malaria, 2004, and total <strong>Global</strong> <strong>Fund</strong> approved investments in Rounds 1−9, by region<br />
FIGURE 2.24 Expansion of facilities providing basic health services in Rwanda (2001–2007)<br />
FIGURE 2.25 Utilization of curative health services in Rwanda (2001–2007)<br />
FIGURE 3.1<br />
National DOTS expenditures per patient treated<br />
FIGURE 3.2 Prices paid for first-line adult ARV, by country income level<br />
FIGURE 3.3 Prices paid for first-line adult ARV drugs decreasing over time<br />
FIGURE 3.4 Distribution costs for insecticide-treated nets (both conventional and long-lasting) by delivery channel<br />
FIGURE 4.1 The <strong>Global</strong> <strong>Fund</strong> grant process
TABLES<br />
TABLE 2.1 <strong>Global</strong> <strong>Fund</strong> program interventions for 2009 compared to world totals for 2008<br />
TABLE 2.2<br />
2009 Results attributable to programs supported by the <strong>Global</strong> <strong>Fund</strong>, by region<br />
TABLE 2.3 Cumulative results attributable to programs supported by the <strong>Global</strong> <strong>Fund</strong>, by region (2002–2009)<br />
TABLE 2.4<br />
2009 <strong>Global</strong> <strong>Fund</strong> disbursements by region and disease<br />
TABLE 2.5<br />
<strong>Global</strong> <strong>Fund</strong> cumulative disbursements by region and disease (2002−2009)<br />
TABLE 2.6 Approved funding and disbursement by round and disease (as of December 2009)<br />
TABLE 2.7 <strong>Global</strong> <strong>Fund</strong> contributions to achieving MDGs 4 and 5<br />
TABLE 2.8<br />
<strong>Global</strong> progress on selected international goals: an analysis of WHO, UNAIDS and UNICEF data<br />
TABLE 2.9<br />
ART access in the 25 countries with the greatest <strong>Global</strong> <strong>Fund</strong> investments in HIV efforts<br />
TABLE 2.10 TB prevalence in the 25 countries with the greatest cumulative <strong>Global</strong> <strong>Fund</strong> investments in TB efforts<br />
TABLE 2.11<br />
Child mortality in the 25 countries with the greatest <strong>Global</strong> <strong>Fund</strong> cumulative investments in malaria efforts<br />
TABLE 2.12 <strong>Fund</strong>ing reallocation at Phase 2 by grant performance rating (2005–2009)<br />
TABLE 2.13<br />
Equity analyses and proposed actions in selected Round 8 and 9 proposals<br />
TABLE 2.14 <strong>Global</strong> <strong>Fund</strong> support for increasing availability of human resources in government health services in Malawi<br />
TABLE 2.15 Improvements in health service delivery in Ethiopia (2005–2008)<br />
TABLE 2.16 <strong>Global</strong> <strong>Fund</strong> and world results for 2009, and 2012 estimates to meet international targets<br />
TABLE 3.1<br />
The <strong>Global</strong> <strong>Fund</strong> Aid Effectiveness Scorecard<br />
TABLE 3.2<br />
Examples of <strong>Global</strong> <strong>Fund</strong> measures to increase value for money<br />
TABLE 3.3 Initial estimates of unit costs for key interventions in <strong>Global</strong> <strong>Fund</strong> programs (2008)<br />
TABLE 4.1<br />
Examples of innovations and reforms being implemented in response to recommendations by the Technical Review Panel<br />
TABLE 4.2<br />
key recommendations from the Five-Year Evaluation and the response from the <strong>Global</strong> <strong>Fund</strong> Secretariat<br />
TABLE 4.3<br />
Innovation milestones at the <strong>Global</strong> <strong>Fund</strong> (2002−2008)<br />
TABLE 4.4 Innovation milestones at the <strong>Global</strong> <strong>Fund</strong> (2009)<br />
101 THE GLOBAL FUND <strong>2010</strong>: INNOVATION AND IMPACT ANNexes
Annex 2<br />
THE GLOBAL FUND STRUCTURE<br />
AND REGIONS<br />
COUNTRY COORDINATING MECHANISM<br />
The CCM is a central part of the <strong>Global</strong> <strong>Fund</strong> structure<br />
and key to the <strong>Global</strong> <strong>Fund</strong>’s commitment to local<br />
ownership and participatory decision-making. CCMs<br />
develop and submit proposals to the <strong>Global</strong> <strong>Fund</strong>,<br />
oversee implementation of funded programs, review<br />
reports of Principal Recipients and ensure cross-sector<br />
coordination. They include representatives from all<br />
sectors: governments, nongovernmental organizations,<br />
academic institutions, people living with the diseases<br />
and multilateral and bilateral development agencies.<br />
TECHNICAL REVIEW PANEL<br />
To support the <strong>Global</strong> <strong>Fund</strong> in financing effective<br />
programs, the <strong>Global</strong> <strong>Fund</strong> Board relies on an independent<br />
panel of health and development experts. The<br />
Technical Review Panel reviews eligible proposals for<br />
technical merit and makes funding recommendations<br />
to the Board.<br />
THE GLOBAL FUND BOARD<br />
The international Board is made up of 20 voting members,<br />
which include representatives of donor and<br />
recipient governments, nongovernmental organizations,<br />
the private sector (including business and foundations)<br />
and affected communities. In addition, there are five<br />
non-voting members, among whom are key international<br />
development partners such as the WHO, UNAIDS,<br />
the World Bank (which serves as the <strong>Global</strong> <strong>Fund</strong>’s<br />
trustee) public-private partnerships (including Roll<br />
Back Malaria, Stop TB and UNITAID) and the government<br />
of Switzerland, given the <strong>Global</strong> <strong>Fund</strong>’s status as<br />
a Swiss foundation. The Board is responsible for overall<br />
governance of the <strong>Global</strong> <strong>Fund</strong>, for developing new<br />
policies and for the approval of grants. The Chair and<br />
Vice-Chair of the Board each serve for a term of two<br />
years. Each position alternates between a donor constituency<br />
and a recipient delegation, so that both donors<br />
and recipients are equally represented in the Board<br />
leadership at all times.<br />
PRINCIPAL RECIPIENT<br />
For each grant, the CCM nominates one or more public<br />
or private organization to serve as Principal Recipient.<br />
The Principal Recipient is legally responsible for local<br />
implementation of the grant, including oversight of<br />
sub-recipients of grant funds and communications with<br />
the CCM on grant progress. The Principal Recipient<br />
also works with the <strong>Global</strong> <strong>Fund</strong> Secretariat to develop<br />
a two-year grant agreement that sets program targets<br />
to be achieved over time. Over the course of the grant<br />
agreement, the Principal Recipient requests additional<br />
disbursements based on demonstrated progress<br />
to wards these targets. This performance-based system<br />
of grant-making is key to the <strong>Global</strong> <strong>Fund</strong>’s commitment<br />
to results.<br />
THE GLOBAL FUND SECRETARIAT<br />
The <strong>Global</strong> <strong>Fund</strong>’s staff is responsible for day-to-day<br />
operations, including mobilizing resources from the<br />
public and private sectors, managing grants, providing<br />
financial, legal and administrative support and reporting<br />
information on the <strong>Global</strong> <strong>Fund</strong>’s activities to the<br />
Board and the public. The <strong>Global</strong> <strong>Fund</strong> aspires to be<br />
as lean as possible, with a staff of about 600 based in<br />
Geneva, Switzerland, and overhead costs consuming<br />
approximately five percent of income.<br />
LOCAL FUND AGENT<br />
The <strong>Global</strong> <strong>Fund</strong> does not have a country-level<br />
presence outside its offices in Geneva. Instead, it relies<br />
on independent advice from local auditors referred<br />
to as Local <strong>Fund</strong> Agents. In the initial stage, a Local<br />
<strong>Fund</strong> Agent assesses the capacity of a nominated<br />
Principal Recipient to administer grant funds and be<br />
responsible for implementation. During the life of a<br />
grant, the Local <strong>Fund</strong> Agent will also verify the Principal<br />
Recipient’s periodic disbursement requests and<br />
progress updates. In addition, Local <strong>Fund</strong> Agents are<br />
responsible for reviewing the Principal Recipient’s<br />
annual report and advising the <strong>Global</strong> <strong>Fund</strong> on matters<br />
involving disbursements and other actions.<br />
TECHNICAL PARTNERS<br />
As a financing mechanism, the <strong>Global</strong> <strong>Fund</strong> does<br />
not itself provide technical assistance and capacitybuilding<br />
support to current or potential grant<br />
recipients. Instead, the <strong>Global</strong> <strong>Fund</strong> relies on development<br />
partners to provide such support to grantees.<br />
These organizations – including UNAIDS, WHO, the<br />
World Bank and other UN and bilateral agencies as<br />
well as international and local nongovernmental organizations<br />
– work with CCMs to develop proposals,<br />
strengthen capacity and implement approved programs.<br />
The <strong>Global</strong> <strong>Fund</strong> recognizes that some countries may<br />
face difficulties in implementing grants and therefore<br />
encourages CCMs to include funds for technical assistance<br />
in their proposals.
THE GLOBAL FUND GRANT CYCLE<br />
Each country is responsible for deciding the strategies,<br />
priorities and programs it wishes to implement and<br />
determines the level of financing it needs from the<br />
<strong>Global</strong> <strong>Fund</strong> by submitting proposals in funding<br />
rounds. These proposals and strategies are developed<br />
as the result of a close partnership between governments,<br />
civil society, the private sector and affected<br />
communities.<br />
Step 1 <strong>Global</strong> <strong>Fund</strong> Secretariat announces a<br />
“Call for Proposals”.<br />
Step 2 Each country’s Country Coordinating<br />
Mechanism prepares a proposal based<br />
on local needs and financing gaps. As part<br />
of the proposal, the Country Coordinating<br />
Mechanism nominates one or more Principal<br />
Recipients. In many cases, development partners<br />
assist in the preparation of the proposal.<br />
Step 3 The Secretariat reviews proposals to ensure<br />
they meet eligibility criteria and forwards<br />
all eligible proposals to the Technical Review<br />
Panel for consideration.<br />
Step 4 The Technical Review Panel reviews all eligible<br />
proposals for technical merit and makes<br />
one of four recommendations to the <strong>Global</strong><br />
<strong>Fund</strong> Board: (1) fund; (2) fund if certain conditions<br />
are met; (3) encourage resubmission;<br />
and (4) do not fund.<br />
Step 5 The Board approves grants based on technical<br />
merit and availability of funds.<br />
Step 6 The Secretariat contracts with one Local <strong>Fund</strong><br />
Agent per country. The Local <strong>Fund</strong> Agent<br />
certifies the financial management and administrative<br />
capacity of the nominated Principal<br />
Recipients. Based on the Local <strong>Fund</strong> Agent<br />
assessment, the Principal Recipient may<br />
require technical assistance to strengthen<br />
capacities. Development partners may provide<br />
or participate in such capacity-building<br />
activities. The strengthening of identified<br />
capacity gaps may be included as conditions<br />
precedent to disbursement of funds in the<br />
grant agreement between the <strong>Global</strong> <strong>Fund</strong><br />
and the Principal Recipient.<br />
Step 7<br />
Step 8<br />
Step 9<br />
The Secretariat and the Principal Recipient<br />
negotiate a grant agreement, which identifies<br />
specific, measurable results to be tracked<br />
using a set of key indicators.<br />
The grant agreement is signed. Based on a<br />
request from the Secretariat, the World Bank<br />
makes initial disbursement to the Principal<br />
Recipient. The Principal Recipient makes disbursements<br />
to sub-recipients for<br />
implementation, as called for in the proposal.<br />
Program and services begin. As the coordinating<br />
body at the country level, the Country<br />
Coordinating Mechanism oversees and monitors<br />
progress during implementation.<br />
Step 10 The Principal Recipient submits periodic<br />
Step 11<br />
disbursement requests with updates on programmatic<br />
and financial progress. The Local<br />
<strong>Fund</strong> Agent verifies information submitted<br />
and recommends disbursements based on<br />
demonstrated progress. Lack of progress<br />
triggers a request by the Secretariat for<br />
corrective action.<br />
The Principal Recipient submits a fiscal-year<br />
progress report and an annual audit of program<br />
financial statements to the Secretariat<br />
through the Local <strong>Fund</strong> Agent.<br />
Step 12 Regular disbursement requests and program<br />
updates continue, with future disbursements<br />
tied to progress.<br />
Step 13 The Country Coordinating Mechanism requests<br />
funding beyond the initially-approved twoyear<br />
period. The <strong>Global</strong> <strong>Fund</strong> Board approves<br />
continued funding based on a detailed<br />
assessment of results against targets and the<br />
availability of funds.<br />
103 THE GLOBAL FUND <strong>2010</strong>: INNOVATION AND IMPACT ANNexes
Annex 2 (CONT.)<br />
THE GLOBAL FUND STRUCTURE<br />
AND REGIONS<br />
BLUE = MULTICOUNTRY GRANTS ONLY<br />
SUB-SAHARAN AFRICA<br />
(41 COUNTRIES AND TERRITORIES)<br />
EAST AFRICA AND INDIAN OCEAN<br />
SOUTHERN AFRICA<br />
WEST AND CENTRAL AFRICA<br />
BURUNDI<br />
COMOROS<br />
CONGO (DEMOCRATIC REPUBLIC)<br />
ERITREA<br />
ETHIOPIA<br />
KENYA<br />
MADAGASCAR<br />
MAURITIUS<br />
RWANDA<br />
UNITED REPUBLIC OF TANZANIA<br />
UGANDA<br />
ANGOLA<br />
BOTSWANA<br />
LESOTHO<br />
MALAWI<br />
MOZAMBIQUE<br />
NAMIBIA<br />
SEYCHELLES<br />
SOUTH AFRICA<br />
SWAZILAND<br />
ZAMBIA<br />
ZIMBABWE<br />
BENIN<br />
BURKINA FASO<br />
CAMEROON<br />
CAPE VERDE<br />
CENTRAL AFRICAN REPUBLIC<br />
CONGO<br />
CôTE D’IVOIRE<br />
EQUATORIAL GUINEA<br />
GABON<br />
GAMBIA<br />
GHANA<br />
GUINEA<br />
GUINEA-BISSAU<br />
LIBERIA<br />
NIGERIA<br />
SAO TOME AND PRINCIPE<br />
SENEGAL<br />
SIERRA LEONE<br />
TOGO<br />
ASIA<br />
(33 COUNTRIES AND TERRITORIES)<br />
EAST ASIA AND PACIFIC<br />
SOUTH AND WEST ASIA<br />
CAMBODIA<br />
CHINA<br />
COOK ISLANDS<br />
FIJI<br />
INDONESIA<br />
KIRIBATI<br />
Korea (Democratic<br />
People’s Republic)<br />
LAO PDR<br />
MARSHALL ISLANDS<br />
Micronesia<br />
(Federated States)<br />
MONGOLIA<br />
MYANMAR<br />
NIUE<br />
PALAU<br />
PAPUA NEW GUINEA<br />
PHILIPPINES<br />
SAMOA<br />
SOLOMON ISLANDS<br />
THAILAND<br />
TIMOR-LESTE<br />
TONGA<br />
TUVALU<br />
VANUATU<br />
VIET NAM<br />
AFGHANISTAN<br />
BANGLADESH<br />
BHUTAN<br />
INDIA<br />
IRAN (ISLAMIC REPUBLIC)<br />
MALDIVES<br />
NEPAL<br />
PAKISTAN<br />
SRI LANKA
LATIN AMERICA AND CARIBBEAN<br />
(33 COUNTRIES AND TERRITORIES)<br />
ANTIGUA AND BARBUDA<br />
ARGENTINA<br />
BAHAMAS<br />
BARBADOS<br />
BELIZE<br />
BOLIVIA<br />
BRAZIL<br />
CHILE<br />
COLOMBIA<br />
COSTA RICA<br />
CUBA<br />
DOMINICA<br />
DOMINICAN REPUBLIC<br />
ECUADOR<br />
EL SALVADOR<br />
GRENADA<br />
GUATEMALA<br />
GUYANA<br />
HAITI<br />
HONDURAS<br />
JAMAICA<br />
MEXICO<br />
NICARAGUA<br />
PANAMA<br />
PARAGUAY<br />
PERU<br />
SAINT KITTS AND NEVIS<br />
SAINT LUCIA<br />
SAINT VINCENT<br />
AND GRENADINES<br />
SURINAME<br />
TRINIDAD AND TOBAGO<br />
URUGUAY<br />
VENEZUELA<br />
105 THE GLOBAL FUND <strong>2010</strong>: INNOVATION AND IMPACT ANNexes<br />
MIddLE EAST AND NORTH AFRICA<br />
(16 COUNTRIES AND TERRITORIES)<br />
ALGERIA<br />
CHAD<br />
DJIBOUTI<br />
EGYPT<br />
IRAQ<br />
JORDAN<br />
MALI<br />
MAURITANIA<br />
MOROCCO<br />
NIGER<br />
SOMALIA<br />
SUDAN<br />
SYRIAN ARAB REPUBLIC<br />
TUNISIA<br />
WEST BANK AND GAZA STRIP<br />
YEMEN<br />
EASTERN EUROPE AND CENTRAL ASIA<br />
(23 COUNTRIES AND TERRITORIES)<br />
ALBANIA<br />
ARMENIA<br />
AZERBAIJAN<br />
BELARUS<br />
BOSNIA AND HERZEGOVINA<br />
BULGARIA<br />
CROATIA<br />
ESTONIA<br />
GEORGIA<br />
KAZAKHSTAN<br />
KOSOVO<br />
Kyrgyzstan<br />
MACEDONIA,<br />
Former Yugoslav Republic<br />
MOLDOVA<br />
MONTENEGRO<br />
ROMANIA<br />
RUSSIAN FEDERATION<br />
SERBIA<br />
TAJIKISTAN<br />
TURKEY<br />
TURKMENISTAN<br />
UKRAINE<br />
UZBEKISTAN
ANNEX 3<br />
SUMMARY OF GLOBAL FUND-SUPPORTED<br />
PROGRAMS at 31 December 2009<br />
(IN US$ EQUIVALENTS) 1<br />
APPROVED PROPOSALS GRANT AGREEMENTS DISBURSEMENTS<br />
COUNTRY OR TERRITORY 2<br />
ROUND<br />
DISEASE<br />
COMPONENT<br />
APPROVED<br />
GRANT AMOUNT<br />
PRINCIPAL<br />
(US$) 3 STATUS 3 RECIPIENT TYPE 4<br />
GRANT NUMBER<br />
PROGRAM START<br />
DATE<br />
TOTAL AMOUNT<br />
DISBURSED (US$)<br />
REGION: EAST ASIA AND PACIFIC<br />
CAMBODIA 1 HIV/AIDS 14,701,498 (G2) Gov: MOH CAM-102-G01-H-00 (Closed) 01-Sep-03 14,701,498<br />
2 HIV/AIDS 14,765,625 (G2) Gov: MOH CAM-202-G02-H-00 01-Jan-04 14,583,357<br />
2 Malaria 27,269,519 (M) Gov: MOH CAM-202-G03-M-00, (G2) 01-Jan-04 9,683,872<br />
Gov: MOH CAM-202-G13-M, (G3) 01-May-09 5,525,141<br />
2 TB 6,169,733 (G2) Gov: MOH CAM-202-G04-T-00 01-Jan-04 6,169,733<br />
4 HIV/AIDS 36,546,134 (G2) Gov: MOH CAM-405-G05-H 01-Sep-05 33,045,356<br />
4 Malaria 9,857,891 (G2) Gov: MOH CAM-405-G06-M 01-Sep-05 9,072,273<br />
5 HIV/AIDS 34,963,654 (G2) Gov: MOH CAM-506-G07-H 01-Oct-06 25,063,560<br />
5 HSS 4,698,327 (G2) Gov: MOH CAM-506-G08-S 01-Nov-06 2,872,690<br />
5 TB 9,022,696 (G2) Gov: MOH CAM-506-G09-T 01-Nov-06 6,194,850<br />
6 Malaria 14,013,830 (G1) Gov: MOH CAM-607-G10-M 01-Jan-08 12,882,779<br />
7 HIV/AIDS 23,857,767 (G1) Gov: Oth CAM-708-G11-H 01-Dec-08 14,783,462<br />
7 TB 7,597,209 (G1) Gov: Oth CAM-708-G12-T 01-Apr-09 3,798,118<br />
9 HIV/AIDS 63,502,281 (B1)<br />
9 Malaria 43,717,857 (B1)<br />
CHINA 1 Malaria 6,406,659 (G2) Gov: Oth CHN-102-G02-M-00 01-Apr-03 6,242,698<br />
1 TB 91,118,721 (G3) Gov: Oth CHN-102-G01-T-00 01-Apr-03 69,027,537<br />
3 HIV/AIDS 270,566,000 (G3) Gov: Oth CHN-304-G03-H 01-Sep-04 140,177,360<br />
4 HIV/AIDS 63,742,277 (G2) Gov: Oth CHN-405-G05-H 01-Jul-05 57,853,608<br />
4 TB 199,772,040 (T3) Gov: Oth CHN-405-G04-T 01-Jul-05 55,234,457<br />
5 HIV/AIDS 28,902,073 (G2) Gov: Oth CHN-506-G06-H 01-Jul-06 21,451,990<br />
5 Malaria 38,522,396 (G2) Gov: Oth CHN-506-G07-M 01-Oct-06 29,676,277<br />
5 TB 51,275,836 (M) Gov: Oth CHN-506-G08-T, (G1) 01-Nov-06 19,100,894<br />
Gov: Oth CHN-506-G08-T-e, (G2) 01-Oct-08 13,323,210<br />
6 HIV/AIDS 5,812,876 (G1) Gov: Oth CHN-607-G10-H 01-Jan-08 5,806,623<br />
6 Malaria 15,465,315 (G2) Gov: Oth CHN-607-G09-M 01-Jul-07 9,010,188<br />
7 TB 5,313,263 (G1) Gov: Oth CHN-708-G11-T 01-Oct-08 2,163,165<br />
8 TB 28,702,917 (G1) Gov: Oth CHN-809-G12-T 01-Oct-09 6,723,376<br />
N1 5 Malaria 88,719,854 (B1)<br />
9 TB* 76,075,195 (B1)<br />
FIJI 8 TB 4,183,944 (T1)<br />
9 HIV/AIDS 1,242,510 (B1)<br />
INDONESIA 1 HIV/AIDS 5,400,174 (G2) Gov: MOH IND-102-G03-H-00 01-Jul-03 5,400,174<br />
1 Malaria 19,723,871 (G2) Gov: MOH IND-102-G02-M-00 01-Jul-03 19,723,871<br />
1 TB 51,766,003 (G2) Gov: MOH IND-102-G01-T-00 01-Aug-03 51,766,003<br />
4 HIV/AIDS 49,770,446 (G2) Gov: MOH IND-405-G04-H 01-Apr-05 43,446,781<br />
5 TB 49,978,433 (G2) Gov: MOH IND-506-G05-T 01-Jan-07 25,522,019<br />
6 Malaria 27,683,015 (G1) Gov: MOH IND-607-G06-M 01-Mar-08 24,599,911<br />
8 HIV/AIDS 39,821,706 (G1) Gov: Oth IND-809-G07-H 01-Jul-09 2,623,610<br />
Gov: MOH IND-809-G08-H 01-Jul-09 7,313,110<br />
CS/PS: NGO IND-809-G09-H 01-Jul-09 1,568,083<br />
8 Malaria 63,486,150 (G1) CS/PS: NGO IND-809-G13-M 01-Dec-09 4,144,869<br />
Gov: MOH IND-809-G14-M 01-Jan-10 24,194,009<br />
8 TB 24,131,410 (G1) CS/PS: NGO IND-809-G10-T 01-Jul-09 2,386,743
APPROVED PROPOSALS GRANT AGREEMENTS DISBURSEMENTS<br />
COUNTRY OR TERRITORY 2<br />
INDONESIA (CONT.) Gov: MOH IND-809-G11-T 01-Sep-09 7,414,380<br />
KOREA (DEMOCRATIC<br />
PEOPLES REPUBLIC)<br />
LAO (PEOPLE’s<br />
DEMOCRATIC REPUBLIC)<br />
ROUND<br />
DISEASE<br />
COMPONENT<br />
APPROVED<br />
GRANT AMOUNT<br />
PRINCIPAL<br />
(US$) 3 STATUS 3 RECIPIENT TYPE 4<br />
9 HIV/AIDS 27,723,275 (B1)<br />
8 Malaria 12,309,467 (T1)<br />
8 TB 24,545,710 (T1)<br />
GRANT NUMBER<br />
PROGRAM START<br />
DATE<br />
TOTAL AMOUNT<br />
DISBURSED (US$)<br />
CS/PS: NGO IND-809-G12-T 01-Sep-09 1,980,823<br />
1 HIV/AIDS 3,375,607 (G2) Gov: MOH LAO-102-G01-H-00 01-May-03 3,375,607<br />
1 Malaria 12,709,087 (G2) Gov: MOH LAO-102-G02-M-00 01-May-03 12,709,087<br />
2 TB 3,530,391 (G2) Gov: MOH LAO-202-G03-T-00 01-Oct-03 3,439,395<br />
4 HIV/AIDS 7,747,873 (G2) Gov: MOH LAO-405-G04-H 01-Jul-05 6,747,759<br />
4 Malaria 14,502,222 (G2) Gov: MOH LAO-405-G05-M 01-Jul-05 12,835,438<br />
4 TB 3,617,781 (G2) Gov: MOH LAO-405-G06-T 01-Sep-05 3,285,244<br />
6 HIV/AIDS 7,751,527 (B2) Gov: MOH LAO-607-G08-H 01-Nov-07 3,243,046<br />
6 Malaria 3,633,039 (G2) Gov: MOH LAO-607-G07-M 01-Sep-07 2,036,086<br />
7 Malaria 6,740,783 (G1) Gov: MOH LAO-708-G09-M 01-Jul-08 5,547,812<br />
7 TB 4,368,246 (G1) Gov: MOH LAO-708-G10-T 01-Oct-08 2,771,516<br />
8 HIV/AIDS 8,207,778 (G1) Gov: MOH LAO-809-G11-H 01-Nov-09 4,558,861<br />
107 THE GLOBAL FUND <strong>2010</strong>: INNOVATION AND IMPACT ANNexes INtrODuctiON<br />
MONGOLIA 1 TB 5,233,730 (G3) Gov: MOH MON-102-G01-T-00 01-May-03 4,635,353<br />
2 HIV/AIDS 8,810,349 (G3) Gov: MOH MON-202-G02-H-00 01-Aug-03 7,528,224<br />
4 TB 7,051,881 (T3) Gov: MOH MON-405-G03-T 01-Apr-05 4,083,764<br />
5 HIV/AIDS 1,898,775 (G1) Gov: MOH MON-506-G04-H (Closed: consolidated<br />
with MON-202-G02-H-00)<br />
01-Jul-06 1,898,775<br />
7 HIV/AIDS 1,440,102 (G1) Gov: MOH MON-708-G05-H 01-Jul-08 1,437,217<br />
9 HIV/AIDS 2,780,049 (B1)<br />
MULTICOUNTRY<br />
WESTERN PACIFIC<br />
2 HIV/AIDS 5,121,886 (G2) Gov: Oth MWP-202-G01-H-00 01-Jul-03 5,121,886<br />
2 Malaria 4,175,008 (G2) Gov: Oth MWP-202-G02-M-00 (Closed) 01-Jul-03 4,175,008<br />
2 TB 2,738,806 (G2) Gov: Oth MWP-202-G03-T-00 01-Jul-03 2,738,806<br />
5 Malaria 2,361,908 (G1) Gov: Oth MWP-506-G04-M (Inactive) 01-Jul-06 2,361,908<br />
5 Malaria 21,371,554 (G3) Gov: Oth MWP-507-G05-M 01-Jul-07 11,767,610<br />
7 HIV/AIDS 10,710,982 (G1) Gov: Oth MWP-708-G06-H 01-Jul-08 8,550,256<br />
7 TB 5,643,975 (G1) Gov: Oth MWP-708-G07-T 01-Jul-08 4,057,720<br />
MYANMAR 2 TB 2,659,494 (B2) MO: UNDP MYN-202-G01-T-00 (Terminated) 01-Jan-05 2,659,494<br />
3 HIV/AIDS 5,837,009 (B2) MO: UNDP MYN-305-G02-H (Terminated) 01-Apr-05 5,837,009<br />
3 Malaria 2,169,079 (B2) MO: UNDP MYN-305-G03-M (Terminated) 2,169,079<br />
9 HIV/AIDS 51,716,207 (B1)<br />
9 Malaria 37,578,282 (B1)<br />
9 TB 34,024,424 (B1)<br />
PAPUA NEW GUINEA 3 Malaria 20,105,690 (G2) Gov: MOH PNG-304-G01-M 01-Aug-04 17,051,813<br />
4 HIV/AIDS 17,552,150 (G2) Gov: MOH PNG-405-G02-H 01-Sep-05 14,157,579<br />
6 TB 19,193,202 (B2) Gov: MOH PNG-607-G03-T 01-Oct-07 5,007,911<br />
8 Malaria 50,435,031 (G1) Gov: MOH PNG-809-G04-M 01-Nov-09 7,936,481<br />
CS/PS: NGO PNG-809-G05-M 01-Nov-09 2,584,059<br />
PNG-809-G06-M 01-Nov-09 13,967,238<br />
PHILIPPINES 2 Malaria 47,060,206 (M) CS/PS: PS PHL-202-G01-M-00 (Suspended), 01-Aug-03 11,828,157<br />
(G2)<br />
CS/PS: PS<br />
PHL-202-G01-M-e (Suspended), 01-Aug-03 4,563,148<br />
(G3)<br />
2 TB 106,730,741 (M) CS/PS: PS PHL-202-G02-T-00 01-Aug-03 11,438,064<br />
CS/PS: PS PHL-202-G02-T-e 01-Aug-03 16,186,998<br />
3 HIV/AIDS 5,274,139 (G2) CS/PS: PS PHL-304-G03-H (Suspended) 01-Aug-04 5,274,139<br />
5 HIV/AIDS 6,474,660 (G2) CS/PS: PS PHL-506-G04-H (Suspended) 01-Oct-06 4,569,400<br />
Gov: MOH PHL-509-G10-H 01-Jan-10
APPROVED PROPOSALS GRANT AGREEMENTS DISBURSEMENTS<br />
COUNTRY OR TERRITORY 2<br />
ROUND<br />
DISEASE<br />
COMPONENT<br />
APPROVED<br />
GRANT AMOUNT<br />
PRINCIPAL<br />
(US$) 3 STATUS 3 RECIPIENT TYPE 4<br />
GRANT NUMBER<br />
PROGRAM START<br />
DATE<br />
TOTAL AMOUNT<br />
DISBURSED (US$)<br />
PHILIPPINES (CONT.) 5 Malaria 12,968,047 (G2) CS/PS: PS PHL-506-G05-M 01-Jun-06 12,968,047<br />
5 TB 16,687,774 (G1) CS/PS: PS PHL-506-G06-T (Closed) (Closed: 01-Oct-06 16,687,774<br />
consolidated with PHL-202-<br />
G02-T-e)<br />
6 HIV/AIDS 7,294,891 (G1) Gov: MOH PHL-607-G08-H 01-Dec-07 6,552,575<br />
6 Malaria 17,838,584 (B2) CS/PS: PS PHL-607-G07-M (Suspended) 01-Oct-07 14,340,684<br />
SOLOMON ISLANDS 8 HIV/AIDS 785,725 (T1)<br />
8 TB 3,283,614 (T1)<br />
THAILAND 1 HIV/AIDS 146,766,828 (G3) Gov: MOH THA-102-G01-H-00 01-Oct-03 109,944,308<br />
1 TB 12,058,359 (G2) Gov: MOH THA-102-G02-T-00 01-Oct-03 10,834,003<br />
2 HIV/AIDS 30,156,771 (G2) CS/PS: NGO THA-202-G03-H-00 01-Oct-03 15,295,580<br />
Gov: MOH THA-202-G04-H-00 01-Nov-03 12,783,633<br />
2 Malaria 5,282,000 (G2) Gov: MOH THA-202-G05-M-00 01-Mar-04 5,282,000<br />
3 HIV/AIDS 1,236,108 (G2) CS/PS: NGO THA-304-G06-H 01-Oct-04 1,236,108<br />
6 TB 16,968,831 (M) Gov: MOH THA-607-G07-T 01-Oct-07 4,440,354<br />
CS/PS: NGO THA-607-G08-T 01-Oct-07 5,137,640<br />
7 Malaria 11,939,346 (G1) Gov: MOH THA-708-G09-M 01-Jul-08 10,889,633<br />
8 HIV/AIDS 32,258,521 (G1) Gov: MOH THA-809-G10-H 01-Oct-09 6,567,838<br />
CS/PS: NGO THA-809-G11-H 01-Jul-09 2,254,750<br />
CS/PS: NGO THA-809-G12-H 01-Aug-09 2,634,878<br />
8 TB 10,240,102 (G1) Gov: MOH THA-809-G13-T 01-Aug-09 3,655,220<br />
TIMOR-LESTE 2 Malaria 2,736,768 (G2) Gov: MOH TMP-202-G01-M-00 01-Sep-03 2,736,768<br />
3 TB 657,853 (B2) Gov: MOH TMP-304-G02-T 01-Mar-05 657,853<br />
5 HIV/AIDS 8,361,394 (G2) Gov: MOH TMP-506-G03-H 01-Jun-07 5,146,750<br />
7 Malaria 6,168,687 (G1) Gov: MOH TMP-709-G05-M 01-Apr-09 3,006,875<br />
7 TB 2,894,205 (G1) Gov: MOH TMP-708-G04-T 01-Jan-09 1,952,238<br />
VIET NAM 1 HIV/AIDS 12,000,000 (G2) Gov: MOH VTN-102-G01-H-00 01-Feb-04 12,000,000<br />
1 TB 5,404,713 (G2) Gov: MOH VTN-102-G02-T-00 01-Jun-04 5,404,713<br />
3 Malaria 21,177,956 (G2) Gov: MOH VTN-304-G03-M 01-Jan-05 21,177,956<br />
6 HIV/AIDS 26,732,266 (B2) Gov: MOH VTN-607-G04-H 01-Jan-08 10,219,180<br />
6 TB 13,654,280 (B2) Gov: MOH VTN-607-G05-T 01-Jan-08 5,161,476<br />
7 Malaria 13,536,282 (G1) Gov: MOH VTN-708-G06-M 01-Jan-09 5,186,568<br />
8 HIV/AIDS 12,717,957 (G1) Gov: MOH VTN-809-G07-H 01-Dec-09 4,790,889<br />
9 HIV/AIDS 27,363,443 (B1)<br />
9 TB* 19,124,977 (B1)<br />
REGION TOTALS: 2,743,475,492 1,379,335,690<br />
REGION: EASTERN EUROPE AND CENTRAL ASIA<br />
ALBANIA 5 HIV/AIDS 4,936,229 (G2) Gov: MOH ALB-506-G01-H 01-Apr-07 3,699,052<br />
5 TB 1,263,490 (G2) Gov: MOH ALB-506-G02-T 01-Apr-07 1,116,289<br />
ARMENIA 2 HIV/AIDS 20,436,461 (M) CS/PS: NGO ARM-202-G01-H-00, (G2) (Closed: 01-Nov-03 9,105,913<br />
consolidated with ARM-202-G05-<br />
H-00, (G3))<br />
Gov: MOH ARM-202-G05-H-00, (G3) 01-Oct-09 1,876,273<br />
CS/PS: NGO ARM-202-G06-H-00, (G3) 01-Oct-09 1,772,608<br />
5 TB 7,218,635 (G2) Gov: MOH ARM-506-G02-T 01-Jan-07<br />
Gov: MOH ARM-506-G02-T-e as above 4,466,423<br />
8 HIV/AIDS 1,682,813 (G1) Gov: MOH ARM-809-G04-S<br />
8 TB 2,500,180 (G1) Gov: MOH ARM-809-G03-T 01-Sep-09 531,034
APPROVED PROPOSALS GRANT AGREEMENTS DISBURSEMENTS<br />
COUNTRY OR TERRITORY 2<br />
AzERBAIJAN 4 HIV/AIDS 10,341,550 (G2) Gov: MOH AZE-405-G01-H 01-Jun-05 10,341,550<br />
5 TB 4,345,006 (B2) Gov: MOH AZE-506-G02-T (Closed: consolidated<br />
with AZE-708-G03-T)<br />
01-Oct-06 4,345,006<br />
7 Malaria 3,422,700 (G1) Gov: MOH AZE-708-G04-M 01-Oct-08 3,084,293<br />
7 TB 9,339,320 (G1) Gov: MOH AZE-708-G03-T 01-Oct-08 5,566,014<br />
9 HIV/AIDS 16,958,384 (B1)<br />
9 TB 2,842,294 (B1)<br />
BELARUS 3 HIV/AIDS 25,155,645 (T3) MO: UNDP BLR-304-G01-H 01-Dec-04 16,761,658<br />
6 TB 13,333,654 (G2) MO: UNDP BLR-607-G02-T 01-Oct-07 6,829,557<br />
8 HIV/AIDS 13,698,146 (G1) MO: UNDP BLR-809-G03-H 01-Jan-10 5,549,950<br />
9 TB 10,127,774 (B1)<br />
BOSNIA AND<br />
HERzEGOVINA<br />
ROUND<br />
DISEASE<br />
COMPONENT<br />
APPROVED<br />
GRANT AMOUNT<br />
PRINCIPAL<br />
(US$) 3 STATUS 3 RECIPIENT TYPE 4<br />
GRANT NUMBER<br />
PROGRAM START<br />
DATE<br />
TOTAL AMOUNT<br />
DISBURSED (US$)<br />
5 HIV/AIDS 11,042,257 (G2) MO: UNDP BIH-506-G01-H 01-Nov-06 8,867,887<br />
6 TB 5,804,158 (G2) MO: UNDP BIH-607-G02-T 01-Oct-07 3,739,223<br />
9 HIV/AIDS 20,680,597 (B1)<br />
9 TB* 10,444,850 (B1)<br />
109 THE GLOBAL FUND <strong>2010</strong>: INNOVATION AND IMPACT ANNexes INtrODuctiON<br />
BULGARIA 2 HIV/AIDS 40,866,430 (M) Gov: MOH BUL-202-G01-H-00, (G2) 01-Jan-04 15,711,882<br />
Gov: MOH BUL-202-G01-H-e, (G3) 01-Mar-09 6,447,148<br />
6 TB 19,996,904 (B2) Gov: MOH BUL-607-G02-T 01-Nov-07 9,712,075<br />
8 TB 4,705,087 (G1) Gov: MOH BUL-809-G03-T 01-Jan-10<br />
CROATIA 2 HIV/AIDS 4,944,324 (G2) Gov: MOH HRV-202-G01-H-00 (Closed) 01-Dec-03 4,944,324<br />
ESTONIA 2 HIV/AIDS 10,483,275 (G2) Gov: MOH EST-202-G01-H-00 (Closed) 01-Oct-03<br />
Gov: MOH EST-202-G01-H-e (Closed) as above 10,483,275<br />
GEORGIA 2 HIV/AIDS 34,430,816 (T3) Gov: Oth GEO-202-G01-H-00 01-Mar-04 14,363,254<br />
3 Malaria 806,300 (G2) Gov: Oth GEO-304-G02-M 01-Jul-04 806,300<br />
4 TB 10,825,845 (T3) Gov: Oth GEO-405-G03-T 01-Apr-05 5,536,965<br />
6 HIV/AIDS 10,857,395 (B2) Gov: Oth GEO-607-G06-H 01-Jan-08 6,130,724<br />
6 Malaria 2,958,186 (G2) Gov: Oth GEO-607-G04-M 01-Jul-07 1,587,960<br />
6 TB 10,373,950 (G2) Gov: Oth GEO-607-G05-T 01-Jul-07 9,314,136<br />
9 HIV/AIDS 10,333,527 (B1)<br />
GLOBAL(LWF) 1 HIV/AIDS 700,000 (G2) CS/PS: FBO WRL-102-G01-H-00 (Closed) 01-Feb-03 700,000<br />
KazAKHSTAN 2 HIV/AIDS 22,085,999 (G2) Gov: Oth KAZ-202-G01-H-00 01-Dec-03 20,297,372<br />
6 TB 9,114,981 (G2) Gov: MOH KAZ-607-G02-T 01-Sep-07 6,753,014<br />
7 HIV/AIDS 12,485,792 (G1) Gov: Oth KAZ-708-G03-H 01-Jan-09 9,021,947<br />
8 TB 30,329,313 (G1) Gov: MOH KAZ-809-G04-T 7,574,536<br />
KOSOVO 4 TB 3,840,804 (G2) Gov: MOH KOS-405-G01-T 01-Apr-06<br />
Gov: MOH KOS-405-G01-T-e as above 3,212,637<br />
7 HIV/AIDS 2,372,498 (G1) Gov: MOH KOS-708-G02-H 01-Oct-08 1,537,388<br />
9 TB* 3,991,607 (B1)<br />
KYRGYzSTAN 2 HIV/AIDS 17,073,306 (G2) Gov: Oth KGZ-202-G01-H-00 01-Mar-04 17,073,306<br />
2 TB 2,771,070 (G2) Gov: MOH KGZ-202-G02-T-00 01-Mar-04 2,771,070<br />
5 Malaria 3,426,125 (G2) Gov: Oth KGZ-506-G03-M 01-Apr-06 2,877,880<br />
6 TB 8,287,814 (G2) Gov: MOH KGZ-607-G04-T 01-Jul-07 4,330,108<br />
7 HIV/AIDS 11,845,090 (G1) Gov: MOH KGZ-708-G05-H 01-Jan-09 4,997,122<br />
8 Malaria 2,663,886 (G1) Gov: Oth KGZ-809-G06-M 01-Jan-10<br />
9 TB* 7,811,886 (B1)
APPROVED PROPOSALS GRANT AGREEMENTS DISBURSEMENTS<br />
COUNTRY OR TERRITORY 2<br />
ROUND<br />
DISEASE<br />
COMPONENT<br />
APPROVED<br />
GRANT AMOUNT<br />
PRINCIPAL<br />
(US$) 3 STATUS 3 RECIPIENT TYPE 4<br />
GRANT NUMBER<br />
PROGRAM START<br />
DATE<br />
TOTAL AMOUNT<br />
DISBURSED (US$)<br />
MACEDONIA (FORMER<br />
YUGOSLAV REPUBLIC)<br />
3 HIV/AIDS 5,904,367 (G2) Gov: MOH MKD-304-G01-H 01-Nov-04 5,844,367<br />
5 TB 2,976,090 (G2) Gov: MOH MKD-506-G02-T 01-Apr-06<br />
Gov: MOH MKD-506-G02-T-e as above 2,453,648<br />
7 HIV/AIDS 4,256,810 (G1) Gov: MOH MKD-708-G03-H 01-Apr-08 3,696,064<br />
MOLDOVA 1 HIV/TB 11,719,047 (G2) Gov: MOH MOL-102-G01-C-00 (Inactive) 01-May-03 11,707,875<br />
6 HIV/AIDS 15,937,910 (B2) Gov: MOH MOL-607-G03-H 01-Jan-08 6,411,072<br />
6 TB 11,175,507 (G2) Gov: MOH MOL-607-G02-T 01-Oct-07 7,044,267<br />
8 HIV/AIDS 11,012,517 (T1)<br />
8 TB 6,638,343 (G1) Gov: MOH MOL-809-G04-T 01-Oct-09 2,587,651<br />
CS/PS: NGO MOL-809-G05-T 01-Oct-09 486,963<br />
9 TB* 7,556,048 (B1)<br />
MONTENEGRO 5 HIV/AIDS 4,720,817 (G2) MO: UNDP MNT-506-G01-H 01-Aug-06 3,252,686<br />
6 TB 2,103,254 (G2) MO: UNDP MNT-607-G02-T 01-Jul-07 1,462,797<br />
9 HIV/AIDS* 3,651,208 (B1)<br />
ROMANIA 2 HIV/AIDS 26,861,313 (G2) Gov: MOH ROM-202-G01-H-00 01-Jan-04 26,519,207<br />
2 TB 16,743,641 (G2) Gov: MOH ROM-202-G02-T-00 01-Feb-04 16,684,709<br />
6 HIV/AIDS 13,163,540 (G2) CS/PS: NGO ROM-607-G03-H 01-Jul-07 10,662,813<br />
6 TB 10,810,358 (G2) CS/PS: NGO ROM-607-G04-T 01-Oct-07 6,425,200<br />
RUSSIAN FEDERATION 3 HIV/AIDS 110,342,354 (G2) CS/PS: NGO RUS-304-G01-H 15-Aug-04 91,142,354<br />
3 TB 17,882,859 (T3) CS/PS: NGO RUS-304-G02-T 01-Dec-04 10,766,486<br />
4 HIV/AIDS 119,873,915 (G2) CS/PS: NGO RUS-405-G03-H 01-Sep-05 119,478,219<br />
4 TB 88,165,448 (G2) CS/PS: NGO RUS-405-G04-T 01-Dec-05 86,271,569<br />
5 HIV/AIDS 18,234,652 (G2) CS/PS: NGO RUS-506-G05-H 01-Sep-06 9,961,901<br />
SERBIA 1 HIV/AIDS 3,575,210 (G2) CS/PS: PS SER-102-G01-H-00 (Closed) 01-Nov-03 3,575,210<br />
3 TB 4,087,979 (G2) Gov: MOH SER-304-G02-T 01-Dec-04 4,087,979<br />
6 HIV/AIDS 14,892,653 (G2) Gov: MOH SER-607-G03-H 01-Jun-07 8,424,203<br />
8 HIV/AIDS 5,258,096 (G1) Gov: MOH SER-809-G04-H 01-Jul-09 1,071,668<br />
CS/PS: NGO SER-809-G05-H 01-Jul-09 1,314,383<br />
9 TB 3,441,632 (B1)<br />
TAJIKISTAN 1 HIV/AIDS 2,425,245 (G2) MO: UNDP TAJ-102-G01-H-00 (Closed) 01-May-03 2,425,245<br />
3 TB 7,143,900 (T3) CS/PS: NGO TAJ-304-G02-T 01-Nov-04 2,761,877<br />
4 HIV/AIDS 8,076,667 (G2) MO: UNDP TAJ-404-G03-H 01-Jan-05 8,076,667<br />
5 Malaria 5,383,510 (G2) MO: UNDP TAJ-506-G04-M 01-Apr-06 5,383,510<br />
6 HIV/AIDS 6,327,429 (G2) MO: UNDP TAJ-607-G05-H (Closed: consolidated<br />
01-May-07 6,327,429<br />
with TAJ-809-G07-H)<br />
6 TB 6,527,347 (B2) MO: UNDP TAJ-607-G06-T (Closed: consolidated<br />
01-Aug-07 6,527,347<br />
with TAJ-809-G09-T)<br />
8 HIV/AIDS 20,028,140 (B2) MO: UNDP TAJ-809-G07-H 01-Nov-09 6,307,804<br />
8 Malaria 7,035,082 (G1) MO: UNDP TAJ-809-G08-M 01-Oct-09 3,116,336<br />
8 TB 20,609,574 (B2) MO: UNDP TAJ-809-G09-T 01-Oct-09 7,251,762<br />
TURKEY 4 HIV/AIDS 3,272,763 (B2) Gov: MOH TUR-405-G01-H (Closed) 01-Aug-05 3,272,763<br />
TURKMENISTAN 9 TB* 7,268,169 (B1)<br />
UKRAINE 1 HIV/AIDS 99,121,371 (B2) CS/PS: NGO UKR-102-A04-H-00, (B2) 300,000<br />
Gov: Oth<br />
UKR-102-G01-H-00<br />
18-Mar-03 311,889<br />
(Terminated), (B2)<br />
Gov: MOH<br />
UKR-102-G02-H-00<br />
(Terminated), (B2)<br />
28-Jan-03 541,682
APPROVED PROPOSALS GRANT AGREEMENTS DISBURSEMENTS<br />
COUNTRY OR TERRITORY 2<br />
ROUND<br />
UKRAINE (CONT.) MO: UNDP UKR-102-G03-H-00<br />
(Terminated), (B2)<br />
CS/PS: NGO UKR-102-G04-H-00, (G2) 15-Mar-04<br />
17-Feb-03 452,948<br />
CS/PS: NGO UKR-102-G04-H-e, (G2) as above 97,386,078<br />
6 HIV/AIDS 131,537,035 (G2) CS/PS: NGO UKR-607-G05-H 01-Aug-07 30,660,351<br />
CS/PS: NGO UKR-607-G06-H 01-Aug-07 21,849,530<br />
UzBEKISTAN 3 HIV/AIDS 21,075,841 (G2) Gov: MOH UZB-304-G01-H 01-Dec-04 18,677,958<br />
4 Malaria 2,423,089 (G2) Gov: Oth UZB-405-G02-M 01-Apr-05 2,423,089<br />
4 TB 13,267,033 (G2) Gov: MOH UZB-405-G03-T 01-Apr-05 12,105,033<br />
8 Malaria 2,118,038 (G1) Gov: Oth UZB-809-G04-M 01-Dec-09 984,904<br />
8 TB 12,098,445 (G1) Gov: MOH UZB-809-G05-T 01-Dec-09 2,794,978<br />
REGION TOTALS: 1,412,680,598 935,109,621<br />
REGION: LATIN AMERICA AND CARIBBEAN<br />
DISEASE<br />
COMPONENT<br />
APPROVED<br />
GRANT AMOUNT<br />
PRINCIPAL<br />
(US$) 3 STATUS 3 RECIPIENT TYPE 4<br />
GRANT NUMBER<br />
PROGRAM START<br />
DATE<br />
TOTAL AMOUNT<br />
DISBURSED (US$)<br />
111 THE GLOBAL FUND <strong>2010</strong>: INNOVATION AND IMPACT ANNexes INtrODuctiON<br />
ARGENTINA 1 HIV/AIDS 25,370,458 (M) MO: UNDP ARG-102-G01-H-00 (Inactive), (B2) 01-Jul-03 9,049,759<br />
CS/PS: PS ARG-102-G02-H-00, (G2) 01-Jan-06 16,320,699<br />
BELIze 3 HIV/AIDS 2,403,677 (G2) CS/PS: NGO BEL-304-G01-H 01-Nov-04 2,182,503<br />
9 HIV/AIDS* 3,190,410 (B1)<br />
BOLIVIA 3 HIV/AIDS 14,948,532 (B2) CS/PS: NGO BOL-304-G01-H (Closed), (B2) 26-Jul-04 2,641,751<br />
MO: UNDP BOL-306-G04-H (Closed), (B2) 01-May-06 1,950,412<br />
CS/PS: NGO BOL-307-G07-H, (G2) 01-Feb-07 10,084,865<br />
3 Malaria 5,111,092 (B2) CS/PS: NGO BOL-304-G02-M (Closed) 26-Jul-04 3,025,736<br />
MO: UNDP BOL-306-G05-M (Closed) 01-May-06 2,085,356<br />
3 TB 5,299,074 (B2) CS/PS: NGO BOL-304-G03-T (Closed), (B2) 26-Jul-04 1,084,486<br />
MO: UNDP BOL-306-G06-T, (G2) 01-May-06 4,214,588<br />
8 Malaria 6,060,293 (G1) MO: UNDP BOL-809-G08-M 01-Oct-09 2,116,856<br />
9 HIV/AIDS 9,501,866 (B1)<br />
9 TB 4,379,037 (B1)<br />
BRAzIL 5 TB 23,021,005 (G2) CS/PS: Oth BRA-506-G01-T 01-May-07 3,997,328<br />
CS/PS: Oth BRA-506-G02-T 01-May-07 11,197,229<br />
8 Malaria 24,627,505 (G1) CS/PS: NGO BRA-809-G03-M 01-Oct-09 2,809,966<br />
CS/PS: NGO BRA-809-G04-M 2,048,240<br />
CHILE 1 HIV/AIDS 28,835,307 (G2) CS/PS: PS CHL-102-G01-H-00 01-Aug-03 28,835,307<br />
COLOMBIA 2 HIV/AIDS 8,669,848 (G2) MO: Oth COL-202-G01-H-00 01-Jul-04 8,521,207<br />
8 Malaria 23,599,048 (T1)<br />
9 HIV/AIDS* 23,877,707 (B1)<br />
COSTA RICA 2 HIV/AIDS 3,583,871 (M) Gov: Oth COR-202-G01-H-00 (Closed), (B2) 01-Oct-03 1,767,359<br />
CS/PS: NGO COR-202-G02-H-00, (G2) 01-Jan-06 1,799,590<br />
CUBA 2 HIV/AIDS 36,224,962 (G3) MO: UNDP CUB-202-G01-H-00 01-Jul-03 30,405,040<br />
6 HIV/AIDS 32,980,666 (B2) MO: UNDP CUB-607-G02-H 01-Oct-07 13,952,277<br />
7 TB 5,455,745 (G1) MO: UNDP CUB-708-G03-T 01-Jan-09 3,709,626<br />
DOMINICAN REPUBLIC 2 HIV/AIDS 87,498,690 (M) Gov: Oth DMR-202-G01-H-00, (G3) 01-Jun-04 55,001,523<br />
CS/PS: NGO DMR-202-G04-H-00, (G3) 01-Sep-09 1,735,520<br />
3 TB 11,017,650 (T3) CS/PS: NGO DMR-304-G02-T, (T3) 01-Oct-04 4,611,860<br />
Gov: MOH DMR-309-G07-T, (T1) 01-Oct-09 480,033
APPROVED PROPOSALS GRANT AGREEMENTS DISBURSEMENTS<br />
COUNTRY OR TERRITORY 2<br />
ROUND<br />
DISEASE<br />
COMPONENT<br />
APPROVED<br />
GRANT AMOUNT<br />
PRINCIPAL<br />
(US$) 3 STATUS 3 RECIPIENT TYPE 4<br />
GRANT NUMBER<br />
PROGRAM START<br />
DATE<br />
TOTAL AMOUNT<br />
DISBURSED (US$)<br />
DOMINICAN REPUBLIC<br />
(CONT.)<br />
7 TB 5,650,022 (G1) CS/PS: NGO DMR-708-G03-T 01-Oct-08 1,761,512<br />
8 Malaria 3,955,506 (G1) CS/PS: NGO DMR-809-G05-M 01-Oct-09 300,504<br />
CS/PS: NGO DMR-809-G06-M 01-Oct-09 1,095,844<br />
ECUADOR 2 HIV/AIDS 13,809,852 (G2) Gov: MOH ECU-202-G01-H-00 01-Mar-05 8,818,311<br />
CS/PS: NGO ECU-202-G03-H-00 01-Jun-06 4,297,733<br />
4 TB 16,353,319 (G2) CS/PS: NGO ECU-405-G02-T 01-Nov-05 15,241,511<br />
8 Malaria 6,928,698 (G1) Gov: MOH ECU-809-G04-M<br />
CS/PS: NGO ECU-809-G05-M<br />
9 HIV/AIDS 10,813,915 (B1)<br />
9 TB 6,834,160 (B1)<br />
El SALVADOR 2 HIV/AIDS 32,987,036 (G3) MO: UNDP SLV-202-G01-H-00, (G3) 01-Aug-03 22,599,835<br />
Gov: MOH SLV-202-G03-H-00, (G3) 01-Nov-06 2,545,930<br />
2 TB 3,778,225 (M) MO: UNDP SLV-202-G02-T-00 (Closed), (B2) 01-Dec-03 2,235,389<br />
Gov: MOH SLV-202-G04-T-00, (G2) 01-Nov-06 1,542,836<br />
7 HIV/AIDS 10,570,700 (G1) Gov: MOH SLV-708-G05-H 01-Oct-08 2,679,357<br />
MO: UNDP SLV-708-G06-H 01-Oct-08 5,820,306<br />
9 TB 3,588,887 (B1)<br />
GUATEMALA 3 HIV/AIDS 40,921,918 (G2) CS/PS: NGO GUA-304-G01-H 01-Dec-04 35,595,030<br />
4 Malaria 13,750,042 (G2) CS/PS: NGO GUA-405-G02-M 01-Sep-05 13,369,899<br />
6 TB 7,428,357 (B2) CS/PS: NGO GUA-607-G03-T 01-Aug-07 3,424,948<br />
9 Malaria 21,452,001 (B1)<br />
GUYANA 3 HIV/AIDS 40,541,008 (T3) Gov: MOH GYA-304-G01-H 01-Jan-05 18,504,708<br />
3 Malaria 2,079,004 (G2) Gov: MOH GYA-304-G02-M 01-Jan-05 1,900,231<br />
4 TB 1,172,917 (G2) Gov: MOH GYA-405-G03-T 01-Oct-05 1,021,028<br />
7 Malaria 1,841,470 (G1) Gov: MOH GYA-708-G04-M 01-May-09 843,861<br />
8 HIV/AIDS 3,917,696 (G1) Gov: MOH GYA-809-G05-S 01-Jan-10<br />
8 TB 2,779,969 (T1)<br />
HAITI 1 HIV/AIDS 159,733,983 (M) CS/PS: PS HTI-102-G01-H-00, (G3) 01-Jan-03 102,864,364<br />
MO: UNDP HTI-102-G02-H-00 (Inactive), (B2) 01-Jan-03 6,140,386<br />
(Closed: consolidated with HTI-102-<br />
G01-H-00, (G3))<br />
3 Malaria 14,431,557 (G2) CS/PS: PS HTI-304-G03-M 01-Aug-04 13,632,508<br />
3 TB 14,860,857 (G2) CS/PS: PS HTI-304-G04-T 01-Aug-04 13,682,901<br />
5 HIV/AIDS 18,821,754 (B2) CS/PS: PS HTI-506-G05-H (Closed: consolidated<br />
01-Jan-07 18,821,754<br />
with HTI-102-G01-H-00, (G3))<br />
7 HIV/AIDS 6,199,554 (G1) CS/PS: PS HTI-708-G06-H (Closed: consolidated<br />
01-Nov-08 3,047,687<br />
with HTI-102-G01-H-00, (G3))<br />
8 Malaria 33,402,457 (T1)<br />
9 TB* 12,260,870 (B1)<br />
HONDURAS 1 HIV/AIDS 51,756,894 (M) MO: UNDP HND-102-G01-H-00, (G2) 01-May-03 26,635,846<br />
CS/PS: Oth HND-102-G04-H-00, (G3) 01-May-08 15,205,358<br />
1 Malaria 11,307,376 (M) MO: UNDP HND-102-G03-M-00, (G2) 01-May-03 7,127,623<br />
CS/PS: Oth HND-102-G05-M-00, (G3) 01-May-08 1,755,051<br />
1 TB 6,109,673 (G2) MO: UNDP HND-102-G02-T-00 01-May-03 6,109,673<br />
9 HIV/AIDS 9,821,491 (B1)<br />
JAMAICA 3 HIV/AIDS 23,318,821 (G2) Gov: MOH JAM-304-G01-H 01-Jun-04 22,891,437<br />
7 HIV/AIDS 15,219,930 (G1) Gov: MOH JAM-708-G02-H 01-Aug-08 10,849,289<br />
MexICO 9 HIV/AIDS 31,008,826 (B1)
APPROVED PROPOSALS GRANT AGREEMENTS DISBURSEMENTS<br />
COUNTRY OR TERRITORY 2<br />
MULTICOUNTRY<br />
AMERICAS (ANDEAN)<br />
MULTICOUNTRY<br />
AMERICAS (CARICOM)<br />
MULTICOUNTRY<br />
AMERICAS (COPRECOS)<br />
MULTICOUNTRY<br />
AMERICAS (CRN+)<br />
MULTICOUNTRY<br />
AMERICAS (MESO)<br />
MULTICOUNTRY<br />
AMERICAS (OECS)<br />
ROUND<br />
DISEASE<br />
COMPONENT<br />
APPROVED<br />
GRANT AMOUNT<br />
PRINCIPAL<br />
(US$) 3 STATUS 3 RECIPIENT TYPE 4<br />
3 Malaria 25,369,116 (G2) MO: Oth MAA-305-G01-M 01-Oct-05 23,536,157<br />
3 HIV/AIDS 12,046,368 (G2) Gov: Oth MAC-304-G01-H 01-Nov-04 11,111,750<br />
9 HIV/AIDS 14,458,896 (B1)<br />
9 HIV/AIDS* 17,599,678 (B1)<br />
GRANT NUMBER<br />
PROGRAM START<br />
DATE<br />
TOTAL AMOUNT<br />
DISBURSED (US$)<br />
4 HIV/AIDS 3,662,376 (G2) CS/PS: NGO MAN-405-G01-H 01-Aug-05 2,577,894<br />
4 HIV/AIDS 4,008,581 (G2) Gov: MOH MAM-405-G01-H 01-Oct-05 3,776,213<br />
3 HIV/AIDS 8,898,774 (G2) MO: Oth MAE-305-G01-H 01-Mar-05 7,427,567<br />
113 THE GLOBAL FUND <strong>2010</strong>: INNOVATION AND IMPACT ANNexes INtrODuctiON<br />
MULTICOUNTRY<br />
AMERICAS (REDCA+)<br />
7 HIV/AIDS 1,722,700 (G1) CS/PS: NGO MAR-708-G01-H 01-Oct-08 1,362,399<br />
NICARAGUA 2 HIV/AIDS 10,108,320 (G2) CS/PS: NGO NIC-202-G03-H-00 01-Mar-04 9,861,804<br />
2 Malaria 5,584,582 (G2) CS/PS: NGO NIC-202-G01-M-00 01-Mar-04 5,584,582<br />
2 TB 9,166,398 (M) CS/PS: NGO NIC-202-G02-T-00, (T3) (Closed: 01-Mar-04 2,717,097<br />
consolidated with NIC-202-G05-<br />
T-00, (G3))<br />
CS/PS: NGO NIC-202-G05-T-00, (G3) 01-Oct-09 2,109,465<br />
7 Malaria 2,868,542 (G1) CS/PS: NGO NIC-708-G04-M 01-Apr-09 2,270,086<br />
8 HIV/AIDS 23,359,081 (G1) CS/PS: NGO NIC-809-G06-H 01-Jan-10 9,283,117<br />
9 Malaria* 4,299,868 (B1)<br />
PANAMA 1 TB 553,817 (G2) MO: UNDP PAN-102-G01-T-00 (Closed) 01-Apr-03 553,817<br />
PARAGUAY 3 TB 5,046,045 (T3) CS/PS: NGO PRY-304-G01-T 01-Dec-04 2,779,326<br />
6 HIV/AIDS 8,832,117 (G2) CS/PS: NGO PRY-607-G02-H 01-Jun-07 5,042,441<br />
7 TB 2,149,206 (G1) CS/PS: NGO PRY-708-G03-T 01-Jul-08 1,999,041<br />
8 HIV/AIDS 5,092,429 (G1) CS/PS: NGO PRY-809-G04-H 01-Aug-09 2,051,990<br />
9 HIV/AIDS 6,463,831 (B1)<br />
9 TB 2,080,336 (B1)<br />
PERU 2 HIV/AIDS 21,619,940 (G2) CS/PS: NGO PER-202-G01-H-00 01-Dec-03 21,619,940<br />
2 TB 25,198,382 (G2) CS/PS: NGO PER-202-G02-T-00 01-Dec-03 25,198,382<br />
5 HIV/AIDS 12,867,465 (G2) CS/PS: NGO PER-506-G03-H 01-Sep-06 9,319,609<br />
5 TB 29,671,364 (G2) CS/PS: NGO PER-506-G04-T 01-Sep-06 19,150,148<br />
6 HIV/AIDS 33,409,884 (B2) CS/PS: NGO PER-607-G05-H 01-Oct-07 21,149,132<br />
8 TB 13,278,783 (G1) CS/PS: NGO PER-809-G06-T<br />
Gov: MOH<br />
PER-809-G07-T<br />
SURINAME 3 HIV/AIDS 4,676,831 (G2) Gov: MOH SUR-305-G01-H 01-Feb-05 4,676,830<br />
4 Malaria 4,603,345 (G2) CS/PS: NGO SUR-404-G02-M 01-Feb-05 4,568,302<br />
5 HIV/AIDS 3,838,706 (G2) Gov: MOH SUR-506-G03-H 01-Feb-07 2,363,177<br />
7 Malaria 2,375,500 (G1) Gov: MOH SUR-708-G04-M 01-Apr-09 1,440,500<br />
9 TB 3,112,254 (B1)<br />
REGION TOTALS: 1,373,088,703 821,522,533
APPROVED PROPOSALS GRANT AGREEMENTS DISBURSEMENTS<br />
COUNTRY OR TERRITORY 2<br />
ROUND<br />
DISEASE<br />
COMPONENT<br />
APPROVED<br />
GRANT AMOUNT<br />
PRINCIPAL<br />
(US$) 3 STATUS 3 RECIPIENT TYPE 4<br />
GRANT NUMBER<br />
PROGRAM START<br />
DATE<br />
TOTAL AMOUNT<br />
DISBURSED (US$)<br />
REGION: MIDDLE EAST AND NORTH AFRICA<br />
ALGERIA 3 HIV/AIDS 6,945,289 (G2) Gov: MOH DZA-304-G01-H 01-Jan-05 6,945,289<br />
CHAD 2 TB 3,039,321 (G2) Gov: Oth TCD-202-G01-T-00 01-May-04 2,398,019<br />
3 HIV/AIDS 17,783,344 (G2) Gov: Oth TCD-304-G02-H 01-Aug-04 12,382,197<br />
7 Malaria 10,477,631 (G1) MO: UNDP TCD-708-G03-M 01-Mar-09 4,644,509<br />
8 HIV/AIDS 36,135,742 (T1)<br />
8 TB 4,428,278 (T1)<br />
9 Malaria 29,823,982 (B1)<br />
DJIBOUTI 4 HIV/AIDS 11,998,400 (G2) Gov: MOH DJB-404-G01-H 01-Mar-05 11,978,365<br />
6 HIV/AIDS 10,205,678 (B2) Gov: MOH DJB-607-G04-H 01-Jun-07 2,719,910<br />
6 Malaria 3,570,083 (B2) Gov: MOH DJB-607-G02-M 01-Jun-07 2,611,945<br />
6 TB 3,558,810 (B2) Gov: MOH DJB-607-G03-T 01-Jun-07 1,116,578<br />
9 Malaria* 3,357,065 (B1)<br />
EGYPT 2 TB 4,032,014 (G2) Gov: MOH EGY-202-G01-T-00 01-Jul-04 3,965,349<br />
6 HIV/AIDS 5,320,880 (G1) Gov: MOH EGY-608-G03-H 01-Apr-08 5,089,730<br />
6 TB 9,499,628 (G2) Gov: MOH EGY-607-G02-T 01-Sep-07 4,786,676<br />
IRAQ 6 TB 14,500,157 (G2) MO: UNDP IRQ-607-G01-T 01-Jan-08 9,893,637<br />
9 TB* 14,670,783 (B1)<br />
JORDAN 2 HIV/AIDS 2,427,408 (G2) Gov: MOH JOR-202-G01-H-00 (Closed) 01-Nov-03 2,427,408<br />
5 TB 2,782,864 (G2) Gov: MOH JOR-506-G02-T 01-Jul-06 2,192,864<br />
6 HIV/AIDS 5,996,658 (G2) Gov: MOH JOR-607-G03-H 01-Jul-07 3,744,948<br />
MALI 1 Malaria 2,592,316 (G2) Gov: MOH MAL-102-G01-M-00 (Closed) 01-Dec-03 2,592,316<br />
4 HIV/AIDS 52,340,436 (G2) Gov: Oth MAL-405-G02-H 01-Jul-05 41,200,338<br />
4 TB 6,747,610 (G2) Gov: MOH MAL-405-G03-T 01-Aug-05 4,933,080<br />
6 Malaria 18,187,814 (M) Gov: MOH MAL-607-G04-M, (G1) 01-Nov-07 2,597,529<br />
CS/PS: NGO MAL-607-G05-M, (B2) 01-Sep-07 5,754,839<br />
7 TB 4,365,958 (G1) Gov: MOH MAL-708-G06-T 01-Aug-08 2,953,732<br />
8 HIV/AIDS 41,794,619 (G1) CS/PS: NGO MAL-809-G07-H 01-Jan-10 4,378,330<br />
Gov: Oth MAL-809-G08-H 01-Jan-10 4,305,234<br />
MAURITANIA 2 Malaria 2,898,993 (G2) MO: UNDP MRT-202-G02-M-00 01-Apr-04 2,051,161<br />
2 TB 2,727,889 (G2) MO: UNDP MRT-202-G01-T-00 01-May-04 2,406,225<br />
5 HIV/AIDS 15,111,273 (G2) Gov: Oth MRT-506-G03-H 01-Sep-06 6,567,216<br />
6 Malaria 4,315,126 (G1) MO: UNDP MRT-607-G04-M 01-Dec-07 2,460,203<br />
6 TB 4,441,686 (G1) MO: UNDP MRT-607-G05-T 01-Dec-07 3,024,357<br />
8 HIV/AIDS 2,772,376 (T1)<br />
MOROCCO 1 HIV/AIDS 9,238,754 (G2) Gov: MOH MOR-102-G01-H-00 01-Mar-03 9,238,754<br />
6 HIV/AIDS 24,876,599 (G2) Gov: MOH MOR-607-G02-H 01-Jul-07 13,764,566<br />
6 TB 4,157,800 (G2) Gov: MOH MOR-607-G03-T 01-Jul-07 2,475,696<br />
NIGER 3 HIV/AIDS 10,713,876 (G2) Gov: Oth NGR-304-G01-H 01-Sep-04 10,419,863<br />
3 Malaria 5,702,483 (M) CS/PS: NGO NGR-304-G02-M, (B2) 01-Sep-04 4,296,559<br />
MO: UNDP NGR-306-G06-M, (G2) 01-Dec-06 1,334,692<br />
4 Malaria 11,257,988 (G1) MO: Oth NGR-405-G03-M 01-Jul-05 11,189,739<br />
5 Malaria 9,631,345 (G2) MO: UNDP NGR-506-G04-M 01-Jul-06 6,210,609<br />
5 TB 14,025,549 (G2) MO: UNDP NGR-506-G05-T 01-Jul-06 9,190,688<br />
7 HIV/AIDS 14,252,753 (G1) Gov: Oth NGR-708-G08-H 01-Jul-08 11,006,838<br />
7 Malaria 31,379,645 (G1) CS/PS: FBO NGR-708-G07-M 01-Jul-08 27,367,757
APPROVED PROPOSALS GRANT AGREEMENTS DISBURSEMENTS<br />
COUNTRY OR TERRITORY 2<br />
ROUND<br />
DISEASE<br />
COMPONENT<br />
APPROVED<br />
GRANT AMOUNT<br />
PRINCIPAL<br />
(US$) 3 STATUS 3 RECIPIENT TYPE 4<br />
SOMALIA 2 Malaria 12,886,413 (G2) MO: Oth SOM-202-G01-M-00 01-Jul-04 12,886,413<br />
3 TB 13,825,351 (G2) CS/PS: NGO SOM-304-G02-T 16-Aug-04 13,661,443<br />
4 HIV/AIDS 24,922,007 (G2) MO: Oth SOM-405-G03-H 01-Jun-05 23,147,120<br />
6 Malaria 24,996,033 (B2) MO: Oth SOM-607-G04-M 01-Nov-07 12,226,357<br />
7 TB 8,732,844 (G1) CS/PS: NGO SOM-708-G05-T 01-Oct-08 5,012,980<br />
8 HIV/AIDS 23,962,544 (G1) MO: Oth SOM-809-G06-H 01-Jan-10<br />
SUDAN 2 Malaria 25,067,660 (G2) MO: UNDP SUD-202-G01-M-00 01-Oct-04 24,662,318<br />
2 Malaria 33,240,453 (G2) MO: UNDP SUD-202-G03-M-00 01-Apr-05 33,078,042<br />
2 TB 14,498,087 (G2) MO: UNDP SUD-202-G02-T-00 01-Oct-04 14,498,087<br />
3 HIV/AIDS 20,682,531 (G2) MO: UNDP SUD-305-G04-H 01-Apr-05 18,815,840<br />
4 HIV/AIDS 26,935,365 (G2) MO: UNDP SUD-405-G05-H 01-Aug-06 19,584,060<br />
5 HIV/AIDS 84,976,035 (G2) MO: UNDP SUD-506-G08-H 01-Jan-07 28,652,063<br />
5 TB 21,613,754 (G2) MO: UNDP SUD-506-G06-T 01-Oct-06 14,131,775<br />
5 TB 15,410,235 (G2) MO: UNDP SUD-506-G07-T 01-Jan-07 11,440,986<br />
7 Malaria 33,512,896 (G1) CS/PS: NGO SUD-708-G09-M 01-Dec-08 26,115,395<br />
7 Malaria 38,296,873 (G1) MO: UNDP SUD-708-G10-M 01-Apr-09 16,482,852<br />
7 TB 6,172,805 (G1) MO: UNDP SUD-708-G11-T 01-Jan-09 2,461,028<br />
8 TB 16,176,758 (T1)<br />
9 HIV/AIDS 27,230,100 (B1)<br />
GRANT NUMBER<br />
PROGRAM START<br />
DATE<br />
TOTAL AMOUNT<br />
DISBURSED (US$)<br />
115 THE GLOBAL FUND <strong>2010</strong>: INNOVATION AND IMPACT ANNexes INtrODuctiON<br />
SYRIAN ARAB REPUBLIC 6 TB 7,377,125 (B2) MO: UNDP SYR-607-G01-T 01-Dec-07 3,080,348<br />
TUNISIA 6 HIV/AIDS 16,180,346 (B2) Gov: MOH TUN-607-G01-H 01-Sep-07 9,139,305<br />
8 TB 3,823,256 (T1)<br />
WEST BANK AND Gaza 7 HIV/AIDS 5,014,330 (G1) MO: UNDP PSE-708-G01-H 01-Dec-08 2,355,254<br />
8 TB 1,266,596 (G1) MO: UNDP PSE-809-G02-T 01-Dec-09 391,212<br />
YEMEN 2 Malaria 11,878,206 (G2) Gov: MOH YEM-202-G01-M-00 01-Mar-04 11,878,206<br />
3 HIV/AIDS 14,460,517 (M) Gov: MOH YEM-305-G02-H, (B2) 01-Jul-05 2,247,002<br />
Gov: MOH YEM-305-G03-H, (B2) 01-Jul-05 1,645,056<br />
MO: UNDP YEM-307-G05-H, (G2) 01-Jan-08 6,013,560<br />
4 TB 6,147,507 (G2) Gov: MOH YEM-405-G04-T 01-Jul-05 5,946,847<br />
7 Malaria 8,013,694 (G1) Gov: MOH YEM-708-G06-M 01-Dec-08 3,260,385<br />
9 TB* 11,136,828 (B1)<br />
REGION TOTALS: 1,052,524,052 591,431,683<br />
REGION: SOUTH AND WEST ASIA<br />
AFGHANISTAN 2 Integrated 3,125,605 (G1) Gov: MOH AFG-202-G01-I-00 01-Dec-04 3,125,605<br />
4 TB 3,448,773 (G2) Gov: MOH AFG-405-G02-T 01-Sep-05 2,678,961<br />
5 Malaria 28,316,682 (G2) Gov: MOH AFG-506-G03-M 01-Nov-06 15,190,840<br />
CS/PS: NGO AFG-509-G06-M 01-Feb-09 7,171,871<br />
7 HIV/AIDS 4,767,953 (G1) Gov: MOH AFG-708-G04-H 01-Oct-08 285,960<br />
Gov: Oth AFG-708-G05-H 01-Oct-08 1,314,764<br />
8 Malaria 38,782,646 (G1) Gov: MOH AFG-809-G08-M 01-Nov-09<br />
CS/PS: NGO AFG-809-G09-M 01-Nov-09 10,260,953<br />
CS/PS: NGO AFG-809-G10-M 1,530,640<br />
8 TB 10,410,999 (G1) CS/PS: NGO AFG-809-G07-T 01-Apr-09 3,746,104<br />
BANGLADESH 2 HIV/AIDS 48,968,561 (T3) Gov: MOF BAN-202-G01-H-00 01-Mar-04 19,631,639<br />
3 TB 42,466,601 (G2) CS/PS: NGO BAN-304-G02-T 01-Aug-04 26,743,146<br />
Gov: MOF BAN-304-G03-T 01-Sep-04 10,185,367<br />
5 TB 43,300,976 (G2) CS/PS: NGO BAN-506-G04-T 01-May-06 11,186,149<br />
Gov: MOF BAN-506-G05-T 01-May-06 5,502,085
APPROVED PROPOSALS GRANT AGREEMENTS DISBURSEMENTS<br />
COUNTRY OR TERRITORY 2<br />
ROUND<br />
DISEASE<br />
COMPONENT<br />
APPROVED<br />
GRANT AMOUNT<br />
PRINCIPAL<br />
(US$) 3 STATUS 3 RECIPIENT TYPE 4<br />
GRANT NUMBER<br />
PROGRAM START<br />
DATE<br />
TOTAL AMOUNT<br />
DISBURSED (US$)<br />
BANGLADESH (CONT.) 6 HIV/AIDS 36,744,320 (G2) Gov: MOF BAN-607-G08-H 01-May-07 20,216,223<br />
6 Malaria 35,531,250 (G2) CS/PS: NGO BAN-607-G06-M 01-May-07 9,261,468<br />
Gov: MOF BAN-607-G07-M 01-Jun-07 10,435,871<br />
8 TB 4,729,947 (G1) Gov: MOF BAN-809-G09-T 01-Oct-09<br />
CS/PS: NGO BAN-809-G10-T 01-Oct-09 688,820<br />
9 Malaria 10,280,071 (B1)<br />
BHUTAN 4 Malaria 1,737,190 (G2) Gov: Oth BTN-405-G01-M 01-Apr-05 1,343,198<br />
4 TB 994,298 (G2) Gov: Oth BTN-405-G02-T 01-Apr-05 886,470<br />
6 HIV/AIDS 1,502,445 (G1) Gov: Oth BTN-607-G03-H 01-Feb-08 1,009,740<br />
6 TB 741,689 (G1) Gov: Oth BTN-607-G04-T 01-Jan-08 550,249<br />
7 Malaria 2,046,986 (G1) Gov: Oth BTN-708-G05-M 01-Jul-08 1,691,617<br />
INDIA 1 TB 8,655,033 (G2) Gov: Oth IDA-102-G01-T-00 01-Apr-03 8,250,421<br />
2 HIV/AIDS 224,805,561 (T3) Gov: Oth IDA-202-G02-H-00 01-May-04 106,365,233<br />
2 TB 113,146,342 (G3) Gov: Oth IDA-202-G03-T-00 01-Apr-04 40,777,676<br />
3 HIV/TB 14,819,772 (G2) Gov: Oth IDA-304-G04-C 01-Jan-05 14,819,772<br />
4 HIV/AIDS 292,794,190 (M) CS/PS: NGO IDA-405-G05-H, (G2) 01-Apr-05 15,713,025<br />
Gov: Oth IDA-405-G06-H, (T3) 01-Sep-05 122,668,637<br />
4 Malaria 63,544,954 (G2) Gov: MOF IDA-405-G07-M 01-Jul-05 47,705,431<br />
4 TB 19,113,943 (G2) Gov: Oth IDA-405-G08-T (Closed: consolidated<br />
with IDA-202-G03-T-00)<br />
01-Apr-05 19,113,943<br />
6 HIV/AIDS 212,202,765 (M) CS/PS: NGO IDA-607-G10-H, (G2) 01-Jun-07 11,660,274<br />
Gov: Oth IDA-607-G11-H, (B2) 01-Jul-07 59,127,314<br />
CS/PS: NGO IDA-607-G12-H, (G2) 01-Jun-07 8,429,160<br />
6 TB 8,579,594 (B2) Gov: Oth IDA-607-G09-T (Closed: consolidated<br />
with IDA-202-G03-T-00)<br />
01-Apr-07 8,579,594<br />
7 HIV/AIDS 30,720,116 (G1) Gov: Oth IDA-708-G13-H 01-Sep-08 3,734,625<br />
9 HIV/AIDS* 21,000,206 (B1)<br />
9 Malaria* 38,105,605 (B1)<br />
9 TB 69,477,410 (B1)<br />
Gov: MOH IDA-708-G14-H 01-Sep-08 5,966,235<br />
CS/PS: Oth IDA-708-G15-H 01-Sep-08 4,475,541<br />
IRAN (ISLAMIC<br />
REPUBLIC)<br />
2 HIV/AIDS 15,922,855 (G2) MO: UNDP IRN-202-G01-H-00 01-May-05 13,686,763<br />
7 Malaria 5,615,598 (G1) MO: UNDP IRN-708-G02-M 01-Oct-08 3,172,482<br />
7 TB 12,652,286 (G1) MO: UNDP IRN-708-G03-T 01-Oct-08 9,208,798<br />
8 HIV/AIDS 10,328,021 (T1)<br />
MALDIVES 6 HIV/AIDS 4,142,457 (G2) MO: UNDP MDV-607-G01-H 01-Sep-07 2,350,538<br />
MULTICOUNTRY ASIA<br />
(Naz FOUNDATION<br />
INTERNATIONAL)<br />
9 HIV/AIDS 18,660,775 (B1)<br />
NEPAL 2 HIV/AIDS 10,365,995 (G2) Gov: MOH NEP-202-G01-H-00 01-Apr-04 4,849,147<br />
MO: UNDP NEP-202-G05-H-00 01-Oct-06 4,551,995<br />
2 Malaria 23,836,272 (M) Gov: MOH NEP-202-G02-M-00, (G2) 01-Apr-04 2,459,501<br />
CS/PS: NGO NEP-202-G04-M-00, (T3) 01-Dec-05 4,544,691<br />
4 TB 10,126,706 (G2) Gov: MOH NEP-405-G03-T 01-May-06 6,869,255<br />
7 HIV/AIDS 12,321,512 (G1) MO: UNDP NEP-708-G09-H 01-Dec-08 5,155,578<br />
CS/PS: NGO NEP-708-G10-H 01-Dec-08 2,327,461<br />
CS/PS: NGO NEP-708-G11-H 01-Dec-08 1,155,657<br />
7 Malaria 9,126,452 (G1) CS/PS: NGO NEP-708-G06-M 16-Sep-08 3,064,866<br />
Gov: MOH NEP-708-G07-M 16-Sep-08 1,193,717<br />
7 TB 4,358,040 (G1) Gov: MOH NEP-708-G08-T 16-Nov-08 1,982,292<br />
N1 5 TB 16,711,941 (B1)
APPROVED PROPOSALS GRANT AGREEMENTS DISBURSEMENTS<br />
COUNTRY OR TERRITORY 2<br />
ROUND<br />
DISEASE<br />
COMPONENT<br />
APPROVED<br />
GRANT AMOUNT<br />
PRINCIPAL<br />
(US$) 3 STATUS 3 RECIPIENT TYPE 4<br />
PAKISTAN 2 HIV/AIDS 8,312,200 (G2) Gov: MOH PKS-202-G01-H-00 01-Jan-04 7,647,236<br />
2 Malaria 3,537,802 (B2) Gov: MOH PKS-202-G02-M-00 (Inactive) 01-Jan-04 3,537,802<br />
2 TB 4,042,900 (G2) Gov: MOH PKS-202-G03-T-00 01-Jan-04 3,901,437<br />
3 Malaria 1,548,636 (G1) Gov: MOH PKS-304-G04-M 01-Jan-05 1,382,784<br />
3 TB 9,903,487 (G2) Gov: MOH PKS-304-G05-T 01-Jan-05 8,372,960<br />
6 TB 46,349,905 (M) CS/PS: NGO PKS-607-G06-T 01-Oct-07 9,556,681<br />
Gov: MOH PKS-607-G07-T 01-Dec-07 8,629,063<br />
7 Malaria 12,886,680 (G1) Gov: MOH PKS-708-G08-M 01-Sep-08 8,516,287<br />
8 TB 8,867,642 (G1) Gov: MOH PKS-809-G09-T 01-Jul-09 2,109,209<br />
9 TB 40,146,549 (B1)<br />
CS/PS: PS PKS-809-G10-T 01-Sep-09 1,259,208<br />
SRI LANKA 1 Malaria 7,253,635 (G2) Gov: MOH SRL-102-G01-M-00 01-Mar-03 2,077,223<br />
CS/PS: NGO SRL-102-G02-M-00 01-Mar-03 4,633,887<br />
1 TB 5,465,034 (M) Gov: MOH SRL-102-G03-T-00, (G2) 01-Mar-03 3,909,835<br />
CS/PS: NGO SRL-102-G04-T-00 (Inactive), (B2) 01-Mar-03 268,292<br />
4 Malaria 3,697,315 (G2) Gov: MOH SRL-405-G05-M 01-Oct-05 2,159,122<br />
CS/PS: NGO SRL-405-G06-M 01-Oct-05 1,152,684<br />
6 HIV/AIDS 1,009,700 (G1) Gov: MOH SRL-607-G09-H 01-Jan-08 302,600<br />
6 TB 4,186,195 (G1) Gov: MOH SRL-607-G07-T 01-Jan-08 985,674<br />
CS/PS: NGO SRL-607-G08-T 01-Jan-08 624,995<br />
8 Malaria 21,630,381 (G1) Gov: MOH SRL-809-G10-M 01-Sep-09 1,836,422<br />
9 HIV/AIDS* 19,398,656 (B1)<br />
GRANT NUMBER<br />
PROGRAM START<br />
DATE<br />
TOTAL AMOUNT<br />
DISBURSED (US$)<br />
CS/PS: NGO SRL-809-G11-M 01-Oct-09 2,810,551<br />
CS/PS: NGO SRL-809-G12-M 01-Nov-09 1,471,303<br />
117 THE GLOBAL FUND <strong>2010</strong>: INNOVATION AND IMPACT ANNexes INtrODuctiON<br />
REGION TOTALS: 1,787,268,110 785,742,616<br />
REGION: SUB-SAHARAN AFRICA: EAST AFRICA AND INDIAN OCEAN<br />
BURUNDI 1 HIV/AIDS 8,657,000 (G2) Gov: Oth BRN-102-G01-H-00 31-Mar-03 8,657,000<br />
2 Malaria 39,089,883 (M) Gov: MOH BRN-202-G02-M-00 (Closed), (G2) 01-Oct-03 16,568,331<br />
Gov: MOH BRN-202-G05-M-00, (G3) 01-Oct-06 17,036,493<br />
4 TB 3,381,665 (G2) Gov: MOH BRN-405-G03-T 01-May-05 3,050,158<br />
5 HIV/AIDS 32,353,173 (G2) Gov: Oth BRN-506-G04-H 01-Jun-06 28,575,237<br />
7 TB 4,018,177 (G1) Gov: MOH BRN-708-G06-T 01-Sep-08 3,255,533<br />
8 HIV/AIDS 36,789,591 (G1) Gov: Oth BRN-809-G07-H 9,087,521<br />
CS/PS: NGO BRN-809-G08-H 3,917,612<br />
9 Malaria 21,578,809 (B1)<br />
COMOROS 2 Malaria 2,485,878 (G2) CS/PS: NGO COM-202-G01-M-00 01-Jun-04 2,422,471<br />
3 HIV/AIDS 1,136,900 (G2) CS/PS: NGO COM-304-G02-H 01-Jan-05 1,086,463<br />
8 Malaria 6,495,925 (T1)<br />
9 HIV/AIDS 2,627,984 (B1)<br />
CONGO (DEMOCRATIC<br />
REPUBLIC)<br />
2 TB 7,625,773 (G2) MO: UNDP ZAR-202-G01-T-00 (Inactive) 01-Aug-03 7,601,673<br />
3 HIV/AIDS 113,646,453 (G2) MO: UNDP ZAR-304-G02-H 01-Jan-05 113,578,847<br />
3 Malaria 53,936,609 (G2) MO: UNDP ZAR-304-G03-M 01-Jan-05 53,936,608<br />
5 TB 27,051,721 (B2) MO: UNDP ZAR-506-G04-T 01-Dec-06 19,230,176<br />
6 TB 10,584,757 (B2) MO: UNDP ZAR-607-G05-T 01-Oct-07 8,182,300<br />
7 HIV/AIDS 22,675,188 (G1) MO: UNDP ZAR-708-G06-H 01-Dec-08 11,626,217<br />
8 HIV/AIDS 71,309,902 (T1) MO: UNDP ZAR-809-G10-H 5,208,606<br />
8 Malaria 145,520,804 (T1) CS/PS: NGO ZAR-809-G07-M 01-Jan-10 66,872,873<br />
9 TB* 110,092,302 (B1)<br />
ERITREA 2 Malaria 7,911,425 (G2) Gov: MOH ERT-202-G01-M-00 28-Nov-03 7,233,883<br />
3 HIV/AIDS 17,354,035 (G2) Gov: MOH ERT-304-G02-H 01-Sep-04 16,692,156
APPROVED PROPOSALS GRANT AGREEMENTS DISBURSEMENTS<br />
COUNTRY OR TERRITORY 2<br />
ROUND<br />
DISEASE<br />
COMPONENT<br />
APPROVED<br />
GRANT AMOUNT<br />
PRINCIPAL<br />
(US$) 3 STATUS 3 RECIPIENT TYPE 4<br />
GRANT NUMBER<br />
PROGRAM START<br />
DATE<br />
TOTAL AMOUNT<br />
DISBURSED (US$)<br />
ERITREA (CONT.) 5 HIV/AIDS 28,658,165 (G2) Gov: MOH ERT-506-G03-H 01-Sep-06 17,103,758<br />
6 Malaria 12,301,265 (B2) Gov: MOH ERT-607-G05-M 01-Nov-07 4,622,705<br />
6 TB 9,724,961 (B2) Gov: MOH ERT-607-G04-T 01-Nov-07 3,087,417<br />
8 HIV/AIDS 15,174,249 (G1) Gov: MOH ERT-809-G06-H 5,997,748<br />
9 Malaria 29,855,990 (B1)<br />
ETHIOPIA 1 TB 26,980,649 (G2) Gov: MOH ETH-102-G01-T-00 01-Aug-03 26,980,649<br />
2 HIV/AIDS 481,959,415 (T3) Gov: Oth ETH-202-G03-H-00 01-Jan-04 129,385,088<br />
2 Malaria 73,875,211 (G2) Gov: MOH ETH-202-G02-M-00 01-Oct-03 73,875,211<br />
4 HIV/AIDS 401,905,883 (G2) Gov: Oth ETH-405-G04-H 01-Mar-05 244,114,173<br />
5 Malaria 140,687,413 (G2) Gov: MOH ETH-506-G05-M 01-Jul-06 104,036,581<br />
6 TB 11,792,574 (G1) Gov: MOH ETH-607-G06-T 01-Feb-08 7,878,422<br />
7 HIV/AIDS 64,955,789 (G1) CS/PS: NGO ETH-708-G07-H 01-Apr-09 3,089,816<br />
Gov: Oth ETH-708-G08-H 01-Jan-09 22,443,435<br />
CS/PS: FBO ETH-708-G09-H 01-Jan-09 6,780,027<br />
8 Malaria 133,089,526 (G1) Gov: MOH ETH-809-G10-M 01-Nov-09 72,178,615<br />
9 TB* 19,383,242 (B1)<br />
KENYA 1 HIV/AIDS 2,650,813 (G1) CS/PS: NGO KEN-102-G01-H-00 (Inactive) 01-Apr-03 2,650,813<br />
1 HIV/AIDS 220,875 (G1) CS/PS: NGO KEN-102-G02-H-00 (Inactive) 01-Apr-03 220,875<br />
2 HIV/AIDS 68,006,881 (G2) Gov: MOF KEN-202-G03-H-00 01-Dec-03 68,006,881<br />
2 Malaria 4,640,447 (G2) Gov: MOF KEN-202-G05-M-00 01-Oct-03 4,640,447<br />
2 TB 3,299,522 (G2) Gov: MOF KEN-202-G04-T-00 01-Nov-03 3,299,522<br />
4 Malaria 162,173,085 (G2) Gov: MOF KEN-405-G06-M 01-Feb-06 102,535,157<br />
5 TB 13,499,895 (B2) Gov: MOF KEN-506-G07-T 01-Sep-06 3,511,242<br />
6 TB 4,206,357 (G1) Gov: MOF KEN-607-G08-T 01-Apr-08 2,961,806<br />
7 HIV/AIDS 46,663,495 (G1) Gov: MOF KEN-708-G09-H 01-Jun-09 11,803,456<br />
CS/PS: NGO KEN-708-G10-H 01-Apr-09 4,735,494<br />
9 TB* 23,682,114 (B1)<br />
MADAGASCAR 1 Malaria 2,000,063 (G2) CS/PS: NGO MDG-102-G01-M-00 (Inactive) 01-Feb-03 1,872,363<br />
2 HIV/AIDS 1,439,778 (G2) CS/PS: NGO MDG-202-G02-H-00 (Closed) 01-Nov-03 1,439,778<br />
2 HIV/AIDS 5,024,116 (G2) CS/PS: NGO MDG-202-G03-H-00 01-May-03 4,992,128<br />
3 HIV/AIDS 14,488,982 (G2) Gov: Oth MDG-304-G04-H 01-Nov-04 14,320,111<br />
3 Malaria 10,035,054 (G2) Gov: MOH MDG-304-G05-M 01-Nov-04 10,002,421<br />
4 Malaria 74,939,490 (M) Gov: MOH MDG-405-G06-M, (G2) 01-Apr-05 21,446,655<br />
CS/PS: NGO MDG-405-G07-M, (G3) 01-Mar-05 28,070,175<br />
4 TB 8,323,396 (G2) Gov: Oth MDG-404-G08-T 01-Feb-05 7,946,689<br />
7 Malaria 26,095,449 (G1) Gov: MOH MDG-708-G09-M 01-Oct-08 12,559,549<br />
CS/PS: NGO MDG-708-G10-M 01-Dec-08 2,150,644<br />
8 HIV/AIDS 9,799,118 (G1) Gov: Oth MDG-809-G11-H 01-Oct-09 2,166,096<br />
CS/PS: NGO MDG-809-G12-H 01-Nov-09 1,565,715<br />
8 TB 8,088,328 (T1)<br />
N1 5 Malaria 81,015,431 (B1)<br />
MAURITIUS 8 HIV/AIDS 5,191,511 (G1) Gov: MOH MUS-809-G01-H<br />
MUS-809-G02-H 820.014<br />
RWANDA 1 HIV/TB 14,641,046 (G2) Gov: MOH RWN-102-G01-C-00 01-May-03 14,641,046<br />
3 HIV/AIDS 56,646,465 (G2) Gov: MOH RWN-304-G02-H 01-Aug-04 56,646,460<br />
3 Malaria 38,597,403 (G3) Gov: MOH RWN-304-G03-M 01-Oct-04 32,414,495<br />
4 TB 17,027,672 (T3) Gov: MOH RWN-404-G04-T 01-Jan-05 10,556,003<br />
5 HSS 33,945,080 (G2) Gov: MOH RWN-505-G05-S 01-Jan-06 33,397,129<br />
5 Malaria 39,649,362 (G2) Gov: MOH RWN-506-G06-M 01-Mar-06 39,149,502<br />
6 HIV/AIDS 50,808,370 (B2) Gov: MOH RWN-607-G08-H 01-Jun-07 30,196,743<br />
6 TB 7,426,750 (B2) Gov: MOH RWN-606-G07-T 01-Mar-07 2,538,357<br />
7 HIV/AIDS 63,978,011 (G1) Gov: MOH RWN-708-G09-H 01-Oct-08 49,725,380
APPROVED PROPOSALS GRANT AGREEMENTS DISBURSEMENTS<br />
COUNTRY OR TERRITORY 2<br />
ROUND<br />
DISEASE<br />
COMPONENT<br />
APPROVED<br />
GRANT AMOUNT<br />
PRINCIPAL<br />
(US$) 3 STATUS 3 RECIPIENT TYPE 4<br />
RWANDA (CONT.) 8 Malaria 52,835,617 (G1) Gov: MOH RWN-809-G10-M 01-Jul-09 35,985,693<br />
N1 5 HIV/AIDS 213,800,858 (B1)<br />
N1 5 TB 33,353,241 (B1)<br />
TANzANIA 1 HIV/AIDS 5,400,000 (G1) Gov: MOF TNZ-102-G02-H-00 (Inactive) 01-Nov-03 4,647,000<br />
1 Malaria 78,079,834 (G3) Gov: MOH TNZ-102-G01-M-00 01-Nov-03 70,222,011<br />
3 HIV/TB 83,466,904 (G2) Gov: MOF TNZ-304-G03-C 01-Nov-04 54,798,490<br />
4 HIV/AIDS 303,939,165 (M) Gov: MOF TNZ-405-G04-H, (G2) 01-Sep-05 160,325,676<br />
CS/PS: NGO TNZ-405-G05-H, (G2) 01-Jul-05 36,703,100<br />
CS/PS: NGO TNZ-405-G06-H, (T3) 01-Jul-05 9,374,829<br />
CS/PS: NGO TNZ-405-G07-H, (G2) 01-Jul-05 21,471,837<br />
4 Malaria 76,086,764 (G2) Gov: MOF TNZ-405-G08-M 01-Aug-05 75,086,764<br />
6 TB 16,498,948 (G1) Gov: MOF TNZ-607-G09-T 01-Nov-07 15,173,156<br />
7 Malaria 20,707,304 (G1) Gov: MOF TNZ-708-G10-M 01-Jul-08 10,170,104<br />
8 HIV/AIDS 121,142,078 (G1) CS/PS: NGO TNZ-809-G12-H 1,143,466<br />
Gov: MOF<br />
TNZ-809-G13-H<br />
8 Malaria 100,427,017 (G1) Gov: MOF TNZ-809-G11-M 01-Nov-09 31,467,018<br />
9 HIV/AIDS 97,901,945 (B1)<br />
9 Malaria* 76,050,523 (B1)<br />
GRANT NUMBER<br />
PROGRAM START<br />
DATE<br />
TOTAL AMOUNT<br />
DISBURSED (US$)<br />
119 THE GLOBAL FUND <strong>2010</strong>: INNOVATION AND IMPACT ANNexes INtrODuctiON<br />
UGANDA 1 HIV/AIDS 48,878,417 (B2) Gov: MOF UGD-102-G01-H-00 (Inactive) 15-Jun-03 26,160,888<br />
2 Malaria 23,211,300 (B2) Gov: MOF UGD-202-G02-M-00 15-Mar-04 21,054,781<br />
2 TB 4,692,021 (G1) Gov: MOF UGD-202-G03-T-00 15-Mar-04 4,599,506<br />
3 HIV/AIDS 46,362,091 (G2) Gov: MOF UGD-304-G04-H 01-Jul-05 46,362,091<br />
4 Malaria 137,467,137 (G2) Gov: MOF UGD-405-G05-M 01-Dec-05 59,071,374<br />
6 TB 8,103,106 (G1) Gov: MOF UGD-607-G06-T 01-Mar-08 2,585,105<br />
7 HIV/AIDS 70,277,726 (G1) Gov: MOF UGD-708-G07-H 01-Aug-09 4,250,997<br />
7 Malaria 51,422,198 (G1) Gov: MOF UGD-708-G08-M 01-Dec-09 40,985,476<br />
zANzIBAR (TANzANIA) 1 Malaria 1,153,080 (G2) Gov: MOH ZAN-102-G01-M-00 01-Jun-03 1,153,080<br />
2 HIV/AIDS 2,302,637 (G2) Gov: Oth ZAN-202-G02-H-00 01-Sep-03 1,432,275<br />
3 TB 1,699,867 (G2) Gov: MOH ZAN-304-G03-T 01-Dec-04 1,110,134<br />
4 Malaria 8,438,788 (G2) Gov: MOH ZAN-404-G04-M 01-Jan-05 8,438,788<br />
6 HIV/AIDS 3,825,619 (G1) Gov: MOH ZAN-607-G05-H 01-Dec-07 1,208,108<br />
Gov: Oth ZAN-607-G06-H 01-Dec-07 135,695<br />
8 Malaria 5,191,787 (G1) Gov: MOH ZAN-809-G07-M 01-Dec-09<br />
REGION TOTALS: 4,787,588,617 2,453,494,390<br />
REGION: SUB-SAHARAN AFRICA: SOUTHERN AFRICA<br />
ANGOLA 3 Malaria 35,029,872 (G2) MO: UNDP AGO-305-G01-M 01-Apr-05 34,833,588<br />
4 HIV/AIDS 86,120,215 (G2) MO: UNDP AGO-405-G03-H 01-Oct-05 45,876,284<br />
4 TB 10,871,026 (G2) MO: UNDP AGO-405-G02-T 01-Aug-05 8,241,814<br />
7 Malaria 32,512,648 (G1) Gov: MOH AGO-708-G04-M 01-Nov-08 15,927,050<br />
9 TB* 11,384,314 (B1)<br />
BOTSWANA 2 HIV/AIDS 18,580,414 (G1) Gov: MOF BOT-202-G01-H-00 (Inactive) 01-Jul-04 9,019,119<br />
5 TB 8,285,245 (G2) Gov: MOF BOT-506-G02-T 01-Jan-07 3,975,343<br />
LESOTHO 2 HIV/AIDS 29,312,000 (G2) Gov: MOF LSO-202-G01-H-00 01-Jan-04 28,884,104<br />
2 TB 5,000,000 (G2) Gov: MOF LSO-202-G02-T-00 01-Jan-04 4,947,928<br />
5 HIV/AIDS 15,781,572 (G2) Gov: MOF LSO-506-G03-H 01-Nov-06 15,781,572<br />
6 TB 5,543,805 (G2) Gov: MOF LSO-607-G04-T 01-Jul-07 3,071,843<br />
7 HIV/AIDS 10,626,665 (G1) Gov: MOF LSO-708-G05-H 01-Jul-08 5,155,757<br />
8 HIV/AIDS 57,214,789 (M) Gov: MOF LSO-809-G06-H, (G1) 01-Nov-09<br />
CS/PS: NGO LSO-809-G07-H, (G1)
APPROVED PROPOSALS GRANT AGREEMENTS DISBURSEMENTS<br />
COUNTRY OR TERRITORY 2<br />
ROUND<br />
DISEASE<br />
COMPONENT<br />
APPROVED<br />
GRANT AMOUNT<br />
PRINCIPAL<br />
(US$) 3 STATUS 3 RECIPIENT TYPE 4<br />
GRANT NUMBER<br />
PROGRAM START<br />
DATE<br />
TOTAL AMOUNT<br />
DISBURSED (US$)<br />
LESOTHO (CONT.) 8 TB 9,569,124 (T1)<br />
9 HIV/AIDS 10,356,112 (B1)<br />
MALAWI 1 HIV/AIDS 342,557,595 (G3) Gov: Oth MLW-102-G01-H-00 01-Oct-03 225,638,705<br />
2 Malaria 36,773,714 (B2) Gov: MOH MLW-202-G02-M-00 01-Feb-06 17,957,714<br />
5 HIV/AIDS 17,589,438 (G2) Gov: Oth MLW-506-G03-H 01-Oct-06 13,014,913<br />
5 HSS 51,984,491 (B2) Gov: Oth MLW-506-G04-S 01-Jul-07 21,345,667<br />
7 HIV/AIDS 15,078,417 (G1) Gov: Oth MLW-708-G07-H 01-Oct-08 9,529,917<br />
7 Malaria 36,545,312 (G1) Gov: Oth MLW-708-G05-M 01-Jan-09 18,683,204<br />
7 TB 7,802,037 (G1) Gov: MOH MLW-708-G06-T 01-Jan-09 2,825,106<br />
9 Malaria 33,170,946 (B1)<br />
MozAMBIQUE 2 HIV/AIDS 109,338,584 (M) Gov: Oth MOZ-202-G01-H-00, (B2) 01-Jul-06 6,156,898<br />
Gov: MOH MOZ-202-G02-H-00, (G2) 01-Jan-05 75,822,995<br />
2 Malaria 28,149,603 (G2) Gov: MOH MOZ-202-G03-M-00 01-Jan-05 23,489,200<br />
2 TB 14,200,659 (G2) Gov: MOH MOZ-202-G04-T-00 01-Jan-05 9,323,228<br />
6 HIV/AIDS 70,041,322 (B2) Gov: MOH MOZ-607-G05-H 01-Jul-07 16,012,381<br />
6 Malaria 33,353,933 (B2) Gov: MOH MOZ-607-G06-M 01-Jul-07 13,123,695<br />
7 TB 6,735,303 (G1) Gov: MOH MOZ-708-G07-T 01-Jul-08 2,134,834<br />
8 HIV/AIDS 11,823,414 (T1) Gov: MOH MOZ-809-G08-S<br />
9 HIV/AIDS* 69,377,979 (B1)<br />
9 Malaria 67,401,102 (B1)<br />
MULTICOUNTRY AFRICA<br />
(SADC)<br />
9 HIV/AIDS* 24,587,661 (B1)<br />
MULTICOUNTRY AFRICA<br />
(RMCC)<br />
2 Malaria 41,101,873 (G3) CS/PS: NGO MAF-202-G01-M-00 01-Aug-03 25,237,548<br />
5 Malaria 6,501,141 (B2) CS/PS: NGO MAF-506-G02-M 01-Jul-06 6,501,141<br />
NAMIBIA 2 HIV/AIDS 213,059,806 (T3) Gov: MOH NMB-202-G01-H-00 01-Jan-05 87,629,806<br />
2 Malaria 9,103,621 (T3) Gov: MOH NMB-202-G03-M-00 01-Jan-05 6,199,265<br />
2 TB 2,129,814 (T3) Gov: MOH NMB-202-G02-T-00 01-Jan-05 1,294,610<br />
5 TB 17,204,526 (G2) Gov: MOH NMB-506-G04-T 01-Jun-06 12,592,920<br />
6 Malaria 13,553,569 (B2) Gov: MOH NMB-607-G06-M 01-Aug-07 8,450,571<br />
SOUTH AFRICA 1 HIV/TB 20,226,665 (B2) Gov: MOF SAF-102-G01-C-00 (Inactive) 08-Dec-03 2,354,000<br />
Gov: MOF SAF-102-G02-C-00 (Inactive) 01-Aug-03 17,872,665<br />
1 HIV/TB 62,476,536 (G2) Gov: MOF SAF-102-G03-C-00 01-Jan-04 49,771,823<br />
2 HIV/TB 24,400,220 (G2) Gov: MOH SAF-202-G05-C-00 01-Jan-06 17,168,533<br />
3 HIV/AIDS 66,501,629 (G2) Gov: MOH SAF-304-G04-H 01-Sep-04 62,190,178<br />
6 HIV/AIDS 55,071,906 (G1) Gov: MOH SAF-607-G06-H 01-Jan-08 34,982,161<br />
9 HIV/AIDS 42,577,518 (B1)<br />
SWAzILAND 2 HIV/AIDS 49,276,920 (G2) Gov: Oth SWZ-202-G01-H-00 01-Aug-03 47,878,166<br />
2 Malaria 1,478,928 (G2) Gov: Oth SWZ-202-G02-M-00 01-Sep-03 1,477,328<br />
3 TB 2,506,000 (G2) Gov: Oth SWZ-304-G03-T 01-Jan-05 2,232,681<br />
4 HIV/AIDS 45,839,731 (G2) Gov: Oth SWZ-405-G04-H 01-Oct-05 19,310,179<br />
7 HIV/AIDS 28,380,316 (G1) Gov: Oth SWZ-708-G05-H 01-Jan-09 5,507,827<br />
8 HIV/AIDS 7,173,715 (G1) Gov: Oth SWZ-809-G08-S 3,473,013<br />
8 Malaria 5,051,555 (G1) Gov: Oth SWZ-809-G06-M 01-Jul-09 2,561,700<br />
8 TB 4,163,873 (G1) Gov: Oth SWZ-809-G07-T 01-Jan-10 970,176<br />
zAMBIA 1 HIV/AIDS 90,325,778 (M) Gov: MOH ZAM-102-G01-H-00, (G2) 25-Jul-03 35,757,291<br />
CS/PS: FBO ZAM-102-G04-H-00, (G2) 25-Jul-03 22,840,611<br />
Gov: MOF ZAM-102-G07-H-00, (B2) 01-Mar-05 3,057,134<br />
CS/PS: NGO ZAM-102-G08-H-00, (G2) 25-Jul-03 20,204,481<br />
1 Malaria 39,273,800 (G2) Gov: MOH ZAM-102-G02-M-00 15-Aug-03 35,291,300
APPROVED PROPOSALS GRANT AGREEMENTS DISBURSEMENTS<br />
COUNTRY OR TERRITORY 2<br />
ROUND<br />
DISEASE<br />
COMPONENT<br />
APPROVED<br />
GRANT AMOUNT<br />
PRINCIPAL<br />
(US$) 3 STATUS 3 RECIPIENT TYPE 4<br />
GRANT NUMBER<br />
PROGRAM START<br />
DATE<br />
Zambia (CONT.) CS/PS: FBO ZAM-102-G05-M-00 01-Aug-03 3,382,491<br />
1 TB 47,337,256 (G2) Gov: MOH ZAM-102-G03-T-00 25-Jul-03 18,354,137<br />
CS/PS: FBO ZAM-102-G06-T-00 25-Jul-03 10,364,690<br />
CS/PS: NGO ZAM-102-G15-T-00 01-Dec-05 1,164,676<br />
4 HIV/AIDS 236,318,738 (G2) Gov: MOH ZAM-405-G09-H 01-Nov-05 41,073,687<br />
CS/PS: FBO ZAM-405-G10-H 01-Jul-05 59,751,973<br />
CS/PS: NGO ZAM-405-G11-H 01-Jul-05 19,878,049<br />
Gov: MOF ZAM-405-G12-H 01-Oct-05 7,570,956<br />
4 Malaria 42,721,807 (G2) Gov: MOH ZAM-405-G13-M 01-Nov-05 17,466,449<br />
CS/PS: FBO ZAM-405-G14-M 01-Jul-05 10,956,384<br />
7 Malaria 17,715,924 (G1) Gov: MOH ZAM-708-G17-M 01-Jul-08<br />
CS/PS: FBO ZAM-708-G19-M 01-Jul-08 3,443,251<br />
7 TB 3,882,948 (G1) Gov: MOH ZAM-708-G16-T 01-Jul-08<br />
TOTAL AMOUNT<br />
DISBURSED (US$)<br />
CS/PS: FBO ZAM-708-G18-T 01-Jul-08 1,518,189<br />
CS/PS: NGO ZAM-708-G20-T 01-Jul-08 613,668<br />
8 HIV/AIDS 129,368,645 (T1) CS/PS: FBO ZAM-809-G21-H 01-Oct-09 11,488,454<br />
CS/PS: NGO ZAM-809-G22-H 01-Dec-09 741,161<br />
Gov: MOF ZAM-809-G23-H 2,949,150<br />
121 THE GLOBAL FUND <strong>2010</strong>: INNOVATION AND IMPACT ANNexes INtrODuctiON<br />
zIMBABWE 1 HIV/AIDS 14,100,000 (M) MO: UNDP ZIM-102-G01-H-00, (B2) 01-May-05 6,312,533<br />
Gov: Oth ZIM-102-G07-H, (G2) 01-Nov-07 4,836,910<br />
1 Malaria 8,559,911 (G2) Gov: MOH ZIM-102-G02-M-00 01-Aug-04 8,250,984<br />
5 HIV/AIDS 35,931,159 (G1) Gov: Oth ZIM-506-G03-H 01-Aug-07 13,663,668<br />
CS/PS: FBO ZIM-506-G04-H 01-Jun-07 1,292,404<br />
MO: UNDP ZIM-509-G10-H 01-Aug-09 20,440,040<br />
5 Malaria 20,121,670 (G1) Gov: MOH ZIM-506-G06-M (Closed: consolidated<br />
with ZIM-509-G09-M)<br />
01-Oct-07 7,956,505<br />
MO: UNDP ZIM-509-G09-M 01-Aug-09 11,784,474<br />
5 TB 9,230,076 (G1) CS/PS: FBO ZIM-506-G05-T (Closed: consolidated<br />
with ZIM-509-G08-T)<br />
01-Sep-07 3,410,626<br />
MO: UNDP ZIM-509-G08-T 01-Aug-09 5,694,529<br />
8 HIV/AIDS 84,641,215 (G1) MO: UNDP ZIM-809-G11-H 01-Nov-09 20,053,712<br />
8 Malaria 67,081,814 (G1) MO: UNDP ZIM-809-G13-M 01-Nov-09 20,319,314<br />
MO: UNDP ZIM-809-G14-S 01-Nov-09 2,093,308<br />
8 TB 28,236,113 (G1) MO: UNDP ZIM-809-G12-T 01-Nov-09 11,260,969<br />
REGION TOTALS: 2,915,326,027 1,511,667,308<br />
REGION: SUB-SAHARAN AFRICA: WEST AND CENTRAL AFRICA<br />
BENIN 1 Malaria 2,973,150 (G2) MO: UNDP BEN-102-G01-M-00 01-May-03 2,955,032<br />
2 HIV/AIDS 17,324,228 (G2) MO: UNDP BEN-202-G03-H-00 25-Jul-03 16,729,577<br />
2 TB 3,104,104 (G2) MO: UNDP BEN-202-G02-T-00 01-Nov-03 3,095,158<br />
3 Malaria 68,448,335 (T3) CS/PS: NGO BEN-304-G04-M 01-Nov-04 2,422,783<br />
5 HIV/AIDS 54,015,572 (G2) Gov: MOH BEN-506-G05-H 01-Jan-07 21,766,442<br />
6 TB 10,102,793 (G2) Gov: MOH BEN-607-G06-T 01-Jun-07 5,716,089<br />
7 Malaria 12,433,054 (G1) CS/PS: FBO BEN-708-G07-M 01-Jul-08 5,969,467<br />
9 HIV/AIDS 69,189,310 (B1)<br />
9 TB 4,032,731 (B1)<br />
BURKINA FASO 2 HIV/AIDS 16,417,522 (M) MO: UNDP BUR-202-G02-H-00, (B2) 01-Dec-03 8,789,010<br />
Gov: MOH BUR-202-G04-H-00, (G2) 01-Oct-06 5,487,521<br />
2 Malaria 7,499,988 (G1) MO: UNDP BUR-202-G01-M-00 (Inactive) 01-Dec-03 6,812,492<br />
4 TB 16,984,217 (M) MO: UNDP BUR-404-G03-T, (B2) 01-Jan-05 5,492,614<br />
Gov: MOH BUR-407-G05-T, (G2) 01-Jun-07 10,685,907<br />
6 HIV/AIDS 57,694,161 (B2) Gov: Oth BUR-607-G06-H 01-Oct-07 27,016,544<br />
7 Malaria 17,066,985 (G1) Gov: Oth BUR-708-G07-M 01-May-08 16,595,227
APPROVED PROPOSALS GRANT AGREEMENTS DISBURSEMENTS<br />
COUNTRY OR TERRITORY 2<br />
ROUND<br />
DISEASE<br />
COMPONENT<br />
APPROVED<br />
GRANT AMOUNT<br />
PRINCIPAL<br />
(US$) 3 STATUS 3 RECIPIENT TYPE 4<br />
GRANT NUMBER<br />
PROGRAM START<br />
DATE<br />
TOTAL AMOUNT<br />
DISBURSED (US$)<br />
BURKINA FASO (CONT.) 8 Malaria 59,863,987 (G1) Gov: Oth BUR-809-G08-M 01-Sep-09 513,513<br />
8 TB 15,843,549 (T1)<br />
CS/PS: NGO BUR-809-G09-M 01-Sep-09 5,309,836<br />
CAMEROON 3 HIV/AIDS 74,233,620 (G2) Gov: MOH CMR-304-G01-H 01-Jan-05 55,500,617<br />
3 Malaria 31,781,187 (G2) Gov: MOH CMR-304-G02-M 01-Jan-05 29,881,464<br />
3 TB 5,804,961 (G2) Gov: MOH CMR-304-G03-T 01-Jan-05 5,478,819<br />
4 HIV/AIDS 16,194,089 (G2) CS/PS: NGO CMR-404-G04-H 01-Jan-05 15,915,458<br />
5 HIV/AIDS 14,893,203 (G2) Gov: MOH CMR-506-G05-H 01-Aug-06 6,555,456<br />
5 Malaria 15,161,103 (G2) Gov: MOH CMR-506-G06-M 01-Nov-06 6,543,795<br />
9 Malaria 111,499,268 (B1)<br />
9 TB 9,779,422 (B1)<br />
CAPE VERDE 8 HIV/AIDS 5,321,184 (T1)<br />
CENTRAL AFRICAN<br />
REPUBLIC<br />
2 HIV/AIDS 23,056,692 (G2) MO: UNDP CAF-202-G01-H-00 01-Oct-03 23,056,692<br />
4 HIV/AIDS 10,658,677 (G2) MO: UNDP CAF-404-G02-H (Closed: consolidated<br />
01-Jan-05 8,495,262<br />
with CAF-409-G06-H)<br />
Gov: MOH CAF-409-G06-H 1,515,742<br />
4 Malaria 16,663,897 (G2) MO: UNDP CAF-405-G04-M 01-May-05 12,671,585<br />
4 TB 4,217,417 (G2) MO: UNDP CAF-404-G03-T (Closed: consolidated<br />
01-Jan-05 3,111,176<br />
with CAF-409-G07-T)<br />
Gov: MOH CAF-409-G07-T 01-Jul-09 256,983<br />
7 HIV/AIDS 15,799,899 (G1) Gov: MOH CAF-708-G05-H 01-Jan-09 2,738,868<br />
8 Malaria 14,341,902 (T1)<br />
9 TB* 17,439,384 (B1)<br />
CONGO 5 HIV/AIDS 46,176,190 (G2) Gov: Oth COG-506-G01-H 01-Dec-06<br />
Gov: Oth COG-506-G01-H-e as above 14,254,161<br />
8 Malaria 36,248,707 (T1)<br />
8 TB 3,146,392 (T1)<br />
9 HIV/AIDS* 15,441,609 (B1)<br />
CôTE d’IVOIRE 2 HIV/AIDS 49,089,450 (G2) MO: UNDP CIV-202-G01-H-00 01-Dec-03 20,987,347<br />
CS/PS: NGO CIV-202-G05-H 01-Aug-07 18,929,673<br />
3 HIV/AIDS 1,023,534 (G1) CS/PS: NGO CIV-304-G02-H (Inactive) 01-Apr-04 1,023,467<br />
3 TB 3,830,107 (G2) MO: UNDP CIV-304-G03-T 01-Apr-04 3,742,346<br />
5 HIV/AIDS 4,031,886 (G1) CS/PS: NGO CIV-506-G04-H 01-Aug-06 4,013,260<br />
6 Malaria 10,335,083 (G1) CS/PS: NGO CIV-607-G06-M 01-Dec-07 9,447,380<br />
6 TB 3,514,025 (G1) Gov: MOH CIV-607-G07-T 01-Apr-08 3,099,523<br />
8 Malaria 146,846,570 (G1) CS/PS: NGO CIV-809-G08-M 9,927,880<br />
Gov: MOH CIV-809-G09-M 1,122,482<br />
9 HIV/AIDS 66,026,831 (B1)<br />
9 TB 13,863,245 (B1)<br />
EQUATORIAL GUINEA 4 HIV/AIDS 9,824,836 (G2) MO: UNDP GNQ-405-G01-H 01-Jul-05 5,782,477<br />
5 Malaria 23,074,306 (G2) CS/PS: NGO GNQ-506-G02-M 01-Oct-06 15,035,143<br />
GABON 3 HIV/AIDS 7,212,579 (G2) MO: UNDP GAB-304-G01-H (Closed: consolidated<br />
01-Oct-04 5,092,967<br />
with GAB-304-G01-H-e)<br />
MO: UNDP GAB-304-G01-H-e 01-Oct-04 1,797,515<br />
4 Malaria 8,616,322 (G2) MO: UNDP GAB-404-G02-M 01-Jan-05 8,616,322<br />
5 Malaria 14,502,832 (M) MO: UNDP GAB-506-G03-M, (B2) (Closed: 01-Aug-06 4,160,323<br />
consolidated with GAB-509-G04-<br />
M, (G2))<br />
Gov: MOH GAB-509-G04-M, (G2) 01-Apr-09 3,891,808<br />
8 HIV/AIDS 8,026,965 (G1) Gov: MOH GAB-809-G05-H 01-Jan-10 3,004,246
APPROVED PROPOSALS GRANT AGREEMENTS DISBURSEMENTS<br />
COUNTRY OR TERRITORY 2<br />
ROUND<br />
DISEASE<br />
COMPONENT<br />
APPROVED<br />
GRANT AMOUNT<br />
PRINCIPAL<br />
(US$) 3 STATUS 3 RECIPIENT TYPE 4<br />
GAMBIA 3 HIV/AIDS 14,568,678 (G2) Gov: Oth GMB-304-G01-H 01-Oct-04 14,563,907<br />
3 Malaria 27,956,725 (T3) Gov: MOH GMB-304-G02-M 01-Oct-04 14,794,704<br />
5 TB 5,032,929 (G2) Gov: MOH GMB-506-G03-T 01-Jun-06 4,036,797<br />
6 Malaria 18,060,099 (G2) Gov: MOH GMB-607-G04-M 01-Jul-07 11,364,267<br />
8 HIV/AIDS 18,652,235 (G1) Gov: Oth GMB-809-G05-H 01-Jan-10 2,731,690<br />
9 Malaria 10,611,436 (B1)<br />
9 TB* 8,049,144 (B1)<br />
GRANT NUMBER<br />
PROGRAM START<br />
DATE<br />
TOTAL AMOUNT<br />
DISBURSED (US$)<br />
CS/PS: NGO GMB-809-G06-H 01-Dec-09 1,428,999<br />
GHANA 1 HIV/AIDS 14,170,222 (G2) Gov: MOH GHN-102-G01-H-00 01-Jan-03 14,170,222<br />
1 TB 5,687,055 (G2) Gov: MOH GHN-102-G02-T-00 01-Jan-03 5,685,493<br />
2 Malaria 8,849,491 (G2) Gov: MOH GHN-202-G03-M-00 01-Sep-03 8,849,491<br />
4 Malaria 108,489,987 (G3) Gov: MOH GHN-405-G04-M 01-Mar-05 57,250,961<br />
5 HIV/AIDS 97,098,678 (G2) Gov: MOH GHN-506-G06-H 01-May-06 68,157,258<br />
5 TB 31,471,784 (G2) Gov: MOH GHN-506-G05-T 01-May-06 24,238,637<br />
8 HIV/AIDS 49,350,970 (G1) CS/PS: NGO GHN-809-G09-H 1,479,958<br />
CS/PS: NGO GHN-809-G10-H 1,212,528<br />
Gov: MOH GHN-809-G11-H 16,278,881<br />
GHN-809-G12-H 6,419,944<br />
8 Malaria 39,639,117 (M) Gov: MOH GHN-809-G07-M 2,288,504<br />
CS/PS: NGO GHN-809-G08-M 6,395,068<br />
123 THE GLOBAL FUND <strong>2010</strong>: INNOVATION AND IMPACT ANNexes INtrODuctiON<br />
GUINEA 2 HIV/AIDS 9,651,105 (G2) Gov: MOH GIN-202-G01-H-00 01-Apr-04 5,236,707<br />
2 Malaria 6,893,509 (B2) Gov: MOH GIN-202-G02-M-00 01-Apr-04 5,125,461<br />
5 TB 6,782,980 (G2) Gov: MOH GIN-506-G03-T 01-Feb-07 4,041,512<br />
6 HIV/AIDS 4,585,405 (G1) Gov: MOH GIN-607-G04-H 01-Jan-08 1,944,841<br />
6 Malaria 17,339,248 (G1) Gov: MOH GIN-607-G05-M 01-Jan-08 1,289,333<br />
9 TB 4,035,589 (B1)<br />
GUINEA-BISSAU 3 TB 2,564,139 (G2) MO: UNDP GNB-304-G01-T (Closed: consolidated<br />
01-Jul-04 1,927,068<br />
with GNB-309-G06-T)<br />
Gov: MOH GNB-309-G06-T 01-Jul-04 536,945<br />
4 HIV/AIDS 3,279,759 (G2) MO: UNDP GNB-404-G02-H (Closed: consolidated<br />
01-Nov-04 1,921,443<br />
with GNB-409-G07-H)<br />
Gov: MOH GNB-409-G07-H 01-Nov-04 1,114,970<br />
4 Malaria 3,080,328 (G2) MO: UNDP GNB-404-G03-M (Closed: consolidated<br />
01-Jan-05 2,120,329<br />
with GNB-409-G08-M)<br />
Gov: MOH GNB-409-G08-M 01-Jan-05 521,948<br />
6 Malaria 3,438,484 (G1) Gov: MOH GNB-607-G04-M 01-Dec-07 2,671,727<br />
7 HIV/AIDS 13,182,390 (G1) Gov: Oth GNB-708-G05-H 01-Feb-09 3,551,769<br />
8 TB 853,794 (T1)<br />
9 Malaria 8,807,759 (B1)<br />
9 TB* 10,290,379 (B1)<br />
LIBERIA 2 HIV/AIDS 7,658,187 (G1) MO: UNDP LBR-202-G01-H-00 01-Dec-04 7,429,767<br />
2 TB 4,534,017 (G1) MO: UNDP LBR-202-G02-T-00 01-Dec-04 4,298,100<br />
3 Malaria 12,140,921 (G1) MO: UNDP LBR-304-G03-M 01-Dec-04 11,876,058<br />
6 HIV/AIDS 31,147,984 (B2) MO: UNDP LBR-607-G04-H 01-Jun-07 16,803,439<br />
7 Malaria 12,695,907 (G1) MO: UNDP LBR-708-G05-M 01-Jun-08 9,474,118<br />
7 TB 6,408,872 (G1) MO: UNDP LBR-708-G06-T 01-Jun-08 5,241,612<br />
8 HIV/AIDS 19,686,666 (T1)<br />
MULTICOUNTRY AFRICA<br />
(WEST AFRICA<br />
CORRIDOR PROGRAM)<br />
6 HIV/AIDS 19,092,500 (G1) CS/PS: NGO MAW-607-G01-H 01-Sep-07 17,749,112<br />
NIGERIA 1 HIV/AIDS 6,770,276 (B2) Gov: Oth NGA-102-G01-H-00 (Inactive) 01-Jan-04 6,770,276<br />
1 HIV/AIDS 1,687,599 (G1) CS/PS: NGO NGA-102-G02-H-00 (Inactive) 01-Dec-03 816,305
APPROVED PROPOSALS GRANT AGREEMENTS DISBURSEMENTS<br />
COUNTRY OR TERRITORY 2<br />
ROUND<br />
DISEASE<br />
COMPONENT<br />
APPROVED<br />
GRANT AMOUNT<br />
PRINCIPAL<br />
(US$) 3 STATUS 3 RECIPIENT TYPE 4<br />
GRANT NUMBER<br />
PROGRAM START<br />
DATE<br />
TOTAL AMOUNT<br />
DISBURSED (US$)<br />
NIGERIA (CONT.) 1 HIV/AIDS 12,948,323 (B2) Gov: Oth NGA-102-G03-H-00 (Inactive) 01-Jan-04 12,948,323<br />
2 Malaria 20,994,149 (B2) CS/PS: NGO NGA-202-G04-M-00 01-Dec-04 20,241,784<br />
4 Malaria 74,542,287 (G2) CS/PS: NGO NGA-404-G05-M 01-Jan-05 38,481,707<br />
CS/PS: NGO NGA-407-G10-M 01-Jan-08 25,670,295<br />
5 HIV/AIDS 161,179,839 (G2) Gov: Oth NGA-506-G07-H 01-Jan-07 72,699,420<br />
CS/PS: NGO NGA-506-G08-H 01-Jan-07 12,560,992<br />
CS/PS: NGO NGA-506-G09-H 01-Jan-07 15,378,638<br />
5 TB 63,740,481 (M) CS/PS: FBO NGA-506-G06-T, (B2) 01-Jan-07 23,932,485<br />
CS/PS: NGO NGA-509-G15-T, (G2) 01-Oct-09 7,721,243<br />
8 HIV/AIDS 55,379,935 (G1) Gov: Oth NGA-809-G12-S 01-Nov-09 20,975,288<br />
8 Malaria 284,906,626 (G1) CS/PS: NGO NGA-809-G11-M 01-Aug-09 48,402,067<br />
CS/PS: NGO NGA-809-G13-M 01-Nov-09 85,580,403<br />
Gov: MOH NGA-809-G14-M 01-Nov-09 78,066,740<br />
9 HIV/AIDS 61,980,496 (B1)<br />
9 TB* 31,515,160 (B1)<br />
SAO TOME AND<br />
PRINCIPE<br />
4 Malaria 3,484,859 (G2) MO: UNDP STP-405-G01-M 01-Mar-05 3,024,212<br />
5 HIV/AIDS 1,370,682 (G2) MO: UNDP STP-506-G02-H 01-Oct-06 854,715<br />
7 Malaria 4,118,449 (G1) MO: UNDP STP-708-G03-M 01-Nov-08 1,756,733<br />
8 TB 1,015,080 (G1) MO: UNDP STP-809-G04-T 01-Dec-09 431,990<br />
SENEGAL 1 HIV/AIDS 11,714,285 (G2) Gov: Oth SNG-102-G01-H-00 01-Apr-03 8,748,915<br />
CS/PS: NGO SNG-102-G04-H-00 01-Apr-06 2,906,326<br />
1 Malaria 4,285,714 (B2) Gov: MOH SNG-102-G02-M-00 (Inactive) 01-Apr-03 1,526,770<br />
4 Malaria 28,778,260 (G2) Gov: MOH SNG-405-G03-M 01-Sep-05 23,697,528<br />
6 HIV/AIDS 31,156,807 (G2) Gov: Oth SNG-607-G05-H 01-Jun-07 10,455,345<br />
CS/PS: NGO SNG-607-G06-H 01-Jun-07 6,013,806<br />
7 Malaria 28,052,446 (G1) Gov: MOH SNG-708-G07-M 01-Jun-08 17,107,808<br />
7 TB 4,204,328 (G1) Gov: MOH SNG-708-G08-T 01-Nov-08 3,589,818<br />
9 HIV/AIDS 41,745,532 (B1)<br />
SIERRA LEONE 2 TB 5,030,837 (G2) CS/PS: NGO SLE-202-G01-T-00 01-Jan-04 5,030,837<br />
4 HIV/AIDS 17,820,803 (G2) Gov: Oth SLE-405-G02-H 01-Jun-05 14,759,969<br />
4 Malaria 8,886,123 (G1) CS/PS: NGO SLE-405-G03-M 01-May-05 6,956,097<br />
6 HIV/AIDS 9,627,778 (G1) Gov: Oth SLE-607-G04-H 01-Feb-08 8,850,975<br />
7 Malaria 10,011,250 (G1) Gov: MOH SLE-708-G05-M 01-May-08 7,634,749<br />
7 TB 4,336,448 (G1) Gov: MOH SLE-708-G06-T 01-Nov-08 1,890,238<br />
9 HIV/AIDS 35,159,372 (B1)<br />
TOGO 2 HIV/AIDS 15,455,477 (B2) MO: UNDP TGO-202-G01-H-00 01-Oct-03 14,088,308<br />
3 Malaria 5,885,906 (G2) MO: UNDP TGO-304-G02-M 01-May-04 5,856,835<br />
3 TB 1,801,888 (G2) MO: UNDP TGO-304-G03-T 01-May-04 1,801,888<br />
4 HIV/AIDS 30,559,938 (G2) CS/PS: NGO TGO-405-G04-H 01-Apr-05 28,098,692<br />
4 Malaria 10,694,981 (G2) MO: UNDP TGO-405-G05-M 01-Oct-05 10,267,246<br />
6 Malaria 9,303,058 (B2) MO: UNDP TGO-607-G06-M 01-Jan-08 5,724,295<br />
6 TB 5,920,602 (B2) MO: UNDP TGO-607-G07-T 01-Jan-08 2,679,816<br />
8 HIV/AIDS 39,659,262 (G1) Gov: MOH TGO-809-G08-H 01-Dec-09 6,419,308<br />
CS/PS: NGO TGO-809-G09-H 01-Dec-09 2,883,854<br />
9 Malaria 58,931,815 (B1)<br />
REGION TOTALS: 3,161,166,679 1,490,534,055<br />
GRAND TOTALS: 19,233,118,278 9,968,837,895
SPECIAL NOTES FOR ROUND 9 (INCLUDING NATIONAL STRATEGY APPLICATIONS, FIRST LEARNING WAVE [N1]):<br />
- All Category 1, 2 and 2B components have been approved by the Board, in principle.<br />
- Those currently approved for funding are: all Category 1 and all Category 2<br />
- Category 2B proposals (those currently marked with an asterisk [“*”]), will be presented to the Board for funding approval, according to the comprehensive funding policy<br />
and as / when funding becomes available<br />
SPECIAL NOTES FOR ROUND 8 AND ROUND 9 (INCLUDING NATIONAL STRATEGY APPLICATIONS, FIRST LEARNING WAVE [N1]):<br />
- Phase 1 funding: the Board approved a total upper ceiling of US$ 2.75 billion for Round 8 and US$ 2.38 billion for Round 9 (including US$ 390 million for National Strategy Applications).<br />
The <strong>Global</strong> <strong>Fund</strong> Secretariat will be working with countries to find efficiencies in all proposals to bring the total approved funding for these rounds at or below these ceiling amounts.<br />
NOTES<br />
1 It is recommended that full information on country proposals, grant agreements and latest disbursements be viewed at www.theglobalfund.org<br />
2 Country or territory:<br />
- The Multicountry Africa region includes: Mozambique, South Africa and Swaziland<br />
- The Multicountry Western Pacific region includes: Cook Islands, Fiji, Micronesia (Federated States), Kiribati, Niue, Marshall Islands, Palau, Samoa, Solomon Islands, Tonga,<br />
Tuvalu and Vanuatu<br />
- The Multicountry Americas (Andean) region includes: Colombia, Ecuador, Peru and Venezuela<br />
- The Multicountry Americas (CARICOM) region includes: Antigua and Barbuda, Bahamas, Barbados, Belize, Dominica, Dominican Republic, Grenada, Guyana, Haiti, Jamaica, Saint Kitts and Nevis,<br />
Saint Lucia, Saint Vincent and Grenadines, Suriname and Trinidad and Tobago<br />
- The Multicountry Americas (CRN+) region includes: Antigua and Barbuda, Dominican Republic, Grenada, Guyana, Haiti, Jamaica, Saint Kitts and Nevis, Saint Lucia, Saint Vincent and Grenadines,<br />
Suriname, and Trinidad and Tobago<br />
- The Multicountry Americas (Meso) region includes: Belize, Costa Rica, El Salvador, Guatemala, Honduras, Nicaragua and Panama<br />
- The Multicountry Americas (OECS) region includes: Antigua and Barbuda, Dominica, Grenada, Saint Kitts and Nevis, Saint Lucia and Saint Vincent and Grenadines<br />
3 Status of Approved Grant Amount:<br />
(B1) = Board-approved upper limit, pending TRP clarifications and grant negotiations (Phase 1)<br />
(T1) = After TRP clarifications, pending grant negotiations (Phase 1)<br />
(G1) = Per grant agreement (Phase 1)<br />
(B2) = Board-approved upper limit, pending grant negotiations (including Phase 2)<br />
(G2) = Per grant agreement (including Phase 2)<br />
(B3) = Board-approved upper limit, pending TRP clarifications and grant negotiations (RCC 1)<br />
(T3) = After TRP clarifications, pending grant negotiations (RCC 1)<br />
(G3) = Per grant agreement (including RCC 1)<br />
(M) = Multiple-grant component with different budget status (see under grant number)<br />
Re: approved grant funding for Round 8, please see Special Notes for Round 8 above<br />
4 PR Type (abbreviations):<br />
- Civil Society / Private Sector: CS/PS: FBO (Faith-Based Organization), CS/PS: NGO (Nongovernmental Organization), CS/PS: Oth (Other), CS/PS: PS (Private Sector)<br />
- Government: Gov: MOH (Ministry of Health), Gov: MOF (Ministry of Finance), Gov: Oth (Other)<br />
- Multilateral Organization: MO: UNDP (United Nations Development Programme), MO: Oth (Other)<br />
5 N1 is a pilot round for the National Strategy Application, for more information see http://www.theglobalfund.org/documents/publications/other/Strategy/Innovate.pdf.<br />
125 THE GLOBAL FUND <strong>2010</strong>: INNOVATION AND IMPACT ANNexes INtrODuctiON<br />
GENERAL NOTES<br />
Section Headings:<br />
- Approved Proposals: includes all proposal amounts approved by the Board<br />
- Grant Agreements: includes all amounts related to signed grants (re: grants signed by both the PR and The <strong>Global</strong> <strong>Fund</strong> Secretariat)<br />
- Disbursements: includes all disbursemements made (where instructions to disburse have been sent to the Trustee )<br />
Euro grants:<br />
- For Rounds 1 – 4, only the Phase 2 portion of grants are eligible for denomination in euro<br />
- For Round 5 onwards, both Phase 1 and Phase 2 portions of grants are eligible for denomination in euro<br />
- The US$ equivalent of a euro disbursement is initially calculated using the latest month-end exchange rate from OANDA.com and is replaced by the actual US$ equivalent on the<br />
date of disbursement, once confirmed by the Trustee.<br />
- The US$ equivalent of a euro grant comprises the sum of disbursements made (valued in US$ on the date of transfer from the Trustee), plus the undisbursed portion of the grant<br />
calculated using the latest month-end exchange rate from OANDA.com.
Programmatic data are based on information reported to the <strong>Global</strong> <strong>Fund</strong> by end 2009. Financial data are based on <strong>Global</strong> <strong>Fund</strong><br />
activities through 31 December 2009.<br />
ACKNOWLEDGEMENTS<br />
This report was written by (in alphabetical order) Eddie Addai, Rifat Atun, Parijat Baijal, Prerna Banati, Manjiri Bhawalkar,<br />
Matthew Blakley, C.K. George, Nina Ingenkamp, Ralf Jürgens, Itamar Katz, Ryuichi Komatsu, Eline L. Korenromp,<br />
Mary Ann Lansang, Jeffrey V. Lazarus, Donna Lee, Jon Lidén, Daniel Low-Beer, Estifanos Shargie, Musoke J. Sempala<br />
and Kirsi Viisainen.<br />
Valuable contributions and comments were provided by Youssouf Abdel-Jelil, Fareed Abdullah, Olusoji Adeyi,<br />
Mohamed Abdel Aziz, Youssouf Abdel-Jelil, Zero Akyol, Marlon Banda, Christoph Benn, Jamie Bridge, Stine Byberg, Natalie<br />
Cartwright, David Curry, Nadja Curth, Ange-Joël Djoman, Tarek Elshimi, David Hayward Evans, Robert Filipp, Joshua Galjour,<br />
Marion Hachmann-Gleixner, Ian Grubb, Sandra Irbe, Jami Johnson, Michel Kazatchkine, Maria Kirova, Priya Mannava,<br />
Richard Manning, Annick Manuel, Ombeni Mwerinde, John Puvimanasinghe, Carl Reddy, Wael Ben Romdhane, David Salinas,<br />
Andy Seale, Swarup Sarkar, George Shakarishvili, Claudia Shilumani, Lal Sadasivan Sreemathy, Andreas Tamberg,<br />
Ronald Tran-Ba-Huy, Marta Urrutxi, Urban Weber, David Winters and Michèle Young.<br />
The report was edited by Jeffrey V. Lazarus, Ralf Jürgens, Ryuichi Komatsu and Rifat Atun and copy-edited by Misha Hoekstra.<br />
The production team was headed by Liam McDowall and included Katherine Anderson, Vincent Becker, Beatrice Bernescut,<br />
Anna Brown, Javier Vico Morillo and Michèle Young.<br />
DISCLAIMERS<br />
The geographical designations employed in this publication do not represent or imply any opinion or judgment on the part<br />
of the <strong>Global</strong> <strong>Fund</strong> to Fight AIDS, Tuberculosis and Malaria on the legal status of any country, territory, city or area, on its<br />
governmental or state authorities, or on the delimitation of its frontiers or boundaries.<br />
The mention of specific companies or of certain manufacturers’ products does not imply that they are endorsed or<br />
recommended by the <strong>Global</strong> <strong>Fund</strong> in preference to others of a similar nature that are not mentioned.<br />
Inclusion of persons in photos should not be construed as indicating their health status.<br />
All rights reserved. This document may be freely reviewed, quoted, reproduced or translated, in part or in full, provided the<br />
source is acknowledged.<br />
The <strong>Global</strong> <strong>Fund</strong> accepts contributions from governments, corporations, foundations and individuals. To contribute, please visit<br />
our website or contact the External Relations team at info@theglobalfund.org . For more information and updates on the status<br />
of the <strong>Global</strong> <strong>Fund</strong>, visit www.theglobalfund.org.<br />
PHOTOGRAPHY<br />
Cover Kenya © Chris Steele-Perkins / Magnum Inside Front Cover India © Zack Canepari / Panos Pictures<br />
Page 3 Sierra Leone © Jenny Matthews / Panos Pictures Page 6 India © Atul Loke / Panos Pictures<br />
Page 9 Moldova © Giacomo Pirozzi / Panos Pictures Page 11 Tajikistan © The <strong>Global</strong> <strong>Fund</strong> / John Rae<br />
Page 12 Peru © The <strong>Global</strong> <strong>Fund</strong> / John Rae Page 28 Georgia © The <strong>Global</strong> <strong>Fund</strong> / John Rae Page 37 China<br />
© The <strong>Global</strong> <strong>Fund</strong> / Benjamin Bechet Page 42 Niger © The <strong>Global</strong> <strong>Fund</strong> / Benoist Carpentier Page 50 Cuba<br />
© The <strong>Global</strong> <strong>Fund</strong> / John Rae Page 56 Ethiopia © Jenny Matthews / Panos Pictures Page 59 India © The <strong>Global</strong><br />
<strong>Fund</strong> / John Rae Page 60 Nepal © The <strong>Global</strong> <strong>Fund</strong> / John Rae Page 64 Eritrea © The <strong>Global</strong> <strong>Fund</strong> / Didier Ruef<br />
Page 69 Paraguay © The <strong>Global</strong> <strong>Fund</strong> / John Rae Page 75 Rwanda © Dieter Tielemans / Panos Pictures<br />
Page 76 Nepal © The <strong>Global</strong> <strong>Fund</strong> / John Rae Page 81 Egypt © The <strong>Global</strong> <strong>Fund</strong> / John Rae Page 85 Jordan<br />
© The <strong>Global</strong> <strong>Fund</strong> / John Rae Page 89 Tanzania © Sean Sprague / Panos Pictures Page 90 China © The <strong>Global</strong><br />
<strong>Fund</strong> / John Rae Page 99 Vietnam © The <strong>Global</strong> <strong>Fund</strong> / John Rae Page 127 Tajikistan © The <strong>Global</strong> <strong>Fund</strong> /<br />
John Rae Inside Back Cover Nepal © The <strong>Global</strong> <strong>Fund</strong> / John Rae<br />
DESIGN<br />
ahoystudios.com<br />
ISBN 978-92-9224-206-0<br />
© The <strong>Global</strong> <strong>Fund</strong> to Fight AIDS, Tuberculosis and Malaria, <strong>2010</strong>
THIS FAMILY IN a MALARIA-ENDEMIC AREA OF TAJIkISTAN USED TO GET BITTEN BY<br />
MOSQUITOES BUT NOW TAke TEA IN THE GARDEN UNDER THEIR INSECTICIDE-TREATED<br />
NET. A GLOBAL FUND PROGRAM IS HELPING TO ELIMINATE MALARIA IN THE AREA<br />
WITH NETS, SPRAYING AND OTHER FORMS OF VECTOR CONTROL.
THE GLOBAL FUND <strong>2010</strong>: INNOVATION AND IMPACT<br />
The <strong>Global</strong> <strong>Fund</strong> to Fight AIDS, Tuberculosis and Malaria<br />
Chemin de Blandonnet 8<br />
1214 Vernier<br />
Geneva, Switzerland<br />
phone +41 58 22 791 1700<br />
fax +41 58 22 791 1701<br />
www.theglobalfund.org<br />
info@theglobalfund.org<br />
ISBN: 978-92-9224-206-0