Download - MSP Steel & Power Ltd.
Download - MSP Steel & Power Ltd.
Download - MSP Steel & Power Ltd.

Create successful ePaper yourself
Turn your PDF publications into a flip-book with our unique Google optimized e-Paper software.
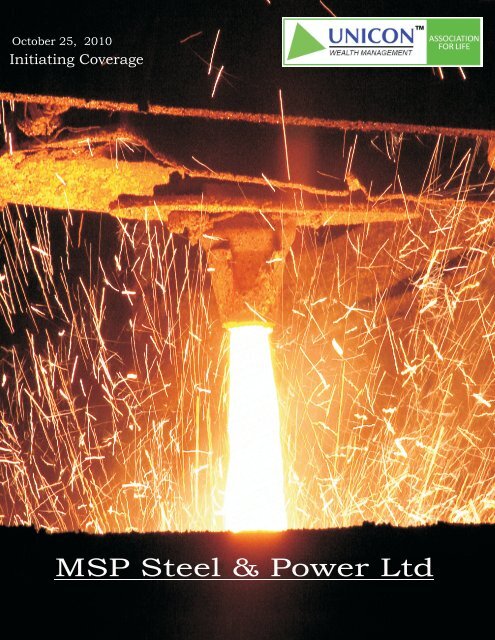
October 25, 2010<br />
Initiating Coverage<br />
<strong>MSP</strong> <strong>Steel</strong> & <strong>Power</strong> <strong>Ltd</strong>
Long Term Investment Call<br />
25-Oct-10<br />
<strong>MSP</strong> <strong>Steel</strong> & <strong>Power</strong> <strong>Ltd</strong><br />
<strong>MSP</strong> <strong>Steel</strong> & <strong>Power</strong> <strong>Ltd</strong><br />
Initiating Coverage<br />
Sector : <strong>Steel</strong><br />
CMP : 72 Target : 114 Rating : Buy<br />
<strong>MSP</strong> <strong>Steel</strong> and <strong>Power</strong> <strong>Ltd</strong> (<strong>MSP</strong>) is an integrated steel manufacturer having its plant at Jamgaon, Raigarh in Chattisgarh. It<br />
produces sponge iron and a range of long products such as billets, TMT, structurals (joints, beams, angles, channels and<br />
plates). The company also produces power for captive usage. <strong>MSP</strong> is the leading company in the <strong>MSP</strong> group and accounts for<br />
more than 1/3 rd of the group’s revenues.<br />
Key Data<br />
Face Value (INR) 10<br />
Share outstanding<br />
58100000<br />
Market cap (INR mn/USD bn)<br />
4160 / 94<br />
52 week High /low 80 / 25<br />
1 -year Average Volume<br />
CXN Nifty / Sensex<br />
Reuters Code<br />
Bloomberg code<br />
Year End<br />
545567<br />
6,106 / 20,303<br />
<strong>MSP</strong>O.BO<br />
<strong>MSP</strong>S IN<br />
March<br />
Investment highlights<br />
Capacity expansion to drive revenues<br />
<strong>MSP</strong> has undertaken a massive phase wise expansion plan to increase its<br />
pellets, sponge iron and power capacity by FY12. The expansion would<br />
drive revenues going forward and we expect its operating income to<br />
increase at a compounded annual growth rate (CAGR) of 36% till FY14.<br />
Key Financials FY09 FY10 FY11E FY12E<br />
Net Sales 3,989 3,887 5,831 8,164<br />
Growth(%) 10.6 (2.5) 50.0 40.0<br />
EBITDA 610 641 1,253 1,937<br />
Growth(%) (9.0) 5.1 95.5 54.5<br />
EBITDA margins (%) 15.3 16.5 21.5 23.7<br />
Net Profit 399 321 342 547<br />
Growth(%) (14.5) (19.6) 6.8 59.7<br />
Net Profit margins (%) 10.0 8.2 5.9 6.7<br />
Adj. EPS 6.9 5.5 5.9 9.4<br />
Growth(%) (14.5) (19.6) 6.8 59.7<br />
Key Ratio FY09 FY10 FY11E FY12E<br />
P/E (x) 10.4 13.0 12.2 7.6<br />
DE (x) 1.6 2.1 1.7 2.1<br />
ROCE (%) 15.5 8.6 10.5 11.9<br />
P/BV (x) 2.5 2.1 1.8 1.4<br />
EV/ EBITDA (x) 8.9 11.0 13.1 7.8<br />
Shareholding Pattern (%)<br />
INR mn<br />
Backward Integration to strengthen margins<br />
<strong>MSP</strong> is currently focusing on backward integration initiatives and post the<br />
expansion it will have a presence across the entire value chain. It will be an<br />
integrated player right from mining its own iron ore and coal to<br />
manufacturing pellets to producing value added steel products. This will<br />
result in an increase in its margins gradually from 16.5% in FY10 to 25.3%<br />
in FY14.<br />
Pelletisation to lower cost of production<br />
<strong>MSP</strong> has setup a pellet plant at Raigarh with a 300,000 MTPA capacity and<br />
plans to increase it to 900,000 MTPA by FY12. This will significantly lower<br />
the cost of production and will save INR 2500 / tonne in raw material costs.<br />
<strong>Power</strong> to add to revenues<br />
Others<br />
28%<br />
Promoters<br />
72%<br />
<strong>MSP</strong>’s installed power generation capacity is expected to increase to 76MW<br />
by FY12 enabling the company to sell excess power units which will add to<br />
its revenues.<br />
1<br />
Relative Price Performance<br />
80<br />
70<br />
60<br />
50<br />
40<br />
30<br />
20<br />
10<br />
0<br />
<strong>MSP</strong><br />
Oct Dec Feb Apr Jun Aug<br />
Source: Bloomberg, Unicon Research<br />
NIFTY<br />
Unicon Wealth Management<br />
www.uniconindia.in<br />
Valuation<br />
Stock is currently trading at FY11E & FY12E P/E multiple of 12.2x & 7.6x and<br />
Price/Sales multiple of 1.1x & 0.7x, which appears fairly attractive<br />
considering the strong growth and improving margins. We have used the<br />
discounted cash flow (DCF) method to value <strong>MSP</strong> due to the huge capex<br />
plan, the benefits of which would accrue over a longer period. Our valuation<br />
suggests Sep’11 target price of INR 114 based on a discount rate of 11.8%<br />
and a terminal growth of 2%. The target price implies a potential upside of<br />
59% from current levels. We initiate coverage with a BUY recommendation.<br />
Rahul Dholam | rdholam@uniconindia.in
<strong>MSP</strong> <strong>Steel</strong> & <strong>Power</strong> <strong>Ltd</strong><br />
CONTENTS<br />
Particulars Page<br />
Company Description & Business Model 3<br />
<strong>MSP</strong> Group & Promoter Profile 4<br />
Industry Outlook 5<br />
Investment Highlights 6<br />
• Capacity Expansion to drive revenues 6<br />
• Backward Integration to strengthen margins 7<br />
• Pelletisation to lower cost of production 8<br />
• Locational Advantages 8<br />
• <strong>Power</strong> to add to revenues 9<br />
Concerns 10<br />
Financial Outlook 10<br />
Peer comparison 11<br />
Valuation & PE Band 11<br />
Financial Summary 12<br />
2<br />
Unicon Wealth Management<br />
www.uniconindia.in
<strong>MSP</strong> <strong>Steel</strong> & <strong>Power</strong> <strong>Ltd</strong><br />
Company Description<br />
<strong>MSP</strong> <strong>Steel</strong> and <strong>Power</strong> <strong>Ltd</strong> (<strong>MSP</strong>) is an integrated steel manufacturer having its plant at<br />
Jamgaon, Raigarh in Chattisgarh. It produces sponge iron and a range of long products<br />
such as billets, TMT, structurals (joints, beams, angles, channels and plates). The<br />
company also produces power for captive usage. <strong>MSP</strong> is the leading company in the<br />
<strong>MSP</strong> group and accounts for more than 1/3 rd of the group’s revenues.<br />
Sponge Iron<br />
Iron Ore Pallets<br />
Mild <strong>Steel</strong> Billets<br />
Construction Bars (TMT)<br />
Heavy Structural Sections<br />
Coal Washery<br />
<strong>Power</strong><br />
Railway Siding<br />
Installed Capacity<br />
300,000 tpa<br />
192,000 tpa<br />
144,109 tpa<br />
80,000 tpa<br />
128,000 tpa<br />
345,600 tpa<br />
24 MW<br />
2.4 km<br />
Source: Company<br />
Business Model<br />
RAW COAL<br />
LOW GRADE IRON ORE FINES<br />
COAL WASHERY<br />
ORE BENEFICATION PLANT<br />
PELLET PLANT<br />
MIDDLING FINES<br />
WASH COAL<br />
IRON PELLET<br />
CAPTIVE POWER PLANT<br />
WASTE GASES<br />
SPONGE IRON PLANT<br />
SPONGE IRON<br />
GENERATION OF<br />
ELECTRICITY FOR<br />
CAPTIVE USE<br />
STEEL MELTING SHOP<br />
MILD STEEL BILLETS / BLOOMS<br />
BAR MILL<br />
TMT BARS<br />
STRUCTURAL<br />
MILL<br />
ANGLE,<br />
CHANNELS,<br />
BEAMS ETC.<br />
3<br />
Unicon Wealth Management<br />
www.uniconindia.in
<strong>MSP</strong> <strong>Steel</strong> & <strong>Power</strong> <strong>Ltd</strong><br />
<strong>MSP</strong> Group<br />
Integrated steel manufacturer with<br />
strong promoter background<br />
<strong>MSP</strong> Group is a well-known steel manufacturer in the secondary sector in the<br />
eastern India. The group has multiplied its business operations in terms of sales<br />
and production by setting up different projects in the steel sector and industrial<br />
oxygen gases in the state of West Bengal, Orissa, Andhra Pradesh, Chattisgarh and<br />
Jharkhand. The group turnover was in excess of INR 12 bn for the year ended<br />
March 2010.<br />
Promoter Profiles<br />
The promoters are first generation entrepreneurs with decades of experience in the<br />
steel making business. They are ably supported by the second generation who are<br />
well qualified and experienced to scale up the business.<br />
Mr. Puran Mal Agrawal<br />
Chairman & Wholetime<br />
Director<br />
Mr. Suresh Kumar Agrawal<br />
Managing Director<br />
Mr. Saket Agrawal<br />
Director<br />
Mr. Manish Agrawal<br />
Director<br />
Mr. Puran Mal Agrawal has been engaged in the business of <strong>Steel</strong> and Industrial Oxygen Gas<br />
manufacturing for the past 30 years. He is a graduate in Commerce and has been continuously<br />
providing commercial direction to the efforts of the group. He has been instrumental in<br />
formulating the strategies and streamlining finances of the group efficiently, thereby providing an<br />
appropriate synergy to the group.<br />
Mr. Suresh Kumar Agrawal is a qualified Mechanical Engineer from Jabalpur University and has<br />
been engaged in the steel business for the past 25 years. Furthermore he has had hands-on<br />
experience on the factory floor since the age of 16. As a result of numerous years of exposure in<br />
the industry he has been able to render his technical acumen in ensuring high quality in products<br />
and optimal utilisation of machines.<br />
Mr. Saket Agrawal, is a commerce graduate and gold medallist management graduate from<br />
International Management Institute, Delhi. He is a dynamic young entrepreneur focussed entirely<br />
in the implementation of the project that is expected to spearhead the expansion plans of the<br />
Group.<br />
Mr. Manish Agrawal is a commerce graduate and holds a Masters Degree in Business<br />
Administration with specialisation in Marketing from International Management Institute, Delhi.<br />
He is responsible for marketing of products in the existing markets and for developing new<br />
markets.<br />
4<br />
Unicon Wealth Management<br />
www.uniconindia.in
<strong>MSP</strong> <strong>Steel</strong> & <strong>Power</strong> <strong>Ltd</strong><br />
<strong>Steel</strong> Industry<br />
Current per capita consumption of steel<br />
at around 49 kgs in India compared to a<br />
world average of 200 kgs<br />
India is now the fifth-largest producer of steel in the world, behind China, Japan,<br />
Russia and the United States. The Indian steel industry is poised for massive<br />
expansion on the back of strong demand from the construction, capital goods and<br />
automobile sectors, which together account for ~85% of the total domestic demand.<br />
The current per capita consumption of steel at around 49 kgs is very low compared<br />
to 100 kg in Brazil, 250 kg in China and a global average of 198 kg. The wide gap in<br />
relative steel consumption indicates that the potential ahead for India to raise its<br />
steel consumption is high.<br />
We expect demand for steel in India to<br />
grow at around 7-8% against the global<br />
average of 5%.<br />
India’s steel capacity is expected to increase to more than 120MT in the next 3-4<br />
years and has targeted 293MT by 2020. Investments worth USD 176.5 billion are<br />
expected in the sector by 2020. <strong>Steel</strong> consumption will continue to grow at nearly<br />
12% annually, till 2012, fuelled by demand for construction projects and<br />
automobiles. Over the longer term, we expect demand for steel in India to grow at<br />
around 7-8% against the global average of 5%.<br />
We expect long steel prices to improve<br />
from USD 540/ tonne to USD 600 – 620 /<br />
tonne in FY11 and 650-670 / tonne in<br />
FY12<br />
While the rise in domestic demand is a key driver, a reduction in exports from<br />
China is also playing a big role. Chinese steel production has been hampered on<br />
account of the forced shutdowns of mills in some regions due to environmental<br />
concerns and high electricity costs.<br />
Lower exports from China have resulted in Indian players increasing prices recently.<br />
Due to strong domestic demand for steel, we expect steel prices to remain<br />
firm. We believe long steel prices would increase to USD 600 – 620 / tonne in FY11<br />
and 650-670 / tonne in FY12 compared to USD 540 in FY10. Slow demand in China<br />
and the western world would also curtail the uptrend in raw material prices in<br />
the future. This is positive for <strong>MSP</strong> and we expect its margins to improve significantly<br />
over the next few years.<br />
5<br />
Unicon Wealth Management<br />
www.uniconindia.in
<strong>MSP</strong> <strong>Steel</strong> & <strong>Power</strong> <strong>Ltd</strong><br />
Investment Highlights<br />
Capacity Expansion to drive revenues<br />
Planned expenditure of INR 8.14bn for<br />
phase wise capacity expansion<br />
<strong>MSP</strong> is well positioned to take advantage of the growing steel demand in the country<br />
and has undertaken a massive phase wise expansion plan to increase its pellets,<br />
sponge iron and power capacity by FY12.<br />
Expansion Plan Existing Phase I Phase II Total<br />
Pellet 300000 600000 900000<br />
Sponge Iron 192000 115500 115500 423000<br />
Coal Washery 345600 383525 729125<br />
Billets 144109 144109<br />
<strong>Power</strong> Plant (MW) 24 18 34 76<br />
TMT 80000 80000<br />
Structural 128000 128000<br />
Railway Sliding 2.4 4 6.4<br />
Source: Company<br />
The company will be investing a total of INR 8.14 billion by FY12 which would be<br />
funded through a mix of internal accruals, preference shares issued to the promoters<br />
and debt. It has tied up INR 5.45 billion term loan through a consortium of banks<br />
lead by State Bank of India, UCO and Corporation Bank.<br />
We expect <strong>MSP</strong>’s operating income to<br />
increase at a CAGR of 36% till FY14<br />
It has already invested INR 3.5 billion till August 31 st 2010 of which INR 2.5 billion<br />
has been in the form of debt and the balance in the form of preference capital. The<br />
capex light phase wise expansion plan will allow the company to utilise rising<br />
internal accruals thus reducing the financing costs. The expansion would drive<br />
revenues going forward and we expect its operating income to increase at a<br />
compounded annual growth rate (CAGR) of 36% till FY14.<br />
6<br />
Unicon Wealth Management<br />
www.uniconindia.in
<strong>MSP</strong> <strong>Steel</strong> & <strong>Power</strong> <strong>Ltd</strong><br />
Backward Integration to strengthen margins<br />
The backward integration initiatives<br />
will result in an increase in its margins<br />
to 25.3% by FY14.<br />
<strong>MSP</strong> is currently focusing on backward integration initiatives and post the<br />
expansion it will have a presence across the entire value chain. It will be an integrated<br />
player right from mining its own iron ore and coal to manufacturing pellets to<br />
producing value added steel products. This will result in an increase in its margins<br />
gradually from 16.5% in FY10 to 25.3% in FY14.<br />
As part of the backward integration initiative, the company is increasing its<br />
production capacity of sponge iron, pellets and power. <strong>MSP</strong> is also increasing the<br />
coal washing capacity to support increased usage of coal and modernising &<br />
extending its railway siding, through which the company procures 90% of its raw<br />
materials. This reduces transportation costs by more than INR 500/MT thereby<br />
resulting in significant savings in terms of logistic costs.<br />
The company also possesses the flexibility to procure low-quality coal (D, E and F<br />
grades) and beneficiate them in its coal washery which increases the productivity<br />
and longevity of the sponge iron plant, while reducing the manufacturing cost.<br />
<strong>MSP</strong> has been allotted coal and iron ore<br />
mines which will further lead to<br />
integration of its operations<br />
<strong>MSP</strong> has been allotted coal mines in Chhattisgarh, 150 km from its plant and it<br />
expects to commence commercial mine operations from March 2011. The reserves<br />
are estimated at 175 million tonnes of which <strong>MSP</strong> has a share of 26 MT. This will<br />
reduce its dependence on outside suppliers.<br />
The company has also been recently allotted the prospecting license of an iron ore<br />
mine, 125 km from its plant and these reserves are estimated at ~36 million tonnes.<br />
The company expects to operationalise this mine in about 3-4 years (by FY14). This<br />
will provide the company cheap iron ore supply and significantly reduce its raw<br />
material costs.<br />
7<br />
Unicon Wealth Management<br />
www.uniconindia.in
<strong>MSP</strong> <strong>Steel</strong> & <strong>Power</strong> <strong>Ltd</strong><br />
Pelletisation to lower cost of production<br />
INR / Tonne Fine Lumps Savings<br />
Landed Cost 1500 6500<br />
Processing cost 2500 0<br />
Total 4000 6500 2500<br />
Source: Company<br />
The pelletisation process converts iron ore fines into the shape of a pellet with<br />
characteristics appropriate for use in a blast furnace for the production of sponge<br />
iron. Beneficiation process converts low grade iron ore to ore with higher iron<br />
content through concentration. Availability of low grade fines is in abundance at<br />
very cheap prices as there is no export demand for this grade and is also not used<br />
by domestic steel manufacturers. The iron ore beneficiation plant has helped <strong>MSP</strong><br />
to bring down its cost of steel production.<br />
<strong>MSP</strong> has setup a pellet plant at Raigarh with a capacity of 300,000 MTPA to reap<br />
the cost advantage and to hedge price volatility in iron ore prices. This capacity is<br />
expected to increase to 900,000 MTPA by FY12. This will significantly lower the<br />
cost of production as the plant will use low grade iron ore fines (
<strong>MSP</strong> <strong>Steel</strong> & <strong>Power</strong> <strong>Ltd</strong><br />
<strong>Power</strong> to add to revenues<br />
Company plans to sell 40-42MW<br />
power on a merchant basis which will<br />
yield additional revenues<br />
<strong>MSP</strong> has an installed power generation capacity of 24MW as against the requirement<br />
of 19-20MW for its captive purposes. The company expects to commission 18MW<br />
power capacity this month and will add another 34 MW by July 2011. Post expansion,<br />
the capacity would increase to 76MW, of which 34-36MW will be required to support<br />
the expanded manufacturing capacity.<br />
The revenue generation from power will increase substantially as <strong>MSP</strong> plans to sign<br />
monthly contracts with state electricity boards in Orissa and West Bengal which<br />
offer INR 4 per unit and Maharashtra up to INR 5 for merchant power. <strong>Power</strong><br />
contributed 2% towards revenue in FY10, which is expected to increase to 7%-10%<br />
by FY12.<br />
<strong>MSP</strong>’s production cost for power is<br />
~40-45% lower than the normal<br />
electricity cost<br />
The captive power produced from waste heat would meet the major requirement for<br />
the total steel capacity envisaged. In a coal based sponge iron plant, about 40% coal<br />
energy is utilised. The company has installed waste heat recovery boilers with the<br />
kilns which will enable it to generate 42% power from waste heat recovery, resulting<br />
in lower cost of generation.<br />
<strong>MSP</strong>’s production cost for power varies between INR 1.5 – 2 per unit i.e. almost about<br />
40-45% of the normal electricity cost, which is usually INR 2.80 per unit. Use of<br />
captive power will improve the profitability of the company as waste heat generated<br />
in the sponge iron plant which generally goes waste, will be utilised.<br />
9<br />
Unicon Wealth Management<br />
www.uniconindia.in
<strong>MSP</strong> <strong>Steel</strong> & <strong>Power</strong> <strong>Ltd</strong><br />
Concerns<br />
Execution Delays<br />
Execution delays remain a risk for the company as the company is amidst a huge<br />
expansion plan. The scale of some projects which the company is undertaking currently<br />
is bigger than the projects it has been handling. Delays in executing these projects will<br />
have direct impact on the company’s topline. The company has however been able to<br />
execute its projects on time and has shown a good track record. We remain confident<br />
of the company’s ability to complete these projects on schedule.<br />
Sponge Iron Prices<br />
The company is more than doubling its sponge iron capacity over the next couple of<br />
years. This makes its profitability vulnerable to fluctuations in sponge iron prices.<br />
However the management has indicated that they will integrate forward by increasing<br />
its TMT and billets capacity which will result in captive consumption of sponge iron<br />
thereby eliminating this risk.<br />
Iron Ore Prices<br />
The company currently procures iron ore from the spot market which exposes it to<br />
fluctuations in iron prices. The company has a benefication plant which allows it to<br />
use low grade iron ore; available in plenty. Besides the company also expects to<br />
operationalise its captive iron ore mines by FY14 thereby completely eliminating this<br />
risk.<br />
Financial Outlook<br />
Revenue (INR mn)<br />
12000<br />
10000<br />
8000<br />
6000<br />
4000<br />
2000<br />
0<br />
2009 2010 2011E 2012E 2013E<br />
<strong>MSP</strong> has shown strong growth over the last five years with net revenues increasing at<br />
a strong CAGR of 62%. The company is now in the midst of a huge expansion plan due<br />
to which we expect its net revenues to grow at a four-year CAGR of 37% to Rs 14.4 bn<br />
by FY14.<br />
EBITA (INR mn)<br />
3000<br />
2500<br />
2000<br />
1500<br />
1000<br />
500<br />
0<br />
2009 2010 2011E 2012E 2013E<br />
30 .0<br />
25.0<br />
20.0<br />
15.0<br />
10.0<br />
5.0<br />
0.0<br />
EBITA %<br />
The company’s EBITDA has grown at a CAGR of 55% over the last five years. Going<br />
forward, we expect EBITDA to increase at a CAGR of 51% over the next four years. This<br />
is on account of an increase in EBITDA margins going forward as the company is<br />
focusing on large backward integration projects. We estimate margins to improve<br />
from 16.5% in FY10 to 25.3% by FY14.<br />
EBITDA EBITDA (%)<br />
PAT (INR mn)<br />
900<br />
800<br />
700<br />
600<br />
500<br />
400<br />
300<br />
200<br />
100<br />
0<br />
2009 2010 2011E 2012E 2013E<br />
12.0<br />
10.0<br />
8.0<br />
6.0<br />
4.0<br />
2.0<br />
-<br />
PAT %<br />
<strong>MSP</strong>’s net income has shown a strong CAGR of 67% over the last five years. We expect<br />
the company’s net income to grow at a CAGR of 41% till FY14. We expect PAT margins<br />
for the company to improve 123 basis points from 8.2% in FY10 to 9.5% by FY14.<br />
EBITDA EBITDA (%)<br />
Source: Bloomberg, Unicon Research<br />
10<br />
Unicon Wealth Management<br />
www.uniconindia.in
<strong>MSP</strong> <strong>Steel</strong> & <strong>Power</strong> <strong>Ltd</strong><br />
Peer Comparison<br />
CMP<br />
(INR)<br />
Mkt Cap<br />
(INR Mn)<br />
EBITDA Margins (%) PE (x) PB (x) EV/EBITDA (x)<br />
FY11e FY12e FY11e FY12e FY11e FY12e FY11e FY12e<br />
Sail 219 904764 24.4 26.8 11.7 10.4 2.3 1.9 7.3 5.8<br />
Tata <strong>Steel</strong> 620 559598 13.8 14.7 9.6 8.0 2.0 1.6 NA NA<br />
JSW 1239 231801 21.3 22.5 14.7 9.6 1.8 1.5 8.7 6.2<br />
Godawari <strong>Power</strong> & Ispat <strong>Ltd</strong> 213 5992 21.8 24.4 5.5 3.7 1.0 0.8 5.4 3.9<br />
Adhunik Metaliks 108 13387 30.8 32.7 5.8 4.2 1.4 1.1 NA NA<br />
Monnet Ispat 622 32515 28.9 28.9 13.1 9.8 1.9 1.6 8.6 5.7<br />
<strong>MSP</strong> <strong>Steel</strong> & <strong>Power</strong> <strong>Ltd</strong> 72 4160 21.5 23.7 12.2 7.6 1.8 1.4 13.1 7.8<br />
Source: Bloomberg, Unicon Research<br />
Valuation<br />
Stock is currently trading at FY11E & FY12E P/E multiple of 12.2x & 7.6x and Price/<br />
Sales multiple of 1.1x & 0.7x, which appears fairly attractive considering the strong<br />
growth and improving margins. We have used the discounted cash flow (DCF)<br />
method to value <strong>MSP</strong> due to the huge capex plan, the benefits of which would<br />
accrue over a longer period. Our valuation suggests Sep’11 target price of INR 114<br />
based on a discount rate of 11.8% and a terminal growth of 2%. The target price<br />
implies a potential upside of 59% from current levels. We initiate coverage with a<br />
BUY recommendation.<br />
DCF Valuation Table<br />
Weighted average cost of capital (%) 11.8<br />
Terminal Growth rate (%) 2<br />
PV of Free Cash Flows 4,511<br />
PV of Terminal Cash Flows 8,960<br />
Total Value of Free Cash Flows 13,471<br />
Total Debt (Sept FY11) 7,410<br />
Total Cash (Sept FY11) 545<br />
Shareholders value 6,606<br />
No of Shares 58,100,000<br />
Value per share 114<br />
Upside (%) 59<br />
Sensitivity Analysis<br />
11.4% 11.6% 11.8% 12.0% 12.2%<br />
1.0% 134 124 115 106 97<br />
1.5% 134 124 114 105 96<br />
2.0% 134 124 114 104 95<br />
2.5% 134 124 113 104 94<br />
3.0% 135 123 113 103 93<br />
PE Band<br />
80<br />
10x<br />
70<br />
8.5x<br />
Share Price<br />
60<br />
50<br />
40<br />
7x<br />
5.5x<br />
30<br />
4x<br />
20<br />
Oct-09<br />
Nov-09<br />
Nov-09<br />
Dec-09<br />
Dec-09<br />
Jan-10<br />
Jan-10<br />
Feb-10<br />
Feb-10<br />
Mar-10<br />
Mar-10<br />
Mar-10<br />
Apr-10<br />
Apr-10<br />
May-10<br />
May-10<br />
Jun-10<br />
Jun-10<br />
Jul-10<br />
Jul-10<br />
Aug-10<br />
Aug-10<br />
Aug-10<br />
Sep-10<br />
Sep-10<br />
Oct-10<br />
Oct-10<br />
11<br />
Unicon Wealth Management<br />
www.uniconindia.in
<strong>MSP</strong> <strong>Steel</strong> & <strong>Power</strong> <strong>Ltd</strong><br />
Financial Summary<br />
Income Statement FY09 FY10 FY11E FY12E FY13E<br />
Gross Sales 4388.9 4142.8 6338.5 8873.8 11536.0<br />
Excise dut 400.2 255.3 507.1 709.9 922.9<br />
Net Sales 3988.6 3887.4 5831.4 8163.9 10613.1<br />
Other Op. Income 0.0 0.0 0.0 0.0 0.0<br />
Total Op. Income 3988.6 3887.4 5831.4 8163.9 10613.1<br />
Raw Materials Consumed 2908.4 2671.0 3848.7 5224.9 6792.4<br />
% to Total Op. Exp. 86.1 82.3 84.1 83.9 84.3<br />
Total Op. Exp. 3378.6 3246.5 4578.2 6227.3 8058.2<br />
EBITDA 610.0 641.0 1253.2 1936.7 2554.9<br />
Other Income 150.1 71.1 78.2 86.0 94.6<br />
Depreciation 74.1 125.7 322.6 486.9 655.0<br />
EBIT 686.0 586.3 1008.8 1535.8 1994.5<br />
Interest 194.2 204.0 498.0 720.0 810.0<br />
PBT 491.7 382.3 510.8 815.8 1184.5<br />
Tax Provision 92.8 61.7 168.6 269.2 390.9<br />
PAT 398.9 320.5 342.3 546.6 793.6<br />
INR mn<br />
Balance Sheet FY09 FY10 FY11E FY12E FY13E<br />
Net Assets 2272.8 2558.9 4690.4 6942.3 9088.1<br />
CWIP 1052.1 2454.1 2470.0 2395.0 680.0<br />
Investments 67.3 449.5 463.0 476.9 491.2<br />
Current Assets<br />
Inventories 393.4 683.4 874.7 1387.9 1698.1<br />
Sundry Debtors 418.0 668.4 991.3 1387.9 1804.2<br />
Cash & Bank Balances 194.0 378.7 437.5 653.3 796.2<br />
Other Current Assets 426.2 542.0 758.8 1062.1 1274.4<br />
Current Liabilities<br />
Current Liabilities 215.7 642.3 816.4 1142.9 1485.8<br />
Provisions 30.5 48.5 58.3 81.6 106.1<br />
Net Working Capital 1185.4 1581.7 2187.6 3266.5 3981.0<br />
Total assets 4577.6 7044.2 9811.1 13080.7 14240.3<br />
Share Capital 581.0 581.0 581.0 581.0 581.0<br />
Reserves 1111.3 1431.9 1774.1 2320.7 3114.3<br />
Preference Capital 0.0 222.0 1200.0 1200.0 1200.0<br />
Secured Loans 2494.4 4247.4 5584.9 8156.1 8332.0<br />
Unsecured Loans 232.5 363.3 466.5 612.3 796.0<br />
Def. Tax Liabilities 158.3 198.6 204.5 210.7 217.0<br />
Total Liabilities 4577.6 7044.2 9811.1 13080.7 14240.3<br />
Cash flow Statement FY09 FY10 FY11E FY12E FY13E<br />
PBT 491.7 382.3 510.8 815.8 1184.5<br />
Add: Depreciation 74.1 125.7 322.6 486.9 655.0<br />
Interest 194.2 204.0 498.0 720.0 810.0<br />
Less: Direct Taxes Paid -27.0 -21.5 -162.6 -263.1 -384.6<br />
Increase in Working Capital -11.7 -211.6 -547.1 -863.1 -571.6<br />
Other Miscellaneous 5.0 1.5 0.0 0.0 0.0<br />
CF from Operations 726.3 480.5 621.6 896.5 1693.4<br />
(Pur) / Sale of Fixed Assets -1220.7 -1815.3 -2470.0 -2663.8 -1085.8<br />
(Pur.) / Sale of Investments -6.3 -382.3 -13.5 -13.9 -14.3<br />
Other Miscellaneous 0.0 0.0 0.0 0.0 0.0<br />
CF from Investments -1227.0 -2197.6 -2483.5 -2677.7 -1100.1<br />
Change in Networth 0.0 222.0 978.0 0.0 0.0<br />
Change in Loan Fund 673.8 1883.8 1440.7 2717.0 359.6<br />
Less: Interest Paid -194.2 -204.0 -498.0 -720.0 -810.0<br />
Dividend Paid 0.0 0.0 0.0 0.0 0.0<br />
Other Miscellaneous 0.0 0.0 0.0 0.0 0.0<br />
CF from Fin. activities 479.6 1901.7 1920.7 1997.0 -450.4<br />
Net Change in Cash -21.1 184.7 58.8 215.8 142.9<br />
Source: Bloomberg, Unicon Research<br />
Key Ratios FY09 FY10 FY11E FY12E FY13E<br />
Profitability & Margins (%)<br />
EBITDA Margin 15.3% 16.5% 21.5% 23.7% 24.1%<br />
EBIT Margin 17.2% 15.1% 17.3% 18.8% 18.8%<br />
Pre-tax Margin 12.3% 9.8% 8.8% 10.0% 11.2%<br />
PAT Margin 10.0% 8.2% 5.9% 6.7% 7.5%<br />
EPS 6.9 5.5 5.9 9.4 13.7<br />
Growth % -14.5% -19.6% 6.8% 59.7% 45.2%<br />
RoE 23.6% 15.9% 14.5% 18.8% 21.5%<br />
RoCE 15.5% 8.6% 10.5% 11.9% 14.2%<br />
Leverage (x)<br />
Debt / Equity 1.6 2.1 1.7 2.1 1.9<br />
Interest Coverage 3.5 2.9 2.0 2.1 2.5<br />
Current Ratio 2.3 9.2 4.4 5.1 4.6<br />
Valuations (x)<br />
EV/Sales 1.7 1.7 2.2 1.7 1.5<br />
EV/EBITDA 8.9 11.0 13.1 7.8 6.3<br />
P/E 10.4 13.0 12.2 7.6 5.2<br />
P/BV 2.5 2.1 1.8 1.4 1.1<br />
12<br />
Unicon Wealth Management<br />
www.uniconindia.in
<strong>MSP</strong> <strong>Steel</strong> & <strong>Power</strong> <strong>Ltd</strong><br />
Unicon Investment Ranking Methodology<br />
Rating Buy Accumulate Hold Reduce Sell<br />
Return Range >= 20% 10% to 20% -10% to 10% -10% to -20%