Barletta et al 2010.pdf - Department of Geological Sciences ...
Barletta et al 2010.pdf - Department of Geological Sciences ...
Barletta et al 2010.pdf - Department of Geological Sciences ...

Create successful ePaper yourself
Turn your PDF publications into a flip-book with our unique Google optimized e-Paper software.
Quaternary Science Reviews 29 (2010) 2315e2324<br />
Contents lists available at ScienceDirect<br />
Quaternary Science Reviews<br />
journ<strong>al</strong> homepage: www.elsevier.com/locate/quascirev<br />
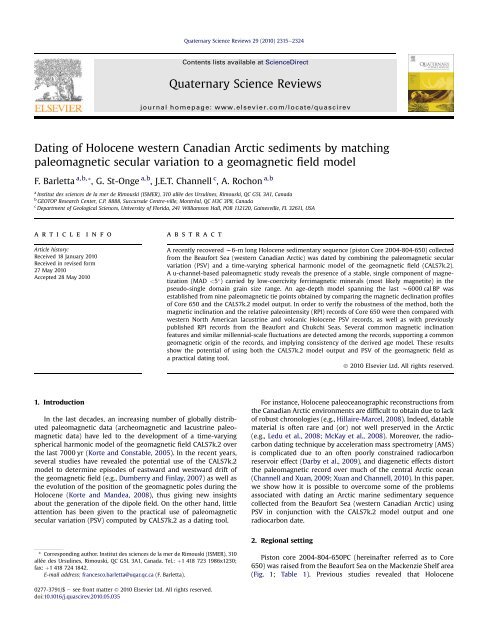
Dating <strong>of</strong> Holocene western Canadian Arctic sediments by matching<br />
p<strong>al</strong>eomagn<strong>et</strong>ic secular variation to a geomagn<strong>et</strong>ic field model<br />
F. <strong>Barl<strong>et</strong>ta</strong> a,b, *, G. St-Onge a,b , J.E.T. Channell c , A. Rochon a,b<br />
a Institut des sciences de la mer de Rimouski (ISMER), 310 <strong>al</strong>lée des Ursulines, Rimouski, QC G5L 3A1, Canada<br />
b GEOTOP Research Center, C.P. 8888, Succurs<strong>al</strong>e Centre-ville, Montré<strong>al</strong>, QC H3C 3P8, Canada<br />
c <strong>Department</strong> <strong>of</strong> Geologic<strong>al</strong> <strong>Sciences</strong>, University <strong>of</strong> Florida, 241 Williamson H<strong>al</strong>l, POB 112120, Gainesville, FL 32611, USA<br />
article<br />
info<br />
abstract<br />
Article history:<br />
Received 18 January 2010<br />
Received in revised form<br />
27 May 2010<br />
Accepted 28 May 2010<br />
A recently recovered w6-m long Holocene sedimentary sequence (piston Core 2004-804-650) collected<br />
from the Beaufort Sea (western Canadian Arctic) was dated by combining the p<strong>al</strong>eomagn<strong>et</strong>ic secular<br />
variation (PSV) and a time-varying spheric<strong>al</strong> harmonic model <strong>of</strong> the geomagn<strong>et</strong>ic field (CALS7k.2).<br />
A u-channel-based p<strong>al</strong>eomagn<strong>et</strong>ic study reve<strong>al</strong>s the presence <strong>of</strong> a stable, single component <strong>of</strong> magn<strong>et</strong>ization<br />
(MAD
2316<br />
F. <strong>Barl<strong>et</strong>ta</strong> <strong>et</strong> <strong>al</strong>. / Quaternary Science Reviews 29 (2010) 2315e2324<br />
Fig. 1. (A) Location <strong>of</strong> Core 650 (this study) sampling site. Also illustrated is the location <strong>of</strong> Cores 05, 06 and 803 from the Chukchi and the Beaufort Seas (<strong>Barl<strong>et</strong>ta</strong> <strong>et</strong> <strong>al</strong>., 2008; Lisé-<br />
Pronovost <strong>et</strong> <strong>al</strong>., 2009). The position <strong>of</strong> the North Magn<strong>et</strong>ic Pole (NMP) as d<strong>et</strong>ermined by a joint Canada-France expedition in 2001 is indicated (Newitt <strong>et</strong> <strong>al</strong>., 2002). The box in the<br />
ins<strong>et</strong> shows the location <strong>of</strong> the study area. (B) Location <strong>of</strong> the glob<strong>al</strong> direction<strong>al</strong> p<strong>al</strong>eomagn<strong>et</strong>ic data compilation from sedimentary sequences and (C) from archeomagn<strong>et</strong>ism used to<br />
constrain the CALS7k.2 model (modified from Korte <strong>et</strong> <strong>al</strong>., 2005). The d<strong>et</strong>ails <strong>of</strong> the compilation are presented in Korte <strong>et</strong> <strong>al</strong>. (2005).<br />
postglaci<strong>al</strong> sedimentary sequences collected from both the Arctic<br />
Alaskan and Canadian margins are characterized by higher sedimentation<br />
rates than in the rest <strong>of</strong> the centr<strong>al</strong> Arctic basin (e.g.,<br />
Darby <strong>et</strong> <strong>al</strong>., 2006, 2009; Rochon <strong>et</strong> <strong>al</strong>., 2006; Bringué, 2009).<br />
Holocene average sedimentation rates were estimated to vary<br />
b<strong>et</strong>ween 10 and 300 cm/ka (e.g., Andrews and Dunhill, 2004;<br />
Keigwin <strong>et</strong> <strong>al</strong>., 2006; Rochon <strong>et</strong> <strong>al</strong>., 2006; <strong>Barl<strong>et</strong>ta</strong> <strong>et</strong> <strong>al</strong>., 2008;<br />
Lisé-Pronovost <strong>et</strong> <strong>al</strong>., 2009) thus <strong>of</strong>fering the opportunity to<br />
reconstruct centenni<strong>al</strong>- to millenni<strong>al</strong>-sc<strong>al</strong>e geomagn<strong>et</strong>ic field<br />
variations in the Arctic (e.g., <strong>Barl<strong>et</strong>ta</strong> <strong>et</strong> <strong>al</strong>., 2008; Lisé-Pronovost<br />
<strong>et</strong> <strong>al</strong>., 2009). Moreover, due to the proximity <strong>of</strong> the North<br />
Magn<strong>et</strong>ic Pole (NMP; Fig. 1), sedimentary sequences from western<br />
Canadian Arctic have the advantage <strong>of</strong> recording higher amplitude<br />
PSV direction<strong>al</strong> changes than the rest <strong>of</strong> the Earth.<br />
Fig. 1B and C illustrate the location <strong>of</strong> the glob<strong>al</strong> compilation <strong>of</strong><br />
direction<strong>al</strong> p<strong>al</strong>eomagn<strong>et</strong>ic and archeomagn<strong>et</strong>ic data, respectively,<br />
used to constrain the CALS7k.2 model (Korte <strong>et</strong> <strong>al</strong>., 2005). The<br />
direction<strong>al</strong> datas<strong>et</strong> used in the CALS7k.2 model is mainly derived<br />
from lacustrine sedimentary sequences and archaeologic<strong>al</strong> artefacts<br />
or volcanic rocks from the Northern Hemisphere.<br />
Table 1<br />
Coordinates <strong>of</strong> the core.<br />
Core Latitude ( N) Longitude ( W) Water depth (m) Length (m)<br />
2004-804-650 71 .18.52 0 131 36.98 0 246 6.08<br />
3. Materi<strong>al</strong>s and m<strong>et</strong>hods<br />
Core 650 was collected on board the Canadian Coast Guard<br />
Icebreaker (CCGS) Amundsen during the 2004 Canadian Arctic<br />
Shelf Expedition Study (CASES). The core sections were split,<br />
described on board and then sampled with u-channel samples<br />
(u-shaped plastic liners <strong>of</strong> 2 2 cm cross-section and length up to<br />
1.5 m) for p<strong>al</strong>eomagn<strong>et</strong>ic an<strong>al</strong>yses. Apart from hysteresis properties<br />
and grain size an<strong>al</strong>yses, <strong>al</strong>l magn<strong>et</strong>ic remanences as well as<br />
the low-field magn<strong>et</strong>ic susceptibility (k LF ) measurements were<br />
carried out at the University <strong>of</strong> Florida (Gainesville, FL) using a 2G<br />
Enterprises Model 760R cryogenic magn<strong>et</strong>om<strong>et</strong>er and a pulse<br />
magn<strong>et</strong>izer for the induction <strong>of</strong> isotherm<strong>al</strong> remanent magn<strong>et</strong>izations.<br />
The continuous p<strong>al</strong>eomagn<strong>et</strong>ic measurements were performed<br />
at 1 cm interv<strong>al</strong>s. Non<strong>et</strong>heless, due to the response<br />
function <strong>of</strong> the magn<strong>et</strong>om<strong>et</strong>er’s pick-up coils each measurement<br />
integrates across a w4.5 cm stratigraphic interv<strong>al</strong> (Weeks <strong>et</strong> <strong>al</strong>.,<br />
1993). Therefore, the data from the upper and lower 4 cm <strong>of</strong><br />
each u-channel were not used in order to eliminate edge effects<br />
(i.e., the integration <strong>of</strong> “no sediment” at the end and the beginning<br />
<strong>of</strong> each u-channel).<br />
3.1. Magn<strong>et</strong>ic measurements<br />
U-channel samples were subjected to stepwise <strong>al</strong>ternating field<br />
(AF) demagn<strong>et</strong>ization <strong>of</strong> the natur<strong>al</strong> remanent magn<strong>et</strong>ization
F. <strong>Barl<strong>et</strong>ta</strong> <strong>et</strong> <strong>al</strong>. / Quaternary Science Reviews 29 (2010) 2315e2324 2317<br />
Table 2<br />
Radiocarbon date.<br />
Core Depth (cm) Age a (yr BP) C<strong>al</strong>ibrated age b (c<strong>al</strong> BP) Dated materi<strong>al</strong> Lab. number c<br />
2004-804-650 135 4080 40 3580 (3463e3701) Littorina sp. B<strong>et</strong>a-204830<br />
a The age was d<strong>et</strong>ermined by the AMS m<strong>et</strong>hod and corrected for natur<strong>al</strong> and sputtering fractionation (d 13 C ¼ 25& versus Vienna Pee-Dee Belemnite (VPDB)). The<br />
statistic<strong>al</strong> uncertainty <strong>of</strong> the age d<strong>et</strong>ermination is given as one standard deviation (Stuiver and Polach, 1977).<br />
b C<strong>al</strong>ibrated using the on-line CALIB 5.0.2 s<strong>of</strong>tware (Stuiver <strong>et</strong> <strong>al</strong>., 2005) using the Hughen <strong>et</strong> <strong>al</strong>. (2004) marine datas<strong>et</strong>. A tot<strong>al</strong> marine reservoir correction <strong>of</strong> w800 yr was<br />
applied (DR ¼ 400 yr). The first and last ages, in parentheses, represent the 2s c<strong>al</strong> age range.<br />
c B<strong>et</strong>a an<strong>al</strong>ytic Inc., Miami, FL, USA.<br />
(NRM) at peak AF fields <strong>of</strong> 0, 10e60 mT in 5 mT steps, 70 and 80 mT.<br />
In order to d<strong>et</strong>ermine the characteristic remanent magn<strong>et</strong>ization<br />
(ChRM), the magn<strong>et</strong>ic declination and inclination <strong>of</strong> the ChRM<br />
(labelled as ChRM D and ChRM I, respectively) were computed at<br />
1 cm interv<strong>al</strong>s using the standard princip<strong>al</strong> component an<strong>al</strong>ysis<br />
(PCA) <strong>of</strong> Kirschvink (1980) which <strong>al</strong>so provide the maximum<br />
angular deviation (MAD) v<strong>al</strong>ues. MAD v<strong>al</strong>ues lower than 5 are<br />
indicative <strong>of</strong> high-qu<strong>al</strong>ity direction<strong>al</strong> data (e.g., Stoner and St-Onge,<br />
2007). Subsequently, the stepwise acquisition and demagn<strong>et</strong>ization<br />
<strong>of</strong> both the anhyster<strong>et</strong>ic and isotherm<strong>al</strong> remanent magn<strong>et</strong>izations<br />
(indicated as ARM and IRM, respectively) were acquired with the<br />
aim to characterize changes in magn<strong>et</strong>ic miner<strong>al</strong> concentration.<br />
The ARM was imparted using a 100 mT AF field superposed to<br />
a direct current (DC) bias field <strong>of</strong> 50 mT whereas two IRMs were<br />
acquired applying a DC pulse field <strong>of</strong> 0.3 T and 0.95 T<br />
(corresponding to a saturated isotherm<strong>al</strong> remanent magn<strong>et</strong>ization,<br />
SIRM) respectively. These IRMs were used to construct a coercivitydependent<br />
proxy by dividing the IRM at 0.3 T by the SIRM (St-Onge<br />
<strong>et</strong> <strong>al</strong>., 2003). This ratio is useful to estimate changes in magn<strong>et</strong>ic<br />
miner<strong>al</strong>ogy, with v<strong>al</strong>ues close to 1 indicating a low-coercivity<br />
ferrimagn<strong>et</strong>ic miner<strong>al</strong>ogy (e.g., magn<strong>et</strong>ite) and lower v<strong>al</strong>ues indicating<br />
a higher coercivity, possibly antiferromagn<strong>et</strong>ic (e.g., hematite)<br />
miner<strong>al</strong>ogy.<br />
Both the ARM and IRMs were then demagn<strong>et</strong>ized at the same AF<br />
steps as the NRM. The ARM was <strong>al</strong>so expressed as an anhyster<strong>et</strong>ic<br />
susceptibility (k ARM ) by norm<strong>al</strong>izing the ARM with the biasing field.<br />
AF demagn<strong>et</strong>ization data were used to compute the median<br />
destructive fields <strong>of</strong> the NRM, ARM and IRM (labelled as MDF NRM ,<br />
MDF ARM , MDF IRM , respectively; i.e., the v<strong>al</strong>ue <strong>of</strong> the peak AF<br />
necessary to reduce the magn<strong>et</strong>ic remanence to h<strong>al</strong>f <strong>of</strong> its initi<strong>al</strong><br />
Fig. 2. Lithology and magn<strong>et</strong>ic properties <strong>of</strong> Core 650. (A) Illustrated are mean grain size, low-field magn<strong>et</strong>ic susceptibility (k LF ), natur<strong>al</strong> remanent magn<strong>et</strong>ization (NRM),<br />
anhyster<strong>et</strong>ic remanent magn<strong>et</strong>ization (ARM) and isotherm<strong>al</strong> remanent magn<strong>et</strong>ization (IRM) diagrams after an AF demagn<strong>et</strong>ization at 30 mT. Arrows indicate decrease in remanence<br />
intensity with depth (see text for d<strong>et</strong>ails). The only available AMS- 14 C date is <strong>al</strong>so indicated. (B) Magn<strong>et</strong>ic param<strong>et</strong>ers k ARM /k LF , IRM/SIRM and SIRM/k LF against depth. The ratio IRM/<br />
SIRM is c<strong>al</strong>culated after an AF demagn<strong>et</strong>ization level <strong>of</strong> 30 mT in order to emphasize the relative importance <strong>of</strong> the high-coercivity component. The gray shaded area indicates the<br />
interv<strong>al</strong> used for PSV and RPI reconstructions.
2318<br />
F. <strong>Barl<strong>et</strong>ta</strong> <strong>et</strong> <strong>al</strong>. / Quaternary Science Reviews 29 (2010) 2315e2324<br />
Fig. 3. (A) Representative hysteresis loops (left diagrams) with the corresponding IRM acquisition curves (right diagrams). The hysteresis param<strong>et</strong>ers (saturation magn<strong>et</strong>ization<br />
(M S ), saturation remanence (M R ) and coercivity (H C )) were d<strong>et</strong>ermined from the paramagn<strong>et</strong>ic-corrected hysteresis data (broken curve in the left diagrams). Vertic<strong>al</strong> line at 100 mT<br />
is for reference.<br />
v<strong>al</strong>ue) using the s<strong>of</strong>tware developed by Mazaud (2005). These three<br />
param<strong>et</strong>ers are useful to characterize the mean coercivity state <strong>of</strong><br />
the ferrimagn<strong>et</strong>ic miner<strong>al</strong>s which in turn depends on both the<br />
magn<strong>et</strong>ic miner<strong>al</strong>ogy and grain size (e.g., Dunlop and Özdemir,<br />
1997). Furthermore, the magn<strong>et</strong>ic grain size was estimated using<br />
k ARM versus k LF diagram (King <strong>et</strong> <strong>al</strong>., 1983). The objective here is not<br />
to d<strong>et</strong>ermine the absolute size <strong>of</strong> the magn<strong>et</strong>ic grains as it was<br />
previously shown that ARM measurements vary from one laboratory<br />
to the other (Sagnotti <strong>et</strong> <strong>al</strong>., 2003), but rather to assess the<br />
extent and uniformity <strong>of</strong> the magn<strong>et</strong>ic grain size distribution.<br />
Fin<strong>al</strong>ly, a sm<strong>al</strong>l quantity <strong>of</strong> sediment was collected every 10 cm over<br />
the top 3 m and in some selected interv<strong>al</strong>s in order to study both<br />
the hysteresis properties and the IRM acquisition curves using an<br />
<strong>al</strong>ternating gradient force magn<strong>et</strong>om<strong>et</strong>er (AGM) (Princ<strong>et</strong>on<br />
Measurement Corporation model MicroMag 2900 AGM) at the<br />
P<strong>al</strong>eomagn<strong>et</strong>ism laboratory <strong>of</strong> the Institut des sciences de la mer de<br />
Rimouski (ISMER).<br />
3.2. Computerized axi<strong>al</strong> tomography an<strong>al</strong>ysis (CAT-scan)<br />
Digit<strong>al</strong> X-ray images <strong>of</strong> <strong>al</strong>l u-channel samples were obtained by<br />
computerized axi<strong>al</strong> tomography (CAT-scan) an<strong>al</strong>ysis with a 1-mm<br />
downcore resolution. The resulting gray sc<strong>al</strong>e images <strong>al</strong>low us to<br />
extract a tomographic intensity pr<strong>of</strong>ile (CT numbers; e.g., St-Onge<br />
<strong>et</strong> <strong>al</strong>., 2007). CT numbers primarily reflect changes in sediment<br />
bulk density, miner<strong>al</strong>ogy as well as porosity and can be <strong>al</strong>so useful<br />
to d<strong>et</strong>ect core deformation or coring artefacts (e.g., Guyard <strong>et</strong> <strong>al</strong>.,<br />
2007; St-Onge <strong>et</strong> <strong>al</strong>., 2007).<br />
3.3. Grain size an<strong>al</strong>yses<br />
Grain size measurements on Core 650 were made using<br />
a Beckman-Coulter laser diffraction an<strong>al</strong>yzer (Model LS-13320;<br />
0.04e2000 mm) at ISMER at 10 cm interv<strong>al</strong>s. About 0.5 g <strong>of</strong> w<strong>et</strong><br />
sediment was mixed in C<strong>al</strong>gon electrolytic solution (sodium
F. <strong>Barl<strong>et</strong>ta</strong> <strong>et</strong> <strong>al</strong>. / Quaternary Science Reviews 29 (2010) 2315e2324 2319<br />
hexam<strong>et</strong>aphosphate, 20 g/L). Subsequently, the samples were<br />
rotated for at least 3 h using an in-house rotator and then sieved<br />
(
2320<br />
F. <strong>Barl<strong>et</strong>ta</strong> <strong>et</strong> <strong>al</strong>. / Quaternary Science Reviews 29 (2010) 2315e2324<br />
Fig. 5. The characteristic remanent magn<strong>et</strong>ization (ChRM) <strong>of</strong> Core 650. (A) From left to right are displayed: the magn<strong>et</strong>ic declination (D), inclination (I) <strong>of</strong> the ChRM as well as the<br />
corresponding MAD v<strong>al</strong>ues and median destructive fields (MDF). Note that the ChRM D pr<strong>of</strong>iles are relative since the core was not azimuth<strong>al</strong>ly oriented. The broken vertic<strong>al</strong> line in<br />
the ChRM inclination diagram represents the expected inclination (I GAD ) for a geocentric axi<strong>al</strong> dipole model, whereas the solid vertic<strong>al</strong> line indicates a MAD v<strong>al</strong>ue <strong>of</strong> 5 . The gray<br />
shaded area indicates the interv<strong>al</strong> used for PSV and RPI reconstructions. (B) Representative vector end-point orthogon<strong>al</strong> projection diagrams (Zijderveld, 1967) at three selected<br />
depths. AF demagn<strong>et</strong>ization data reve<strong>al</strong> a stable single component magn<strong>et</strong>ization that is directed toward the origin <strong>of</strong> the vector component diagram. Open (closed) symbols<br />
represent vector end points projected on the vertic<strong>al</strong> (horizont<strong>al</strong>) plane, respectively. Peak <strong>al</strong>ternating fields are indicated in millitesla.<br />
at the other section break (from 153 to 160 cm; Fig. 6). In addition,<br />
no high MAD v<strong>al</strong>ues were observed at the base or top <strong>of</strong> the<br />
u-channels (Figs. 5 and 6) in these two core breaks. In summary,<br />
even if possible dissolution may have occurred downcore, the<br />
sediments are characterized by well-defined, strong characteristic<br />
magn<strong>et</strong>ization carried by PSD grains with a uniform grain size. In<br />
addition, <strong>al</strong>l the magn<strong>et</strong>ic param<strong>et</strong>ers and hysteresis properties<br />
point to low-coercivity miner<strong>al</strong>s, such as magn<strong>et</strong>ite, as the main<br />
carriers <strong>of</strong> the magn<strong>et</strong>ic remanence.<br />
4.4. Relative p<strong>al</strong>eointensity (RPI) d<strong>et</strong>ermination<br />
Estimation <strong>of</strong> relative p<strong>al</strong>eointensity (RPI) from sediments can<br />
be obtained by norm<strong>al</strong>izing the measured NRM by an appropriate<br />
magn<strong>et</strong>ic param<strong>et</strong>er in order to compensate for the variable<br />
concentration <strong>of</strong> ferrimagn<strong>et</strong>ic miner<strong>al</strong>s (e.g., Tauxe, 1993).<br />
Concentration-dependent param<strong>et</strong>ers such as ARM, IRM or k LF are<br />
gener<strong>al</strong>ly employed as norm<strong>al</strong>izer. To assess the reliability <strong>of</strong> an RPI<br />
proxy some pre-established criteria must be satisfied. According to<br />
Tauxe (1993), the NRM must be characterized by a strong, stable,<br />
single component magn<strong>et</strong>ization carried by (titano)magn<strong>et</strong>ite in<br />
the 1e15 mm (SD/PSD) grain size range. Moreover, due to the effect<br />
<strong>of</strong> magn<strong>et</strong>ostatic interaction b<strong>et</strong>ween ferrimagn<strong>et</strong>ic particles on<br />
the ARM acquisition (Sugiura, 1979) concentration <strong>of</strong> magn<strong>et</strong>ite<br />
should not vary downcore by more than a factor <strong>of</strong> 10 (Tauxe, 1993).<br />
Fin<strong>al</strong>ly, the norm<strong>al</strong>ized p<strong>al</strong>eointensity records from the same<br />
geographic<strong>al</strong> area should display similar pattern.<br />
As shown in the previous sections, the ChRM <strong>of</strong> Core 650 is<br />
characterized by MAD v<strong>al</strong>ues
F. <strong>Barl<strong>et</strong>ta</strong> <strong>et</strong> <strong>al</strong>. / Quaternary Science Reviews 29 (2010) 2315e2324 2321<br />
Fig. 6. Magn<strong>et</strong>ic inclination record <strong>of</strong> Core 650 (first 240 cm; lower diagram) and the computerized tomography (CT) numbers derived from the CAT-scan (computerized axi<strong>al</strong><br />
tomography) an<strong>al</strong>ysis at the three core breaks (middle diagrams). Shaded dark-gray areas indicate the three interv<strong>al</strong>s affected by an edge effect at core breaks due the response<br />
function <strong>of</strong> the cryogenic magn<strong>et</strong>om<strong>et</strong>er (see text for d<strong>et</strong>ails), whereas the vertic<strong>al</strong> line represent the precise location <strong>of</strong> the section breaks. The p<strong>al</strong>eomagn<strong>et</strong>ic data in these three<br />
interv<strong>al</strong>s (0e4 cm, 74e81 cm and 153e160 cm) were excluded, but note the homogenous nature <strong>of</strong> the CT number pr<strong>of</strong>iles from 77 cm and below, as well as from 153 cm and below,<br />
indicative <strong>of</strong> undisturbed sediments. On the contrary, major changes in the CT number pr<strong>of</strong>ile <strong>of</strong> the first w12 cm are indicative <strong>of</strong> a coring artefact. The vector end-point orthogon<strong>al</strong><br />
projection diagrams (upper diagrams) below and above each section break associated with the magn<strong>et</strong>ic features I-1 and I-5 (see Fig. 9) reve<strong>al</strong> high-qu<strong>al</strong>ity component directions<br />
(MAD
2322<br />
F. <strong>Barl<strong>et</strong>ta</strong> <strong>et</strong> <strong>al</strong>. / Quaternary Science Reviews 29 (2010) 2315e2324<br />
Fig. 7. The c<strong>al</strong>culated magn<strong>et</strong>ic declination (upper blue curve) from the CALS7k.2 model for the past 7000 c<strong>al</strong> BP (as expected for the Beaufort Sea region) and the relative ChRM<br />
declination curve <strong>of</strong> Core 650 versus depth (lower black curve). The proposed nine magn<strong>et</strong>ic declination features (D-1 to D9) as well as the available AMS- 14 C date used to construct<br />
the age model are indicated. Note that the declination sc<strong>al</strong>es are not identic<strong>al</strong>.<br />
inclination minima I-2 and I-5 still reve<strong>al</strong> a clear trend reflected by<br />
sever<strong>al</strong> data points. Regardless <strong>of</strong> these two inclination minima and<br />
in addition to the inclination maxima, the over<strong>al</strong>l correspondence<br />
b<strong>et</strong>ween the inclination curves <strong>of</strong> the different records (Fig. 9) can<br />
be ascribed to variations in Earth’s magn<strong>et</strong>ic field.<br />
The derived relative p<strong>al</strong>eointensity record <strong>of</strong> Core 650 using<br />
both k LF and IRM as norm<strong>al</strong>izers (Fig. 10) depicts similar millenni<strong>al</strong>sc<strong>al</strong>e<br />
fluctuations when compared to other previously published<br />
RPI records from the same geographic<strong>al</strong> area (Cores 05 and 803:<br />
<strong>Barl<strong>et</strong>ta</strong> <strong>et</strong> <strong>al</strong>., 2008; Core 06: Lisé-Pronovost <strong>et</strong> <strong>al</strong>., 2009; see Fig. 1<br />
for location) further supporting the derived age model. Two RPI<br />
highs at w2000 and 4000 c<strong>al</strong> BP are notably observed (P-1 and P-3;<br />
Fig. 10) and were previously recognised by <strong>Barl<strong>et</strong>ta</strong> <strong>et</strong> <strong>al</strong>. (2008) as<br />
two distinctive western Canadian Arctic chronostratigraphic<br />
markers.<br />
5. Conclusion<br />
Fig. 8. Age model <strong>of</strong> Core 650. The age model was constructed using a fifth-order<br />
polynomi<strong>al</strong> fit (R ¼ 0.999) b<strong>et</strong>ween the chronostratigraphic markers <strong>of</strong> Fig. 7 and the<br />
available AMS- 14 C date <strong>of</strong> Core 650. Uncertainties associated with the magn<strong>et</strong>ic<br />
declination features are assumed to be w100 yr according to the tempor<strong>al</strong> resolution<br />
<strong>of</strong> the CALS7k.2 model (Korte and Constable, 2005).<br />
In conclusion, our study reve<strong>al</strong>s the potenti<strong>al</strong> <strong>of</strong> using the<br />
CALS7k.2 model as a relative dating tool in the Canadian Arctic. The<br />
actu<strong>al</strong> North American database used to constrain the CALS7k.2<br />
model seems sufficient to describe most <strong>of</strong> the millenni<strong>al</strong>-sc<strong>al</strong>e<br />
Holocene PSV features observed in the western Canadian Arctic as<br />
previously highlighted by <strong>Barl<strong>et</strong>ta</strong> <strong>et</strong> <strong>al</strong>. (2008) and Lisé-Pronovost<br />
<strong>et</strong> <strong>al</strong>. (2009). Recently, Ledu <strong>et</strong> <strong>al</strong>. (in press) used similarities in the<br />
magn<strong>et</strong>ic inclination record and the CALS7k.2 output to improve<br />
the age model <strong>of</strong> a Holocene marine sedimentary sequence<br />
collected from the Lancaster Sound (eastern Canadian Arctic).<br />
Accordingly, these results open the possibility <strong>of</strong> using this chronostratigraphic<br />
approach in both the western and eastern Canadian<br />
Arctic.
F. <strong>Barl<strong>et</strong>ta</strong> <strong>et</strong> <strong>al</strong>. / Quaternary Science Reviews 29 (2010) 2315e2324 2323<br />
Fig. 9. Comparison <strong>of</strong> western North American magn<strong>et</strong>ic inclination records for the<br />
past 6000 c<strong>al</strong> BP. Common magn<strong>et</strong>ic inclination features are indicated. PSV records are<br />
from: Mara Lake, British Columbia, Canada (Turner, 1987); PSVL ¼ p<strong>al</strong>eomagn<strong>et</strong>ic<br />
secular variation record from lava flows, Western North America, USA (Hagstrum and<br />
Champion, 2002); Cores 05 and 803 from the Chukchi and the Beaufort Seas,<br />
respectively (<strong>Barl<strong>et</strong>ta</strong> <strong>et</strong> <strong>al</strong>., 2008); Core 650, this study (note that the data <strong>al</strong>ong the u-<br />
channels section breaks are excluded because they are affected by an “edge effect” due<br />
to the response function <strong>of</strong> the cryogenic magn<strong>et</strong>om<strong>et</strong>er). The magn<strong>et</strong>ic inclination<br />
expected for the Beaufort Sea from the CALS7k.2 model is <strong>al</strong>so displayed (blue upper<br />
curve). The origin<strong>al</strong> PSV record from Mara Lake was c<strong>al</strong>ibrated using the IntC<strong>al</strong>04<br />
radiocarbon c<strong>al</strong>ibration curve (Reimer <strong>et</strong> <strong>al</strong>., 2004). Note that the magn<strong>et</strong>ic inclination<br />
sc<strong>al</strong>es are not identic<strong>al</strong>.<br />
Fig. 10. Relative p<strong>al</strong>eointensity (RPI) records <strong>of</strong> Cores 05 (<strong>Barl<strong>et</strong>ta</strong> <strong>et</strong> <strong>al</strong>., 2008), 06 (Lisé-<br />
Pronovost <strong>et</strong> <strong>al</strong>., 2009), 650 (this study) and 803 (<strong>Barl<strong>et</strong>ta</strong> <strong>et</strong> <strong>al</strong>., 2008) on their own<br />
chronologies. The RPI data <strong>of</strong> Core 650 were obtained by dividing the NRM after an AF<br />
demagn<strong>et</strong>ization <strong>of</strong> 30 mT by the k LF (thick black curve), ARM (light gray curve) and<br />
IRM (dark-gray curve), respectively. Note the similarities in both shape and amplitude<br />
<strong>of</strong> the derived RPI proxies <strong>of</strong> Core 650 using both k LF and IRM as norm<strong>al</strong>izer as well as<br />
the gener<strong>al</strong> agreement b<strong>et</strong>ween the RPI record <strong>of</strong> Core 650 and the other RPI records.<br />
All the data are standardized according to their mean and standard deviation. The<br />
curve fit in the RPI record <strong>of</strong> Core 803 (red curve in the web version) was c<strong>al</strong>culated by<br />
using the loc<strong>al</strong>ly weighted least squares m<strong>et</strong>hod with a 9% weighting function.<br />
Correlative p<strong>al</strong>eointensity features are indicated (P-1 to P-3).<br />
Acknowledgements<br />
We are in debt to the captain, <strong>of</strong>ficers, crew and scientists on<br />
board the CCGS Amundsen for the recovery <strong>of</strong> Core 2004-804-650.<br />
We wish to thank the two anonymous reviewers for their<br />
constructive reviews as well as Dr. M. Korte for providing the<br />
CALS7k.2 model output for the Beaufort Sea. We thank Jacques<br />
Labrie for his technic<strong>al</strong> support. This study was supported by the<br />
Canadian Arctic Shelf Exchange Study (CASES), NSERC Discovery<br />
and Northern supplement as well as Speci<strong>al</strong> Research Opportunity<br />
(IPY) grants to G.S. and A.R. This is GEOTOP contribution number<br />
2010-0004.<br />
References<br />
Andrews, J.T., Dunhill, G., 2004. Early to mid-Holocene Atlantic water influx and<br />
deglaci<strong>al</strong> meltwater events, Beaufort Sea slope, Arctic ocean. Quaternary<br />
Research 61, 14e21.<br />
<strong>Barl<strong>et</strong>ta</strong>, F., St-Onge, G., Channell, J.E.T., Rochon, A., Polyak, L., Darby, D.A., 2008. Highresolution<br />
p<strong>al</strong>eomagn<strong>et</strong>ic secular variation and relative p<strong>al</strong>eointensity records<br />
from the western Canadian Arctic: implication for Holocene stratigraphy and<br />
geomagn<strong>et</strong>ic field behaviour. Canadian Journ<strong>al</strong> <strong>of</strong> Earth <strong>Sciences</strong> 45, 1265e1281.<br />
Blott, S.J., Pye, K., 2001. Gradistat: a grain size distribution and statistics package for<br />
the an<strong>al</strong>ysis <strong>of</strong> unconsolidated sediments. Earth Surface Processes and Landforms<br />
26, 1237e1248.<br />
Bringué, M., 2009. P<strong>al</strong>éocéanographie <strong>et</strong> variabilité climatique sur le t<strong>al</strong>us du<br />
Mackenzie (Mer de Beaufort, Arctique canadien) au cours de l’Holocène. M.Sc.<br />
Thesis, Université du Québec à Rimouski, Rimouski, Canada, 104 pp.
2324<br />
F. <strong>Barl<strong>et</strong>ta</strong> <strong>et</strong> <strong>al</strong>. / Quaternary Science Reviews 29 (2010) 2315e2324<br />
Channell, J.E.T., Xuan, C., 2009. Self-revers<strong>al</strong> and apparent magn<strong>et</strong>ic excursions in<br />
Arctic sediments. Earth and Plan<strong>et</strong>ary Science L<strong>et</strong>ters 284, 124e131.<br />
Darby, D.A., Polyak, L., Bauch, H.A., 2006. Past glaci<strong>al</strong> and interglaci<strong>al</strong> conditions in<br />
the Arctic ocean and margin<strong>al</strong> seas e a review. Progress in Oceanography 71,<br />
129e144.<br />
Darby, D.A., Polyak, L., Jakobsson, M., 2009. The 2005 HOTRAX Expedition to the<br />
Arctic ocean. Glob<strong>al</strong> and Plan<strong>et</strong>ary Change 68, 1e4.<br />
Day, R., Fuller, M., Schmidt, V.A., 1977. Hysteresis properties <strong>of</strong> titano-magn<strong>et</strong>ite:<br />
grain size and composition<strong>al</strong> dependence. Physics <strong>of</strong> the Earth and Plan<strong>et</strong>ary<br />
Interiors 13, 260e267.<br />
Dumberry, M., Finlay, C.C., 2007. Eastward and westward drift <strong>of</strong> the Earth’s<br />
magn<strong>et</strong>ic field for the last three millennia. Earth and Plan<strong>et</strong>ary Science L<strong>et</strong>ters<br />
254, 146e157.<br />
Dunlop, D.J., Özdemir, Ö, 1997. Rock Magn<strong>et</strong>ism: Fundament<strong>al</strong>s and Frontiers.<br />
Cambridge University Press, Cambridge, New York.<br />
Guyard, H., Chapron, E., St-Onge, G., Anselm<strong>et</strong>ti, F., Arnaud, F., Magand, O.,<br />
Francus, P., Mélières, M.-.A., 2007. High-<strong>al</strong>titude varve records <strong>of</strong> abrupt environment<strong>al</strong><br />
changes and mining activity over the last 4000 years in the Western<br />
French Alps (Lake Bramant, Grandes Rousses Massif). Quaternary Science<br />
Reviews 26, 2644e2660.<br />
Hagstrum, J.T., Champion, D.E., 2002. A Holocene p<strong>al</strong>eosecular variation record from<br />
14C-dated volcanic rocks in western North America. Journ<strong>al</strong> <strong>of</strong> Geophysic<strong>al</strong><br />
Research 107, 1e14.<br />
Hillaire-Marcel, C., 2008. Decad<strong>al</strong>- to millenni<strong>al</strong>-sc<strong>al</strong>e variability <strong>of</strong> Arctic-Subarctic<br />
oceans and adjacent lands: a contribution <strong>of</strong> the Polar Climate Stability<br />
N<strong>et</strong>work <strong>of</strong> Canada to the Internation<strong>al</strong> Polar Year. Canadian Journ<strong>al</strong> <strong>of</strong> Earth<br />
<strong>Sciences</strong> 45, 1199e1201.<br />
Hughen, K.A., Baillie, M.G.L., Bard, E., Bayliss, A., Beck, J.W., Bertrand, C.J.H., <strong>et</strong> <strong>al</strong>.,<br />
2004. Marine04 Marine radiocarbon age c<strong>al</strong>ibration, 0e26 C<strong>al</strong> Kyr BP. Radiocarbon<br />
46, 1059e1086.<br />
Keigwin, L.D., Donnelly, J.P., Cook, M.S., Driscoll, N.W., Brigham-Gr<strong>et</strong>te, J., 2006.<br />
Rapid sea-level rise and Holocene climate in the Chukchi Sea. Geology 34,<br />
861e864.<br />
King, J.W., Banerjee, S.K., Marvin, J., 1983. A new rock-magn<strong>et</strong>ic approach to<br />
selecting sediments for geomagn<strong>et</strong>ic p<strong>al</strong>eointensity studies: application to<br />
p<strong>al</strong>eointensity for the last 4000 years. Journ<strong>al</strong> <strong>of</strong> Geophysic<strong>al</strong> Research 88,<br />
5911e5921.<br />
Kirschvink, J.L., 1980. The least-squares line and plane and the an<strong>al</strong>ysis <strong>of</strong> p<strong>al</strong>eomagn<strong>et</strong>ic<br />
data. Geophysic<strong>al</strong> Journ<strong>al</strong> <strong>of</strong> the Roy<strong>al</strong> Astronomic<strong>al</strong> Soci<strong>et</strong>y 62,<br />
699e718.<br />
Korte, M., Constable, C.G., 2005. Continuous geomagn<strong>et</strong>ic field models for the past 7<br />
millennia: 2. CALS7K. Geochemistry, Geophysics, Geosystems 6 (Q02H16).<br />
doi:10.1029/2004GC000801.<br />
Korte, M., Genevey, A., Constable, C.-G., Frank, U., Schnepp, E., 2005. Continuous<br />
geomagn<strong>et</strong>ic field models for the past 7 millennia: 1. A new glob<strong>al</strong> data<br />
compilation. Geochemistry, Geophysics, Geosystems 6 (Q02H15). doi:10.1029/<br />
2004GC000800.<br />
Korte, M., Mandea, M., 2008. Magn<strong>et</strong>ic poles and dipole tilt variation over the past<br />
decades to millennia. Earth Plan<strong>et</strong>s and Space 60, 937e948.<br />
Ledu, D., Rochon, A., de Vern<strong>al</strong>, A., St-Onge, G., 2008. P<strong>al</strong>ynologic<strong>al</strong> evidence <strong>of</strong><br />
Holocene climate oscillations in the Eastern Arctic: a possible shift in the Arctic<br />
oscillation at the millenni<strong>al</strong> time sc<strong>al</strong>e. Canadian Journ<strong>al</strong> <strong>of</strong> Earth <strong>Sciences</strong> 45,<br />
1363e1375.<br />
Ledu, D., Rochon, A., de Vern<strong>al</strong>, A., St-Onge, G. Holocene p<strong>al</strong>eoceanography <strong>of</strong> the<br />
Northwest Passage, Canadian Arctic Archipelago: the possible ons<strong>et</strong> <strong>of</strong> an Arctic<br />
oscillation climate mode. Quaternary Science Reviews, in press.<br />
Lisé-Pronovost, A., St-Onge, G., Brachfeld, S., <strong>Barl<strong>et</strong>ta</strong>, F., Darby, D., 2009. P<strong>al</strong>eomagn<strong>et</strong>ic<br />
constraints on the Holocene stratigraphy <strong>of</strong> the Arctic Alaskan<br />
margin. Glob<strong>al</strong> and Plan<strong>et</strong>ary Change 68 (1e2), 85e99.<br />
Mazaud, A., 2005. User-friendly s<strong>of</strong>tware for vector an<strong>al</strong>ysis <strong>of</strong> the magn<strong>et</strong>ization <strong>of</strong><br />
long sediment cores. Geochemistry, Geophysics, Geosystems 6. doi:10.1029/<br />
2005GC001036.<br />
McKay, J.L., de Vern<strong>al</strong>, A., Hillaire-Marcel, C., Not, C., Polyak, L., Darby, D., 2008.<br />
Holocene fluctuations in Arctic sea-ice cover: dinocyst-based reconstructions<br />
for the eastern Chukchi Sea. Canadian Journ<strong>al</strong> <strong>of</strong> Earth <strong>Sciences</strong> 45, 1377e1397.<br />
McNeely, R., Dyke, A.S., Southon, J.R., 2006. Canadian Marine Reservoir Ages,<br />
Preliminary Data Assessment. Open File 5049. Geologic<strong>al</strong> Survey Canada,<br />
Ottawa.<br />
Newitt, L.R., Mandea, M., McKee, L.A., Orgev<strong>al</strong>, J.-J., 2002. Recent acceleration <strong>of</strong> the<br />
north magn<strong>et</strong>ic pole linked to magn<strong>et</strong>ic jerks. Eos, Transactions, American<br />
Geophysic<strong>al</strong> Union 83 (35), 381e389.<br />
P<strong>et</strong>ers, C., Thompson, R., 1998. Magn<strong>et</strong>ic identification <strong>of</strong> selected natur<strong>al</strong> iron<br />
oxides and sulfides. Journ<strong>al</strong> <strong>of</strong> Magn<strong>et</strong>ism and Magn<strong>et</strong>ic Materi<strong>al</strong>s 183,<br />
365e374.<br />
Polyak, L., Bisch<strong>of</strong>, J., Ortiz, J.D., Darby, D.A., Channell, J.E.T., Xuan, C., Kaufman, D.S.,<br />
Løvlie, R., Schneider, D., Adler, R., Council, E., 2009. Late Quaternary stratigraphy<br />
and sedimentation patterns in the western Arctic Ocean. Glob<strong>al</strong> and Plan<strong>et</strong>ary<br />
Change 68, 5e17.<br />
Reimer, P.J., Baillie, M.G.L., Bard, E., Bayliss, A., Beck, J.W., Bertrand, C., Blackwell, P.G.,<br />
Buck, C.E., Burr, G., Cutler, K.B., Damon, P.E., Edwards, R.L., Fairbanks, R.G.,<br />
Friedrich, M., Guilderson, T.P., Hughen, K.A., Kromer, B., McCormac, F.G.,<br />
Manning, S., BronkRamsey, C., Reimer, R.W., Remmele, S., Southon, J.R., Stuiver, M.,<br />
T<strong>al</strong>amo, S., Taylor, F.W., van der Plicht, J., Weyhenmeyer, C.E., 2004. IntC<strong>al</strong>04<br />
atmospheric radiocarbon age c<strong>al</strong>ibration, 26e0 ka BP. Radiocarbon 46,1026e1058.<br />
Rochon, A., Scott, D.B., Schell, T.M., Blasco, S., Benn<strong>et</strong>t, R., Mudie, P.J., 2006. Evolution<br />
<strong>of</strong> sea surface conditions during the Holocene: comparison b<strong>et</strong>ween Eastern<br />
(Baffin Bay and Hudson Strait) and Western (Beaufort Sea) Canadian Arctic. Eos,<br />
Transactions, American Geophysic<strong>al</strong> Union 87 (52) F<strong>al</strong>l Me<strong>et</strong>. Suppl. Abstract<br />
U43B-0867.<br />
Sagnotti, L., Roch<strong>et</strong>te, P., Jackson, M., Vadeboin, F., Dinarès-Turell, J., Winkler, A.,<br />
“Mag-N<strong>et</strong>” Science Team, 2003. Inter-laboratory c<strong>al</strong>ibration <strong>of</strong> low-field<br />
magn<strong>et</strong>ic and anhyster<strong>et</strong>ic susceptibility measurements. Physics <strong>of</strong> the Earth<br />
and Plan<strong>et</strong>ary Interiors 138, 25e38.<br />
Stoner, J.S., St-Onge, G., 2007. Magn<strong>et</strong>ic stratigraphy in p<strong>al</strong>eoceanography: revers<strong>al</strong>s,<br />
excursions, p<strong>al</strong>eointensity and secular variation. In: Hillaire-Marcel, C., de<br />
Vern<strong>al</strong>, A. (Eds.), Proxies in Late Cenozoic P<strong>al</strong>eoceanography. Elsevier, pp.<br />
99e137.<br />
St-Onge, G., Mulder, T., Francus, P., Long, B., 2007. Continuous physic<strong>al</strong> properties <strong>of</strong><br />
cored marine sediments. Developments in Marine Geology 1. doi:10.1016/<br />
S1572-5480(07)01007-X.<br />
St-Onge, G., Stoner, J.S., Hillaire-Marcel, C., 2003. Holocene p<strong>al</strong>eomagn<strong>et</strong>ic records<br />
from the St. Lawrence Estuary: centenni<strong>al</strong>- to millenni<strong>al</strong>-sc<strong>al</strong>e geomagn<strong>et</strong>ic<br />
modulation <strong>of</strong> cosmogenic isotopes. Earth and Plan<strong>et</strong>ary Science L<strong>et</strong>ters 209,<br />
113e130.<br />
Stuiver, M., Polach, H.A., 1977. Discussion: reporting <strong>of</strong> 14C data. Radiocarbon 19,<br />
355e363.<br />
Stuiver, M., Reimer, P.J., Reimer, R.W., 2005. CALIB 5.0 Available from:<br />
http://radiocarbon.pa.qub.ac.uk/c<strong>al</strong>ib/.<br />
Sugiura, N., 1979. ARM, TRM, and magn<strong>et</strong>ic interactions: concentration dependence.<br />
Earth and Plan<strong>et</strong>ary Science L<strong>et</strong>ters 42, 451e455.<br />
Tauxe, L., 1993. Sedimentary records <strong>of</strong> relative p<strong>al</strong>eointensity: theory and practice.<br />
Reviews <strong>of</strong> Geophysics 31, 319e354.<br />
Turner, G.M., 1987. A 5000 year geomagn<strong>et</strong>ic p<strong>al</strong>eosecular variation record from<br />
western Canada. Geophysic<strong>al</strong> Journ<strong>al</strong> Internation<strong>al</strong> 91 (1), 103e121.<br />
Weeks, R., Laj, C., Endignoux, L., Fuller, M., Roberts, A., Manganne, R., Blanchard, E.,<br />
Goree, W., 1993. Improvements in long-core measurement techniques: applications<br />
in p<strong>al</strong>aeomagn<strong>et</strong>ism and p<strong>al</strong>aeoceanography. Geophysic<strong>al</strong> Journ<strong>al</strong><br />
Internation<strong>al</strong> 114, 651e662.<br />
Xuan, C., Channell, J.E.T., 2010. Origin <strong>of</strong> apparent magn<strong>et</strong>ic excursions in deep-sea<br />
sediments from MendeleeveAlpha Ridge, Arctic ocean. Geochemistry,<br />
Geophysics, Geosystems 11 (Q02003). doi:10.1029/2009GC002879.<br />
Zijderveld, J.D.A., 1967. AC demagn<strong>et</strong>ization <strong>of</strong> rock: an<strong>al</strong>ysis <strong>of</strong> results. In:<br />
Collinson, D.W., Creer, K.M., Runcorn, S.K. (Eds.), M<strong>et</strong>hods in P<strong>al</strong>eomagn<strong>et</strong>ism.<br />
Elsevier, Amsterdam, pp. 254e286.