download
download
download

You also want an ePaper? Increase the reach of your titles
YUMPU automatically turns print PDFs into web optimized ePapers that Google loves.
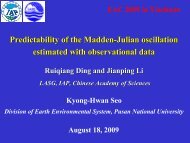
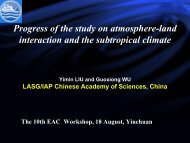
Contributions of Natural and Anthropogenic<br />
Forcings in Twentieth-Century Temperature Change:<br />
Results from the FGOALS_gl Coupled Model<br />
Wenmin MAN, Tianjun ZHOU<br />
Email: manwenmin@mail.iap.ac.cn<br />
C20C, Beijing, Oct. 26, 2010<br />
National Key Laboratory of Numerical modeling for Atmospheric Sciences and Geophysical Fluid Dynamics (LASG),<br />
Institute of Atmospheric Physics (IAP),Chinese(<br />
Academy of Sciences (CAS)
Outline<br />
1. Background & motivation<br />
2. Model & experiments<br />
3. Results<br />
4.Conclusions
Background<br />
• A project entitled “Numerical simulation of the last millennial<br />
climate change over China”, as one part of a NSFC Major<br />
Program entitled “Tree Ring and Millennial Climate Change<br />
Research in Chinese Domain”, granted by the National<br />
Natural Science Foundation of China (NSFC).<br />
• Motivation:<br />
How well does the model simulate the 20 th century warming
Motivation<br />
increasing GHG<br />
concentrations<br />
Three factors<br />
could contribute<br />
to the 20th<br />
century warming<br />
solar irradiance and<br />
volcanic activities<br />
natural internal climate<br />
variability<br />
The purpose of the present study is to evaluate the contributions of natural and<br />
anthropogenic forcings in the 20th century temperature change from the coupled<br />
climate model developed at LASG/IAP.
Framework of FGOALS_gl<br />
1*1 L30<br />
LICOM<br />
Ocean<br />
Atmosphere<br />
GAMIL (Low)<br />
(5*4 L26)<br />
Coupler<br />
Sea-ice<br />
Land<br />
5<br />
Zhou et al. 2007, AAS
Experiments<br />
Forcing data<br />
All‐Forcing<br />
(ALL)<br />
1881‐2004yr<br />
Natural‐Forcing<br />
(NAT)<br />
1881‐2004yr<br />
natural forcings: solar radiation、volcanic aerosols<br />
anthropogenic forcings: greenhouse gases、<br />
tropospheric sulfates<br />
natural forcings: solar radiation、volcanic aerosols<br />
Without the inclusion of anthropogenic forcings<br />
We use the HadCRUT3v observed surface temperature data to validate the<br />
model results.<br />
6
Global annual mean temperature series for the observation<br />
and model historical forcing run<br />
first warming<br />
around the 1940s<br />
recent warming<br />
after the 1970s<br />
Natural-forcing experiment clearly fails to reproduce the strong warming in the late<br />
twentieth century, although natural forcings appear to contribute significantly to the early<br />
twentieth-century warming.
Global mean surface temperature trends during three typical time<br />
periods over 1910‐1999yr<br />
OBS(℃/30a) ALL(℃/30a) NAT(℃/30a)<br />
1911‐1940 0.36 0.29 0.26<br />
1941‐1970 ‐0.07 ‐0.02 ‐0.15<br />
1971‐2000 0.48 0.34 0.06<br />
The warming of the early 20 th century could have resulted from natural forcings, however,<br />
anthropogenic forcings have played an important role on the later 20th century global warming.<br />
8
Surface temperature trends over the past 50yr and over the<br />
20th century (℃ per 100yr)<br />
‣Pronounced warming are seen<br />
over many northern middle- and<br />
high-latitude continental regions<br />
and a broad region of more gradual<br />
warming seen over the Indian<br />
Ocean, Australia, the eastern<br />
tropical Pacific, and South Atlantic.<br />
‣Observed warming trends are<br />
simulated realistically in the allforcing<br />
run.<br />
‣Natural-only forcing run shows<br />
cooling trend in most regions.
Definition of sub‐regions<br />
Northern<br />
Extratropics<br />
North<br />
Pacific<br />
U.S.<br />
U.S.<br />
U.S.<br />
North<br />
Atlantic<br />
China<br />
China<br />
North<br />
Pacific<br />
Tropical East<br />
Pacific<br />
Indian Ocean/Western<br />
Pacific Warm Pool<br />
Indian Ocean/Western Pacific<br />
Warm Pool<br />
Tropics<br />
Southern<br />
Extratropics
Land‐ and hemispheric‐ scale surface temperature evolutions<br />
The warming on the land- and hemispheric- scale in the all-forcing experiment generally<br />
parallels the global average, also with the natural-forcing run fails to reproduce the strong<br />
warming in the last half of the century.
Regional‐scale surface temperature evolutions<br />
The warming signal has emerged rather monotonically in the Indian Ocean/western Pacific<br />
region during the past century.<br />
The tropical eastern Pacific、North Pacific and North Atlantic are regions where the<br />
warming signal appears to emerge from a background of more substantial multidecadal<br />
variability.
Contributions of natural and anthropogenic forcings<br />
—expressed by ratio of explainable variance<br />
Globalland<br />
Globalocean<br />
Northern<br />
extratropics<br />
Southern<br />
extratropics<br />
Indian<br />
Ocean/Western<br />
Pacific Warm Pool<br />
Tropical<br />
Eastern<br />
Pacific<br />
N.<br />
Pacific<br />
N.<br />
Atlantic<br />
NAT 7.4% 1.6% 27.3% 26.1% 1.1% 0.4% 8.0% 18.9%<br />
Athro 76.6% 70.2% 61.5% 48.0% 76.7% 41.1% 47.2% 6.5%<br />
For land and hemispheric means, external forcings could explain most of the variance.<br />
Contributions from internal variability are larger than from external forcings in the tropical<br />
eastern Pacific and North Atlantic region .<br />
13
Annual mean temperature series over China<br />
The reproducibility of the SAT averaged over China is lower than that of the global and<br />
hemispheric averages, but it is still acceptable.<br />
The model could not successfully produce the reconstructed warming over China in the 1920s.
Observed and simulated surface temperature trends over<br />
China (℃ per 100yr)<br />
‣All-forcing experiment<br />
could generally reproduce<br />
the warming trend over<br />
East China.<br />
‣Natural-forcing run<br />
shows cooling trend over<br />
East China.
Seasonal evolution of surface temperature trends over East<br />
China during the last 50 years<br />
warming trend<br />
in DJF &MAM<br />
cooling trend<br />
in JJA
Conclusions<br />
1) The simulations support previous findings that twentieth-century global<br />
warming has resulted from a combination of natural and anthropogenic<br />
forcing, with anthropogenic forcing being the dominant cause of the<br />
pronounced late twentieth-century warming.<br />
2) For global and hemispheric means,external forcings could explain most<br />
of the variance. Contributions from internal variability are larger than from<br />
external forcings in the tropical eastern Pacific and North Atlantic region,<br />
where internal variability may dominate.<br />
3) The reproducibility of the SAT averaged over China is lower than that of the<br />
global and hemispheric averages, but it is still acceptable..
Zonal mean surface temperature changes over 1881‐2004yr
Global average SAT in CMIP3 Models<br />
Cor=0.87<br />
Zhou and Yu, 2006, J. Climate