Atomic spectroscopy and fine structure of hydrogen, Due date
Atomic spectroscopy and fine structure of hydrogen, Due date
Atomic spectroscopy and fine structure of hydrogen, Due date

You also want an ePaper? Increase the reach of your titles
YUMPU automatically turns print PDFs into web optimized ePapers that Google loves.
<strong>Atomic</strong>, molecular <strong>and</strong> laser physics. Assignment 4<br />
Assignment 4: <strong>Atomic</strong> <strong>spectroscopy</strong> <strong>and</strong> <strong>fine</strong> <strong>structure</strong> <strong>of</strong> <strong>hydrogen</strong><br />
1. An electron in the H atom is in the n = 3, l = 0, m = 0 state. It decays to the ground<br />
states. What decay routes are open to it<br />
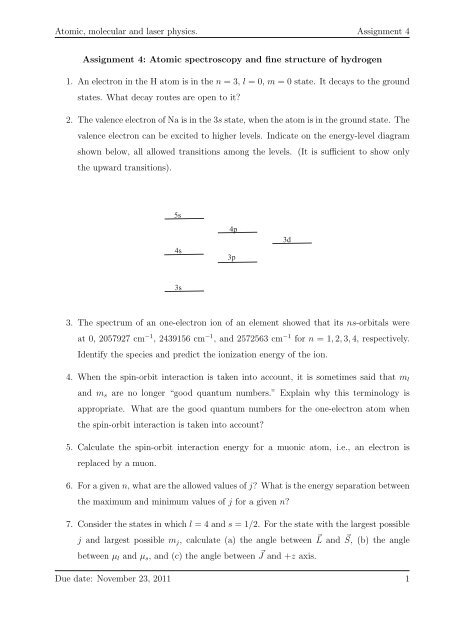
2. The valence electron <strong>of</strong> Na is in the 3s state, when the atom is in the ground state. The<br />
valence electron can be excited to higher levels. Indicate on the energy-level diagram<br />
shown below, all allowed transitions among the levels. (It is sufficient to show only<br />
the upward transitions).<br />
5s<br />
4s<br />
4p<br />
3p<br />
3d<br />
3s<br />
3. The spectrum <strong>of</strong> an one-electron ion <strong>of</strong> an element showed that its ns-orbitals were<br />
at 0, 2057927 cm −1 , 2439156 cm −1 , <strong>and</strong> 2572563 cm −1 for n = 1, 2, 3, 4, respectively.<br />
Identify the species <strong>and</strong> predict the ionization energy <strong>of</strong> the ion.<br />
4. When the spin-orbit interaction is taken into account, it is sometimes said that m l<br />
<strong>and</strong> m s are no longer “good quantum numbers.” Explain why this terminology is<br />
appropriate. What are the good quantum numbers for the one-electron atom when<br />
the spin-orbit interaction is taken into account<br />
5. Calculate the spin-orbit interaction energy for a muonic atom, i.e., an electron is<br />
replaced by a muon.<br />
6. For a given n, what are the allowed values <strong>of</strong> j What is the energy separation between<br />
the maximum <strong>and</strong> minimum values <strong>of</strong> j for a given n<br />
7. Consider the states in which l = 4 <strong>and</strong> s = 1/2. For the state with the largest possible<br />
j <strong>and</strong> largest possible m j , calculate (a) the angle between L ⃗ <strong>and</strong> S, ⃗ (b) the angle<br />
between µ l <strong>and</strong> µ s , <strong>and</strong> (c) the angle between J ⃗ <strong>and</strong> +z axis.<br />
<strong>Due</strong> <strong>date</strong>: November 23, 2011 1
<strong>Atomic</strong>, molecular <strong>and</strong> laser physics. Assignment 4<br />
8. Evaluate the following commutators: (a) [L · S, L], (b) [L · S, S], (c) [L · S, J], (d)<br />
[L · S, L 2 ], (e) [L · S, S 2 ], (f) [L · S, J 2 ], where L, S <strong>and</strong> J are representing orbital, spin<br />
<strong>and</strong> total angular momentum respectively. Hint: L <strong>and</strong> S satisfy the fundamental<br />
commutation relations for angular momentum, but they commute with each other.<br />
9. The most prominent feature <strong>of</strong> the <strong>hydrogen</strong> spectrum in the visible region is the red<br />
Balmer line, coming from the transition n = 3 to n = 2. First <strong>of</strong> all, determine the<br />
wavelength <strong>and</strong> frequency <strong>of</strong> this line, according to the Bohr theory. Fine <strong>structure</strong><br />
splits this line into several closely spaced lines; the question is: How many, <strong>and</strong> what<br />
is their spacing Hint: First determine how many sublevels the n = 2 splits into,<br />
<strong>and</strong> find Efs 1 for each <strong>of</strong> these, in eV. Then do the same for n = 3. Draw an energy<br />
level diagram showing all possible transitions from n = 3 to n = 2. The energy<br />
released (in the form <strong>of</strong> a photon) is E 3 − E 2 +∆E, the first part being common to<br />
all <strong>of</strong> them, <strong>and</strong> the ∆E (due to <strong>fine</strong> <strong>structure</strong>) varying from one transition to the<br />
next. Fine ∆E (in eV) for each transition. Finally, convert to photon frequency,<br />
<strong>and</strong> determine the spacing between adjacent spectral lines (in Hz)−not the frequency<br />
interval between each line <strong>and</strong> the unperturbed line (which is, <strong>of</strong> course, unobservable),<br />
but the frequency interval between each line <strong>and</strong> the next one.<br />
<strong>Due</strong> <strong>date</strong>: November 23, 2011 2