Ontario Transmission System - November 2012 - IESO
Ontario Transmission System - November 2012 - IESO
Ontario Transmission System - November 2012 - IESO

You also want an ePaper? Increase the reach of your titles
YUMPU automatically turns print PDFs into web optimized ePapers that Google loves.
<strong>IESO</strong>_REP_0265v22.0<br />
<strong>Ontario</strong> <strong>Transmission</strong> <strong>System</strong><br />
<strong>Ontario</strong> <strong>Transmission</strong> <strong>System</strong><br />
<strong>IESO</strong>_REP_0265v22.0 Public <strong>November</strong> 23, <strong>2012</strong>
<strong>IESO</strong>_REP_0265v22.0<br />
<strong>Ontario</strong> <strong>Transmission</strong> <strong>System</strong><br />
Caution and Disclaimer<br />
The contents of these materials are for discussion and information purposes and are provided “as is”<br />
without representation or warranty of any kind, including without limitation, accuracy, completeness or<br />
fitness for any particular purpose. The Independent Electricity <strong>System</strong> Operator (<strong>IESO</strong>) assumes no<br />
responsibility to you or any third party for the consequences of any errors or omissions. The <strong>IESO</strong> may<br />
revise these materials at any time in its sole discretion without notice to you. Although every effort will<br />
be made by the <strong>IESO</strong> to update these materials to incorporate any such revisions it is up to you to ensure<br />
you are using the most recent version.
<strong>IESO</strong>_REP_0265v22.0<br />
<strong>Ontario</strong> <strong>Transmission</strong> <strong>System</strong><br />
Table of Contents<br />
<strong>Ontario</strong> <strong>Transmission</strong> <strong>System</strong> ........................................................................... i<br />
Table of Contents ............................................................................................ iii<br />
1.0 Introduction ......................................................................................... 1<br />
2.0 <strong>Transmission</strong> Zones .............................................................................. 2<br />
2.1 Zone Characteristics .................................................................................................... 2<br />
3.0 <strong>Transmission</strong> Interfaces ....................................................................... 5<br />
3.1 Interface Definitions .................................................................................................... 5<br />
3.2 Interface Characteristics .............................................................................................. 5<br />
3.3 Interface Capability Limits ........................................................................................... 7<br />
4.0 <strong>Transmission</strong> Interconnections .......................................................... 13<br />
4.1 Interconnection Definitions ........................................................................................ 13<br />
4.2 Interconnection Characteristics .................................................................................. 13<br />
4.3 Interconnection Flow Limits ....................................................................................... 17<br />
List of Tables<br />
Table 3.3 Interface Base Limits ............................................................................................................ 7<br />
Table 4.3 Interconnection Total Transfer Capability (TTC) Limits.......................................................... 18<br />
List of Figures<br />
Figure 2.1.1 Geographical Zones in <strong>Ontario</strong>’s Power <strong>Transmission</strong> <strong>System</strong> .............................................. 4<br />
Figure 3.3.1 <strong>Ontario</strong>’s Major Internal <strong>Transmission</strong> Interfaces ................................................................ 8<br />
Figure 3.3.2 One Year Rolling (Nov. 2011 – Nov. <strong>2012</strong>) Historical Flow Distribution - Interfaces .............. 9<br />
Figure 4.3.1 <strong>Ontario</strong>’s Points of Interconnection with Neighbouring Areas ............................................. 19<br />
Figure 4.3.2 <strong>Ontario</strong>’s Zones, Interfaces and Interconnections ............................................................. 20<br />
Figure 4.3.3 One Year Rolling (Nov. 2011 – Nov. <strong>2012</strong>) Historical Flow Distribution - Interconnections ... 21
1.0 Introduction <strong>IESO</strong>_REP_0265v22.0<br />
<strong>Ontario</strong> <strong>Transmission</strong> <strong>System</strong><br />
1.0 Introduction<br />
The <strong>Ontario</strong> Electricity Market Rules (Chapter 5) require that the Independent Electricity <strong>System</strong><br />
Operator (<strong>IESO</strong>) provide forecasts and assessments of the reliability of the existing and committed<br />
resources and transmission facilities of the <strong>Ontario</strong> Market. These forecasts and assessments of the<br />
<strong>Ontario</strong> Electricity <strong>System</strong> are contained in the <strong>IESO</strong> 18-Month Outlook, which is released quarterly.<br />
The <strong>Ontario</strong> <strong>Transmission</strong> <strong>System</strong> document is intended to complement the transmission assessments<br />
contained in the 18-Month Outlook by providing specific details on the <strong>Ontario</strong> transmission system,<br />
including the transfer capabilities of major internal transmission interfaces and interconnections with<br />
neighbouring jurisdictions. Unless indicated otherwise, these transfer capabilities are representative of<br />
both the present transfer capability as well as the anticipated transfer capability during the time horizon<br />
of this Outlook.<br />
This document is published twice a year in the second and fourth quarters, alongside the 18-Month<br />
Outlook, and is organized in three sections:<br />
The first section discusses the geographical zones of the power transmission system in <strong>Ontario</strong>. The<br />
primary characteristics of each zone are summarized.<br />
The second section discusses <strong>Ontario</strong>’s major internal transmission interfaces. Transfer capability limits of<br />
each interface are provided. The historical flow distribution on each interface during the previous twelve<br />
months is provided in graphical format.<br />
The third section discusses <strong>Ontario</strong>’s transmission interconnections with neighbouring jurisdictions.<br />
Transfer capability limits of each interconnection are provided. The historical flow distribution on each<br />
interconnection during the previous twelve months is provided in graphical format.<br />
Readers are invited to provide comments and/or suggestions on this document. To do so, please contact<br />
us at:<br />
Toll Free: 1‐888‐448‐7777<br />
Tel: 905‐403‐6900<br />
Fax: 905‐403‐6921<br />
E‐mail: customer.relations@ieso.ca.<br />
- End of Section -<br />
<strong>November</strong> 23, <strong>2012</strong> Public Page 1
2.0 <strong>Transmission</strong> Zones <strong>IESO</strong>_REP_0265v22.0<br />
<strong>Ontario</strong> <strong>Transmission</strong> <strong>System</strong><br />
2.0 <strong>Transmission</strong> Zones<br />
The <strong>Ontario</strong> transmission system is mainly comprised of a 500 kV transmission network, a 230 kV<br />
transmission network, and several 115 kV transmission networks. It is divided into ten zones whose<br />
characteristics are described in Section 2.1. Zonal boundaries have been chosen to correspond with the<br />
major interfaces described in Section 3.0. Figure 2.1.1 shows the geographical zones in <strong>Ontario</strong>’s power<br />
transmission system.<br />
2.1 Zone Characteristics<br />
Bruce Zone<br />
• The total resources are much greater than the zone peak demand.<br />
• The generation is mostly nuclear with some wind.<br />
East Zone<br />
• The total resources exceed the zone peak demand.<br />
• The generation is a mix of hydroelectric, oil, gas, and some wind.<br />
• The zone is connected to the Quebec grid via ties that are used to switch load or generation radially<br />
onto either system.<br />
• The zone is also connected to the St. Lawrence interface with New York via phase angle regulator<br />
control.<br />
Essa Zone<br />
• The total resources are much less than the zone peak demand.<br />
• The generation is totally hydroelectric.<br />
• For analytical purposes, Des Joachims generation and load, which is physically located in the East<br />
zone, has been modelled to be part of the Essa zone.<br />
Niagara Zone<br />
• The total resources are much higher than the zone peak demand.<br />
• The generation is mostly hydroelectric with some gas.<br />
• There is a free-flowing interconnection with New York.<br />
Northeast Zone<br />
• The total resources exceed the zone peak demand.<br />
• The generation is mainly hydroelectric with some cogeneration, wind, and wood waste.<br />
• Two 115 kV circuits connect radially to Quebec.<br />
<strong>November</strong> 23, <strong>2012</strong> Public Page 2
2.0 <strong>Transmission</strong> Zones <strong>IESO</strong>_REP_0265v22.0<br />
<strong>Ontario</strong> <strong>Transmission</strong> <strong>System</strong><br />
Northwest Zone<br />
• The total resources generally exceed the zone peak demand.<br />
• The generation is mainly hydroelectric with some coal gas, wind and biomass.<br />
• The zone is connected to the Manitoba and Minnesota systems.<br />
• The 230 kV Manitoba interconnections and the Minnesota 115 kV interconnection are controlled by<br />
phase angle regulators. The Manitoba 115 kV interconnection is radial.<br />
Ottawa Zone<br />
• The total resources are much less than the zone peak demand.<br />
• The generation is cogeneration.<br />
• The interconnections with Quebec consist of two 115 kV circuits and five 230 kV circuits. Two of the<br />
230 kV circuits connect <strong>Ontario</strong> and Quebec via bidirectional back-to-back HVDC converters located<br />
at Outaouais in Quebec.<br />
Southwest Zone<br />
• The total resources are generally balanced with the zone peak demand.<br />
• The generation is mostly coal with some wind.<br />
Toronto Zone<br />
• The total resources are less than the zone peak demand.<br />
• The generation is mostly nuclear with some gas.<br />
West Zone<br />
• The total resources generally exceed the zone peak demand.<br />
• The generation is mostly coal and gas with some wind.<br />
• The zone is connected to the Michigan system via two 230/345 kV circuits, one 230/115 kV circuit, and<br />
one 230 kV circuit. All four circuits have in-service phase angle regulators.<br />
<strong>November</strong> 23, <strong>2012</strong> Public Page 3
2.0 <strong>Transmission</strong> Zones <strong>IESO</strong>_REP_0265v22.0<br />
<strong>Ontario</strong> <strong>Transmission</strong> <strong>System</strong><br />
Figure 2.1.1 Geographical Zones in <strong>Ontario</strong>’s Power <strong>Transmission</strong> <strong>System</strong><br />
James Bay<br />
Abitibi River<br />
Moose<br />
River<br />
MANITOBA<br />
Red Lake<br />
Trout Lake<br />
Lake St. Joseph<br />
Albany River<br />
Lac Seul<br />
NORTHWEST<br />
Mattagami River<br />
Sioux Lookout<br />
Lake of<br />
the Woods<br />
Fort<br />
Frances<br />
NORTHWEST<br />
Lake<br />
Nipigon<br />
Geraldton<br />
Manitouwadge<br />
Wawa<br />
Timmins<br />
MINNESOTA<br />
Thunder Bay<br />
UNITED STATES<br />
Lake<br />
Superior<br />
CANADA<br />
Wawa<br />
Lake<br />
Superior<br />
Lake Timiskaming<br />
QUEBEC<br />
NORTHEAST<br />
Sault Ste. Marie<br />
Sudbury<br />
Lake Nipissing North Bay<br />
Ottawa River<br />
OTTAWA<br />
Georgian Bay<br />
Ottawa<br />
Lake Huron<br />
BRUCE<br />
Owen<br />
Sound<br />
Lake Simcoe<br />
Barrie<br />
ESSA<br />
Peterborough<br />
EAST<br />
Kingston<br />
Brockville<br />
St Lawrence River<br />
Orangeville<br />
Belleville<br />
MICHIGAN<br />
SOUTHWEST<br />
Kitchener<br />
Hamilton<br />
TORONTO<br />
Lake <strong>Ontario</strong><br />
CANADA<br />
UNITED STATES<br />
Sarnia<br />
London<br />
NIAGARA<br />
WEST<br />
Windsor<br />
Chatham<br />
CANADA<br />
Lake Erie<br />
UNITED STATES<br />
NEW YORK<br />
- End of Section -<br />
<strong>November</strong> 23, <strong>2012</strong> Public Page 4
3.0 <strong>Transmission</strong> Interfaces <strong>IESO</strong>_REP_0265v22.0<br />
<strong>Ontario</strong> <strong>Transmission</strong> <strong>System</strong><br />
3.0 <strong>Transmission</strong> Interfaces<br />
There are nine major internal interfaces in the <strong>Ontario</strong> transmission system. The characteristics of each<br />
interface are described in Section 3.2. Figures 3.3.1 provides a geographic depiction of <strong>Ontario</strong>’s internal<br />
transmission zones and major transmission interfaces. Operating security limits for these interfaces are<br />
also included in Figure 3.3.1 as well as in Table 3.3. The interface limits are used to ensure system and/or<br />
plant stability, acceptable pre-contingency and post-contingency voltage levels, and/or acceptable<br />
thermal loading levels.<br />
Detailed information on interface definitions and limits can be found in <strong>IESO</strong> <strong>System</strong> Control Orders<br />
(SCOs). The release of SCO limit related information to market participants will be considered by the<br />
<strong>IESO</strong> on a need to know and case by case basis. Requests for further information should be directed to the<br />
<strong>IESO</strong> Customer Relations.<br />
3.1 Interface Definitions<br />
Interfaces are defined by grouping one or more lines for the purpose of measuring their combined flow<br />
and enforcing a power flow limit or, as it is more commonly called, an interface limit. Interface limits are<br />
directional and interfaces may have limits imposed in one or both directions.<br />
3.2 Interface Characteristics<br />
The EWTE/EWTW Interface<br />
The East-West Transfer East (EWTE) and East-West Transfer West (EWTW) flows are functionally related<br />
to the power flows between <strong>Ontario</strong> and Manitoba, and <strong>Ontario</strong> and Minnesota. In this relationship, the<br />
<strong>Ontario</strong> – Manitoba and <strong>Ontario</strong> – Minnesota flows can be generally thought of as the independent<br />
variables as they are under phase angle regulator control and can be adjusted to permit increased EWTE<br />
or EWTW flows.<br />
The maximum limits on the East-West tie are 325 MW to the east and 350 MW to the west. The EWTE and<br />
EWTW interfaces are constrained by voltage and stability limitations. A sample of historical flow<br />
distribution on the East West Interface is shown in Figure 3.3.2.<br />
The FN/FS Interface<br />
The Flow South (FS) limit is 1,550 MW and the Flow North (FN) limit is 1,900 MW. The Flow North and<br />
Flow South interfaces are constrained by voltage and stability limits respectively. A sample of historical<br />
flow distribution on the FN/FS interface is shown in Figure 3.3.2.<br />
The CLAN/CLAS Interface<br />
The Claireville North (CLAN) limit is 2,000 MW and the Claireville South (CLAS) limit is 1,000 MW.<br />
These limits have been defined to determine the boundary conditions for which the other system limits,<br />
in particular FABCW, are valid. A sample of historical flow distribution on the CLAN/CLAS interface is<br />
shown in Figure 3.3.2.<br />
<strong>November</strong> 23, <strong>2012</strong> Public Page 5
3.0 <strong>Transmission</strong> Interfaces <strong>IESO</strong>_REP_0265v22.0<br />
<strong>Ontario</strong> <strong>Transmission</strong> <strong>System</strong><br />
The FABCW Interface<br />
Flow Away from Bruce Complex plus Wind (FABCW) is the sum of power flows away from the Bruce<br />
Complex plus the power output from the wind farms near the Bruce zone. The limit depends on the<br />
number of Bruce units in service, the BLIP/NBLIP interface flow, the sum of the QFW interface flow and<br />
the output of Nanticoke generating station, as well as a number of other system parameters. The FABCW<br />
limit is required for preserving system and/or plant transient stability and to protect against postcontingency<br />
voltage collapse in Southwestern <strong>Ontario</strong>. Separate stability and voltage limits are defined<br />
for each recognized contingency. The FABCW interface limit is 6,650 MW based on the most restrictive<br />
contingency with all eight Bruce units in service. The unavailability of transmission elements and other<br />
system parameters such as reactive support provided from major generating stations and reactor<br />
switching may result in a lower limit.<br />
The FABCW limit can be improved through the use of generation rejection (G/R) of Bruce 500 kV units.<br />
The resulting limit improvements with G/R are not specified in this document, but are described in detail<br />
in the appropriate SCO.<br />
A sample of historical flow distribution on the FABCW interface is shown in Figure 3.3.2.<br />
The BLIP/NBLIP Interface<br />
The Buchanan Longwood Input (BLIP) interface is limited to 2,800 MW to the west due to stability and<br />
voltage limitations. Previously the limit was 3,000 MW, but the BLIP limit was reduced by 200 MW as a<br />
result of the Southwest limit study to increase the FABCW limit to 6,650 MW. The Negative Buchanan<br />
Longwood Input (NBLIP) interface limit is a function of a variety of parameters, but is normally about<br />
1,500 MW. The interface is typically constrained by voltage limitations. A sample of historical flow<br />
distribution on the BLIP interface is shown in Figure 3.3.2.<br />
The QFW Interface<br />
The Queenston Flow West (QFW) interface is limited to approximately 2,080 MW for flows to the west in<br />
the winter. In the summer, the limit is approximately 1,780 MW to the west. This interface could be<br />
constrained by thermal limitations. There is no limit specified for flows to the east (towards New York),<br />
as the level of flows expected in that direction will not cause system concerns. A sample of historical flow<br />
distribution on the QFW interface is shown in Figure 3.3.2.<br />
The FETT Interface<br />
The Flow East Towards Toronto (FETT) interface limit was defined to prevent voltage collapse in the<br />
Toronto Area. Based on historical and expected flows, it was determined that the FETT interface is no<br />
longer limiting under normal conditions. As a result, the FETT interface limit becomes a boundary<br />
condition for which the other Southern <strong>Ontario</strong> limits are valid. The limit of this interface is 5,000 MW,<br />
which is increased from the previous limit of 4,500 MW as a result of further analysis in the Southwest<br />
limit study.<br />
There is no limit specified for flows to the west, as the current level of flows expected in that direction is<br />
low. A sample of historical flow distribution on the FETT interface is shown in Figure 3.3.2.<br />
The TEC Interface<br />
The Transfer East from Cherrywood (TEC) interface does not have a predefined limit for up to any one<br />
single element out of service. The TEC interface is included to provide a boundary between the Toronto<br />
<strong>November</strong> 23, <strong>2012</strong> Public Page 6
3.0 <strong>Transmission</strong> Interfaces <strong>IESO</strong>_REP_0265v22.0<br />
<strong>Ontario</strong> <strong>Transmission</strong> <strong>System</strong><br />
and East transmission zones. With these zones defined, specific studies can be conducted to consider the<br />
impact of varying resource dispatch scenarios on reliability.<br />
The FIO Interface<br />
With the addition of the new interconnection between <strong>Ontario</strong> and Quebec, the Flow Into Ottawa (FIO)<br />
interface is limited to 2,900 MW to control pre-contingency and post-contingency voltage instability in the<br />
Ottawa zone. There is no limit specified on this interface for flows to the East zone. Under certain<br />
conditions, the FIO limit can be improved with the use of load rejection in the Ottawa zone. A sample of<br />
the historical flow distribution on the FIO interface is shown in Figure 3.3.2.<br />
3.3 Interface Capability Limits<br />
Table 3.3 summarizes the base limits for the major interfaces in <strong>Ontario</strong>; normal system (all transmission<br />
elements in service) limits under normal conditions are shown.<br />
Note that some limits are simple constants (e.g. BLIP, FETT) whereas others are more complicated and<br />
may depend on parameters such as status of specific generator units, other transmission flows, <strong>Ontario</strong><br />
demand, etc. (e.g. NBLIP, FABCW). In cases where interface limits are based on thermal capability,<br />
separate ratings are shown for summer and winter conditions.<br />
Table 3.3 Interface Base Limits<br />
Interface Operating Security Limits (MW)<br />
BLIP 2,800<br />
NBLIP 1,500<br />
QFW 1,780 Summer, 2,080 Winter<br />
FABCW 6,540 to 6,650 up to eight Bruce units in service*<br />
FETT 5,000 **<br />
CLAN 2,000<br />
CLAS 1,000<br />
FIO 2,900<br />
FN 1,900<br />
FS 1,550<br />
EWTE 325<br />
EWTW 350<br />
Summer Limits apply from May 1 to October 31. Winter Limits apply from <strong>November</strong> 1 to April 30.<br />
(*) FABCW limit varies according to BLIP flow and QFWN (QFW plus Nanticoke) flow.<br />
For each recognized contingency, separate voltage and stability limit ranges are defined.<br />
Published limit range based on the most restrictive contingency under optimal Bruce <strong>System</strong> Conditions in SCO-<br />
South Tab1.<br />
Lower limit based on NBLIP @ 1500MW and QFWN @ 4000MW.<br />
Upper limit based on BLIP @ 3000MW and QFWN @ 4000MW.<br />
(**) FETT is a fixed boundary condition limit.<br />
<strong>November</strong> 23, <strong>2012</strong> Public Page 7
3.0 <strong>Transmission</strong> Interfaces <strong>IESO</strong>_REP_0265v22.0<br />
<strong>Ontario</strong> <strong>Transmission</strong> <strong>System</strong><br />
Figure 3.3.1 <strong>Ontario</strong>’s Major Internal <strong>Transmission</strong> Interfaces<br />
James Bay<br />
Abitibi<br />
River<br />
Moose<br />
River<br />
MANITOBA<br />
Red<br />
Lake<br />
Trout<br />
Lake<br />
Lac<br />
Seul<br />
Lake St.<br />
Joseph<br />
Albany<br />
River<br />
NORTHWEST<br />
Mattagami<br />
River<br />
Lake<br />
the of<br />
Woods<br />
Fort<br />
Frances<br />
Sioux Lookout<br />
NORTHWEST<br />
Lake<br />
Nipigon<br />
Geraldton<br />
Manitouwadge<br />
EWTW<br />
Lake<br />
Superior<br />
Wawa<br />
EWTE<br />
Sault Ste. Marie<br />
Timmins<br />
NORTHEAST<br />
MW<br />
EWTE 325<br />
EWTW 350<br />
CLAN 2,000<br />
CLAS 1,000<br />
FN 1,900<br />
FS 1,550<br />
Sudbury<br />
MINNESOTA<br />
Lake<br />
Timiskaming<br />
Lake Nipissing North Bay<br />
Thunder Bay<br />
UNITED STATES<br />
Lake<br />
Superior<br />
QUEBEC<br />
MW<br />
CANADA<br />
TEC normally not limiting<br />
FIO 2,900<br />
EWTW<br />
EWTE<br />
Wawa<br />
MICHIGAN<br />
MW<br />
BLIP 2,800<br />
NBLIP 1,500<br />
FABCW<br />
6,540 to 6,650 up to eight Bruce<br />
units in service*<br />
Lake Huron<br />
BRUCE<br />
Georgian Bay<br />
Owen<br />
Sound<br />
FABCW<br />
FN<br />
ESSA<br />
FS<br />
Lake Simcoe<br />
Barrie<br />
CLAN<br />
Peterborough<br />
TEC<br />
Belleville<br />
EAST<br />
FIO<br />
Kingston<br />
OTTAWA<br />
Ottawa<br />
Brockville<br />
Ottawa<br />
River<br />
St Lawrence<br />
River<br />
Windsor<br />
Sarnia<br />
BLIP<br />
WEST<br />
Chatham<br />
London<br />
Orangeville<br />
Kitchener<br />
SOUTHWEST<br />
FETT<br />
NBLIP<br />
CANADA<br />
Lake<br />
Erie<br />
UNITED<br />
STATES<br />
QFW<br />
TORONTO<br />
CLAS<br />
Hamilton<br />
Toronto<br />
Niagara Falls<br />
NIAGARA<br />
FETT<br />
Lake <strong>Ontario</strong><br />
CANADA<br />
UNITED<br />
STATES<br />
NEW YORK<br />
MW<br />
5,000 MW<br />
QFW w inter 2,080 MW<br />
QFW summer 1,780 MW<br />
Notes to Figure 3.3.1:<br />
1. Tables indicate interface base limits (all transmission elements in service).<br />
2. FABCW = FABC + MW Output of Wind Farms near Bruce Zone<br />
<strong>November</strong> 23, <strong>2012</strong> Public Page 8
3.0 <strong>Transmission</strong> Interfaces <strong>IESO</strong>_REP_0265v22.0<br />
<strong>Ontario</strong> <strong>Transmission</strong> <strong>System</strong><br />
Figure 3.3.2 One Year Rolling (Nov. 2011 – Nov. <strong>2012</strong>) Historical Flow Distribution - Interfaces<br />
7500<br />
FABCW Nov. 1, 2011 to Nov. 1, <strong>2012</strong><br />
6500<br />
5500<br />
FABCW (MW)<br />
4500<br />
3500<br />
FABCW Limit<br />
FABCW Flow<br />
2500<br />
1500<br />
0 10 20 30 40 50 60 70 80 90 100<br />
percentage of time (%)<br />
FN and FS Nov. 1, 2011 to Nov. 1, <strong>2012</strong><br />
2500<br />
2000<br />
FN Limit<br />
1500<br />
1000<br />
FN (MW)<br />
500<br />
0<br />
-500<br />
0 10 20 30 40 50 60 70 80 90 100<br />
-1000<br />
-1500<br />
-2000<br />
FS Limit<br />
percentage of time (%)<br />
<strong>November</strong> 23, <strong>2012</strong> Public Page 9
3.0 <strong>Transmission</strong> Interfaces <strong>IESO</strong>_REP_0265v22.0<br />
<strong>Ontario</strong> <strong>Transmission</strong> <strong>System</strong><br />
EWTW and EWTE Nov. 1, 2011 to Nov. 1, <strong>2012</strong><br />
400<br />
300<br />
EWTE Limit<br />
200<br />
EWTE (MW)<br />
100<br />
0<br />
-100<br />
-200<br />
0 10 20 30 40 50 60 70 80 90 100<br />
-300<br />
EWTW Limit<br />
-400<br />
2500<br />
2000<br />
percentage of time (%)<br />
CLAN and CLAS Nov. 1, 2011 to Nov. 1, <strong>2012</strong><br />
CLAN Limit<br />
1500<br />
CLAN (MW)<br />
1000<br />
500<br />
0<br />
-500<br />
0 10 20 30 40 50 60 70 80 90 100<br />
-1000<br />
CLAS Limit<br />
-1500<br />
percentage of time (%)<br />
<strong>November</strong> 23, <strong>2012</strong> Public Page 10
3.0 <strong>Transmission</strong> Interfaces <strong>IESO</strong>_REP_0265v22.0<br />
<strong>Ontario</strong> <strong>Transmission</strong> <strong>System</strong><br />
3500<br />
BLIP and NBLIP Nov. 1, 2011 to Nov. 1, <strong>2012</strong><br />
3000<br />
BLIP Limit<br />
BLIP (MW)<br />
2500<br />
2000<br />
1500<br />
1000<br />
500<br />
0<br />
-500<br />
0 10 20 30 40 50 60 70 80 90 100<br />
-1000<br />
-1500<br />
-2000<br />
NBLIP Limit<br />
percentage of time (%)<br />
QFW Nov. 1, 2011 to Nov. 1, <strong>2012</strong><br />
2500<br />
2000<br />
1500<br />
QFW Winter Limit<br />
QFW Summer Limit<br />
QFW (MW)<br />
1000<br />
500<br />
0<br />
0 10 20 30 40 50 60 70 80 90 100<br />
-500<br />
-1000<br />
percentage of time (%)<br />
<strong>November</strong> 23, <strong>2012</strong> Public Page 11
3.0 <strong>Transmission</strong> Interfaces <strong>IESO</strong>_REP_0265v22.0<br />
<strong>Ontario</strong> <strong>Transmission</strong> <strong>System</strong><br />
6000<br />
FETT Nov. 1, 2011 to Nov. 1, <strong>2012</strong><br />
5000<br />
FETT Limit<br />
4000<br />
3000<br />
FETT (MW)<br />
2000<br />
1000<br />
0<br />
-1000<br />
0 10 20 30 40 50 60 70 80 90 100<br />
-2000<br />
percentage of time (%)<br />
FIO Nov. 1, 2011 to Nov. 1, <strong>2012</strong><br />
3500<br />
3000<br />
FIO Limit<br />
2500<br />
2000<br />
FIO (MW)<br />
1500<br />
1000<br />
500<br />
0<br />
-500<br />
0 10 20 30 40 50 60 70 80 90 100<br />
percentage of time (%)<br />
- End of Section -<br />
<strong>November</strong> 23, <strong>2012</strong> Public Page 12
4.0 <strong>Transmission</strong> Interconnections <strong>IESO</strong>_REP_0265v22.0<br />
<strong>Ontario</strong> <strong>Transmission</strong> <strong>System</strong><br />
4.0 <strong>Transmission</strong> Interconnections<br />
The term interconnection is used to describe interfaces that join <strong>Ontario</strong> to other jurisdictions (external<br />
control areas).<br />
<strong>Ontario</strong> has interconnections with Manitoba, Minnesota, Quebec, Michigan, and New York. The<br />
characteristics of each interconnection are described in Section 4.2. Figure 4.3.1 provides a geographic<br />
depiction of <strong>Ontario</strong>’s internal transmission zones and transmission interconnection points with these<br />
jurisdictions. Operating security limits for these interconnections are also included in Figure 4.3.1 as well<br />
as in Table 4.3. Figure 4.3.2 summarizes the relationship between <strong>Ontario</strong>’s zones, major internal<br />
interfaces and interconnections in a single diagram. The interconnection limits are used to ensure system<br />
and/or plant stability, acceptable pre-contingency and post-contingency voltage levels and/or acceptable<br />
thermal loading levels.<br />
4.1 Interconnection Definitions<br />
Like transmission interfaces, interconnection definitions are formed by grouping one or more lines for the<br />
purpose of measuring their combined flow and enforcing a power flow limit. Interconnections limits are<br />
defined for flows into <strong>Ontario</strong> (imports) and out of <strong>Ontario</strong> (exports).<br />
4.2 Interconnection Characteristics<br />
All of <strong>Ontario</strong>’s synchronous interconnections are normally linked with phase angle regulators (PARs),<br />
except for the radial interconnections and the New York – Niagara interconnection. A sample of historical<br />
flow distribution on the <strong>Ontario</strong> interconnections is shown in Figure 4.3.3.<br />
The <strong>Ontario</strong> – Manitoba Interconnection<br />
The <strong>Ontario</strong> – Manitoba interconnection consists of two 230 kV circuits and one 115 kV circuit.<br />
The 230 kV interconnection is defined as the <strong>Ontario</strong> – Manitoba Transfer. The transfers on this<br />
interconnection are the <strong>Ontario</strong> – Manitoba Transfer East (OMTE) and the <strong>Ontario</strong> – Manitoba Transfer<br />
West (OMTW), and are constrained by stability and thermal limitations. The OMTW and OMTE limits<br />
are 300 MW in the winter and 288 MW in the summer. These limits do not include the deadband margins<br />
associated with the phase angle regulator taps.<br />
The 115 kV interconnection is limited to 68 MW for flows into <strong>Ontario</strong> in the winter and summer. No<br />
flow out of <strong>Ontario</strong> is allowed on the 115 kV interconnection.<br />
<strong>Ontario</strong> and Manitoba are synchronously connected on the 230 kV interconnection, while the 115 kV<br />
interconnection is operated normally open.<br />
The <strong>Ontario</strong> – Minnesota Interconnection<br />
The <strong>Ontario</strong> – Minnesota interconnection consists of one 115 kV circuit. The transfers on this<br />
interconnection are the Minnesota Power Flow North (MPFN) and the Minnesota Power Flow South<br />
(MPFS).<br />
<strong>November</strong> 23, <strong>2012</strong> Public Page 13
4.0 <strong>Transmission</strong> Interconnections <strong>IESO</strong>_REP_0265v22.0<br />
<strong>Ontario</strong> <strong>Transmission</strong> <strong>System</strong><br />
The MPFN and MPFS limits are 100 MW and 150 MW respectively and are constrained by stability and<br />
thermal limitations. These limits do not include the deadband margins associated with the phase angle<br />
regulator taps. <strong>Ontario</strong> and Minnesota are synchronously connected.<br />
The <strong>Ontario</strong> – Michigan Interconnection<br />
The <strong>Ontario</strong> – Michigan interconnection consists of two 230/345 kV circuits, one 230/115 kV circuit and<br />
one 230 kV circuit. The interconnection is constrained by thermal limitations.<br />
Presently all four phase angle regulators are in service. From <strong>Ontario</strong> to Michigan, the winter limit is<br />
1,910 MW and the summer limit is 1,900 MW. The winter limit was decreased from 2,000 MW to 1,910<br />
MW because of problems with cooling the phase angle regulating transformers that are not expected to<br />
be fixed. An updated model and new tools were used as well. The summer limit of 1,900 MW does not<br />
account for the cooling problems and is subject to change. From Michigan to <strong>Ontario</strong>, the winter limit is<br />
1,650 MW and the summer limit is 1,600 MW. The previous winter limit of 1,600 MW increased by 50<br />
MW as a result of using an updated model and new tools.<br />
The <strong>Ontario</strong> – New York Niagara Interconnection<br />
The <strong>Ontario</strong> – New York Niagara interconnection consists of two 230/345 kV circuits, two 230 kV circuits,<br />
and one 115 kV circuit.<br />
One of the 230 kV circuits, BP76, is on a long term outage because of the failure of its voltage regulator.<br />
Until its return to service scheduled for December <strong>2012</strong>, scheduling limits for flows out of <strong>Ontario</strong> in the<br />
winter and summer are 1,530 MW (+40 MW) and 1,220 MW (+20 MW) respectively. Scheduling limits for<br />
flows into <strong>Ontario</strong> in the winter and summer are 1,110 MW (-100 MW) and 830 MW (-80 MW)<br />
respectively. The numbers in parentheses indicate the change from the previous <strong>Ontario</strong> <strong>Transmission</strong><br />
<strong>System</strong> document. All changes are the result of calculating equivalent limits with an updated model and<br />
new tools.<br />
With circuit BP76 in service, the scheduling limits for flows out of <strong>Ontario</strong> in the winter and summer are<br />
2,090 MW (+10 MW) and 1,760 MW respectively. Scheduling limits for flows into <strong>Ontario</strong> with BP76 in<br />
service in the winter and summer are 1,570 MW and 1,320 MW respectively. The summer limits are<br />
subject to change since they have not yet been recalculated using the updated model and new tools.<br />
The Queenston Flow West (QFW) interface is in series with the NY Niagara interconnection. All flows<br />
entering <strong>Ontario</strong> on the NY Niagara interconnection will also appear on the QFW interface; this includes<br />
imports and parallel path flows. Based on past experience and studies, the QFW interface would reach its<br />
limit before the limit is reached on the NY Niagara interconnection for flows entering <strong>Ontario</strong>; as a result,<br />
the capability of the NY Niagara interconnection could be constrained by thermal limitations in the QFW<br />
interface, which are dependent on weather conditions.<br />
<strong>Ontario</strong> and New York Niagara are synchronously connected.<br />
The <strong>Ontario</strong> – New York St. Lawrence Interconnection<br />
The <strong>Ontario</strong> – New York St. Lawrence interconnection consists of two 230 kV circuits. The<br />
interconnection is constrained by thermal limitations and is under the control of phase angle regulators.<br />
The limit on this interconnection is 300 MW for flows into <strong>Ontario</strong> and out of <strong>Ontario</strong>. The<br />
interconnection is constrained by thermal limitations in the winter and summer or NY scheduling limits.<br />
<strong>Ontario</strong> and New York St. Lawrence are synchronously connected.<br />
<strong>November</strong> 23, <strong>2012</strong> Public Page 14
4.0 <strong>Transmission</strong> Interconnections <strong>IESO</strong>_REP_0265v22.0<br />
<strong>Ontario</strong> <strong>Transmission</strong> <strong>System</strong><br />
The <strong>Ontario</strong> – New York Total<br />
The power transfers on the Niagara and St. Lawrence interconnections could be further limited by the<br />
New York scheduling limits on the <strong>Ontario</strong> – New York flowgate. When all transmission circuits are in<br />
service, the scheduling limits are 1,650 MW into <strong>Ontario</strong> and 1,900 MW out of <strong>Ontario</strong>.<br />
With BP76 circuit on outage, the New York scheduling limits on the <strong>Ontario</strong> – New York flowgate are<br />
1,200 MW into <strong>Ontario</strong> and 1,650 MW out of <strong>Ontario</strong>.<br />
The <strong>Ontario</strong> – Quebec North Interconnection<br />
The <strong>Ontario</strong> – Quebec North Interconnection consists of two radial 115 kV circuits (D4Z, H4Z) and is<br />
thermally limited.<br />
For flows into <strong>Ontario</strong> from radial generation in Quebec, the limit is 85 MW under winter conditions and<br />
65 MW under summer conditions. For flows out of <strong>Ontario</strong>, the limit is 110 MW in the winter and 95 MW<br />
in the summer.<br />
The <strong>Ontario</strong> – Quebec South Interconnection<br />
The <strong>Ontario</strong> – Quebec South Interconnection consists of two 230 kV circuits in the East zone, five 230 kV<br />
circuits in the Ottawa zone, and two 115 kV circuits in the Ottawa zone. This includes the 230 kV<br />
interconnection from Hawthorne to the HVDC converters located at Outaouais station in Quebec.<br />
The Quebec South Interconnection limits for flows into <strong>Ontario</strong> are 2,723 MW in summer and 2,798 MW<br />
in winter, constrained by the transmission limitations and generation availability. For flows out of<br />
<strong>Ontario</strong>, due to stability and thermal limitations, the limits are 1,902 MW for the summer and 1,972 MW<br />
for the winter.<br />
Parallel Path flows between Michigan & New York Niagara<br />
Parallel path flows may occur between Michigan and New York Niagara, north of Lake Erie through<br />
<strong>Ontario</strong>, and south of Lake Erie through Pennsylvania due to a combination of transmission system<br />
impedance with interconnection-wide load/generation dispatch. As a result, the actual flows on the<br />
Michigan and New York Niagara interconnections may not equal the scheduled flows. For scheduled<br />
<strong>Ontario</strong> – Michigan power flows, part of the scheduled flows may flow on the NY Niagara<br />
interconnection due to parallel path flows. Likewise, for scheduled <strong>Ontario</strong> – New York power flows,<br />
part of the scheduled flows may flow on the <strong>Ontario</strong> – Michigan interconnection.<br />
With full phase angle regulator control on the interties between <strong>Ontario</strong> and Michigan the inadvertent<br />
power flow across the interface is expected to be mitigated. When full PAR control of the <strong>Ontario</strong> –<br />
Michigan interconnection is utilized, parallel path flows of up to 600 MW in either direction are expected<br />
to be controlled. Control of parallel path flows should allow scheduled power flows to be maintained<br />
most of the time between <strong>Ontario</strong>, Michigan, and New York, and should also greatly reduce the incidence<br />
of constrained operation of the QFW interface.<br />
Without full PAR control of the <strong>Ontario</strong> – Michigan interconnection, power flows across the Michigan<br />
interconnection are comprised of scheduled direct flows, scheduled New York Niagara parallel path<br />
flows, and LEC. Likewise, power flows across the New York Niagara interconnection are comprised of<br />
scheduled direct flows, scheduled Michigan parallel path flows, and LEC. This means that the total<br />
transfer from these two areas is usually limited to a flow that is less than the sum of the two<br />
interconnection flow limits.<br />
<strong>November</strong> 23, <strong>2012</strong> Public Page 15
4.0 <strong>Transmission</strong> Interconnections <strong>IESO</strong>_REP_0265v22.0<br />
<strong>Ontario</strong> <strong>Transmission</strong> <strong>System</strong><br />
Lake Erie Circulation (LEC) is a measure of the use of the <strong>Ontario</strong> transmission system by external parties<br />
in neighbouring jurisdictions. It is calculated using measured flows on the Michigan interconnection,<br />
measured flows on the New York interconnection, scheduled Michigan transactions, scheduled New<br />
York transactions, and measured internal generation located close to these interconnections. The flow can<br />
circulate through <strong>Ontario</strong> in a clockwise direction, in at Michigan and out at New York, or in<br />
counterclockwise direction, in at New York and out at Michigan. LEC flows also appear on the BLIP and<br />
QFW interfaces as they are in a direct series path.<br />
<strong>Ontario</strong> Coincident Import/Export Capability<br />
In the summer, with all transmission elements in service, the theoretical maximum capability for exports<br />
is up to 6,000 MW, and imports up to 6,300 MW; in the winter, 6,100 MW and 6,800 MW respectively.<br />
With the circuit BP76 on outage, the theoretical export capability is reduced by up to 500 MW in summer<br />
and 250 MW in winter; the import capability could be reduced by up to 400 MW in summer and 450 MW<br />
in winter.<br />
These values represent theoretical levels that could be achieved only with a substantial reduction in<br />
generation dispatch in the West and Niagara transmission zones. In practice, the generation dispatch<br />
required for high import levels would rarely, if ever, materialize. Therefore, at best, due to internal<br />
constraints in the <strong>Ontario</strong> transmission network in conjunction with external scheduling limitations,<br />
<strong>Ontario</strong> has an expected coincident import capability of approximately 5,200 MW with all the<br />
transmission elements in service and 4,800 MW with the circuit BP76 on outage.<br />
Previous studies have shown that when full PAR control is available on the <strong>Ontario</strong> – Michigan<br />
interconnection, flow control of up to about 600 MW in either direction could be achieved. When<br />
circulation is limiting, this control will act to improve the coincident import/export capability.<br />
<strong>November</strong> 23, <strong>2012</strong> Public Page 16
4.0 <strong>Transmission</strong> Interconnections <strong>IESO</strong>_REP_0265v22.0<br />
<strong>Ontario</strong> <strong>Transmission</strong> <strong>System</strong><br />
4.3 Interconnection Flow Limits<br />
Table 4.3 summarizes the flow limits for the interconnections; normal system (all transmission elements<br />
in service) limits are shown. In addition, emergency transfer limits are shown when they differ from the<br />
normal system limits. All limits provided are total transfer capability (TTC) values.<br />
For Michigan and New York, flow limits are given for summer and winter flows into and out of <strong>Ontario</strong>.<br />
With favourable conditions, the flow capabilities of the interconnections will not be affected by internal<br />
limitations in the transmission network. The amount of power that can be transferred may be lower than<br />
the table values under unfavourable dispatch and weather conditions. With unfavourable conditions, the<br />
flow capabilities may also be affected by internal limitations in the transmission network, in <strong>Ontario</strong> or in<br />
external areas.<br />
When ambient weather conditions permit, flow limits over paths restricted by thermal considerations<br />
may be increased during real-time operation.<br />
<strong>November</strong> 23, <strong>2012</strong> Public Page 17
4.0 <strong>Transmission</strong> Interconnections <strong>IESO</strong>_REP_0265v22.0<br />
<strong>Ontario</strong> <strong>Transmission</strong> <strong>System</strong><br />
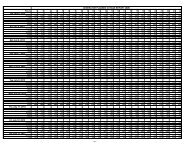
Table 4.3 Interconnection Total Transfer Capability (TTC) Limits<br />
Interconnection<br />
Limit - Flows Out of <strong>Ontario</strong><br />
MW<br />
Manitoba – Summer* 288<br />
Manitoba – Winter* 300<br />
(3)<br />
(3)<br />
Limit - Flows Into <strong>Ontario</strong><br />
MW<br />
288<br />
300<br />
(3,6)<br />
(3,6)<br />
Minnesota 150 100<br />
(3)<br />
Quebec North (Northeast) – Summer* 95 65<br />
D4Z 0<br />
(5)<br />
65<br />
H4Z 95<br />
(5)<br />
0<br />
Quebec North (Northeast)– Winter* 110 85<br />
D4Z 0<br />
(4)<br />
85<br />
H4Z 110<br />
(4)<br />
0<br />
Quebec South (Ottawa) – Summer* 1482 1923<br />
X2Y 0 65<br />
Q4C 32 88<br />
P33C 0 270<br />
D5A 200 250<br />
H9A 60 120<br />
HVDC 1250 1250<br />
Quebec South (Ottawa) – Winter* 1502 1998<br />
X2Y 0 65<br />
Q4C 52 88<br />
P33C 0 345<br />
D5A 200 250<br />
H9A 60 176<br />
HVDC 1250 1250<br />
Quebec South (East) – Summer* 420 800<br />
B31L + B5D 420 800<br />
Quebec South (East) – Winter* 470 800<br />
B31L + B5D 470 800<br />
New York St. Lawrence – Summer* 300 300<br />
New York St. Lawrence – Winter* 300 300<br />
New York Niagara – Summer* 1,760<br />
Emergency Transfer Limit - Summer* 2,160<br />
New York Niagara – Winter* 2,090<br />
Emergency Transfer Limit - Winter* 2,200<br />
(1)<br />
(1)<br />
(1)<br />
(1)<br />
1,320<br />
1,860<br />
1,570<br />
2,200<br />
(1,7)<br />
(1,7)<br />
(1,7)<br />
(1,7)<br />
Michigan – Summer* 1,900<br />
Emergency Transfer Limit - Summer * 2,520<br />
Michigan – Winter* 1,910<br />
Emergency Transfer Limit - Winter * 2,450<br />
(2,3)<br />
(2,3)<br />
(2,3)<br />
1,600<br />
1,950<br />
1,650<br />
2,000<br />
* Summer Limits apply from May 1 to October 31. Winter Limits apply from <strong>November</strong> 1 to April 30.<br />
(1) Flow limits depend on generation dispatch outside <strong>Ontario</strong>.<br />
(2) Normal limits are based on LT ratings and phase shifters bypassed and Emergency limits are based on ST<br />
(3) For real time operation of the interconnection, limits are based on ambient conditions.<br />
(4) Limit based on 0 to 4 km/h wind speed and 10 ˚C ambient temperature.<br />
(5) Limit based on 0 to 4 km/h wind speed and 30 ˚C ambient temperature.<br />
(6) Flows into <strong>Ontario</strong> include flows on circuit SK1.<br />
(7) Flow Limits into <strong>Ontario</strong> are shown here without considering QFW transmission constraints within <strong>Ontario</strong>.<br />
(2,3)<br />
(2,3)<br />
(2,3)<br />
(2,3)<br />
(2,3)<br />
<strong>November</strong> 23, <strong>2012</strong> Public Page 18
4.0 <strong>Transmission</strong> Interconnections <strong>IESO</strong>_REP_0265v22.0<br />
<strong>Ontario</strong> <strong>Transmission</strong> <strong>System</strong><br />
Figure 4.3.1 <strong>Ontario</strong>’s Points of Interconnection with Neighbouring Areas<br />
James Bay<br />
NORTHWEST<br />
Wawa<br />
Mattagami<br />
River<br />
Timmins<br />
Abitibi<br />
River<br />
Moose<br />
River<br />
MANITOBA<br />
Manitoba<br />
Red<br />
Lake<br />
Lake<br />
the of<br />
Woods<br />
Fort<br />
Frances<br />
Trout<br />
Lake<br />
MINNESOTA<br />
NORTHWEST<br />
Minnesota<br />
Lake St.<br />
Albany<br />
Lac<br />
Joseph<br />
River<br />
Manitoba Into <strong>Ontario</strong> Out of <strong>Ontario</strong><br />
Seul<br />
summer 288 MW 288 MW<br />
Sioux Lookout<br />
w inter 300 MW 300 MW<br />
Minnesota Into <strong>Ontario</strong> Out of <strong>Ontario</strong><br />
Lake<br />
summer/w inter Nipigon 100 MW 150 MW<br />
Geraldton<br />
Thunder Bay<br />
UNITED STATES<br />
Lake<br />
Superior<br />
CANADA<br />
Manitouwadge<br />
Wawa<br />
Lake<br />
Superior<br />
Sault Ste. Marie<br />
Quebec North Into <strong>Ontario</strong> Out of <strong>Ontario</strong><br />
summer 65 MW 95 MW<br />
w inter 85 MW 110 MW<br />
NORTHEAST<br />
Sudbury<br />
Lake<br />
Timiskaming<br />
Lake Nipissing North Bay<br />
QUEBEC<br />
Q North<br />
Quebec South<br />
(East) Into <strong>Ontario</strong> Out of <strong>Ontario</strong><br />
summer 1,923 MW 1,482 MW<br />
w inter 1,998 MW 1,502 MW<br />
Quebec South<br />
(Ottawa) Into <strong>Ontario</strong> Out of <strong>Ontario</strong><br />
summer 800 MW 420 MW<br />
w inter 800 MW 470 MW<br />
MICHIGAN<br />
Lake Huron<br />
BRUCE<br />
Georgian Bay<br />
Owen<br />
Sound<br />
Barrie<br />
Lake<br />
Simcoe<br />
ESSA<br />
EAST<br />
QS (Ottawa)<br />
OTTAWA<br />
St Lawrence<br />
River<br />
Ottawa<br />
River<br />
New York St. Brockville<br />
Law rence Into <strong>Ontario</strong> Out of <strong>Ontario</strong><br />
Kingston<br />
Peterborough<br />
summer 300 MW 300 MW<br />
Belleville<br />
w inter 300 MW 300 MW<br />
QS (Ottawa)<br />
QS (East)<br />
NY St.L<br />
Michigan<br />
Michigan<br />
Sarnia<br />
WEST<br />
Chatham<br />
Windsor<br />
Into <strong>Ontario</strong> Out of <strong>Ontario</strong><br />
summer 1,600 MW 1,900 MW<br />
w inter 1,650 MW 1,910 MW<br />
London<br />
Orangeville<br />
Kitchener<br />
SOUTHWEST<br />
CANADA<br />
Lake<br />
Erie<br />
UNITED<br />
STATES<br />
Hamilton<br />
Toronto<br />
TORONTO<br />
Niagara Falls<br />
NY Niagara<br />
NIAGARA<br />
NEW YORK<br />
Lake <strong>Ontario</strong><br />
CANADA<br />
UNITED<br />
STATES<br />
New York<br />
Niagara Into <strong>Ontario</strong> Out of <strong>Ontario</strong><br />
summer 1,320 MW 1,760 MW<br />
w inter 1,570 MW 2,090 MW<br />
Notes to Figure 4.3.1:<br />
1. Tables indicate flow limits for each interconnection. Note the <strong>Ontario</strong> coincident import/export capability is<br />
not necessarily the arithmetic sum of the individual flow limits.<br />
<strong>November</strong> 23, <strong>2012</strong> Public Page 19
4.0 <strong>Transmission</strong> Interconnections <strong>IESO</strong>_REP_0265v22.0<br />
<strong>Ontario</strong> <strong>Transmission</strong> <strong>System</strong><br />
Figure 4.3.2 <strong>Ontario</strong>’s Zones, Interfaces and Interconnections<br />
<strong>Ontario</strong>'s Internal Zones, Internal Interfaces and External Interconnections<br />
Manitoba<br />
Interconnection<br />
(PAR Controlled)<br />
Northwest<br />
Zone<br />
EWTE<br />
EWTW<br />
Northeast<br />
Zone<br />
Quebec<br />
Interconnection<br />
(Radial)<br />
Minnesota<br />
Interconnection<br />
(PAR Controlled)<br />
FS<br />
FN<br />
Outaouais HVDC<br />
Convertor<br />
Bruce<br />
Zone<br />
Essa<br />
Zone<br />
Ottawa<br />
Zone<br />
Quebec<br />
Interconnection<br />
(Radial)<br />
FABC<br />
CLAS<br />
CLAN<br />
FIO<br />
BLIP<br />
NBLIP<br />
FETT<br />
Michigan<br />
Interconnection<br />
(Partial PAR<br />
Controlled)<br />
West<br />
Zone<br />
Southwest<br />
Zone<br />
QFW<br />
Niagara<br />
Zone<br />
Toronto<br />
Zone<br />
TEC<br />
East<br />
Zone<br />
New York<br />
Interconnection<br />
(PAR Controlled)<br />
Quebec<br />
Interconnection<br />
(Radial)<br />
New York<br />
Interconnection<br />
(Free Flowing)<br />
Notes to Figure 4.3.2:<br />
1. FABCW = FABC + MW Output of Wind Farms near Bruce Zone<br />
<strong>November</strong> 23, <strong>2012</strong> Public Page 20
4.0 <strong>Transmission</strong> Interconnections <strong>IESO</strong>_REP_0265v22.0<br />
<strong>Ontario</strong> <strong>Transmission</strong> <strong>System</strong><br />
Figure 4.3.3 One Year Rolling (Nov. 2011 – Nov. <strong>2012</strong>) Historical Flow Distribution - Interconnections<br />
400<br />
<strong>Ontario</strong> to Manitoba Nov. 1, 2011 to Nov. 1, <strong>2012</strong><br />
Flow into Manitoba (MW)<br />
300<br />
200<br />
100<br />
0<br />
-100<br />
-200<br />
-300<br />
-400<br />
Winter Limit<br />
Summer Limit<br />
0 10 20 30 40 50 60 70 80 90 100<br />
Summer Limit<br />
Winter Limit<br />
percentage of time (%)<br />
<strong>Ontario</strong> to Minnesota Nov. 1, 2011 to Nov. 1, <strong>2012</strong><br />
200<br />
150<br />
Limit<br />
Flow into Minnesota (MW)<br />
100<br />
50<br />
0<br />
-50<br />
-100<br />
0 10 20 30 40 50 60 70 80 90 100<br />
Limit<br />
-150<br />
percentage of time (%)<br />
<strong>November</strong> 23, <strong>2012</strong> Public Page 21
4.0 <strong>Transmission</strong> Interconnections <strong>IESO</strong>_REP_0265v22.0<br />
<strong>Ontario</strong> <strong>Transmission</strong> <strong>System</strong><br />
Flow into Michigan (MW)<br />
2500<br />
2000<br />
1500<br />
1000<br />
500<br />
0<br />
-500<br />
-1000<br />
-1500<br />
-2000<br />
<strong>Ontario</strong> to Michigan Nov. 1, 2011 to Nov. 1, <strong>2012</strong><br />
Winter Limit<br />
Summer Limit<br />
0 10 20 30 40 50 60 70 80 90 100<br />
Summer Limit<br />
Winter Limit<br />
percentage of time (%)<br />
<strong>Ontario</strong> to New York Nov. 1, 2011 to Nov. 1, <strong>2012</strong><br />
3000<br />
Flow into New York (MW)<br />
2500<br />
2000<br />
1500<br />
1000<br />
500<br />
0<br />
-500<br />
-1000<br />
-1500<br />
-2000<br />
-2500<br />
Winter Limit<br />
Summer Limit<br />
0 10 20 30 40 50 60 70 80 90 100<br />
Summer Limit<br />
Winter Limit<br />
percentage of time (%)<br />
<strong>November</strong> 23, <strong>2012</strong> Public Page 22
4.0 <strong>Transmission</strong> Interconnections <strong>IESO</strong>_REP_0265v22.0<br />
<strong>Ontario</strong> <strong>Transmission</strong> <strong>System</strong><br />
2000<br />
<strong>Ontario</strong> to Quebec Nov. 1, 2011 to Nov. 1, <strong>2012</strong><br />
1500<br />
Flow into Quebec (MW)<br />
1000<br />
500<br />
0<br />
-500<br />
-1000<br />
0 10 20 30 40 50 60 70 80 90 100<br />
-1500<br />
-2000<br />
percentage of time (%)<br />
<strong>Ontario</strong> Net Export Nov. 1, 2011 to Nov. 1, <strong>2012</strong><br />
3500<br />
2500<br />
Flow out of <strong>Ontario</strong> (MW)<br />
1500<br />
500<br />
-500<br />
-1500<br />
-2500<br />
0 10 20 30 40 50 60 70 80 90 100<br />
-3500<br />
percentage of time (%)<br />
- End of Document -<br />
<strong>November</strong> 23, <strong>2012</strong> Public Page 23