Tourism Satellite Account for South Africa 2006 to 2009
Tourism Satellite Account for South Africa 2006 to 2009
Tourism Satellite Account for South Africa 2006 to 2009
You also want an ePaper? Increase the reach of your titles
YUMPU automatically turns print PDFs into web optimized ePapers that Google loves.
Statistics <strong>South</strong> <strong>Africa</strong><br />
v<br />
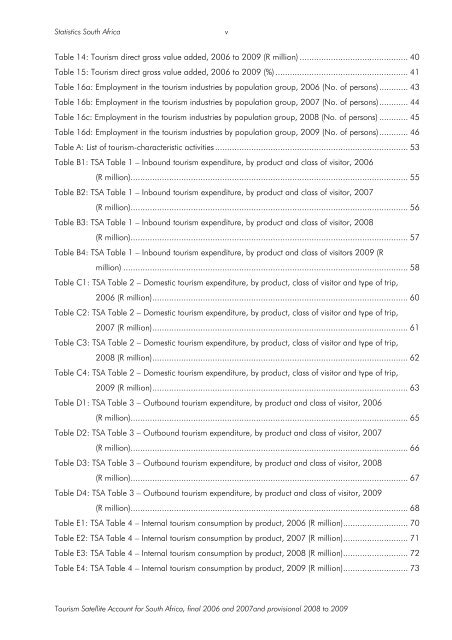
Table 14: <strong>Tourism</strong> direct gross value added, <strong>2006</strong> <strong>to</strong> <strong>2009</strong> (R million) ............................................. 40<br />
Table 15: <strong>Tourism</strong> direct gross value added, <strong>2006</strong> <strong>to</strong> <strong>2009</strong> (%) ....................................................... 41<br />
Table 16a: Employment in the <strong>to</strong>urism industries by population group, <strong>2006</strong> (No. of persons)............ 43<br />
Table 16b: Employment in the <strong>to</strong>urism industries by population group, 2007 (No. of persons)............ 44<br />
Table 16c: Employment in the <strong>to</strong>urism industries by population group, 2008 (No. of persons) ............ 45<br />
Table 16d: Employment in the <strong>to</strong>urism industries by population group, <strong>2009</strong> (No. of persons)............ 46<br />
Table A: List of <strong>to</strong>urism-characteristic activities ................................................................................ 53<br />
Table B1: TSA Table 1 – Inbound <strong>to</strong>urism expenditure, by product and class of visi<strong>to</strong>r, <strong>2006</strong><br />
(R million)................................................................................................................... 55<br />
Table B2: TSA Table 1 – Inbound <strong>to</strong>urism expenditure, by product and class of visi<strong>to</strong>r, 2007<br />
(R million)................................................................................................................... 56<br />
Table B3: TSA Table 1 – Inbound <strong>to</strong>urism expenditure, by product and class of visi<strong>to</strong>r, 2008<br />
(R million)................................................................................................................... 57<br />
Table B4: TSA Table 1 – Inbound <strong>to</strong>urism expenditure, by product and class of visi<strong>to</strong>rs <strong>2009</strong> (R<br />
million) ...................................................................................................................... 58<br />
Table C1: TSA Table 2 – Domestic <strong>to</strong>urism expenditure, by product, class of visi<strong>to</strong>r and type of trip,<br />
<strong>2006</strong> (R million).......................................................................................................... 60<br />
Table C2: TSA Table 2 – Domestic <strong>to</strong>urism expenditure, by product, class of visi<strong>to</strong>r and type of trip,<br />
2007 (R million).......................................................................................................... 61<br />
Table C3: TSA Table 2 – Domestic <strong>to</strong>urism expenditure, by product, class of visi<strong>to</strong>r and type of trip,<br />
2008 (R million).......................................................................................................... 62<br />
Table C4: TSA Table 2 – Domestic <strong>to</strong>urism expenditure, by product, class of visi<strong>to</strong>r and type of trip,<br />
<strong>2009</strong> (R million).......................................................................................................... 63<br />
Table D1: TSA Table 3 – Outbound <strong>to</strong>urism expenditure, by product and class of visi<strong>to</strong>r, <strong>2006</strong><br />
(R million)................................................................................................................... 65<br />
Table D2: TSA Table 3 – Outbound <strong>to</strong>urism expenditure, by product and class of visi<strong>to</strong>r, 2007<br />
(R million)................................................................................................................... 66<br />
Table D3: TSA Table 3 – Outbound <strong>to</strong>urism expenditure, by product and class of visi<strong>to</strong>r, 2008<br />
(R million)................................................................................................................... 67<br />
Table D4: TSA Table 3 – Outbound <strong>to</strong>urism expenditure, by product and class of visi<strong>to</strong>r, <strong>2009</strong><br />
(R million)................................................................................................................... 68<br />
Table E1: TSA Table 4 – Internal <strong>to</strong>urism consumption by product, <strong>2006</strong> (R million)........................... 70<br />
Table E2: TSA Table 4 – Internal <strong>to</strong>urism consumption by product, 2007 (R million)........................... 71<br />
Table E3: TSA Table 4 – Internal <strong>to</strong>urism consumption by product, 2008 (R million)........................... 72<br />
Table E4: TSA Table 4 – Internal <strong>to</strong>urism consumption by product, <strong>2009</strong> (R million)........................... 73<br />
<strong>Tourism</strong> <strong>Satellite</strong> <strong>Account</strong> <strong>for</strong> <strong>South</strong> <strong>Africa</strong>, final <strong>2006</strong> and 2007and provisional 2008 <strong>to</strong> <strong>2009</strong>


