E N S W - United Nations Development Programme
E N S W - United Nations Development Programme
E N S W - United Nations Development Programme

Create successful ePaper yourself
Turn your PDF publications into a flip-book with our unique Google optimized e-Paper software.
tends to result in better health outcomes for<br />
them and for the next generation. Thus life<br />
expectancy and educational attainment may<br />
move in tandem. Most inequality in education<br />
today reflects disparities in quality (box 1.6):<br />
many developing countries have dual-track systems,<br />
with the well-off attending good schools<br />
and universities, mostly privately funded, and<br />
the poor attending inadequate, mostly publicly<br />
funded facilities. 35<br />
Rising inequality, especially between groups,<br />
can lead to social instability, undermining longterm<br />
human development progress. Persistence<br />
of inequality often results in a lack of intergenerational<br />
social mobility, which can also<br />
lead to social unrest.<br />
The rise in income inequality to some extent<br />
reflects a failure of national fiscal, and particularly<br />
taxation, systems. This can be offset by social<br />
protection. In Latin America, for example,<br />
income inequality has declined as a result of<br />
cash transfer programmes.<br />
Gender and women’s status<br />
Gender equality is both a core concern and<br />
an essential part of human development. All<br />
too often, women are discriminated against<br />
in health, education and the labour market,<br />
which restricts their freedoms. The extent of<br />
discrimination can be measured through the<br />
Gender Inequality Index (GII), which captures<br />
the loss of achievement due to gender<br />
inequality in three dimensions: reproductive<br />
health, empowerment and labour market<br />
participation. The higher the GII value, the<br />
greater the discrimination. Based on 2012<br />
data for 148 countries, the GII shows large<br />
variations across countries, ranging from<br />
0.045 (in Netherlands) to 0.747 (in Yemen),<br />
with an average of 0.463 (see statistical<br />
table 4).<br />
High gender disparities persist in South Asia<br />
(0.568), Sub-Saharan Africa (0.577) and the<br />
Arab States (0.555). In South Asia, the three<br />
driving factors are low female representation<br />
in parliament (18.5%), gender imbalances in<br />
educational achievement (28% of women have<br />
completed at least secondary education, compared<br />
with 50% of men) and low labour force<br />
participation (31% of women are in the labour<br />
force, compared with 81% of men).<br />
Box 1.5<br />
Inequality holds back human development<br />
HDRO research using Human <strong>Development</strong> Index (HDI) data yields robust findings of an inverse<br />
relationship between inequality and subsequent improvement in human development,<br />
driven mostly by inequality in health and education rather than in income.<br />
Using data on 132 countries for 2012, regression analysis showed the effects of multidimensional<br />
inequality (measured as the loss in the Inequality-adjusted Human <strong>Development</strong><br />
Index relative to the HDI) on the HDI and each of its components (health, education and income)<br />
due to four explanatory variables: overall inequality in human development, inequality<br />
in life expectancy, inequality in educational attainment and inequality in income per capita.<br />
A different regression was used for each explanatory variable, and all regressions included<br />
dummy variables to control for the level of human development (low, medium, high and very<br />
high). Overall inequality in human development, inequality in life expectancy and inequality<br />
in educational attainment showed a highly statistically significant (at the 1% level) negative<br />
correlation, but inequality in income per capita showed no correlation. Results were robust to<br />
different specifications, including grouping countries with low and medium human development<br />
on the one side and countries with high and very high human development on the other.<br />
Source: HDRO.<br />
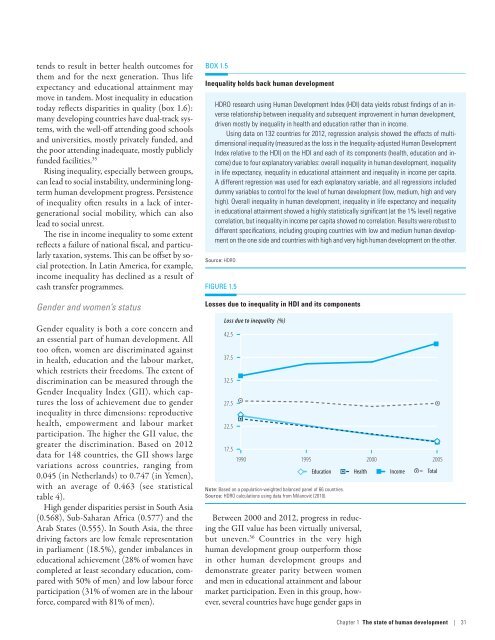
Figure 1.5<br />
Losses due to inequality in HDI and its components<br />
Loss due to inequality (%)<br />
42.5<br />
37.5<br />
32.5<br />
27.5<br />
22.5<br />
17.5<br />
1990<br />
1995<br />
Note: Based on a population-weighted balanced panel of 66 countries.<br />
Source: HDRO calculations using data from Milanović (2010).<br />
Between 2000 and 2012, progress in reducing<br />
the GII value has been virtually universal,<br />
but uneven. 36 Countries in the very high<br />
human development group outperform those<br />
in other human development groups and<br />
demonstrate greater parity between women<br />
and men in educational attainment and labour<br />
market participation. Even in this group, however,<br />
several countries have huge gender gaps in<br />
2000<br />
Education Health Income Total<br />
2005<br />
Chapter 1 The state of human development | 31