FINANCIAL STATEMENTS (Full Version) - Sembcorp
FINANCIAL STATEMENTS (Full Version) - Sembcorp
FINANCIAL STATEMENTS (Full Version) - Sembcorp

You also want an ePaper? Increase the reach of your titles
YUMPU automatically turns print PDFs into web optimized ePapers that Google loves.
Financial<br />
Statements<br />
IN THIS SECTION<br />
Directors’ Report 86<br />
Statement by Directors 107<br />
Independent Auditors’ Report 108<br />
Balance Sheets 110<br />
Consolidated Income Statement 111<br />
Consolidated Statement of<br />
Changes in Equity 112<br />
Consolidated Cash Flow Statement 116<br />
Notes to the Financial Statements 119<br />
Supplementary Information 216<br />
EVA Statement 218<br />
Shareholders’ Information 220<br />
Corporate Information 221<br />
Notice of Annual General Meeting 223<br />
Proxy Form 227
Directors’<br />
Report<br />
Year Ended December 31, 2008<br />
We are pleased to submit this annual report to the members of the Company together with the audited financial statements<br />
for the financial year ended December 31, 2008.<br />
DIRECTORS<br />
The directors in office at the date of this report are as follows:<br />
Peter Seah Lim Huat<br />
Tang Kin Fei<br />
Goh Geok Ling<br />
Richard Hale, OBE<br />
Yong Ying-I<br />
Evert Henkes<br />
Lee Suet Fern<br />
Bobby Chin Yoke Choong Appointed on December 1, 2008<br />
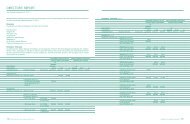
DIRECTORS’ INTERESTS<br />
According to the register kept by the Company for the purposes of Section 164 of the Singapore Companies Act, Chapter<br />
50 (the “Act”), particulars of interests of directors who held office at the end of the financial year (including those held<br />
by their spouses and infant children) in shares, debentures, warrants and share options in the Company and in related<br />
corporations are as follows:<br />
Shareholdings registered in the name<br />
Other shareholdings in which director<br />
of director, spouse or infant children is deemed to have an interest<br />
Name of director At At At At<br />
and corporation beginning end At beginning end At<br />
in which interests held Description of interests Exercise period of the year of the year 21/1/2009 of the year of the year 21/1/2009<br />
Peter Seah Lim Huat<br />
<strong>Sembcorp</strong> Industries Ltd Ordinary shares 150,500 168,000 168,000 – – –<br />
Options to subscribe<br />
for ordinary shares at<br />
– S$0.93 per share 19/11/2004 17,500 – – – – –<br />
to 18/11/2008<br />
– S$0.99 per share 18/5/2005 17,500 17,500 17,500 – – –<br />
to 17/5/2009<br />
– S$1.16 per share 23/11/2005 35,000 35,000 35,000 – – –<br />
to 22/11/2009<br />
– S$2.37 per share 2/7/2006 35,000 35,000 35,000 – – –<br />
to 1/7/2010<br />
– S$2.36 per share 22/11/2006 52,500 52,500 52,500 – – –<br />
to 21/11/2010<br />
– S$2.52 per share 10/6/2007 105,000 105,000 105,000 – – –<br />
to 9/6/2011<br />
DIRECTORS’ INTERESTS (cont’d)<br />
Shareholdings registered in the name<br />
Other shareholdings in which director<br />
of director, spouse or infant children is deemed to have an interest<br />
Name of director At At At At<br />
and corporation beginning end At beginning end At<br />
in which interests held Description of interests Exercise period of the year of the year 21/1/2009 of the year of the year 21/1/2009<br />
Peter Seah Lim Huat (cont’d)<br />
<strong>Sembcorp</strong> Industries Ltd Conditional award of:<br />
– 23,984 restricted stocks Up to Up to Up to – – –<br />
to be delivered 31,179 31,179 31,179<br />
after 2008 (Note 2b)<br />
– 23,500 restricted stocks – Up to Up to – – –<br />
to be delivered 35,250 35,250<br />
after 2009 (Note 3)<br />
Tang Kin Fei<br />
<strong>Sembcorp</strong> Industries Ltd Ordinary shares 1,181,841 2,354,011 2,354,011 – – –<br />
Options to subscribe<br />
for ordinary shares at<br />
– S$0.78 per share 3/6/2004 50,000 – – – – –<br />
to 2/6/2013<br />
– S$0.93 per share 19/11/2004 50,000 – – – – –<br />
to 18/11/2013<br />
– S$0.99 per share 18/5/2005 100,000 50,000 50,000 – – –<br />
to 17/5/2014<br />
– S$1.16 per share 23/11/2005 100,000 50,000 50,000 – – –<br />
to 22/11/2014<br />
– S$2.37 per share 2/7/2006 300,000 150,000 150,000 – – –<br />
to 1/7/2015<br />
– S$2.36 per share 22/11/2006 300,000 150,000 150,000 – – –<br />
to 21/11/2015<br />
– S$2.52 per share 10/6/2007 300,000 300,000 300,000 – – –<br />
to 9/6/2016<br />
Conditional award of:<br />
– 427,836 performance Up to – – – – –<br />
shares to be delivered 641,754<br />
after 2007 (Note 1a)<br />
– 428,244 performance Up to Up to Up to – – –<br />
shares to be delivered 642,366 642,366 642,366<br />
after 2008 (Note 1b)<br />
86 Delivering Essential Solutions <strong>Sembcorp</strong> Industries Annual Report 2008 87
Directors’<br />
Report<br />
Year Ended December 31, 2008<br />
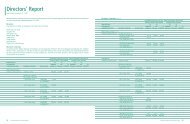
DIRECTORS’ INTERESTS (cont’d)<br />
Shareholdings registered in the name Other shareholdings in which director<br />
of director, spouse or infant children is deemed to have an interest<br />
Name of director At At At At<br />
and corporation beginning end At beginning end At<br />
in which interests held Description of interests Exercise period of the year of the year 21/1/2009 of the year of the year 21/1/2009<br />
Tang Kin Fei (cont’d)<br />
<strong>Sembcorp</strong> Industries Ltd<br />
Conditional award of:<br />
– 408,240 performance Up to Up to Up to – – –<br />
shares to be delivered 612,360 612,360 612,360<br />
after 2009 (Note 1c)<br />
– 400,000 performance – Up to Up to – – –<br />
shares to be delivered 600,000 600,000<br />
after 2010 (Note 1d)<br />
– 70,189 restricted stocks Up to 60,830 60,830 – – –<br />
to be delivered 91,246<br />
after 2007 (Note 2a)<br />
Goh Geok Ling<br />
<strong>Sembcorp</strong> Industries Ltd Ordinary shares 287,100 299,600 299,600 47,000 47,000 47,000<br />
Options to subscribe<br />
for ordinary shares at<br />
– S$0.78 per share 3/6/2004 6,250 – – – – –<br />
to 2/6/2008<br />
– S$0.93 per share 19/11/2004 6,250 – – – – –<br />
to 18/11/2008<br />
– S$0.99 per share 18/5/2005 12,500 12,500 12,500 – – –<br />
to 17/5/2009<br />
– 128,596 restricted stocks Up to Up to Up to – – –<br />
to be delivered 167,175 167,175 167,175<br />
after 2008 (Note 2b)<br />
– 126,000 restricted stocks – Up to Up to – – –<br />
to be delivered 189,000 189,000<br />
after 2009 (Note 3)<br />
<strong>Sembcorp</strong> Marine Ltd Ordinary shares 38,500 45,500 45,500 – – –<br />
Options to subscribe<br />
for ordinary shares at<br />
– S$2.11 per share 12/8/2006 14,000 7,000 7,000 – – –<br />
to 11/8/2010<br />
– S$2.38 per share 3/10/2007 73,500 73,500 73,500 – – –<br />
to 2/10/2011<br />
Conditional award of:<br />
– 18,900 restricted stocks Up to Up to Up to – – –<br />
to be delivered 24,570 24,570 24,570<br />
after 2008 (Note 2b)<br />
– 12,000 restricted stocks – Up to Up to – – –<br />
to be delivered 18,000 18,000<br />
after 2009 (Note 3)<br />
<strong>Sembcorp</strong> Marine Ltd<br />
– S$1.16 per share 23/11/2005 12,500 12,500 12,500 – – –<br />
to 22/11/2009<br />
– S$2.37 per share 2/7/2006 26,250 26,250 26,250 – – –<br />
to 1/7/2010<br />
– S$2.36 per share 22/11/2006 26,250 26,250 26,250 – – –<br />
to 21/11/2010<br />
– S$2.52 per share 10/6/2007 70,000 70,000 70,000 – – –<br />
to 9/6/2011<br />
Conditional award of:<br />
– 13,982 restricted stocks Up to Up to Up to – – –<br />
to be delivered 18,177 18,177 18,177<br />
after 2008 (Note 2b)<br />
– 13,700 restricted stocks – Up to Up to – – –<br />
to be delivered 20,550 20,550<br />
after 2009 (Note 3)<br />
Options to subscribe<br />
for ordinary shares at<br />
– S$2.38 per share 3/10/2007 196,000 196,000 196,000 – – –<br />
to 2/10/2011<br />
88 Delivering Essential Solutions <strong>Sembcorp</strong> Industries Annual Report 2008 89
Directors’<br />
Report<br />
Year Ended December 31, 2008<br />
DIRECTORS’ INTERESTS (cont’d)<br />
Shareholdings registered in the name<br />
Other shareholdings in which director<br />
of director, spouse or infant children is deemed to have an interest<br />
Name of director At At At At<br />
and corporation beginning end At beginning end At<br />
in which interests held Description of interests Exercise period of the year of the year 21/1/2009 of the year of the year 21/1/2009<br />
Goh Geok Ling (cont’d)<br />
<strong>Sembcorp</strong> Marine Ltd<br />
Conditional award of:<br />
– 30,800 restricted stocks Up to Up to Up to – – –<br />
to be delivered 40,040 40,040 40,040<br />
after 2008 (Note 2b)<br />
– 22,000 restricted stocks – Up to Up to – – –<br />
to be delivered 33,000 33,000<br />
after 2009 (Note 3)<br />
Richard Hale, OBE<br />
<strong>Sembcorp</strong> Industries Ltd Ordinary shares 147,500 182,500 182,500 – – –<br />
Options to subscribe<br />
for ordinary shares at<br />
– S$0.78 per share 3/6/2004 17,500 – – – – –<br />
to 2/6/2008<br />
– S$0.93 per share 19/11/2004 17,500 – – – – –<br />
to 18/11/2008<br />
– S$0.99 per share 18/5/2005 26,250 26,250 26,250 – – –<br />
to 17/5/2009<br />
– S$1.16 per share 23/11/2005 26,250 26,250 26,250 – – –<br />
to 22/11/2009<br />
– S$2.37 per share 2/7/2006 26,250 26,250 26,250 – – –<br />
to 1/7/2010<br />
– S$2.36 per share 22/11/2006 35,000 35,000 35,000 – – –<br />
to 21/11/2010<br />
– S$2.52 per share 10/6/2007 140,000 140,000 140,000 – – –<br />
to 9/6/2011<br />
Conditional award of:<br />
– 17,350 restricted stocks Up to Up to Up to – – –<br />
to be delivered 22,555 22,555 22,555<br />
after 2008 (Note 2b)<br />
– 17,000 restricted stocks – Up to Up to – – –<br />
to be delivered 25,500 25,500<br />
after 2009 (Note 3)<br />
DIRECTORS’ INTERESTS (cont’d)<br />
Shareholdings registered in the name<br />
Other shareholdings in which director<br />
of director, spouse or infant children is deemed to have an interest<br />
Name of director At At At At<br />
and corporation beginning end At beginning end At<br />
in which interests held Description of interests Exercise period of the year of the year 21/1/2009 of the year of the year 21/1/2009<br />
Yong Ying-I<br />
<strong>Sembcorp</strong> Industries Ltd Ordinary shares 250,000 300,000 300,000 – – –<br />
Evert Henkes<br />
<strong>Sembcorp</strong> Industries Ltd<br />
Options to subscribe<br />
for ordinary shares at<br />
– S$0.99 per share 18/5/2005 12,000 12,000 12,000 – – –<br />
to 17/5/2009<br />
– S$1.16 per share 23/11/2005 12,000 12,000 12,000 – – –<br />
to 22/11/2009<br />
– S$2.37 per share 2/7/2006 17,500 17,500 17,500 – – –<br />
to 1/7/2010<br />
– S$2.36 per share 22/11/2006 17,500 17,500 17,500 – – –<br />
to 21/11/2010<br />
– S$2.52 per share 10/6/2007 35,000 35,000 35,000 – – –<br />
to 9/6/2011<br />
Conditional award of:<br />
– 7,144 restricted stocks Up to Up to Up to – – –<br />
to be delivered 9,287 9,287 9,287<br />
after 2008 (Note 2b)<br />
Conditional award of:<br />
– 7,000 restricted stocks – Up to Up to – – –<br />
to be delivered 10,500 10,500<br />
after 2009 (Note 3)<br />
Lee Suet Fern<br />
<strong>Sembcorp</strong> Industries Ltd Ordinary shares 8,750 35,000 35,000 – – –<br />
Options to subscribe<br />
for ordinary shares at<br />
– S$2.36 per share 22/11/2006 26,250 17,500 17,500 – – –<br />
to 21/11/2010<br />
– S$2.52 per share 10/6/2007 70,000 52,500 52,500 – – –<br />
to 9/6/2011<br />
90 Delivering Essential Solutions <strong>Sembcorp</strong> Industries Annual Report 2008 91
Directors’<br />
Report<br />
Year Ended December 31, 2008<br />
DIRECTORS’ INTERESTS (cont’d)<br />
Shareholdings registered in the name<br />
Other shareholdings in which director<br />
of director, spouse or infant children is deemed to have an interest<br />
Name of director At At At At<br />
and corporation beginning end At beginning end At<br />
in which interests held Description of interests Exercise period of the year of the year 21/1/2009 of the year of the year 21/1/2009<br />
Lee Suet Fern (cont’d)<br />
<strong>Sembcorp</strong> Industries Ltd<br />
Note 1:<br />
Note 2:<br />
Note 3:<br />
Conditional award of:<br />
– 13,982 restricted stocks Up to Up to Up to – – –<br />
to be delivered 18,177 18,177 18,177<br />
after 2008 (Note 2b)<br />
– 13,700 restricted stocks – Up to Up to – – –<br />
to be delivered 20,550 20,550<br />
after 2009 (Note 3)<br />
The actual number to be delivered will depend on the achievement of set targets over a 3-year period as indicated below. Achievement of<br />
targets below target level will mean no performance shares will be delivered, while achievement up to 150% will mean up to 1.5 times the<br />
number of conditional performance shares awarded could be delivered.<br />
a. Period from 2005 to 2007*<br />
b. Period from 2006 to 2008<br />
c. Period from 2007 to 2009<br />
d. Period from 2008 to 2010<br />
* For this period, 641,754 shares were released to Tang Kin Fei in 2008.<br />
The actual number to be delivered will depend on the achievement of set targets at the end of the 2-year performance period as indicated<br />
below. Achievement of targets below target level will mean no restricted stocks will be delivered, while achievement up to 130% will mean up<br />
to 1.3 times the number of conditional restricted stocks awarded could be delivered.<br />
a. Period from 2006 to 2007*<br />
b. Period from 2007 to 2008<br />
* For this period, 30,416 shares were released to Tang Kin Fei in 2008 and the remaining 60,830 shares will be released in the next two years.<br />
The actual number to be delivered will depend on the achievement of set targets at the end of the 2-year performance period from 2008 to<br />
2009. Achievement of targets below target level will mean no restricted stocks will be delivered, while achievement up to 150% will mean up<br />
to 1.5 times the number of conditional restricted stocks awarded could be delivered.<br />
Except as disclosed in this report, no director who held office at the end of the financial year had interests in shares,<br />
debentures, warrants or share options of the Company, or of related corporations, either at the beginning or at the end<br />
of the financial year.<br />
Except as disclosed under the “Share-based Incentive Plans” section of this report, neither at the end of, nor at any time<br />
during the financial year, was the Company a party to any arrangement whose objects are, or one of whose objects is,<br />
to enable the directors of the Company to acquire benefits by means of the acquisition of shares in or debentures of the<br />
Company or any other body corporate.<br />
SHARE-BASED INCENTIVE PLANS<br />
The Company’s Share Option Plan, Performance Share Plan and Restricted Stock Plan (collectively, the “Share Plans”) were<br />
approved and adopted by the shareholders at an Extraordinary General Meeting of the Company held on June 5, 2000.<br />
The Executive Resource & Compensation Committee (the “Committee”) of the Company has been designated as the<br />
Committee responsible for the administration of the Share Plans. The Committee comprises the following members, all of<br />
whom are directors:<br />
Peter Seah Lim Huat (Chairman)<br />
Goh Geok Ling<br />
The Share Option Plan and Restricted Stock Plan are the incentive schemes for directors and employees of the Company<br />
and its subsidiaries (the “Group”) whereas the Performance Share Plan is aimed primarily at key executives of the Group.<br />
The Share Plans are intended to attract, retain and incentivise participants to higher standards of performance and<br />
encourage greater dedication and loyalty by enabling the Company to give recognition to past contributions and services;<br />
as well as motivating participants to contribute to the long-term prosperity of the Group.<br />
The Share Option Plan provides the Company with means whereby non-executive directors and employees of the Group,<br />
and certain categories of persons who can make significant contributions through their close working relationship with<br />
the Group, such as non-executive directors and employees of the Company’s associated company, are given an opportunity<br />
to participate in the equity of the Company. From 2007 onwards, no share options were granted as share options were<br />
entirely replaced with restricted stocks of an equivalent fair value.<br />
The Performance Share Plan and Restricted Stock Plan award fully paid shares to participants to achieve pre-determined<br />
targets that create and enhance economic values for shareholders of the Company, and/or to accomplish time-based service<br />
conditions. Awards will be released to participants as fully-paid shares, or their equivalent cash value or combinations<br />
thereof, free-of-charge, provided that the conditions of the awards are achieved and subject to approval by the Committee.<br />
Awards granted under the Performance Share Plan are released at the end of the performance period only when the<br />
pre-determined targets have been achieved. Awards granted under the Restricted Stock Plan vest only after satisfactory<br />
completion of time-based service conditions, or where the award is performance related, after a further period of service<br />
beyond the performance target completion date. No minimum vesting period is prescribed under the Restricted Stock Plan<br />
and the length of the vesting period in respect of each award will be determined on a case-by-case basis.<br />
The shares are settled by physical delivery of shares by way of issuance of new shares or existing shares procured by the<br />
Company for transfer to the employees or cash in lieu of the shares.<br />
Except as disclosed in Notes 34(b) and 38 to the financial statements, since the end of the last financial year, no director has<br />
received or become entitled to receive, a benefit by reason of a contract made by the Company or a related corporation<br />
with the director, or with a firm of which he is a member, or with a company in which he has a substantial financial interest,<br />
except as disclosed in Interested Person Transactions to the Supplementary Information on purchase of goods and services<br />
(if any) from Stamford Law Corporation in which Mrs Lee Suet Fern is the Senior Director.<br />
92 Delivering Essential Solutions <strong>Sembcorp</strong> Industries Annual Report 2008 93
Directors’<br />
Report<br />
Year Ended December 31, 2008<br />
SHARE-BASED INCENTIVE PLANS (cont’d)<br />
Other information regarding the Share Plan is as follows:<br />
a. Share Option Plan<br />
Under the rules of the Share Option Plan, participants who ceased to be employed by the Group or the associated<br />
company by reason of ill health, injury or disability, redundancy, retirement at or after the legal retirement age,<br />
retirement before the legal retirement age, death, etc., or any other event approved by the Committee, may be<br />
allowed by the Committee to retain their unexercised options. The Committee may determine the number of shares<br />
comprised in that option which may be exercised and the period during which such option shall be exercisable, being<br />
a period not later than the expiry of the exercise period in respect of that option. Such option may be exercised at<br />
any time notwithstanding that the date of exercise of such option falls on a date prior to the first day of the exercise<br />
period in respect of such option.<br />
Other information regarding the Share Option Plan is as follows:<br />
i. The exercise price of the options can be set at market price or a discount to the market price not exceeding 20% of<br />
the market price in respect of options granted at the time of grant. Market price is the volume-weighted average<br />
price for the shares on the Singapore Exchange Limited (“Singapore Exchange”) over the three consecutive trading<br />
days prior to grant date of that option. For all options granted to date, the exercise prices are set at market price.<br />
ii.<br />
After the first 12 months of lock-out period, the Group imposed a further vesting of four years for managers and<br />
above for retention purposes.<br />
iii. In 2008, all options were either settled by the issuance of new shares or by issuance of treasury shares.<br />
iv. The options granted expire after five years for non-executive directors and associated company’s employees, and<br />
10 years for the employees of the Group.<br />
SHARE-BASED INCENTIVE PLANS (cont’d)<br />
a. Share Option Plan (cont’d)<br />
v. <strong>Sembcorp</strong> Industries Ltd Share Option Plan<br />
At the end of the financial year, details of the options granted under the Share Option Plan on unissued ordinary<br />
shares of the Company are as follows:<br />
<strong>Sembcorp</strong> Industries Ltd<br />
Ordinary shares<br />
2008<br />
Number of<br />
options holders /<br />
Options<br />
(including<br />
Exercise Options cancelled / Options number of<br />
Date of grant price outstanding at Options lapsed / outstanding at directors) at<br />
of options per share Jan 1, 2008 exercised* not accepted Dec 31, 2008 Dec 31, 2008 Exercise period<br />
26/06/2000 S$1.63 305,953 (3,030) (77,600) 225,323 36 / (–) 27/06/2001 to 26/06/2010<br />
24/07/2000 S$1.90 350,948 (115,750) (60,023) 175,175 22 / (–) 20/05/2001 to 19/05/2009<br />
24/07/2000 S$1.76 39,064 – (4,999) 34,065 1 / (–) 16/09/2001 to 15/09/2009<br />
19/04/2001 S$1.19 230,650 (6,000) (55,300) 169,350 19 / (–) 20/04/2002 to 19/04/2011<br />
07/05/2002 S$1.23 294,250 (7,875) (64,250) 222,125 37 / (–) 08/05/2003 to 07/05/2012<br />
17/10/2002 S$0.62 150,625 (12,375) (42,375) 95,875 18 / (–) 18/10/2003 to 17/10/2012<br />
02/06/2003 S$0.78 36,750 (23,750) (13,000) – – / (–) 03/06/2004 to 02/06/2008<br />
02/06/2003 S$0.78 376,350 (185,375) (74,875) 116,100 33 / (–) 03/06/2004 to 02/06/2013<br />
18/11/2003 S$0.93 63,000 (56,250) (6,750) – – / (–) 19/11/2004 to 18/11/2008<br />
18/11/2003 S$0.93 608,875 (373,500) (77,625) 157,750 51 / (–) 19/11/2004 to 18/11/2013<br />
17/05/2004 S$0.99 79,000 (10,250) – 68,750 5 / (4) 18/05/2005 to 17/05/2009<br />
17/05/2004 S$0.99 1,181,427 (469,652) (100,125) 611,650 143 / (1) 18/05/2005 to 17/05/2014<br />
22/11/2004 S$1.16 107,250 (19,000) – 88,250 6 / (4) 23/11/2005 to 22/11/2009<br />
22/11/2004 S$1.16 1,494,400 (463,875) (178,625) 851,900 214 / (1) 23/11/2005 to 22/11/2014<br />
01/07/2005 S$2.37 122,500 (17,500) – 105,000 4 / (4) 02/07/2006 to 01/07/2010<br />
01/07/2005 S$2.37 2,371,647 (577,450) (111,000) 1,683,197 310 / (1) 02/07/2006 to 01/07/2015<br />
21/11/2005 S$2.36 183,750 (35,000) – 148,750 5 / (5) 22/11/2006 to 21/11/2010<br />
21/11/2005 S$2.36 2,742,320 (600,325) (143,125) 1,998,870 350 / (1) 22/11/2006 to 21/11/2015<br />
09/06/2006 S$2.52 472,500 (70,000) – 402,500 5 / (5) 10/06/2007 to 09/06/2011<br />
09/06/2006 S$2.52 4,299,470 (729,020) (191,500) 3,378,950 494 / (1) 10/06/2007 to 09/06/2016<br />
15,510,729 (3,775,977) (1,201,172) 10,533,580<br />
* In 2008, 1,568,994 options were settled by the issuance of new shares and the rest by issuance of treasury shares.<br />
94 Delivering Essential Solutions <strong>Sembcorp</strong> Industries Annual Report 2008 95
Directors’<br />
Report<br />
Year Ended December 31, 2008<br />
SHARE-BASED INCENTIVE PLANS (cont’d)<br />
a. Share Option Plan (cont’d)<br />
v. <strong>Sembcorp</strong> Industries Ltd Share Option Plan (cont’d)<br />
<strong>Sembcorp</strong> Industries Ltd<br />
Ordinary shares<br />
2007<br />
Number of<br />
options holders /<br />
Options<br />
(including<br />
Exercise Options cancelled / Options number of<br />
Date of grant price* outstanding at Options lapsed / outstanding at directors) at<br />
of options per share Jan 1, 2007 exercised not accepted Dec 31, 2007 Dec 31, 2007 Exercise period<br />
26/06/2000 S$1.63 961,908 (618,255) (37,700) 305,953 38 / (–) 27/06/2001 to 26/06/2010<br />
24/07/2000 S$1.90 812,939 (444,325) (17,666) 350,948 31 / (–) 20/05/2001 to 19/05/2009<br />
24/07/2000 S$1.76 39,066 (2) – 39,064 1 / (–) 16/09/2001 to 15/09/2009<br />
19/04/2001 S$1.19 476,175 (210,025) (35,500) 230,650 25 / (–) 20/04/2002 to 19/04/2011<br />
07/05/2002 S$1.23 178,000 (177,500) (500) – – / (–) 08/05/2003 to 07/05/2007<br />
07/05/2002 S$1.23 572,075 (252,625) (25,200) 294,250 38 / (–) 08/05/2003 to 07/05/2012<br />
17/10/2002 S$0.62 188,000 (187,000) (1,000) – – / (–) 18/10/2003 to 17/10/2007<br />
17/10/2002 S$0.62 510,000 (338,000) (21,375) 150,625 23 / (–) 18/10/2003 to 17/10/2012<br />
02/06/2003 S$0.78 227,250 (188,500) (2,000) 36,750 5 / (2) 03/06/2004 to 02/06/2008<br />
02/06/2003 S$0.78 1,041,225 (637,375) (27,500) 376,350 64 / (1) 03/06/2004 to 02/06/2013<br />
18/11/2003 S$0.93 245,750 (180,250) (2,500) 63,000 7 / (4) 19/11/2004 to 18/11/2008<br />
18/11/2003 S$0.93 1,396,645 (737,020) (50,750) 608,875 151 / (1) 19/11/2004 to 18/11/2013<br />
17/05/2004 S$0.99 266,250 (183,750) (3,500) 79,000 9 / (5) 18/05/2005 to 17/05/2009<br />
17/05/2004 S$0.99 2,195,150 (933,723) (80,000) 1,181,427 253 / (1) 18/05/2005 to 17/05/2014<br />
22/11/2004 S$1.16 268,750 (156,500) (5,000) 107,250 10 / (5) 23/11/2005 to 22/11/2009<br />
22/11/2004 S$1.16 2,621,525 (1,028,625) (98,500) 1,494,400 253 / (1) 23/11/2005 to 22/11/2014<br />
01/07/2005 S$2.37 282,500 (160,000) – 122,500 5 / (5) 02/07/2006 to 01/07/2010<br />
01/07/2005 S$2.37 4,761,553 (2,099,131) (290,775) 2,371,647 351 / (1) 02/07/2006 to 01/07/2015<br />
21/11/2005 S$2.36 317,500 (133,750) – 183,750 6 / (6) 22/11/2006 to 21/11/2010<br />
21/11/2005 S$2.36 5,325,820 (2,249,930) (333,570) 2,742,320 396 / (1) 22/11/2006 to 21/11/2015<br />
09/06/2006 S$2.52 525,000 (52,500) – 472,500 6 / (6) 10/06/2007 to 09/06/2011<br />
09/06/2006 S$2.52 7,450,500 (2,636,205) (514,825) 4,299,470 601 / (1) 10/06/2007 to 09/06/2016<br />
30,663,581 (13,604,991) (1,547,861) 15,510,729<br />
* The exercise prices for outstanding share options granted prior to April 27, 2007 were adjusted as a result of the Special Dividend payment<br />
in 2007.<br />
SHARE-BASED INCENTIVE PLANS (cont’d)<br />
a. Share Option Plan (cont’d)<br />
v. <strong>Sembcorp</strong> Industries Ltd Share Option Plan (cont’d)<br />
The details of options of the Company awarded / exercised since commencement of the Scheme (aggregate) to<br />
December 31, 2008 were as follows:<br />
Aggregate<br />
options<br />
Aggregate cancelled / Aggregate Aggregate<br />
options lapsed / options options<br />
Option participants granted not accepted exercised outstanding<br />
Directors<br />
Peter Seah Lim Huat 980,000 – (735,000) 245,000<br />
Tang Kin Fei 3,444,052 (607,759) 1 (2,136,293) 700,000<br />
Goh Geok Ling 370,000 – (222,500) 147,500<br />
Richard Hale, OBE 490,000 – (236,250) 253,750<br />
Yong Ying-I 235,000 (235,000) 2 – –<br />
Evert Henkes 94,000 – – 94,000<br />
Lee Suet Fern 105,000 – (35,000) 70,000<br />
Other executives<br />
Group 149,771,742 (68,365,208) (72,411,204) 8,995,330<br />
Associated company 748,600 (212,100) (533,500) 3,000<br />
Parent Group 3 378,500 (88,000) (265,500) 25,000<br />
Former directors of the Company 8,831,578 (2,148,328) (6,683,250) –<br />
Total 165,448,472 (71,656,395) (83,258,497) 10,533,580<br />
1. Options lapsed due to replacement of 1999 options and expiry of earlier options.<br />
2. Options not accepted due to civil service regulations.<br />
3. Parent Group refers to former employees of Singapore Technologies Pte Ltd. No options were granted to former employees of Singapore<br />
Technologies Pte Ltd since 2005.<br />
Since the commencement of the Share Option Plan, no options have been granted to the controlling shareholders<br />
of the Company or their associates. No participant under the Share Option Plan has been granted 5% or more of<br />
the total options available. No options have been offered at a discount.<br />
The options granted by the Company do not entitle the holders of the options, by virtue of such holdings, to any<br />
right to participate in any share issue of any company.<br />
96 Delivering Essential Solutions <strong>Sembcorp</strong> Industries Annual Report 2008 97
Directors’<br />
Report<br />
Year Ended December 31, 2008<br />
SHARE-BASED INCENTIVE PLANS (cont’d)<br />
a. Share Option Plan (cont’d)<br />
vi. Share options of a listed subsidiary<br />
At the end of the financial year, details of the options granted under the Share Option Plan on unissued ordinary<br />
shares of <strong>Sembcorp</strong> Marine Ltd are as follows:<br />
<strong>Sembcorp</strong> Marine Ltd<br />
Ordinary shares<br />
2008<br />
Number of<br />
options holders /<br />
Options<br />
(including<br />
Exercise Options cancelled / Options number of<br />
Date of grant price outstanding at Options lapsed / outstanding at directors) at<br />
of options per share Jan 1, 2008 exercised not accepted Dec 31, 2008 Dec 31, 2008 Exercise period<br />
08/09/2000 S$0.50 198,870 (7,700) – 191,170 15 / (–) 08/09/2001 to 07/09/2010<br />
27/09/2001 S$0.47 259,280 (80,570) – 178,710 25 / (–) 28/09/2002 to 27/09/2011<br />
07/11/2002 S$0.64 513,650 (177,250) (700) 335,700 63 / (–) 08/11/2003 to 07/11/2012<br />
08/08/2003 S$0.71 142,800 (142,800) – – – / (–) 09/08/2004 to 08/08/2008<br />
08/08/2003 S$0.71 2,130,490 (1,106,820) (8,400) 1,015,270 109 / (–) 09/08/2004 to 08/08/2013<br />
10/08/2004 S$0.74 430,500 (378,000) – 52,500 1 / (–) 11/08/2005 to 10/08/2009<br />
10/08/2004 S$0.74 6,856,205 (3,154,220) (115,100) 3,586,885 462 / (–) 11/08/2005 to 10/08/2014<br />
11/08/2005 S$2.11 365,750 (115,500) – 250,250 4 / (1) 12/08/2006 to 11/08/2010<br />
11/08/2005 S$2.11 12,635,335 (2,609,460) (322,400) 9,703,475 915 / (–) 12/08/2006 to 11/08/2015<br />
02/10/2006 S$2.38 724,500 (75,250) – 649,250 7 / (2) 03/10/2007 to 02/10/2011<br />
02/10/2006 S$2.38 11,319,490 (894,585) (469,071) 9,955,834 1,062 / (–) 03/10/2007 to 02/10/2016<br />
35,576,870 (8,742,155) (915,671) 25,919,044<br />
SHARE-BASED INCENTIVE PLANS (cont’d)<br />
a. Share Option Plan (cont’d)<br />
vi. Share options of a listed subsidiary (cont’d)<br />
<strong>Sembcorp</strong> Marine Ltd<br />
Ordinary shares<br />
2007<br />
Number of<br />
Options options holders /<br />
granted for Options Options (including<br />
Exercise Options bonus shares cancelled / outstanding number of<br />
Date of grant price # outstanding issued during Options lapsed / at directors) at<br />
of options per share at Jan 1, 2007 the year exercised not accepted Dec 31, 2007 Dec 31, 2007 Exercise period<br />
08/09/2000 S$0.50 298,000 61,260 (80,440) (79,950) 198,870 20 / (–) 08/09/2001 to 07/09/2010<br />
27/09/2001 S$0.47 510,200 108,680 (333,850) (25,750) 259,280 37 / (–) 28/09/2002 to 27/09/2011<br />
07/11/2002 S$0.64 140,000 – (140,000) – – – / (–) 08/11/2003 to 07/11/2007<br />
07/11/2002 S$0.64 3,202,450 182,700 (2,688,750) (182,750) 513,650 93 / (–) 08/11/2003 to 07/11/2012<br />
08/08/2003 S$0.71 367,000 40,800 (265,000) – 142,800 3 / (–) 09/08/2004 to 08/08/2008<br />
08/08/2003 S$0.71 5,311,650 721,240 (3,682,150) (220,250) 2,130,490 192 / (–) 09/08/2004 to 08/08/2013<br />
10/08/2004 S$0.74 510,000 129,000 (187,500) (21,000) 430,500 4 / (–) 11/08/2005 to 10/08/2009<br />
10/08/2004 S$0.74 8,968,200 2,085,380 (3,726,325) (471,050) 6,856,205 905 / (–) 11/08/2005 to 10/08/2014<br />
11/08/2005 S$2.11 505,000 130,500 (185,750) (84,000) 365,750 5 / (1) 12/08/2006 to 11/08/2010<br />
11/08/2005 S$2.11 13,405,650 3,803,910 (3,902,275) (671,950) 12,635,335 978 / (–) 12/08/2006 to 11/08/2015<br />
02/10/2006 S$2.38 560,000 224,000 (59,500) – 724,500 8 / (2) 03/10/2007 to 02/10/2011<br />
02/10/2006 S$2.38 9,224,075 3,480,850 (648,335) (737,100) 11,319,490 1,144 / (–) 03/10/2007 to 02/10/2016<br />
43,002,225 10,968,320 (15,899,875) (2,493,800) 35,576,870<br />
# Adjusted for two bonus shares credited as fully paid for every five existing ordinary shares.<br />
98 Delivering Essential Solutions <strong>Sembcorp</strong> Industries Annual Report 2008 99
Directors’<br />
Report<br />
Year Ended December 31, 2008<br />
SHARE-BASED INCENTIVE PLANS (cont’d)<br />
b. Performance Share Plan<br />
Under the Performance Share Plan, the awards granted conditional on performance targets are set based on mediumterm<br />
corporate objectives at the start of each rolling three-year performance qualifying period. A specific number of<br />
performance shares shall be awarded at the end of the three-year performance cycle depending on the extent of the<br />
achievement of the performance conditions established at the onset.<br />
The performance levels were calibrated based on Wealth Added and Total Shareholder Return. For each performance<br />
measure, three distinct performance levels were set. A minimum of threshold performance must be achieved to trigger<br />
an achievement factor, which in turn determines the number of shares to be finally awarded. Performance shares to be<br />
delivered will range between 0% to 150% of the conditional performance shares awarded.<br />
Senior management participants are required to hold a minimum percentage of the shares released to them under<br />
the Performance Share Plan and Restricted Stock Plan to maintain a beneficial ownership stake in the Group, for the<br />
duration of their employment or tenure with the Group. A maximum cap is set based on a multiple of the individual<br />
participant’s Annual Base Salary. Any excess can be sold off, but in the event of a shortfall, they have a two calendar<br />
year period to meet the minimum percentage requirement.<br />
i. <strong>Sembcorp</strong> Industries Ltd Performance Shares<br />
The details of performance shares of <strong>Sembcorp</strong> Industries Ltd awarded during the financial year since<br />
commencement of the Performance Share Plan (aggregate) were as follows:<br />
Aggregate<br />
additional<br />
Aggregate conditional Aggregate<br />
Conditional original performance Aggregate Aggregate conditional<br />
performance conditional shares awarded conditional conditional performance<br />
shares awarded performance due to performance performance shares<br />
Performance shares participants during the year shares awarded modification shares released shares lapsed outstanding<br />
2008<br />
Director of the Company:<br />
Tang Kin Fei 400,000 2,240,000 73,720 (931,240) (359,914) 1,236,484<br />
Key executives of the Group 550,000 5,555,000 69,989 (1,423,859) (2,878,682) 1,504,280<br />
950,000 7,795,000 143,709 (2,355,099) (3,238,596) 2,740,764<br />
SHARE-BASED INCENTIVE PLANS (cont’d)<br />
b. Performance Share Plan (cont’d)<br />
i. <strong>Sembcorp</strong> Industries Ltd Performance Shares (cont’d)<br />
With the Committee’s approval on the achievement factor for the achievement of the performance targets for the<br />
performance period 2005 to 2007, a total of 1,176,549 (2007: 252,850) performance shares were released, of which<br />
an additional 395,750 (2007: Nil) performance shares were awarded for the over-achievement of the performance<br />
targets. These shares were released via the issuance of treasury shares.<br />
ii.<br />
The total number of performance shares in awards granted conditionally and representing 100% of targets to be<br />
achieved, but not released as at end 2008, was 2,740,764 (2007: 2,582,259). Based on the multiplying factor, the<br />
actual release of the awards could range from zero to a maximum of 4,111,146 (2007: 3,873,389) performance<br />
shares.<br />
Performance shares of a listed subsidiary<br />
The details of performance shares of <strong>Sembcorp</strong> Marine Ltd awarded during the year since commencement of the<br />
Performance Share Plan (aggregate) were as follows:<br />
2008 2007<br />
Conditional performance shares awarded during the financial year 790,000 700,000<br />
Aggregate conditional performance shares awarded 5,215,000 4,395,000<br />
Additional performance shares awarded arising<br />
from targets met during the financial year 542,500 830,000<br />
Aggregate conditional performance shares released (2,721,900) (1,555,400)<br />
Aggregate conditional performance shares lapsed (425,600) (764,600)<br />
Aggregate conditional performance shares outstanding 2,610,000 2,905,000<br />
No performance shares of <strong>Sembcorp</strong> Marine Ltd were awarded to the directors of the Company.<br />
The total number of <strong>Sembcorp</strong> Marine Ltd’s performance shares in awards granted conditionally and representing<br />
100% of targets to be achieved, but not released as at end 2008, was 2,610,000 (2007: 2,905,000). Based on the<br />
multiplying factor, the actual release of the awards could range from zero to a maximum of 3,915,000 (2007:<br />
4,357,000) performance shares.<br />
2007<br />
Director of the Company:<br />
Tang Kin Fei 400,000 1,840,000 73,720 (289,486) (359,914) 1,264,320<br />
Key executives of the Group 490,000 5,005,000 69,989 (889,064) (2,867,986) 1,317,939<br />
890,000 6,845,000 143,709 (1,178,550) (3,227,900) 2,582,259<br />
100 Delivering Essential Solutions <strong>Sembcorp</strong> Industries Annual Report 2008 101
Directors’<br />
Report<br />
Year Ended December 31, 2008<br />
SHARE-BASED INCENTIVE PLANS (cont’d)<br />
c. Restricted Stock Plan<br />
From 2007, share option grant was ceased and entirely replaced with restricted stock award of an equivalent fair value.<br />
Under the Restricted Stock Plan, the awards granted conditional on performance targets are set based on corporate<br />
objectives at the start of each rolling two-year performance qualifying period. The performance criteria are set and<br />
performance levels for the restricted stocks are calibrated based on Return on Total Assets and Total Shareholder Return.<br />
For awards granted before 2008, three distinct performance levels are set for each performance measure. A minimum<br />
threshold performance must be achieved to trigger an achievement factor, which in turn determines the number of<br />
shares to be finally awarded. Based on the criteria, restricted stocks to be delivered will range from 0% to 130% of the<br />
conditional restricted stocks awarded.<br />
For awards granted in 2008, four distinct performance levels are set for each performance measure. A minimum<br />
threshold performance must be achieved to trigger an achievement factor, which in turn determines the number of<br />
shares to be finally awarded. Based on the criteria, restricted stocks to be delivered will range from 0% to 150% of the<br />
conditional restricted stocks awarded.<br />
The managerial participants of the Group will be awarded restricted stocks under the Restricted Stock Plan, while<br />
the non-managerial participants of the Group will receive their awards in an equivalent cash value. This cash-settled<br />
notional restricted stocks award for non-managerial participants is known as the <strong>Sembcorp</strong> Challenge Bonus.<br />
A specific number of restricted stocks shall be awarded at the end of the two-year performance cycle depending on<br />
the extent of the achievement of the performance conditions established at the onset. There is a further vesting period<br />
of three years after the performance period, during which one-third of the awarded shares are released each year to<br />
managerial participants. Non-managerial participants will receive the equivalent in cash at the end of the two-year<br />
performance cycle, with no further vesting conditions.<br />
Senior management participants are required to hold a minimum percentage of the shares released to them under<br />
the Restricted Stock Plan and Performance Share Plan to maintain a beneficial ownership stake in the Group, for the<br />
duration of their employment or tenure with the Group. A maximum cap is set based on a multiple of the individual<br />
participant’s Annual Base Salary. Any excess can be sold off, but in the event of a shortfall, they have a two calendar<br />
year period to meet the minimum percentage requirement.<br />
SHARE-BASED INCENTIVE PLANS (cont’d)<br />
c. Restricted Stock Plan (cont’d)<br />
i. <strong>Sembcorp</strong> Industries Ltd Restricted Stocks<br />
The details of restricted stocks of <strong>Sembcorp</strong> Industries Ltd awarded during the year since commencement of the<br />
Restricted Stock Plan (aggregate) were as follows:<br />
Aggregate<br />
additional<br />
Aggregate conditional Aggregate<br />
Conditional original restricted Aggregate Aggregate conditional<br />
restricted conditional stocks awarded conditional conditional restricted<br />
stocks awarded restricted due to restricted restricted stocks<br />
Restricted stocks participants during the year stocks awarded modification stocks released stocks lapsed outstanding<br />
2008<br />
Directors of the Company:<br />
Peter Seah Lim Huat 23,500 47,000 484 – – 47,484<br />
Tang Kin Fei 126,000 318,000 6,785 (30,416) – 315,426<br />
Goh Geok Ling 13,700 27,400 282 – – 27,682<br />
Richard Hale, OBE 17,000 34,000 350 – – 34,350<br />
Evert Henkes 7,000 14,000 144 – – 14,144<br />
Lee Suet Fern 13,700 27,400 282 – – 27,682<br />
Other executives<br />
of the Group 1,977,300 4,728,100 93,425 (409,185) (508,255) 4,162,821<br />
2,178,200 5,195,900 101,752 (439,601) (508,255) 4,629,589<br />
2007<br />
Directors of the Company:<br />
Peter Seah Lim Huat 23,500 23,500 484 – – 23,984<br />
Tang Kin Fei 126,000 192,000 6,785 – – 198,785<br />
Goh Geok Ling 13,700 13,700 282 – – 13,982<br />
Richard Hale, OBE 17,000 17,000 350 – – 17,350<br />
Evert Henkes 7,000 7,000 144 – – 7,144<br />
Lee Suet Fern 13,700 13,700 282 – – 13,982<br />
K Shanmugam 13,700 13,700 282 – – 13,982<br />
Other executives<br />
of the Group 1,753,300 2,737,100 93,143 – (229,212) 2,601,031<br />
1,967,900 3,017,700 101,752 – (229,212) 2,890,240<br />
102 Delivering Essential Solutions <strong>Sembcorp</strong> Industries Annual Report 2008 103
Directors’<br />
Report<br />
Year Ended December 31, 2008<br />
SHARE-BASED INCENTIVE PLANS (cont’d)<br />
c. Restricted Stock Plan (cont’d)<br />
i. <strong>Sembcorp</strong> Industries Ltd Restricted Stocks (cont’d)<br />
With the Committee’s approval on the achievement factor for the achievement of the performance targets for<br />
the performance period 2006 to 2007, a total of 439,601 restricted stocks were released. An additional 279,793<br />
restricted stocks were awarded for the over-achievement of the performance targets. These restricted stocks were<br />
released via the issuance of treasury shares. There was no release of restricted stocks in the year 2007.<br />
The total number of restricted stocks outstanding, including award(s) achieved but not released, as at end 2008,<br />
was 4,629,589 (2007: 2,890,240). Of this, the total number of restricted stocks in awards granted conditionally<br />
and representing 100% of targets to be achieved, but not released was 3,900,597 (2007: 2,890,240). Based on the<br />
multiplying factor, the actual release of the conditional awards could range from zero to a maximum of 5,491,236<br />
(2007: 3,757,312) restricted stocks.<br />
A total of 600,000 (2007: 546,000) notional restricted stocks of <strong>Sembcorp</strong> Industries Ltd’s shares were awarded<br />
on April 7, 2008 for the <strong>Sembcorp</strong> Challenge Bonus for non-managerial participants for the performance period<br />
2008 to 2009. With the Committee’s approval during the year, an additional 11,248 notional restricted stocks for<br />
the performance period 2007 to 2008 were added to the outstanding awards as a result of the Special Dividend<br />
payment in April 2007, therefore the total outstanding notional restricted stocks for the performance period 2007<br />
to 2008 is 557,248.<br />
The total number of notional restricted stocks in awards for the <strong>Sembcorp</strong> Challenge Bonus granted conditionally<br />
and representing 100% of targets to be achieved, but not released as at end 2008, was 1,157,248 (2007: 546,000).<br />
Based on the multiplying factor, the number of notional restricted stocks to be converted into the funding pool<br />
could range from zero to a maximum of 1,624,422 (2007: 709,800).<br />
SHARE-BASED INCENTIVE PLANS (cont’d)<br />
c. Restricted Stock Plan (cont’d)<br />
ii. Restricted stocks of a listed subsidiary (cont’d)<br />
The total number of <strong>Sembcorp</strong> Marine Ltd’s restricted stocks in awards granted conditionally and representing<br />
100% of targets to be achieved, but not released as at end of 2008, was 8,762,851 (2007: 6,793,685 1 ). Based<br />
on the multiplying factor, the actual release of the awards could range from zero to a maximum of 11,391,706<br />
(2007: 8,831,791 2 ) restricted stocks. In 2008, an additional 477,893 restricted stocks were awarded for the overachievement<br />
of the performance targets for the performance period 2006 to 2007.<br />
Notes:<br />
1. Includes 1,046,458 notional restricted stocks in awards for the Challenge Bonus.<br />
2. Includes 1,360,396 notional restricted stocks in awards for the Challenge Bonus.<br />
d. Maximum Number of Shares Issuable<br />
The maximum number of performance shares and restricted stocks which could be delivered, when aggregated with<br />
the number of new shares issued and issuable in respect of all options granted, is within the 15% limit of the share<br />
capital of the Company on the day preceding the relevant date of the grant.<br />
AUDIT COMMITTEE<br />
The members of the Audit Committee during the year and at the date of this report are:<br />
Richard Hale, OBE (Chairman)<br />
Lee Suet Fern<br />
Yong Ying-I<br />
Bobby Chin Yoke Choong (Appointed on December 1, 2008)<br />
ii.<br />
Restricted stocks of a listed subsidiary<br />
The details of restricted stocks of <strong>Sembcorp</strong> Marine Ltd awarded during the year since commencement of the<br />
Restricted Stock Plan (aggregate) were as follows:<br />
Aggregate<br />
additional<br />
Aggregate conditional Aggregate<br />
Conditional original restricted Aggregate Aggregate conditional<br />
restricted conditional stocks awarded conditional conditional restricted<br />
stocks awarded restricted due to restricted restricted stocks<br />
Restricted stocks participants during the year stocks awarded bonus issue stocks released stocks lapsed outstanding<br />
2008<br />
Directors of the Company:<br />
Tang Kin Fei 12,000 25,500 5,400 – – 30,900<br />
Goh Geok Ling 22,000 44,000 8,800 – – 52,800<br />
Other participants 3,539,000 7,534,632 1,931,720 (708,128) (556,966) 8,679,151<br />
3,573,000 7,604,132 1,945,920 (708,128) (556,966) 8,762,851<br />
2007<br />
Directors of the Company:<br />
Tang Kin Fei 13,500 13,500 5,400 – – 18,900<br />
Goh Geok Ling 22,000 22,000 8,800 – – 30,800<br />
Other participants 3,819,690 5,042,090 1,931,720 – (229,825) 6,743,985<br />
3,855,190 5,077,590 1,945,920 – (229,825) 6,793,685<br />
The Audit Committee held four meetings during the financial year. In performing its functions, the Audit Committee met<br />
with the Company’s external and internal auditors to discuss the scope of their work, the results of their examination and<br />
their evaluation of the Company’s internal accounting control system.<br />
The Audit Committee performed the functions specified in Section 201B of the Singapore Companies Act, Chapter 50, the<br />
Listing Manual of the Singapore Exchange, and the Code of Corporate Governance.<br />
The Audit Committee also reviewed the following:<br />
• assistance provided by the Company’s officers to the external and internal auditors;<br />
• financial statements of the Group and the Company prior to their submission to the directors of the Company for<br />
adoption; and<br />
• interested person transactions (as defined in Chapter 9 of the Listing Manual of the Singapore Exchange).<br />
The Audit Committee has full access to the management and is given the resources required for it to discharge its functions.<br />
It has full authority and the discretion to invite any director or executive officer to attend its meetings. The Audit Committee<br />
also recommends the appointment of the external auditors and reviews the level of audit and non-audit fees.<br />
104 Delivering Essential Solutions <strong>Sembcorp</strong> Industries Annual Report 2008 105
Directors’<br />
Report<br />
Year Ended December 31, 2008<br />
Statement by Directors<br />
Year Ended December 31, 2008<br />
AUDIT COMMITTEE (cont’d)<br />
The Audit Committee is satisfied with the independence and objectivity of the external auditors and has recommended<br />
to the Board of Directors that the auditors, KPMG LLP, be nominated for re-appointment as auditors at the forthcoming<br />
Annual General Meeting of the Company.<br />
AUDITORS<br />
The auditors, KPMG LLP, have indicated their willingness to accept re-appointment.<br />
On behalf of the Board of Directors<br />
In our opinion:<br />
a. the financial statements set out on pages 110 to 215 are drawn up so as to give a true and fair view of the state of<br />
affairs of the Group and of the Company as at December 31, 2008, and the results, changes in equity and cash flows of<br />
the Group for the year ended on that date in accordance with the provisions of the Singapore Companies Act, Chapter<br />
50 and Singapore Financial Reporting Standards; and<br />
b. at the date of this statement, there are reasonable grounds to believe that the Company will be able to pay its debts<br />
as and when they fall due.<br />
The Board of Directors has, on the date of this statement, authorised these financial statements for issue.<br />
On behalf of the Board of Directors<br />
PETER SEAH LIM HUAT<br />
Chairman<br />
TANG KIN FEI<br />
Director<br />
Singapore<br />
February 26, 2009<br />
PETER SEAH LIM HUAT<br />
Chairman<br />
Singapore<br />
February 26, 2009<br />
TANG KIN FEI<br />
Director<br />
106 Delivering Essential Solutions <strong>Sembcorp</strong> Industries Annual Report 2008 107
Independent Auditors’ Report<br />
Year Ended December 31, 2008<br />
INDEPENDENT AUDITORS’ REPORT<br />
MEMBERS OF THE COMPANY<br />
SEMBCORP INDUSTRIES LTD<br />
We have audited the financial statements of <strong>Sembcorp</strong> Industries Ltd (the “Company”) and its subsidiaries (the “Group”),<br />
which comprise the balance sheets of the Group and of the Company as at December 31, 2008, the income statement,<br />
statement of changes in equity and cash flow statement of the Group for the year then ended, and a summary of significant<br />
accounting policies and other explanatory notes, as set out on pages 110 to 215.<br />
Management’s responsibility for the financial statements<br />
Management is responsible for the preparation and fair presentation of these financial statements in accordance with<br />
the provisions of the Singapore Companies Act, Chapter 50 (the “Act”) and Singapore Financial Reporting Standards. This<br />
responsibility includes:<br />
Opinion<br />
In our opinion:<br />
a. the consolidated financial statements of the Group and the balance sheet of the Company are properly drawn up in<br />
accordance with the provisions of the Act and Singapore Financial Reporting Standards to give a true and fair view of<br />
the state of affairs of the Group and of the Company as at December 31, 2008 and the results, changes in equity and<br />
cash flows of the Group for the year ended on that date; and<br />
b. the accounting and other records required by the Act to be kept by the Company and by those subsidiaries incorporated<br />
in Singapore of which we are the auditors, have been properly kept in accordance with the provisions of the Act.<br />
a. devising and maintaining a system of internal accounting controls sufficient to provide a reasonable assurance that<br />
assets are safeguarded against loss from unauthorised use or disposition; and transactions are properly authorised and<br />
that they are recorded as necessary to permit the preparation of true and fair profit and loss accounts and balance<br />
sheets and to maintain accountability of assets;<br />
b. selecting and applying appropriate accounting policies; and<br />
c. making accounting estimates that are reasonable in the circumstances.<br />
Auditors’ responsibility<br />
Our responsibility is to express an opinion on these financial statements based on our audit. We conducted our audit in<br />
accordance with Singapore Standards on Auditing. Those standards require that we comply with ethical requirements<br />
and plan and perform the audit to obtain reasonable assurance whether the financial statements are free from material<br />
misstatement.<br />
KPMG LLP<br />
Public Accountants and<br />
Certified Public Accountants<br />
Singapore<br />
February 26, 2009<br />
An audit involves performing procedures to obtain audit evidence about the amounts and disclosures in the financial<br />
statements. The procedures selected depend on the auditor’s judgement, including the assessment of the risks of material<br />
misstatement of the financial statements, whether due to fraud or error. In making those risk assessments, the auditor<br />
considers internal control relevant to the entity’s preparation and fair presentation of the financial statements in order<br />
to design audit procedures that are appropriate in the circumstances, but not for the purpose of expressing an opinion<br />
on the effectiveness of the entity’s internal control. An audit also includes evaluating the appropriateness of accounting<br />
policies used and the reasonableness of accounting estimates made by the management, as well as evaluating the overall<br />
presentation of the financial statements.<br />
We believe that the audit evidence we have obtained is sufficient and appropriate to provide a basis for our audit opinion.<br />
108 Delivering Essential Solutions <strong>Sembcorp</strong> Industries Annual Report 2008 109
Balance Sheets<br />
Year Ended December 31, 2008<br />
Consolidated<br />
Income Statement<br />
Year Ended December 31, 2008<br />
Group<br />
Company<br />
2008 2007 2008 2007<br />
Note S$’000 S$’000 S$’000 S$’000<br />
Equity attributable to shareholders of the Company:<br />
Share capital 3 554,037 551,274 554,037 551,274<br />
(Deficit) / Surplus in other reserves 5 (42,381) 639,448 (12,111) 23,699<br />
Accumulated profits 2,082,541 1,842,096 879,454 884,427<br />
2,594,197 3,032,818 1,421,380 1,459,400<br />
Minority interests 670,660 797,211 – –<br />
Total equity 3,264,857 3,830,029 1,421,380 1,459,400<br />
Non-current assets<br />
Property, plant and equipment 6 2,498,577 2,601,709 485,403 3,422<br />
Investment properties 7 25,959 31,291 – –<br />
Investments in subsidiaries 8 – – 1,486,570 1,479,440<br />
Interests in associates 9 564,388 515,487 – –<br />
Interests in joint ventures 10 280,816 270,389 – –<br />
Other financial assets 11 146,080 708,234 – –<br />
Long-term receivables and prepayments 12 231,401 49,572 940 –<br />
Intangible assets 16 114,771 109,510 19,036 90<br />
Deferred tax assets 17 35,217 37,823 – –<br />
3,897,209 4,324,015 1,991,949 1,482,952<br />
Current assets<br />
Inventories and work-in-progress 18 949,846 1,657,047 9,353 –<br />
Trade and other receivables 19 1,219,101 1,404,696 217,379 198,310<br />
Assets held for sale 21 – 26,682 – –<br />
Cash and cash equivalents 22 2,400,954 1,296,892 45,541 189,470<br />
4,569,901 4,385,317 272,273 387,780<br />
Current liabilities<br />
Trade and other payables 23 2,621,434 2,242,427 316,534 249,183<br />
Excess of progress billings over work-in-progress 18 975,033 568,741 – –<br />
Provisions 27 63,753 31,798 12,675 11,454<br />
Current tax payable 249,882 169,105 – –<br />
Interest-bearing borrowings 29 285,768 510,194 – 150,000<br />
4,195,870 3,522,265 329,209 410,637<br />
Group<br />
2008 2007<br />
Note S$’000 S$’000<br />
Turnover 31 9,928,413 8,618,778<br />
Cost of sales (8,896,422) (7,802,101)<br />
Gross profit 1,031,991 816,677<br />
Non-operating income (net) 12,864 117,237<br />
General and administrative expenses (264,599) (246,079)<br />
Finance costs 32 (44,407) (53,925)<br />
Share of results (net of tax) of:<br />
– Associates 80,872 96,853<br />
– Joint ventures 45,224 56,343<br />
Profit before income tax 861,945 787,106<br />
Income tax expense 33 (130,951) (135,764)<br />
Profit for the year 34 730,994 651,342<br />
Attributable to:<br />
Shareholders of the Company 507,061 526,217<br />
Minority interests 223,933 125,125<br />
Profit for the year 730,994 651,342<br />
Earnings per share (cents): 35<br />
Basic 28.50 29.57<br />
Diluted 28.27 29.25<br />
Net current assets / (liabilities) 374,031 863,052 (56,936) (22,857)<br />
4,271,240 5,187,067 1,935,013 1,460,095<br />
Non-current liabilities<br />
Deferred tax liabilities 17 271,960 385,567 50,671 195<br />
Provisions 27 10,254 10,034 500 500<br />
Retirement benefit obligations 28 13,552 24,109 – –<br />
Interest-bearing borrowings 29 522,550 823,486 – –<br />
Other long-term liabilities 30 188,067 113,842 462,462 –<br />
1,006,383 1,357,038 513,633 695<br />
3,264,857 3,830,029 1,421,380 1,459,400<br />
The accompanying notes form an integral part of these financial statements.<br />
The accompanying notes form an integral part of these financial statements.<br />
110 Delivering Essential Solutions <strong>Sembcorp</strong> Industries Annual Report 2008 111
Consolidated Statement<br />
of Changes in Equity<br />
Year Ended December 31, 2008<br />
Attributable to shareholders of the Company<br />
Currency<br />
Share Reserve for Other translation Accumulated Minority Total<br />
capital own shares reserves reserve profits Total interests equity<br />
S$’000 S$’000 S$’000 S$’000 S$’000 S$’000 S$’000 S$’000<br />
Group<br />
At January 1, 2008 551,274 – 676,831 (37,383) 1,842,096 3,032,818 797,211 3,830,029<br />
Translation adjustments – – – (90,442) – (90,442) 6,003 (84,439)<br />
Net fair value changes of available-for-sale financial assets, net of tax – – (278,803) – – (278,803) (174,162) (452,965)<br />
Net fair value changes of available-for-sale financial assets transferred<br />
to the income statement, net of tax – – (725) – – (725) – (725)<br />
Net fair value changes of cash flow hedges transferred to the income statement – – (1,296) – – (1,296) – (1,296)<br />
Net fair value changes of cash flow hedges, net of tax – – (148,431) – – (148,431) (28,062) (176,493)<br />
Share of reserves of associates and joint venture companies – – (89,022) 7,461 – (81,561) 4,976 (76,585)<br />
Realisation of reserve upon disposal of investments and changes in group structure – – 381 (1,286) 274 (631) (12,702) (13,333)<br />
Net (loss) / gain recognised directly in equity – – (517,896) (84,267) 274 (601,889) (203,947) (805,836)<br />
Profit for the year – – – – 507,061 507,061 223,933 730,994<br />
Total (loss) / gain recognised for the year – – (517,896) (84,267) 507,335 (94,828) 19,986 (74,842)<br />
Issue of shares under Share Option Plan 2,763 – – – – 2,763 – 2,763<br />
Issue of shares to minority shareholders of subsidiaries – – – – – – 10,778 10,778<br />
Share-based payments – – 18,134 – – 18,134 5,003 23,137<br />
Purchase of treasury shares – (50,825) – – – (50,825) – (50,825)<br />
Issue of treasury shares under Share Option Plan – 9,285 – – – 9,285 – 9,285<br />
Issue of treasury shares under Performance Share Plan – 4,958 – – – 4,958 – 4,958<br />
Issue of treasury shares under Restricted Stock Plan – 1,851 – – – 1,851 – 1,851<br />
Treasury shares transferred to employees – – (28,690) – – (28,690) (10,874) (39,564)<br />
Treasury shares held by subsidiary – – (34,379) – – (34,379) (21,476) (55,855)<br />
Final one-tier tax exempt dividend paid of 15.0 cents per share in respect of year 2007 – – – – (266,890) (266,890) – (266,890)<br />
Dividend paid to minority shareholders of subsidiaries – – – – – – (129,968) (129,968)<br />
At December 31, 2008 554,037 (34,731) 114,000 (121,650) 2,082,541 2,594,197 670,660 3,264,857<br />
An analysis of the movements in each category within “Other reserves” is presented in Note 5(c).<br />
The accompanying notes form an integral part of these financial statements.<br />
112 Delivering Essential Solutions <strong>Sembcorp</strong> Industries Annual Report 2008 113
Consolidated Statement<br />
of Changes in Equity<br />
Year Ended December 31, 2008<br />
Attributable to shareholders of the Company<br />
Currency<br />
Share Other translation Accumulated Minority Total<br />
capital reserves reserve profits Total interests equity<br />
S$’000 S$’000 S$’000 S$’000 S$’000 S$’000 S$’000<br />
Group<br />
At January 1, 2007 525,414 488,658 (13,920) 1,811,447 2,811,599 648,186 3,459,785<br />
Effect of adopting INT FRS 112 – – (66) 1,643 1,577 – 1,577<br />
At January 1, 2007, restated 525,414 488,658 (13,986) 1,813,090 2,813,176 648,186 3,461,362<br />
Translation adjustments – – (23,060) – (23,060) (5,857) (28,917)<br />
Net fair value changes of available-for-sale financial assets, net of tax – 265,686 – – 265,686 166,297 431,983<br />
Net fair value changes of available-for-sale financial assets transferred to<br />
the income statement, net of tax – (90,652) – – (90,652) (56,761) (147,413)<br />
Net fair value changes of cash flow hedges, net of tax – 19,554 – – 19,554 45 19,599<br />
Share of reserves of associates and joint venture companies – (18,648) (113) – (18,761) (16) (18,777)<br />
Realisation of reserve upon disposal of investments and changes in group structure – (6,492) (224) 805 (5,911) (4,595) (10,506)<br />
Net gain / (loss) recognised directly in equity – 169,448 (23,397) 805 146,856 99,113 245,969<br />
Profit for the year – – – 526,217 526,217 125,125 651,342<br />
Total gain / (loss) recognised for the year – 169,448 (23,397) 527,022 673,073 224,238 897,311<br />
Issue of shares under Share Option Plan 25,860 – – – 25,860 – 25,860<br />
Issue of shares to minority shareholders of subsidiaries – – – – – 26,772 26,772<br />
Share-based payments – 18,725 – – 18,725 6,226 24,951<br />
Final dividend paid of 4.9 cents per share less tax at 18% in respect of year 2006 – – – (71,419) (71,419) – (71,419)<br />
Final one-tier tax exempt dividend paid of 8.0 cents per share in respect of year 2006 – – – (142,199) (142,199) – (142,199)<br />
Special final one-tier tax exempt dividend paid of 16.0 cents per share in respect of year 2006 – – – (284,398) (284,398) – (284,398)<br />
Dividend paid to minority shareholders of subsidiaries – – – – – (108,211) (108,211)<br />
At December 31, 2007 551,274 676,831 (37,383) 1,842,096 3,032,818 797,211 3,830,029<br />
An analysis of the movements in each category within “Other reserves” is presented in Note 5(c).<br />
The accompanying notes form an integral part of these financial statements.<br />
114 Delivering Essential Solutions <strong>Sembcorp</strong> Industries Annual Report 2008 115
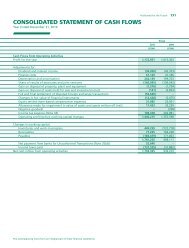
Consolidated<br />
Cash Flow Statement<br />
Year Ended December 31, 2008<br />
Group<br />
2008 2007<br />
Cash Flows from Operating Activities<br />
Profit for the year 730,994 651,342<br />
Adjustments for:<br />
Dividend and interest income (45,543) (53,694)<br />
Finance costs 44,407 53,925<br />
Depreciation and amortisation 195,069 182,859<br />
Share of results of associates and joint ventures (126,096) (157,701)<br />
Gain on disposal of property, plant and equipment<br />
and investment properties (18,393) (9,913)<br />
Loss on disposal of other financial assets (net) 38,697 19,910<br />
Allowance made / (written back) for doubtful debts<br />
and bad debts written off (net) 1,528 (6,491)<br />
Change in fair value of derivative instruments (net) 36,668 (922)<br />
Share-based expenses 31,253 26,237<br />
Allowance made for impairment in value of assets<br />
and assets written off (net) 10,883 7,628<br />
Income tax expense (Note 33) 130,951 135,764<br />
Operating profit before working capital changes 1,030,418 848,944<br />
Changes in working capital:<br />
Inventories and work-in-progress 1,114,381 (361,848)<br />
Receivables 6,803 (115,102)<br />
Payables 199,102 550,781<br />
2,350,704 922,775<br />
Net payment to banks for Unauthorised Transactions (43,749) (260,589)<br />
Income taxes paid (45,546) (48,155)<br />
Net cash inflow from operating activities 2,261,409 614,031<br />
S$’000<br />
S$’000<br />
Group<br />
2008 2007<br />
Cash Flows from Investing Activities<br />
Dividends and interest received 120,720 98,234<br />
Cash flows on divestment of subsidiaries, net of cash 2,124 98,385<br />
Proceeds from divestment of associates and joint ventures 1,818 69,332<br />
Proceeds from divestment of investments 8,892 273,895<br />
Proceeds from sale of property, plant and equipment 93,279 47,605<br />
Proceeds from sale of investment properties 317 6,959<br />
Proceeds from sale of asset held for sale 26,682 11,000<br />
Additional interest in subsidiaries – (3,457)<br />
Acquisition of / additional investments in associates and joint ventures (1,495) (4,260)<br />
Acquisition of subsidiaries, net of cash acquired – 160<br />
Acquisition of other long-term investments – (46,187)<br />
Purchase of property, plant and equipment (361,705) (456,891)<br />
Payment for intangible assets (6,438) (55)<br />
Net cash (outflow) / inflow from investing activities (115,806) 94,720<br />
Cash Flows from Financing Activities<br />
Proceeds from share issue 2,763 25,860<br />
Proceeds from share issue to minority shareholders of subsidiaries 10,778 26,772<br />
Proceeds from ESOS exercised with issue of treasury shares 3,948 –<br />
Proceeds from ESOS exercised with issue of treasury shares<br />
to minority shareholders of subsidiaries 10,915 –<br />
Purchase of treasury shares (50,825) –<br />
Purchase of treasury shares by subsidiary (93,745) –<br />
Proceeds from borrowings 620,126 536,735<br />
Repayment of borrowings (1,059,198) (505,466)<br />
Net increase / (decrease) in other long-term liabilities 220 (5,220)<br />
Dividends paid to shareholders of the Company (266,890) (498,016)<br />
Dividends paid to minority shareholders of subsidiaries (129,968) (108,211)<br />
Interest paid (45,335) (53,482)<br />
Net cash outflow from financing activities (997,211) (581,028)<br />
S$’000<br />
S$’000<br />
Net increase in cash and cash equivalents 1,148,392 127,723<br />
Cash and cash equivalents at beginning of the year 1,296,003 1,172,975<br />
Effect of exchange rate changes on balances held in foreign currency (43,441) (4,695)<br />
Cash and cash equivalents at end of the year (Note 22) 2,400,954 1,296,003<br />
The accompanying notes form an integral part of these financial statements.<br />
The accompanying notes form an integral part of these financial statements.<br />
116 Delivering Essential Solutions <strong>Sembcorp</strong> Industries Annual Report 2008 117
Consolidated<br />
Cash Flow Statement<br />
Year Ended December 31, 2008<br />
Attributable net assets of subsidiaries divested and acquired during the year are as follows:<br />
Notes to the<br />
Financial Statements<br />
Year Ended December 31, 2008<br />
Group<br />
2008 2007<br />
Disposals<br />
Non-current assets 22,067 104,928<br />
Net current (liabilities) / assets (9,650) 3,791<br />
Non-current liabilities (2,044) (5,761)<br />
Minority interests (8,257) (1,824)<br />
2,116 101,134<br />
(Loss) / profit on disposal (597) 5,284<br />
Realisation of currency translation reserve 824 (1,113)<br />
Total consideration received 2,343 105,305<br />
Net cash at bank of subsidiaries disposed of (219) (6,920)<br />
Cash inflow on divestment 2,124 98,385<br />
Acquisitions<br />
Non-current assets – 17<br />
Net current assets – 484<br />
Minority interests – (150)<br />
Total consideration payable – 351<br />
Net cash at bank of subsidiaries acquired – (511)<br />
Cash inflow on acquisitions – (160)<br />
S$’000<br />
S$’000<br />
These notes form an integral part of the financial statements.<br />
The financial statements were authorised for issue by the Board of Directors on February 26, 2009.<br />
1. DOMICILE AND ACTIVITIES<br />
<strong>Sembcorp</strong> Industries Ltd (the “Company”) is a company incorporated in the Republic of Singapore and has its registered<br />
office at 30 Hill Street #05-04, Singapore 179360.<br />
Prior to January 2008, the principal activities of the Company were those of an investment holding company, as well<br />
as the corporate headquarters, which gives strategic direction and provides management services to its subsidiaries.<br />
In January 2008, the Company entered into an internal restructuring with its wholly-owned subsidiary, <strong>Sembcorp</strong><br />
Utilities Pte Ltd, for the acquisition of the entire assets, liabilities and businesses of <strong>Sembcorp</strong> Utilities & Terminals<br />
(“SUT”) and Propylene Purification Unit (“PPU”) divisions, including their current employees.<br />
Following the above acquisition, the principal activities of the Company includes:<br />
a. investment holding, as well as the corporate headquarters, which gives strategic direction and provides<br />
management services to its subsidiaries; and<br />
b. production and supply of utilities services, terminalling and storage of petroleum products and chemicals.<br />
The principal activities of key subsidiaries are as follows:<br />
i. Utilities<br />
This business focuses on the provision of centralised utilities, energy and water. It offers industrial utilities and<br />
services such as energy, steam, industrial water and wastewater treatment to energy intensive users. It operates in<br />
Singapore, the United Kingdom, China, Vietnam and the United Arab Emirates.<br />
ii.<br />
Marine<br />
This business focuses principally on repair, building and conversion of ships and rigs, and offshore engineering.<br />
iii. Environment<br />
The business provides integrated waste management services and undertakes waste-to-resource businesses in the<br />
Asia Pacific region.<br />
iv. Industrial Parks<br />
The business focuses principally on developing, marketing and managing industrial parks and townships in Asia.<br />
The consolidated financial statements relate to the Company and its subsidiaries (referred to as the “Group”) and the<br />
Group’s interests in associates and joint ventures.<br />
The accompanying notes form an integral part of these financial statements.<br />
118 Delivering Essential Solutions <strong>Sembcorp</strong> Industries Annual Report 2008 119
Notes to the<br />
Financial Statements<br />
Year Ended December 31, 2008<br />
2. SUMMARY OF SIGNIFICANT ACCOUNTING POLICIES<br />
a. Basis of Preparation<br />
The financial statements are prepared in accordance with Singapore Financial Reporting Standards (“FRS”).<br />
The financial statements are presented in Singapore dollars and rounded to the nearest thousand (“S$’000”),<br />
unless otherwise indicated. They are prepared on the historical cost basis except where otherwise described in the<br />
accounting policies below.<br />
The preparation of financial statements in conformity with FRS requires management to make judgements,<br />
estimates and assumptions that affect the application of accounting policies and reported amounts of assets,<br />
liabilities, income and expenses. Actual results may differ from these estimates.<br />
The estimates and underlying assumptions are reviewed on an ongoing basis. Revisions to accounting estimates are<br />
recognised in the period in which the estimates are revised and in any future periods affected.<br />
Information about significant areas of estimation uncertainty and critical judgements in applying accounting<br />
policies that have the most significant effect on the amount recognised in the financial statements are discussed<br />
in Note 43.<br />
With effect from January 1, 2008, the Group adopted the following new or amended FRS and Interpretations to<br />
FRS (“INT FRS”) which are relevant to the Group’s operations:<br />
INT FRS 111<br />
INT FRS 114<br />
FRS 102 – Group and Treasury Share Transactions<br />
FRS 19 – The Limit on a Defined Benefit Asset, Minimum Funding Requirements<br />
and their Interaction<br />
The adoption of the above INT FRS did not result in substantial changes to the Group’s accounting policies. The<br />
accounting policies set out below have been applied consistently by the Group. The accounting policies used by the<br />
Group have been applied consistently to all periods presented in these financial statements.<br />
b. Consolidation<br />
i. Subsidiaries<br />
Subsidiaries are those companies that are controlled by the Group. Control exists when the Group has the<br />
power, directly or indirectly, to govern the financial and operating policies of a company so as to obtain<br />
benefits from its activities.<br />
The existence and effect of potential voting rights that are presently exercisable or presently convertible are<br />
considered when assessing whether the Group controls another company.<br />
Investments in subsidiaries are stated in the Company’s balance sheet at cost less impairment losses. The<br />
financial statements of subsidiaries are included in the consolidated financial statements from the date that<br />
control commences until the date that control ceases.<br />
All business combinations are accounted for using the purchase method with effect from January 1, 2004<br />
upon the adoption of FRS 103. Prior to January 1, 2004, business combinations were accounted for either by<br />
the purchase method, or if they were between entities under common control, by the historical cost method<br />
similar to the pooling-of-interest method.<br />
2. SUMMARY OF SIGNIFICANT ACCOUNTING POLICIES (cont’d)<br />
b. Consolidation (cont’d)<br />
i. Subsidiaries (cont’d)<br />
Under the purchase method, the cost of an acquisition is measured at the fair value of the assets given, equity<br />
instruments issued and liabilities incurred or assumed at the date of exchange, plus costs directly attributable<br />
to the acquisition. The excess of the Group’s interest in the net fair value of the identifiable assets, liabilities<br />
and contingent liabilities over the cost of acquisition is credited to the income statement in the period of the<br />
acquisition.<br />
ii.<br />
Business combinations that involve entities under common control are excluded from the scope of FRS 103. Such<br />
combinations are accounted at historical cost in a manner similar to the pooling-of-interests method, in the<br />
preparation of the consolidated financial statements. Under this method of accounting, the difference between<br />
the value of the share capital issued and the value of shares received is taken to the merger reserve.<br />
The interest of minority shareholders is stated at the minority’s proportion of the fair values of the assets and<br />
liabilities recognised. Subsequently, any losses applicable to the minority interest in excess of the minority<br />
interest are allocated against the interests of the parent.<br />
Associates<br />
Associates are companies in which the Group has significant influence, but not control, over the financial and<br />
operating policies.<br />
The existence and effect of potential voting rights that are presently exercisable or presently convertible are<br />
considered when assessing whether the Group has significant influence over another company.<br />
In the Group’s financial statements, they are accounted for using the equity method of accounting from the<br />
day that significant influence commences until the date that significant influence ceases. When the Group’s<br />
share of losses exceeds the carrying amount of the associate (including any other unsecured receivables,<br />
that in substance, form part of the Group’s net investment in the associate), recognition of further losses is<br />
discontinued unless the Group has incurred obligations or made payments on its behalf to satisfy obligations<br />
of the associate that the Group has guaranteed or otherwise committed on behalf of.<br />
The excess of the Group’s interest in the net fair value of the identifiable assets, liabilities and contingent<br />
liabilities over the cost of acquisition is credited to the income statement in the period of the acquisition.<br />
Where the audited financial statements are not available, the share of results is arrived at from unaudited<br />
management financial statements made up mainly to the end of the accounting year to December 31.<br />
iii. Joint Ventures<br />
Joint ventures are those enterprises whose activities the Group has joint control over, established by contractual<br />
agreement.<br />
The existence and effect of potential voting rights that are presently exercisable or presently convertible are<br />
considered when assessing whether the Group has joint control over the enterprise.<br />
For incorporated joint ventures, the Group accounts for the joint ventures in the same manner as associates,<br />
from the date joint control commences until the day that the joint control ceases.<br />
For unincorporated joint ventures, the proportionate share in the unincorporated joint ventures’ individual<br />
income, expenses, assets and liabilities are included in financial statements of the Group with items of a similar<br />
nature on a line-by-line basis.<br />
120 Delivering Essential Solutions <strong>Sembcorp</strong> Industries Annual Report 2008 121
Notes to the<br />
Financial Statements<br />
Year Ended December 31, 2008<br />
2. SUMMARY OF SIGNIFICANT ACCOUNTING POLICIES (cont’d)<br />
b. Consolidation (cont’d)<br />
iii. Joint Ventures (cont’d)<br />
The excess of the Group’s interest in the net fair value of the identifiable assets, liabilities and contingent<br />
liabilities over the cost of acquisition is credited to the income statement in the period of the acquisition.<br />
Where the audited financial statements are not available, the share of results is arrived at from unaudited<br />
management financial statements made up mainly to the end of the accounting year to December 31.<br />
iv. Associates and Joint Ventures in the Company’s Financial Statements<br />
Investments in associates and joint ventures are stated in the Company’s balance sheet at cost less impairment<br />
losses.<br />
The results of the associates and joint ventures are included in the Company’s income statement to the extent<br />
of dividends received and receivable, provided the Company’s right to receive the dividend is established<br />
before the balance sheet date.<br />
v. Transactions Eliminated on Consolidation<br />
All significant intra-group transactions, balances and unrealised gains or losses are eliminated on consolidation.<br />
Unrealised gains resulting from transactions with associates and joint ventures are eliminated to the extent of<br />
the Group’s interest in the enterprise. Unrealised losses are eliminated in the same way as unrealised gains, but<br />
only to the extent that there is no evidence of impairment.<br />
vi. Accounting Policies of Subsidiaries, Associates and Joint Ventures<br />
Where necessary, accounting policies for subsidiaries and material associates and joint ventures have been<br />
adjusted on consolidation to be consistent with the policies adopted by the Group.<br />
c. Foreign Currencies<br />
i. Functional and Presentation Currency<br />
Items included in the financial statements of each company in the Group are measured using the currency<br />
of the primary economic environment in which the company operates (“the functional currency”). The<br />
consolidated financial statements are presented in Singapore dollars, which is the Company’s functional and<br />
presentation currency.<br />
2. SUMMARY OF SIGNIFICANT ACCOUNTING POLICIES (cont’d)<br />
c. Foreign Currencies (cont’d)<br />
iii. Foreign Operations<br />
The results and financial positions of foreign operations (none of which have the currency of a hyperinflationary<br />
economy) that have a functional currency different from the presentation currency are translated into the<br />
presentation currency as follows:<br />
• Assets and liabilities are translated at foreign exchange rates ruling at the date of the balance sheet.<br />
• Revenues and expenses are translated at average foreign exchange rates.<br />
• All resulting foreign exchange differences are taken to the currency translation reserve.<br />
Goodwill (except those relating to acquisitions of foreign operations prior to January 1, 2004) and fair value<br />
adjustments arising from the acquisition of foreign operations are translated to the presentation currency for<br />
consolidation at the rates of exchange ruling at the balance sheet date. Goodwill arising from the acquisition<br />
of foreign operations prior to January 1, 2004 are translated at foreign exchange rates ruling at the dates of<br />
the transactions.<br />
On disposal, accumulated currency translation differences are recognised in the consolidated income statement<br />
as part of the gain or loss on disposal.<br />
iv. Net Investment in a Foreign Operation<br />
Exchange differences arising from monetary items that in substance form part of the Company’s net investment<br />
in a foreign operation are recognised in the Company’s income statement. Such exchange differences are<br />
reclassified to the currency translation reserve in the consolidated financial statements and are released to the<br />
consolidated income statement upon disposal of the investment as part of the gain or loss on disposal.<br />
d. Property, Plant and Equipment<br />
i. Owned Assets<br />
Property, plant and equipment are stated at cost less accumulated depreciation and accumulated impairment<br />
losses. Cost includes expenditure that is directly attributable to the acquisition of the asset.<br />
The cost of self-constructed assets includes the cost of materials, direct labour and an appropriate proportion<br />
of production overheads.<br />
ii.<br />
Foreign Currency Transactions and Balances<br />
Transactions in foreign currencies are translated into the functional currency at foreign exchange rates ruling<br />
at the dates of the transactions. At each balance sheet date:<br />
• Foreign currency monetary items are translated into the functional currency using foreign exchange rates<br />
ruling at that date.<br />
• Non-monetary assets and liabilities measured at historical cost in foreign currencies are translated into the<br />
functional currency using foreign exchange rates at the dates of the transactions.<br />
• Non-monetary assets and liabilities measured at fair value in foreign currencies are translated into the<br />
functional currency at foreign exchange rates ruling at the dates the fair value was determined.<br />
Foreign exchange differences arising from the settlement or from translation of monetary items are recognised<br />
in the income statement.<br />
Foreign exchange differences arising from non-monetary items are recognised directly in equity when nonmonetary<br />
items’ gains or losses are recognised directly in equity. Conversely, when non-monetary items’ gains<br />
or losses are recognised directly in the income statement, foreign exchange differences arising from these<br />
items are recognised directly in the income statement.<br />
ii.<br />
Where an item of property, plant and equipment comprises major components having different useful lives,<br />
they are accounted for as separate items of property, plant and equipment.<br />
Revaluation Surplus<br />
Any increase in revaluation is credited to the revaluation reserve unless it offsets a previous decrease in value<br />
recognised in the income statement. A decrease in value is recognised in the income statement where it<br />
exceeds the increase previously recognised in the revaluation surplus of the same asset.<br />
iii. Subsequent Expenditure<br />
Subsequent expenditure relating to property, plant and equipment that has already been recognised is<br />
added to the carrying amount of the asset when it is probable that future economic benefits, in excess of the<br />
originally assessed standard of performance of the existing asset, will flow to the Group. All other subsequent<br />
expenditure is recognised as an expense in the period in which it is incurred.<br />
Certain items of property, plant and equipment are subject to overhauls at regular intervals. The inherent<br />
components of the initial overhaul are determined based on the estimated costs of the next overhaul and<br />
are separately depreciated in order to reflect the estimated intervals between two overhauls. The costs of<br />
the overhauls subsequently incurred are capitalised as additions and the carrying amounts of the replaced<br />
components are written off to the income statement.<br />
122 Delivering Essential Solutions <strong>Sembcorp</strong> Industries Annual Report 2008 123
Notes to the<br />
Financial Statements<br />
Year Ended December 31, 2008<br />
2. SUMMARY OF SIGNIFICANT ACCOUNTING POLICIES (cont’d)<br />
d. Property, Plant and Equipment (cont’d)<br />
iv. Disposals<br />
Gains or losses arising from the retirement or disposal of property, plant and equipment are determined as<br />
the difference between the estimated net disposal proceeds and the carrying amount of the asset and are<br />
recognised in the income statement on the date of retirement or disposal.<br />
For property, plant and equipment carried at revalued amounts, any related revaluation surplus is transferred<br />
from the revaluation reserve to accumulated profits and is not taken into account in arriving at the gain or<br />
loss on disposal.<br />
v. Finance Lease Assets<br />
Finance leases are those leasing agreements that give rights approximating to ownership. Property, plant and<br />
equipment acquired by way of such leases is capitalised at the lower of its fair value and the present value<br />
of the minimum lease payments at the inception of the lease, less accumulated depreciation and impairment<br />
losses.<br />
Lease payments are apportioned between the finance charges and reduction of the lease liability so as to<br />
achieve a constant rate of interest on the remaining balance of the liability.<br />
Finance charges are charged directly to the income statement.<br />
Capitalised leased assets are depreciated over the shorter of the economic useful life of the asset and the lease<br />
term.<br />
vi. Provision for Restoration Costs<br />
A provision is recognised for the costs expected to be incurred to dismantle, remove and restore the asset upon<br />
expiry of the lease agreement. The estimated costs form part of the cost of the property, plant and equipment<br />
and are depreciated over the useful life of the asset.<br />
vii. Depreciation<br />
Depreciation is calculated using the straight-line method to allocate the cost less its residual value so as to write<br />
off items of property, plant and equipment over their estimated useful lives. Each part of an item of property,<br />
plant and equipment with a cost that is significant in relation to the total cost of an item is depreciated<br />
separately. The estimated useful lives are as follows:<br />
2. SUMMARY OF SIGNIFICANT ACCOUNTING POLICIES (cont’d)<br />
e. Investment Properties<br />
Investment properties comprise significant portions of office buildings and freehold land that are held for longterm<br />
rental yields or for capital appreciation, or both.<br />
Investment properties are initially recognised at cost and subsequently carried at cost less accumulated depreciation<br />
and accumulated impairment losses. Depreciation is recognised in the income statement on a straight-line basis<br />
over the estimated useful lives ranging from 20 to 50 years. The assets’ depreciation methods, useful lives and<br />
residual values are reviewed, if not insignificant, annually, and adjusted if appropriate. No depreciation is provided<br />
on the freehold land.<br />
Investment properties are subject to renovations or improvements at regular intervals. The cost of major<br />
renovations and improvements is capitalised as additions and the carrying amounts of the replaced components<br />
are written off to the income statement. The cost of maintenance, repairs and minor improvements is charged to<br />
the income statement when incurred.<br />
On disposal of an investment property, the difference between the estimated net disposal proceeds and the<br />
carrying amount of the asset is recognised in the income statement.<br />
f. Intangible Assets<br />
i. Goodwill<br />
Goodwill represents the excess of the cost of acquisition over the fair value of the Group’s share of the<br />
identifiable net assets. Goodwill is stated at cost less accumulated impairment losses. Goodwill on acquisition<br />
of subsidiaries is included in intangible assets. Goodwill on acquisition of associates and joint ventures is<br />
included in investments in associates and joint ventures.<br />
ii.<br />
Goodwill arising from the acquisition of a minority interest in a subsidiary represents the excess of the cost of<br />
the additional investment over the carrying amount of the net assets acquired at the date of exchange.<br />
Goodwill is tested for impairment on an annual basis in accordance with Note 2(n).<br />
Goodwill / Negative Goodwill Previously Written Off Against Reserves<br />
Goodwill that has previously been taken to reserves is not taken to the income statement when (i) the business<br />
is disposed of or discontinued or (ii) the goodwill is impaired. Similarly, negative goodwill that has previously<br />
been taken to reserves is not taken to the income statement when the business is disposed of or discontinued.<br />
Leasehold land and wet berthage<br />
Land improvements<br />
Buildings<br />
Improvements to premises<br />
Quays and dry docks<br />
Floating docks<br />
Plant and machinery<br />
Marine vessels<br />
Furniture, fittings and office equipment<br />
Tools and workshop equipment<br />
Motor vehicles<br />
Lease period ranging from 20 to 60 years<br />
Lease period ranging from 20 to 60 years<br />
50 years or lease period ranging from 10 to 50 years, if lower<br />
1 to 10 years<br />
15 to 60 years<br />
20 years<br />
3 to 40 years<br />
3 to 25 years<br />
1 to 10 years<br />
3 to 10 years<br />
2 to 10 years<br />
iii. Research and Development<br />
Expenditure on research activities, undertaken with the prospect of gaining new scientific or technical<br />
knowledge and understanding, is recognised in the income statement as an expense as incurred.<br />
Expenditure on development activities, whereby research findings are applied to a plan or design for the<br />
production of new or substantially improved products and processes, is capitalised if the product or process<br />
is technically and commercially feasible and the Group has sufficient resources to complete development.<br />
The expenditure capitalised includes the cost of materials, direct labour and an appropriate proportion of<br />
overheads. Other development expenditure is recognised in the income statement as an expense as incurred.<br />
Capitalised development expenditure is stated at cost less accumulated amortisation and impairment losses.<br />
The assets’ useful lives and residual values are reviewed, if not insignificant, annually, and adjusted if appropriate.<br />
No depreciation is provided on freehold land and capital work-in-progress.<br />
Amortisation is charged to the income statement on a straight-line basis over the estimated useful life of 10 years.<br />
<strong>Full</strong>y depreciated assets are retained in the financial statements until they are no longer in use.<br />
124 Delivering Essential Solutions <strong>Sembcorp</strong> Industries Annual Report 2008 125
Notes to the<br />
Financial Statements<br />
Year Ended December 31, 2008<br />
2. SUMMARY OF SIGNIFICANT ACCOUNTING POLICIES (cont’d)<br />
f. Intangible Assets (cont’d)<br />
iv. Other Intangible Assets<br />
Other intangible assets with a finite life are stated at cost less accumulated amortisation and impairment<br />
losses. Expenditure on internally generated goodwill is recognised in the income statement as an expense as<br />
incurred. Other intangible assets are amortised on a straight-line basis from the date the asset is available for<br />
use and over its estimated useful lives ranging from 3 to 10 years.<br />
Intangible assets of indefinite life or not available for use are stated at cost less accumulated impairment<br />
losses. Such intangible assets are tested for impairment annually in accordance with Note 2(n).<br />
v. Subsequent Expenditure<br />
Subsequent expenditure on capitalised intangible assets is capitalised only when it increases the future economic<br />
benefits embodied in the specific asset to which it relates. All other expenditure is expensed as incurred.<br />
g. Financial Assets<br />
The Group classifies its financial assets in the following categories: financial assets at fair value through profit or<br />
loss; held to maturity investments; loans and receivables and available-for-sale financial assets. The classification<br />
depends on the purpose for which the investments are acquired. Management determines the classification of its<br />
investments at initial recognition and re-evaluates this designation at every reporting date. The designation of<br />
financial assets at fair value through profit or loss is irrevocable.<br />
i. Financial Assets at Fair Value<br />
This category has two sub-categories: financial assets held for trading, and those designated at fair value<br />
through profit or loss at inception. A financial asset is classified in this category if the Group manages such<br />
assets and makes purchase and sale decisions based on their fair value. Upon initial recognition, attributable<br />
transaction costs are recognised in the income statement when incurred. Assets in this category are classified as<br />
current assets and are stated at fair value, with any resultant gain or loss recognised in the income statement.<br />
ii.<br />
Held to Maturity Investments<br />
Where the Group has the positive intent and ability to hold investments to maturity, they are stated at<br />
amortised cost using the effective interest method less impairment losses. During the year, the Group did not<br />
hold any investments in this category.<br />
iii. Loans and Receivables<br />
Loans and receivables are financial assets with fixed or determinable payments that are not quoted in an<br />
active market. They arise when the Group provides money, goods or services directly to a debtor with no<br />
intention of trading the receivable. They are included in current assets, except for maturities greater than 12<br />
months after the balance sheet date for which they are classified as non-current assets. Loans and receivables<br />
are recognised initially at fair value and subsequently measured at amortised cost using the effective interest<br />
method. Receivables with a short duration are not discounted. Loans and receivables are included in trade and<br />
other receivables in the balance sheet (Note 2(k)).<br />
iv. Available-for-Sale Financial Assets<br />
Other financial assets held by the Group that are either designated in this category or not classified in any other<br />
category, are classified as being available-for-sale. They are included in non-current assets unless management<br />
intends to dispose of the investment within 12 months of the balance sheet date. They are stated at fair value,<br />
with any resultant gain or loss being recognised directly in equity. The exceptions are impairment losses and<br />
foreign exchange gains and losses on monetary items such as debt securities, which are recognised in the income<br />
statement. When these investments are derecognised, the cumulative gain or loss previously recognised directly<br />
in equity, or part thereof, is recognised in the income statement. Where these investments are interest bearing,<br />
interest calculated using the effective interest method is recognised in the income statement.<br />
2. SUMMARY OF SIGNIFICANT ACCOUNTING POLICIES (cont’d)<br />
g. Financial Assets (cont’d)<br />
Financial assets classified as held-for-trading or available-for-sale are recognised by the Group on the date it<br />
receives the financial asset, and derecognised on the date it delivers the financial asset. Other financial assets are<br />
derecognised when the rights to receive cash flows from the investments have expired or all risks and rewards of<br />
ownership have been substantially transferred.<br />
Financial assets are initially recognised at fair value plus transaction costs except for financial assets carried at fair<br />
value through profit or loss, which are recognised at fair value.<br />
Impairment<br />
The Group assesses at each balance sheet date whether there is objective evidence that a financial asset or a group<br />
of financial assets is impaired. When a decline in the fair value of an available-for-sale financial asset has been<br />
recognised directly in equity and there is objective evidence that the value of the asset is impaired, the cumulative<br />
loss that had been recognised directly in equity is recognised in the income statement even though the financial<br />
asset has not been derecognised. The amount of the cumulative loss that is recognised in the income statement is<br />
the excess of acquisition cost less any impairment loss on that financial asset previously recognised in the income<br />
statement, over its current fair value.<br />
The recoverable amount of the Group’s investments in held-to-maturity securities is calculated as the present value<br />
of estimated future cash flows, discounted at the original effective interest rate (i.e. the effective interest rate<br />
computed at initial recognition of these financial assets).<br />
Reversals of Impairment<br />
An impairment loss in respect of a held-to-maturity security or receivable carried at amortised cost is reversed if the<br />
subsequent increase in recoverable amount can be related objectively to an event occurring after the impairment<br />
loss was recognised.<br />
An impairment loss once recognised in the income statement in respect of an investment in an equity instrument<br />
classified as available-for-sale is not reversed through the income statement. Any subsequent increase in fair<br />
value of such assets is recognised directly in equity. If the fair value of a debt instrument classified as availablefor-sale<br />
increases and the increase can be objectively related to an event occurring after the impairment loss<br />
was recognised in the income statement, the impairment loss shall be reversed, with the amount of the reversal<br />
recognised in the income statement.<br />
h. Derivatives<br />
Derivative financial instruments are used to manage exposures to foreign exchange, interest rate and commodity<br />
price risks arising from operational, financing and investment activities. Derivative financial instruments are not<br />
used for trading purposes. However, derivatives that do not qualify for hedge accounting are accounted for as<br />
trading instruments.<br />
Derivative financial instruments are recognised initially at fair value. Subsequent to initial recognition, derivative<br />
financial instruments are remeasured at fair value. The gain or loss on remeasurement to fair value is recognised<br />
immediately in the income statement. However, where derivatives qualify for hedge accounting, recognition of<br />
any resultant gain or loss depends on the nature of the item being hedged as described in Note 2(i).<br />
126 Delivering Essential Solutions <strong>Sembcorp</strong> Industries Annual Report 2008 127
Notes to the<br />
Financial Statements<br />
Year Ended December 31, 2008<br />
2. SUMMARY OF SIGNIFICANT ACCOUNTING POLICIES (cont’d)<br />
i. Hedging<br />
i. Fair Value Hedges<br />
Where a derivative financial instrument hedges the changes in fair value of a recognised asset or liability or an<br />
unrecognised firm commitment (or an identified portion of such asset, liability or firm commitment), any gain<br />
or loss on the hedging instrument is recognised in the income statement. The hedged item is also stated at fair<br />
value in respect of the risk being hedged, with any gain or loss recognised in the income statement.<br />
ii.<br />
Cash Flow Hedges<br />
Where a derivative financial instrument is designated as a hedge of the variability in cash flows of a recognised<br />
asset or liability, or a highly probable forecast transaction, the effective part of any gain or loss on the derivative<br />
financial instrument is recognised directly in equity. The ineffective part of any gain or loss is recognised<br />
immediately in the income statement. When the forecast transaction subsequently results in the recognition<br />
of a non-financial asset or non-financial liability, or the forecast transaction for a non-financial asset or nonfinancial<br />
liability becomes a firm commitment for which fair value hedge accounting is applied, the associated<br />
cumulative gain or loss is removed from equity and included in the initial cost or other carrying amount of the<br />
non-financial asset or liability. If a hedge of a forecast transaction subsequently results in the recognition of a<br />
financial asset or financial liability, the associated gains and losses that were recognised directly in equity are<br />
reclassified into the income statement in the same period or periods during which the asset acquired or liability<br />
assumed affects the income statement.<br />
When a hedging instrument expires or is sold, terminated or exercised, or the entity revokes designation of<br />
the hedge relationship but the hedged forecast transaction is still expected to occur, the cumulative gain or<br />
loss at that point remains in equity and is recognised in accordance with the above policy when the transaction<br />
occurs. If the hedged transaction is no longer expected to take place, the cumulative unrealised gain or loss<br />
recognised in equity is recognised immediately in the income statement.<br />
iii. Hedge of Monetary Assets and Liabilities<br />
Where a derivative financial instrument is used to hedge economically the foreign exchange exposure of a<br />
recognised monetary asset or liability, no hedge accounting is applied and any gain or loss on the hedging<br />
instrument is recognised in the income statement.<br />
iv. Hedge of Net Investment in a Foreign Operation<br />
The gain or loss on a financial instrument used to hedge a net investment in a foreign operation is recognised<br />
in the Company’s income statement. On consolidation, only the portion of the gain or loss on the hedging<br />
instrument that is determined to be an effective hedge is reclassified to equity. This amount is recognised in<br />
the consolidated income statement on disposal of the foreign operation.<br />
v. Separable Embedded Derivatives<br />
Changes in the fair value of separable embedded derivatives are recognised immediately in the income statement.<br />
2. SUMMARY OF SIGNIFICANT ACCOUNTING POLICIES (cont’d)<br />
j. Inventories<br />
i. Finished Goods and Components<br />
Inventories are stated at the lower of cost and net realisable value.<br />
ii.<br />
Cost is calculated using the weighted average cost formula and comprises all costs of purchase, costs of<br />
conversion and other costs incurred in bringing the inventories to their present location and condition. In the<br />
case of manufactured inventories and work-in-progress, cost includes an appropriate share of overheads based<br />
on normal operating capacity. Costs of inventories also include the transfer from equity, if any, of gains / losses<br />
on qualifying cash flow hedges relating to purchases of raw materials.<br />
Net realisable value is the estimated selling price in the ordinary course of business less the estimated costs of<br />
completion and the estimated costs necessary to make the sale.<br />
When inventories are sold, the carrying amount of those inventories is recognised as an expense in the period<br />
in which the related revenue is recognised.<br />
The amount of any allowance for write-down of inventories to net realisable value and all losses of inventories<br />
are recognised as an expense in the period the write-down or loss occurs. The amount of any reversal of any<br />
allowance for write-down of inventories, arising from an increase in net realisable value, is recognised as a<br />
reduction in the amount of inventories recognised as an expense in the period in which the reversal occurs.<br />
Long-term Contracts<br />
The accounting policy for recognition of contract revenue is set out in Note 2(v)(ii).<br />
Long-term contracts-in-progress at the balance sheet date are recorded in the balance sheet at cost plus<br />
attributable profit less recognised losses, net of progress claims and allowance for foreseeable losses, and are<br />
presented in the balance sheet as “Work-in-progress” (as an asset) or “Excess of progress claims over workin-progress”<br />
(as a liability), as applicable. Long-term contract costs include the cost of direct materials, direct<br />
labour and costs incurred in connection with the project. When it is probable that total contract costs will<br />
exceed total contract revenue, the expected loss is recognised as an expense immediately.<br />
Progress claims not yet paid by the customer are included in the balance sheet under “Trade receivables”.<br />
Amounts received before progress claims are included in the balance sheet, as a liability, as “Advance payments<br />
from customers”.<br />
iii. Properties Held for Sale<br />
Properties held for sale are stated at the lower of cost and net realisable value.<br />
Cost includes the cost of real estate purchased, construction cost, finance cost and other direct expenditure<br />
and related overheads incurred during construction. Net realisable value represents the estimated selling price<br />
less the anticipated cost of disposal.<br />
The carrying amounts are reviewed at each balance sheet date to assess whether they are recorded in excess of<br />
their recoverable amounts, and if carrying values exceed these recoverable amounts, the assets are written down.<br />
128 Delivering Essential Solutions <strong>Sembcorp</strong> Industries Annual Report 2008 129
Notes to the<br />
Financial Statements<br />
Year Ended December 31, 2008<br />
2. SUMMARY OF SIGNIFICANT ACCOUNTING POLICIES (cont’d)<br />
k. Trade Receivables<br />
Trade receivables are recognised initially at fair value and subsequently measured at amortised cost using the<br />
effective interest method.<br />
An allowance for impairment of trade receivables is established when there is objective evidence that the Group<br />
will not be able to collect all amounts due according to the original terms of the receivables. The amount of the<br />
allowance is the difference between the asset’s carrying amount and the present value of estimated future cash<br />
flows, discounted at the effective interest rate. The amount of the allowance is recognised in the income statement.<br />
l. Deferred Asset Grants<br />
Asset related grants are credited to a deferred asset grants account and are released to the income statement on<br />
the straight-line basis over the estimated useful lives of the relevant assets.<br />
Non-monetary government grants and assets received are valued at nominal amounts.<br />
Income-related grants are credited to the income statement in the period to which they relate.<br />
m. Cash and Cash Equivalents<br />
Cash and cash equivalents comprise cash balances and bank deposits. For the purpose of the cash flow statement,<br />
cash and cash equivalents are presented net of bank overdrafts which are repayable on demand. Bank overdrafts<br />
are shown within interest-bearing borrowings in current liabilities on the balance sheet.<br />
n. Impairment – Non-Financial Assets<br />
The carrying amounts of the Group’s non-financial assets, other than inventories and deferred tax assets, are<br />
reviewed at each balance sheet date to determine whether there is any indication of impairment. If any such<br />
indication exists, the assets’ recoverable amounts are estimated. An impairment loss is recognised whenever the<br />
carrying amount of an asset or its cash-generating unit exceeds its recoverable amount. A cash-generating unit<br />
is the smallest identifiable asset group that generates cash flows that largely are independent from other assets<br />
and groups. Impairment losses are recognised in the income statement unless it reverses a previous revaluation<br />
that was credited to equity, in which case it is charged to equity. Impairment losses recognised in respect of cashgenerating<br />
units are allocated first to reduce the carrying amount of any goodwill allocated to cash-generating<br />
units (group of units) and then, to reduce the carrying amount of the other assets in the unit (group of units) on<br />
a pro rata basis.<br />
Goodwill, intangible assets with indefinite useful lives and intangible assets not yet available for use are tested for<br />
impairment annually and as and when indicators of impairment occur.<br />
i. Calculation of Recoverable Amount<br />
The recoverable amount of an asset or cash-generating unit is the greater of its value in use and its fair value<br />
less costs to sell. In assessing value in use, the estimated future cash flows are discounted to their present<br />
value using a pre-tax discount rate that reflects current market assessments of the time value of money and<br />
the risks specific to the asset or cash-generating unit. For an asset that does not generate largely independent<br />
cash inflows, the recoverable amount is determined for the cash-generating unit to which the asset belongs.<br />
ii.<br />
Reversals of Impairment<br />
An impairment loss in respect of goodwill is not reversed, even if it relates to an impairment loss recognised<br />
in an interim period that would have been reduced or avoided had the impairment assessment been made at<br />
a subsequent reporting or balance sheet date. In respect of other assets, impairment losses recognised in prior<br />
periods are assessed at each reporting date for any indications that the loss has decreased or no longer exists.<br />
2. SUMMARY OF SIGNIFICANT ACCOUNTING POLICIES (cont’d)<br />
n. Impairment – Non-Financial Assets (cont’d)<br />
ii. Reversals of Impairment (cont’d)<br />
An impairment loss is reversed if there has been a change in the estimates used to determine the recoverable<br />
amount. An impairment loss is reversed only to the extent that the assets’ carrying amount does not exceed<br />
the carrying amount that would have been determined, net of depreciation or amortisation, if no impairment<br />
loss had been recognised.<br />
o. Liabilities and Interest-Bearing Liabilities<br />
Trade and other payables are recognised initially at fair value and subsequently measured at amortised cost using<br />
the effective interest method.<br />
Interest-bearing liabilities are recognised initially at fair value less attributable transaction costs. Subsequent to<br />
initial recognition, interest-bearing liabilities are stated at amortised cost with any difference between cost and<br />
redemption value being recognised in the income statement over the period of the borrowings on an effective<br />
interest basis.<br />
p. Deferred Income<br />
When the Group receives advance payments from customers in respect of connection and capacity charges for the<br />
supply and delivery of gas and utilities, the Group recognises the deferred income to the income statement on<br />
a straight-line basis over the period stipulated in the respective customer contract commencing from the date of<br />
supply and delivery of gas and utilities.<br />
When the Group receives a deferred income and a financial asset as consideration for providing construction<br />
services in a service concession arrangement, the Group recognises the deferred income as the difference between<br />
the fair value of the construction services provided and the fair value of the financial asset received. The fair<br />
value of the construction services provided is estimated as the value of construction services at an arm’s length<br />
transaction between willing parties. The fair value of the financial asset received is estimated as the present value<br />
of the minimum guaranteed sum receivable from the grantor of the service concession which is discounted at the<br />
imputed rate of interest i.e. the prevailing rate of interest for a similar instrument of the grantor. Subsequent to<br />
initial recognition, the deferred income is measured at cost less accumulated amortisation.<br />
q. Employee Benefits<br />
i. Defined Contribution Plans<br />
Obligations for contributions to defined contribution plans are recognised as an expense in the income<br />
statement as incurred.<br />
ii.<br />
Defined Benefit Plans<br />
The Group’s net obligation in respect of defined benefit pension plans is calculated separately for each defined<br />
benefit plan by estimating the amount of future benefit that employees have earned in return for their service<br />
in the current and prior periods; that benefit is discounted to determine the present value, and the fair value<br />
of any plan assets is deducted. The discount rate is the yield at balance sheet date on high quality bonds that<br />
have maturity dates approximating the terms of the Group’s obligations. The calculation is performed by a<br />
qualified actuary on a regular basis using a relevant actuarial method. In the intervening years the calculation<br />
is updated based on information received from the actuary.<br />
When the benefits of a plan change, the portion of the increased benefit relating to past service by employees<br />
is recognised as an expense in the income statement on a straight-line basis over the average period until<br />
the benefits become vested. To the extent that the benefits vest immediately, the expense is recognised<br />
immediately in the income statement.<br />
130 Delivering Essential Solutions <strong>Sembcorp</strong> Industries Annual Report 2008 131
Notes to the<br />
Financial Statements<br />
Year Ended December 31, 2008<br />
2. SUMMARY OF SIGNIFICANT ACCOUNTING POLICIES (cont’d)<br />
q. Employee Benefits (cont’d)<br />
ii. Defined Benefit Plans (cont’d)<br />
Actuarial gains and losses arise mainly from changes in actuarial assumptions and differences between<br />
actuarial assumptions and what has actually occurred. They are recognised in the income statement, over the<br />
expected average remaining working lives of the employees participating in the plan, only to the extent that<br />
their cumulative amount exceeds 10% of the greater of the present value of the obligation and of the fair<br />
value of plan assets. Unrecognised actuarial gains and losses are reflected in the balance sheet.<br />
For defined benefit plans, the actuarial cost charged to the income statement consists of current service cost,<br />
interest cost, expected return on plan assets and past service cost as well as actuarial gains or losses to the<br />
extent that they are recognised. The past service cost for the enhancement of pension benefits is accounted<br />
for when such benefit vests or becomes a constructive obligation.<br />
Where the calculation results in a benefit to the Group, the recognised asset is limited to the net total of any<br />
unrecognised actuarial losses and past service costs and the present value of any future refunds from the plan<br />
or reductions in future contributions to the plan.<br />
iii. Short-Term Employee Benefits<br />
Short-term employee benefit obligations are measured on an undiscounted basis and are expensed as the<br />
related employment service is provided.<br />
The amount expected to be paid are accrued when the Group has a present legal or constructive obligation<br />
to pay this amount as a result of past service provided by the employee and the obligation can be estimated<br />
reliably.<br />
iv. Staff Retirement Benefits<br />
Retirement benefits payable to certain categories of employees upon their retirement are provided for in<br />
the financial statements based on their entitlement under the staff retirement benefit plan or, in respect of<br />
unionised employees of a subsidiary who joined on or before December 31, 1988, based on an agreement with<br />
the union.<br />
The Group’s net obligation in respect of retirement benefits is the amount of future benefit that employees<br />
have earned in return for their service in the current and prior periods. The obligation is calculated using the<br />
projected future salary increase and is discounted to its present value and the fair value of any related assets<br />
is deducted.<br />
v. Equity and Equity-Related Compensation Benefits<br />
Share Option Plan<br />
The share option programme allows the Group’s employees to acquire shares of the Group companies.<br />
The fair value is measured at grant date and spread over the period during which the employees become<br />
unconditionally entitled to the options. The fair value of options granted is recognised as an employee<br />
expense with a corresponding increase in equity. At each balance sheet date, the Company revises its estimates<br />
of the number of options that are expected to become exercisable. It recognises the impact of the revision<br />
of original estimates in employee expense and in a corresponding adjustment to equity over the remaining<br />
vesting period.<br />
The proceeds received net of any directly attributable transaction costs are credited to share capital when the<br />
options are exercised.<br />
2. SUMMARY OF SIGNIFICANT ACCOUNTING POLICIES (cont’d)<br />
q. Employee Benefits (cont’d)<br />
v. Equity and Equity-Related Compensation Benefits (cont’d)<br />
Performance Share Plan<br />
The fair value of equity-related compensation is measured using the Monte Carlo simulation method as at<br />
the date of the grant. The method involves projecting future outcomes using statistical distributions of key<br />
random variables including share prices and volatility of returns.<br />
In estimating the fair value of the compensation cost, market-based performance conditions are taken<br />
into account. Therefore, for performance share grants with market-based performance conditions, the<br />
compensation cost is charged to the income statement with a corresponding increase in equity on a basis that<br />
fairly reflects the manner in which the benefits will accrue to the employee under the plan over the service<br />
period to which the performance period relates, irrespective of whether this performance condition is satisfied.<br />
Restricted Stock Plan<br />
Similar to the Performance Share Plan, the fair value of equity related compensation is measured using the<br />
Monte Carlo simulation method as at the date of the grant. The method involves projecting future outcomes<br />
using statistical distributions of key random variables including share prices and volatility of returns. This<br />
model takes into the account the probability of achieving the performance conditions in the future.<br />
The fair value of the compensation cost is measured at grant date and spread over the service period to which<br />
the performance criteria relates and the period during which the employees become unconditionally entitled<br />
to the shares. The compensation cost is charged to the income statement with a corresponding increase in<br />
equity on a basis that fairly reflects the manner in which the benefits will accrue irrespective of whether this<br />
performance condition is satisfied.<br />
At the balance sheet date, the Company revises its estimates of the number of performance-based restricted<br />
stocks that the employees are expected to receive based on the achievement of non-market performance<br />
conditions and the number of shares ultimately given. It recognises the impact of the revision of the original<br />
estimates in employee expense and in a corresponding adjustment to equity over the remaining vesting period.<br />
In the Company’s separate financial statements, the fair value of options, performance shares and restricted<br />
stocks granted to employees of its subsidiaries is recognised as an increase in the cost of the Company’s<br />
investment in subsidiaries, with a corresponding increase in equity over the vesting period.<br />
vi. Cash-Related Compensation Benefits<br />
<strong>Sembcorp</strong> Challenge Bonus<br />
The Group recognises a liability and an expense for bonuses and profit-sharing, based on a formula that<br />
takes into consideration the share price of the Company. The Group recognises a provision when contractually<br />
obliged to pay or where there is a past practice that has created a constructive obligation to pay.<br />
The compensation cost is measured at the fair value of the liability at each balance sheet date and spread<br />
over the service period to which the performance criteria relates and the period during which the employees<br />
become unconditionally entitled to the bonus. The liability takes into account the probability of achieving the<br />
performance conditions in the future.<br />
Until the liability is settled, the Group will re-measure the fair value of the liability at each balance sheet date<br />
and at the date of settlement, with any changes in fair value recognised in the income statement for the period.<br />
132 Delivering Essential Solutions <strong>Sembcorp</strong> Industries Annual Report 2008 133
Notes to the<br />
Financial Statements<br />
Year Ended December 31, 2008<br />
2. SUMMARY OF SIGNIFICANT ACCOUNTING POLICIES (cont’d)<br />
r. Provisions<br />
A provision is recognised in the balance sheet when there is a legal or constructive obligation as a result of a past<br />
event, the obligation can be reliably estimated and it is probable that an outflow of economic benefits will be<br />
required to settle the obligation. If the effect is material, provisions are determined by discounting the expected<br />
future cash flows at a pre-tax rate that reflects current market assessments of the time value of money and, where<br />
appropriate, the risks specific to the liability.<br />
s. Income Tax Expense<br />
Income tax expense comprises current and deferred tax. Income tax expense is recognised in the income statement<br />
except to the extent that it relates to items recognised directly in equity, in which case it is recognised in equity.<br />
Current tax is the expected tax payable on the taxable income for the year, using tax rates enacted or substantively<br />
enacted at the reporting date, and any adjustment to tax payable in respect of previous years.<br />
Deferred tax is recognised using the balance sheet method, providing for temporary differences between the<br />
carrying amounts of assets and liabilities for financial reporting purposes and the amounts used for taxation<br />
purposes. Deferred tax is not recognised for the following temporary differences: the initial recognition of<br />
goodwill, the initial recognition of assets or liabilities in a transaction that is not a business combination and that<br />
affects neither accounting nor taxable profit, and differences relating to investments in subsidiaries and joint<br />
ventures to the extent that they probably will not reverse in the foreseeable future. Deferred tax is measured at<br />
the tax rates that are expected to be applied to the temporary differences when they reverse, based on the laws<br />
that have been enacted or substantively enacted by the reporting date. Deferred tax assets and liabilities are<br />
offset if there is a legally enforceable right to offset current tax liabilities and assets and they relate to income<br />
taxes levied by the same tax authority on the same taxable entity, or on different tax entities, but they intend to<br />
settle current tax liabilities and assets on a net basis or their tax assets and liabilities will be realised simultaneously.<br />
A deferred tax asset is recognised to the extent that it is probable that future taxable profits will be available<br />
against which temporary differences can be utilised. Deferred tax assets are reviewed at each reporting date and<br />
are reduced to the extent that it is no longer probable that the related tax benefit will be realised.<br />
t. Share Capital<br />
Ordinary shares are classified as equity.<br />
Incremental costs directly attributable to the issuance of new ordinary shares and share options are deducted<br />
against the share capital account.<br />
Where the Company’s ordinary shares are repurchased (treasury shares), the consideration paid, excluding any<br />
directly attributable incremental costs, is deducted from equity attributable to the Company’s equity holders and<br />
presented as “reserve for own shares” within equity, until they are cancelled, sold or reissued.<br />
When treasury shares are cancelled, the cost of treasury shares is deducted against the share capital account, if<br />
the shares are purchased out of capital of the Company, or against the accumulated profits of the Company, if the<br />
shares are purchased out of profits of the Company.<br />
When treasury shares are subsequently sold or reissued pursuant to the Share-based Incentive Plans, the cost of the<br />
treasury shares is reversed from the reserve for own shares account and the realised gain or loss on sale or reissue,<br />
net of any directly attributable incremental transaction costs and related income tax, is recognised as a change in<br />
equity of the Company. No gain or loss is recognised in the income statement.<br />
2. SUMMARY OF SIGNIFICANT ACCOUNTING POLICIES (cont’d)<br />
u. Dividend<br />
Dividends on redeemable convertible preference share capital are recognised as a liability on an accrual basis.<br />
Other dividends are recognised as a liability in the period in which they are declared.<br />
Dividends on redeemable convertible preference share capital classified as a liability are accounted for as finance<br />
costs. Dividends on ordinary shares and redeemable convertible preference share capital classified as equity are<br />
accounted for as movements in revenue reserve.<br />
v. Revenue Recognition<br />
i. Income on Goods Sold and Services Rendered<br />
Revenue on goods sold is recognised when the significant risks and rewards of ownership have been<br />
transferred to the buyer. Revenue from the provision of consultancy services is recognised using the percentage<br />
of completion method. The percentage of completion is measured by reference to the percentage of cost<br />
incurred to-date to the estimated total costs for each project. Revenue on other service work is recognised<br />
when the work is completed. Revenue excludes goods and services or other sales taxes and is after deduction<br />
of any trade discounts. No revenue is recognised if there are significant uncertainties regarding recovery of the<br />
consideration due, associated costs or the possible return of goods.<br />
ii.<br />
Contract Revenue<br />
Revenue from repair work, engineering, overhaul, service work and marine and civil construction contracts<br />
is recognised based on percentage of completion. The percentage of completion is assessed by reference to<br />
surveys of work performed, or by reference to the ratio of costs incurred to-date to the estimated total costs for<br />
each contract, with due consideration given to the inclusion of only those costs that reflect work performed.<br />
When the outcome of a long-term contract can be estimated reliably, contract revenue and costs are recognised<br />
as income and expense respectively using the percentage of completion method. When the outcome of a longterm<br />
contract cannot be estimated reliably, revenue is recognised only to the extent of contract costs incurred<br />
that can probably be recovered and contract costs are recognised as an expense in the period in which they<br />
are incurred.<br />
iii. Sale of Electricity and Gases<br />
Revenue from the sale of electricity, utilities and gases is measured at the fair value of the consideration received<br />
or receivable, net of returns and allowances, trade discounts and volume rebates. Revenue is recognised when<br />
electricity, utilities and gases are delivered at the customers’ premises which is taken to be the point of time<br />
when the customer has accepted the deliveries and the related risks and rewards of ownership and based on<br />
contractual terms stipulated in respective agreements with customers.<br />
iv. Service Concession Arrangement<br />
Revenue relating to construction services under a service concession arrangement is recognised based on the<br />
stage of completion of the work performed, consistent with the Group’s accounting policy on recognising<br />
revenue on construction contracts. Operation or service revenue is recognised in the period in which the services<br />
are provided by the Group. When the Group provides more than one service in a service concession arrangement,<br />
the consideration received is allocated by reference to the relative fair values of the services delivered.<br />
Infrastructure constructed under a service concession arrangement is not recognised as property, plant and<br />
equipment of the Group.<br />
Preference shares are classified as equity if it is non-redeemable. Preference shares are classified as a liability if they<br />
are redeemable on a specific date or at the option of the shareholders.<br />
134 Delivering Essential Solutions <strong>Sembcorp</strong> Industries Annual Report 2008 135
Notes to the<br />
Financial Statements<br />
Year Ended December 31, 2008<br />
2. SUMMARY OF SIGNIFICANT ACCOUNTING POLICIES (cont’d)<br />
v. Revenue Recognition (cont’d)<br />
iv. Service Concession Arrangement (cont’d)<br />
The Group recognises the consideration received or receivable as a financial asset to the extent that it has an<br />
unconditional right to receive cash or another financial asset for the construction services. Financial assets are<br />
accounted for in accordance with the accounting policy set out in Note 2(g).<br />
The Group recognises the consideration receivable as an intangible asset to the extent that it receives a right<br />
to charge users of the public service. Intangible assets are accounted for in accordance with the accounting<br />
policy set out in Note 2(f).<br />
v. Dividend and Interest Income<br />
Dividend income is recognised in the income statement when the right to receive payment is established.<br />
Interest income is recognised as it accrues, using the effective interest method.<br />
vi. Rental Income<br />
Rental income receivable under operating leases is recognised in the income statement on a straight-line basis<br />
over the term of the lease. Lease incentives granted are recognised as an integral part of total rental income,<br />
over the term of the lease.<br />
w. Leases<br />
i. Operating Lease<br />
When entities within the Group are lessees of an operating lease<br />
Where the Group has the use of assets under operating leases, payments made under the leases are recognised<br />
in the income statement on a straight-line basis over the term of the lease. Lease incentives received are<br />
recognised in the income statement as an integral part of the total lease payments made.<br />
ii.<br />
When entities within the Group are lessors of an operating lease<br />
Assets subject to operating leases are included in investment properties and are stated at cost less accumulated<br />
depreciation and impairment losses. Rental income (net of any incentives given to lessees) is recognised on a<br />
straight-line basis over the lease term.<br />
Finance Lease<br />
When entities within the Group are lessors of a finance lease<br />
Amounts due from lessees under finance leases are recorded as receivables at the amount of the Group’s net<br />
investment in the leases. Finance lease income is allocated to accounting periods so as to reflect a constant<br />
periodic rate of return on the Group’s net investment outstanding in respect of the leases.<br />
x. Finance Costs<br />
Interest expense and similar charges are expensed in the income statement in the period in which they are incurred,<br />
except to the extent that they are capitalised as being directly attributable to the acquisition, construction or<br />
production of an asset which necessarily takes a substantial period of time to prepare for its intended use or<br />
sale. The interest component of finance lease payments is recognised in the income statement using the effective<br />
interest rate method.<br />
2. SUMMARY OF SIGNIFICANT ACCOUNTING POLICIES (cont’d)<br />
y. Segment Reporting<br />
A segment is a distinguishable component of the Group that is engaged either in providing products or services<br />
(business segment), or in providing products or services within a particular economic environment (geographical<br />
segment), which is subject to risks and rewards that are different from those of other segments.<br />
z. Assets (or Disposal Groups) Held For Sale<br />
Non-current assets (or disposal groups) are classified as assets held for sale and measured at the lower of carrying<br />
amount and fair value less costs to sell if they are expected to be recovered principally through a sale transaction<br />
rather than through continuing use.<br />
Any impairment losses on initial classification and subsequent measurement are recognised in the income<br />
statement. Subsequent increases in fair value less costs to sell are recognised in the income statement (not<br />
exceeding the accumulated impairment loss that has been previously recognised).<br />
aa. Financial Guarantee Contracts<br />
Financial guarantee contracts are accounted for as insurance contracts and treated as contingent liabilities until<br />
such time as they become probable that the Company will be required to make a payment under the guarantee.<br />
A provision is recognised based on the Group’s estimate of the ultimate cost of settling all claims incurred but<br />
unpaid at the balance sheet date. The provision is assessed by reviewing individual claims and tested for adequacy<br />
by comparing the amount recognised and the amount that would be required to settle the guarantee contract.<br />
3. SHARE CAPITAL<br />
Group and Company<br />
No. of ordinary shares<br />
2008 2007<br />
Issued and fully paid:<br />
At the beginning of the year 1,783,782,546 1,770,177,555<br />
Exercise of share options 1,568,994 13,604,991<br />
At the end of the year 1,785,351,540 1,783,782,546<br />
a. The holders of ordinary shares are entitled to receive dividends as declared from time to time and are entitled to<br />
one vote per share at meetings of the Company. All shares rank equally with regard to the Company’s residual<br />
assets.<br />
b. As at December 31, 2008, there were 10,533,580 (2007: 15,510,729) unissued ordinary shares granted under the<br />
Company’s Share Option Plan.<br />
c. Movements of the share capital account during the year are set out in the Consolidated Statement of Changes in<br />
Equity.<br />
136 Delivering Essential Solutions <strong>Sembcorp</strong> Industries Annual Report 2008 137
Notes to the<br />
Financial Statements<br />
Year Ended December 31, 2008<br />
4. SHARE-BASED INCENTIVE PLANS<br />
The Company’s Share Option Plan, Performance Share Plan and Restricted Stock Plan (collectively, the “Share Plans”)<br />
were approved and adopted by the shareholders at an Extraordinary General Meeting of the Company held on June<br />
5, 2000.<br />
The Executive Resource & Compensation Committee (the “Committee”) of the Company has been designated as the<br />
Committee responsible for the administration of the Share Plans. The Committee comprises the following members,<br />
all of whom are directors:<br />
Peter Seah Lim Huat (Chairman)<br />
Goh Geok Ling<br />
The Share Option Plan and Restricted Stock Plan are the incentive schemes for directors and employees of the Group<br />
whereas the Performance Share Plan is aimed primarily at key executives of the Group.<br />
The Share Plans are intended to attract, retain and incentivise participants to higher standards of performance and<br />
encourage greater dedication and loyalty by enabling the Company to give recognition to past contributions and<br />
services; as well as motivating participants to contribute to the long-term prosperity of the Group.<br />
The Share Option Plan provides the Company with means whereby non-executive directors and employees of the<br />
Group, and certain categories of persons who can make significant contributions through their close working<br />
relationship with the Group, such as non-executive directors and employees of the Company’s associated company, are<br />
given an opportunity to participate in the equity of the Company. From 2007 onwards, no share options were granted<br />
as share options were entirely replaced with restricted stocks of an equivalent fair value.<br />
The Performance Share Plan and Restricted Stock Plan award fully paid shares to participants to achieve pre-determined<br />
targets that create and enhance economic values for shareholders of the Company, and / or to accomplish timebased<br />
service conditions. Awards will be released to participants as fully-paid shares, or their equivalent cash value or<br />
combinations thereof, free-of-charge provided that the conditions of the awards are achieved and subject to approval<br />
by the Committee.<br />
4. SHARE-BASED INCENTIVE PLANS (cont’d)<br />
Other information regarding Share Plans is as follows:<br />
a. Share Option Plan<br />
Under the rules of the Share Option Plan, participants who ceased to be employed by the Group or the associated<br />
company by reason of ill health, injury or disability, redundancy, retirement at or after the legal retirement age,<br />
retirement before the legal retirement age, death, etc., or any other event approved by the Committee, may<br />
be allowed by the Committee to retain their unexercised options. The Committee may determine the number<br />
of shares comprised in that option which may be exercised and the period during which such option shall be<br />
exercisable, being a period not later than the expiry of the exercise period in respect of that option. Such option<br />
may be exercised at any time notwithstanding that the date of exercise of such option falls on a date prior to the<br />
first day of the exercise period in respect of such option.<br />
Other information regarding the Share Option Plan is as follows:<br />
i. The exercise price of the options can be set at market price or a discount to the market price not exceeding<br />
20% of the market price in respect of options granted at the time of grant. Market price is the volumeweighted<br />
average price for the shares on the Singapore Exchange Limited (“Singapore Exchange”) over the<br />
three consecutive trading days prior to grant date of that option. For all options granted to date, the exercise<br />
prices are set at market price.<br />
ii.<br />
After the first 12 months of lock-out period, the Group imposed a further vesting of four years for managers<br />
and above for retention purposes.<br />
iii. In 2008, all options were either settled by the issuance of new shares or by issuance of treasury shares.<br />
iv. The options granted expire after five years for non-executive directors and associated company’s employees,<br />
and 10 years for the employees of the Group.<br />
Awards granted under the Performance Share Plan are released at the end of the performance period only when the<br />
pre-determined targets have been achieved. Awards granted under the Restricted Stock Plan vest only after satisfactory<br />
completion of time-based service conditions, or where the award is performance related, after a further period of<br />
service beyond the performance target completion date. No minimum vesting period is prescribed under the Restricted<br />
Stock Plan and the length of the vesting period in respect of each award will be determined on a case-by-case basis.<br />
The shares are settled by physical delivery of shares by way of issuance of new shares or existing shares procured by the<br />
Company for transfer to the employees or cash in lieu of the shares.<br />
138 Delivering Essential Solutions <strong>Sembcorp</strong> Industries Annual Report 2008 139
Notes to the<br />
Financial Statements<br />
Year Ended December 31, 2008<br />
4. SHARE-BASED INCENTIVE PLANS (cont’d)<br />
a. Share Option Plan (cont’d)<br />
At the end of the year, details of the options granted under the Share Option Plan on unissued ordinary shares of<br />
the Company are as follows:<br />
<strong>Sembcorp</strong> Industries Ltd<br />
Ordinary shares<br />
2008<br />
Proceeds on<br />
options exercised<br />
Options<br />
during the year<br />
Options cancelled / Options Options Options credited to<br />
Date of grant Exercise price outstanding Options lapsed / outstanding exercisable exercisable share capital<br />
of options per share at Jan 1, 2008 exercised* not accepted at Dec 31, 2008 at Jan 1, 2008 at Dec 31, 2008 S$’000 Exercise period<br />
26/06/2000 S$1.63 305,953 (3,030) (77,600) 225,323 305,953 225,323 – 27/06/2001 to 26/06/2010<br />
24/07/2000 S$1.90 350,948 (115,750) (60,023) 175,175 350,948 175,175 84 20/05/2001 to 19/05/2009<br />
24/07/2000 S$1.76 39,064 – (4,999) 34,065 39,064 34,065 – 16/09/2001 to 15/09/2009<br />
19/04/2001 S$1.19 230,650 (6,000) (55,300) 169,350 230,650 169,350 4 20/04/2002 to 19/04/2011<br />
07/05/2002 S$1.23 294,250 (7,875) (64,250) 222,125 294,250 222,125 10 08/05/2003 to 07/05/2012<br />
17/10/2002 S$0.62 150,625 (12,375) (42,375) 95,875 150,625 95,875 5 18/10/2003 to 17/10/2012<br />
02/06/2003 S$0.78 36,750 (23,750) (13,000) – 36,750 – – 03/06/2004 to 02/06/2008<br />
02/06/2003 S$0.78 376,350 (185,375) (74,875) 116,100 376,350 116,100 65 03/06/2004 to 02/06/2013<br />
18/11/2003 S$0.93 63,000 (56,250) (6,750) – 63,000 – 8 19/11/2004 to 18/11/2008<br />
18/11/2003 S$0.93 608,875 (373,500) (77,625) 157,750 608,875 157,750 198 19/11/2004 to 18/11/2013<br />
17/05/2004 S$0.99 79,000 (10,250) – 68,750 32,750 68,750 107 18/05/2005 to 17/05/2009<br />
17/05/2004 S$0.99 1,181,427 (469,652) (100,125) 611,650 464,552 611,650 – 18/05/2005 to 17/05/2014<br />
22/11/2004 S$1.16 107,250 (19,000) – 88,250 60,500 88,250 303 23/11/2005 to 22/11/2009<br />
22/11/2004 S$1.16 1,494,400 (463,875) (178,625) 851,900 774,525 851,900 10 23/11/2005 to 22/11/2014<br />
01/07/2005 S$2.37 122,500 (17,500) – 105,000 26,250 65,625 – 02/07/2006 to 01/07/2010<br />
01/07/2005 S$2.37 2,371,647 (577,450) (111,000) 1,683,197 736,897 929,572 589 02/07/2006 to 01/07/2015<br />
21/11/2005 S$2.36 183,750 (35,000) – 148,750 70,000 100,625 21 22/11/2006 to 21/11/2010<br />
21/11/2005 S$2.36 2,742,320 (600,325) (143,125) 1,998,870 1,057,820 1,224,870 966 22/11/2006 to 21/11/2015<br />
09/06/2006 S$2.52 472,500 (70,000) – 402,500 78,750 175,000 – 10/06/2007 to 09/06/2011<br />
09/06/2006 S$2.52 4,299,470 (729,020) (191,500) 3,378,950 1,233,095 1,481,700 393 10/06/2007 to 09/06/2016<br />
15,510,729 (3,775,977) (1,201,172) 10,533,580 6,991,604 6,793,705 2,763<br />
* In 2008, 1,568,994 options were settled by the issuance of new shares and the rest by issuance of treasury shares.<br />
140 Delivering Essential Solutions <strong>Sembcorp</strong> Industries Annual Report 2008 141
Notes to the<br />
Financial Statements<br />
Year Ended December 31, 2008<br />
4. SHARE-BASED INCENTIVE PLANS (cont’d)<br />
a. Share Option Plan (cont’d)<br />
<strong>Sembcorp</strong> Industries Ltd<br />
Ordinary shares<br />
2007<br />
Proceeds on<br />
options exercised<br />
Options<br />
during the year<br />
Options cancelled / Options Options Options credited to<br />
Date of grant Exercise price* outstanding Options lapsed / outstanding exercisable exercisable share capital<br />
of options per share at Jan 1, 2007 exercised not accepted at Dec 31, 2007 at Jan 1, 2007 at Dec 31, 2007 S$’000 Exercise period<br />
26/06/2000 S$1.63 961,908 (618,255) (37,700) 305,953 961,908 305,953 1,093 27/06/2001 to 26/06/2010<br />
24/07/2000 S$1.90 812,939 (444,325) (17,666) 350,948 812,939 350,948 908 20/05/2001 to 19/05/2009<br />
24/07/2000 S$1.76 39,066 (2) – 39,064 39,066 39,064 – 16/09/2001 to 15/09/2009<br />
19/04/2001 S$1.19 476,175 (210,025) (35,500) 230,650 476,175 230,650 281 20/04/2002 to 19/04/2011<br />
07/05/2002 S$1.23 178,000 (177,500) (500) – 178,000 – 247 08/05/2003 to 07/05/2007<br />
07/05/2002 S$1.23 572,075 (252,625) (25,200) 294,250 572,075 294,250 345 08/05/2003 to 07/05/2012<br />
17/10/2002 S$0.62 188,000 (187,000) (1,000) – 188,000 – 144 18/10/2003 to 17/10/2007<br />
17/10/2002 S$0.62 510,000 (338,000) (21,375) 150,625 510,000 150,625 257 18/10/2003 to 17/10/2012<br />
02/06/2003 S$0.78 227,250 (188,500) (2,000) 36,750 174,125 36,750 171 03/06/2004 to 02/06/2008<br />
02/06/2003 S$0.78 1,041,225 (637,375) (27,500) 376,350 370,850 376,350 524 03/06/2004 to 02/06/2013<br />
18/11/2003 S$0.93 245,750 (180,250) (2,500) 63,000 192,625 63,000 195 19/11/2004 to 18/11/2008<br />
18/11/2003 S$0.93 1,396,645 (737,020) (50,750) 608,875 746,520 608,875 765 19/11/2004 to 18/11/2013<br />
17/05/2004 S$0.99 266,250 (183,750) (3,500) 79,000 171,750 32,750 205 18/05/2005 to 17/05/2009<br />
17/05/2004 S$0.99 2,195,150 (933,723) (80,000) 1,181,427 664,650 464,552 983 18/05/2005 to 17/05/2014<br />
22/11/2004 S$1.16 268,750 (156,500) (5,000) 107,250 174,250 60,500 205 23/11/2005 to 22/11/2009<br />
22/11/2004 S$1.16 2,621,525 (1,028,625) (98,500) 1,494,400 1,085,025 774,525 1,309 23/11/2005 to 22/11/2014<br />
01/07/2005 S$2.37 282,500 (160,000) – 122,500 138,125 26,250 399 02/07/2006 to 01/07/2010<br />
01/07/2005 S$2.37 4,761,553 (2,099,131) (290,775) 2,371,647 2,152,303 736,897 5,166 02/07/2006 to 01/07/2015<br />
21/11/2005 S$2.36 317,500 (133,750) – 183,750 146,875 70,000 336 22/11/2006 to 21/11/2010<br />
21/11/2005 S$2.36 5,325,820 (2,249,930) (333,570) 2,742,320 2,641,945 1,057,820 5,544 22/11/2006 to 21/11/2015<br />
09/06/2006 S$2.52 525,000 (52,500) – 472,500 – 78,750 132 10/06/2007 to 09/06/2011<br />
09/06/2006 S$2.52 7,450,500 (2,636,205) (514,825) 4,299,470 9,000 1,233,095 6,651 10/06/2007 to 09/06/2016<br />
30,663,581 (13,604,991) (1,547,861) 15,510,729 12,406,206 6,991,604 25,860<br />
* The exercise prices for outstanding share options granted prior to April 27, 2007 were adjusted as a result of the Special Dividend payment<br />
in 2007.<br />
142 Delivering Essential Solutions <strong>Sembcorp</strong> Industries Annual Report 2008 143
Notes to the<br />
Financial Statements<br />
Year Ended December 31, 2008<br />
4. SHARE-BASED INCENTIVE PLANS (cont’d)<br />
a. Share Option Plan (cont’d)<br />
At the end of the financial year, details of the options granted under the Share Option Plan on unissued ordinary<br />
shares of <strong>Sembcorp</strong> Marine Ltd are as follows:<br />
<strong>Sembcorp</strong> Marine Ltd<br />
Ordinary shares<br />
2008<br />
Options<br />
Options cancelled / Options Options Options<br />
Date of grant Exercise price outstanding Options lapsed / outstanding exercisable exercisable<br />
of options per share at Jan 1, 2008 exercised not accepted at Dec 31, 2008 at Jan 1, 2008 at Dec 31, 2008 Exercise period<br />
08/09/2000 S$0.50 198,870 (7,700) – 191,170 198,870 191,170 08/09/2001 to 07/09/2010<br />
27/09/2001 S$0.47 259,280 (80,570) – 178,710 259,280 178,710 28/09/2002 to 27/09/2011<br />
07/11/2002 S$0.64 513,650 (177,250) (700) 335,700 513,650 335,700 08/11/2003 to 07/11/2012<br />
08/08/2003 S$0.71 142,800 (142,800) – – 142,800 – 09/08/2004 to 08/08/2008<br />
08/08/2003 $0.71 2,130,490 (1,106,820) (8,400) 1,015,270 2,130,490 1,015,270 09/08/2004 to 08/08/2013<br />
10/08/2004 S$0.74 430,500 (378,000) – 52,500 280,000 52,500 11/08/2005 to 10/08/2009<br />
10/08/2004 S$0.74 6,856,205 (3,154,220) (115,100) 3,586,885 2,412,955 3,586,885 11/08/2005 to 10/08/2014<br />
11/08/2005 S$2.11 365,750 (115,500) – 250,250 134,750 147,000 12/08/2006 to 11/08/2010<br />
11/08/2005 S$2.11 12,635,335 (2,609,460) (322,400) 9,703,475 3,582,935 5,348,775 12/08/2006 to 11/08/2015<br />
02/10/2006 S$2.38 724,500 (75,250) – 649,250 136,500 281,750 03/10/2007 to 02/10/2011<br />
02/10/2006 S$2.38 11,319,490 (894,585) (469,071) 9,955,834 2,388,059 4,318,857 03/10/2007 to 02/10/2016<br />
35,576,870 (8,742,155) (915,671) 25,919,044 12,180,289 15,456,617<br />
<strong>Sembcorp</strong> Marine Ltd<br />
Ordinary shares<br />
2007<br />
Options<br />
granted for<br />
Options<br />
Options bonus shares cancelled / Options Options Options<br />
Date of grant Exercise price # outstanding issued during Options lapsed / outstanding exercisable exercisable<br />
of options per share at Jan 1, 2007 the year exercised not accepted at Dec 31, 2007 at Jan 1, 2007 at Dec 31, 2007 Exercise period<br />
08/09/2000 S$0.50 298,000 61,260 (80,440) (79,950) 198,870 298,000 198,870 08/09/2001 to 07/09/2010<br />
27/09/2001 S$0.47 510,200 108,680 (333,850) (25,750) 259,280 510,200 259,280 28/09/2002 to 27/09/2011<br />
07/11/2002 S$0.64 140,000 – (140,000) – – 140,000 – 08/11/2003 to 07/11/2007<br />
07/11/2002 S$0.64 3,202,450 182,700 (2,688,750) (182,750) 513,650 3,202,450 513,650 08/11/2003 to 07/11/2012<br />
08/08/2003 S$0.71 367,000 40,800 (265,000) – 142,800 265,750 142,800 09/08/2004 to 08/08/2008<br />
08/08/2003 $0.71 5,311,650 721,240 (3,682,150) (220,250) 2,130,490 2,358,150 2,130,490 09/08/2004 to 08/08/2013<br />
10/08/2004 S$0.74 510,000 129,000 (187,500) (21,000) 430,500 280,000 280,000 11/08/2005 to 10/08/2009<br />
10/08/2004 S$0.74 8,968,200 2,085,380 (3,726,325) (471,050) 6,856,205 2,357,200 2,412,955 11/08/2005 to 10/08/2014<br />
11/08/2005 S$2.11 505,000 130,500 (185,750) (84,000) 365,750 257,500 134,750 12/08/2006 to 11/08/2010<br />
11/08/2005 S$2.11 13,405,650 3,803,910 (3,902,275) (671,950) 12,635,335 3,146,150 3,582,935 12/08/2006 to 11/08/2015<br />
02/10/2006 S$2.38 560,000 224,000 (59,500) – 724,500 – 136,500 03/10/2007 to 02/10/2011<br />
02/10/2006 S$2.38 9,224,075 3,480,850 (648,335) (737,100) 11,319,490 – 2,388,059 03/10/2007 to 02/10/2016<br />
43,002,225 10,968,320 (15,899,875) (2,493,800) 35,576,870 12,815,400 12,180,289<br />
# Adjusted for two Bonus Shares credited as fully paid for every five existing ordinary shares.<br />
Except as disclosed above, there were no unissued shares of the Company or its subsidiaries under options granted<br />
by the Company or its subsidiaries as at the end of the financial year.<br />
144 Delivering Essential Solutions <strong>Sembcorp</strong> Industries Annual Report 2008 145
Notes to the<br />
Financial Statements<br />
Year Ended December 31, 2008<br />
4. SHARE-BASED INCENTIVE PLANS (cont’d)<br />
a. Share Option Plan (cont’d)<br />
<strong>Sembcorp</strong> Industries Ltd’s options exercised in 2008 resulted in 1,568,994 (2007: 13,604,991) ordinary shares being<br />
issued at a weighted average share price of S$1.76 (2007: S$1.90) per ordinary share. <strong>Sembcorp</strong> Industries Ltd’s<br />
options were exercised on a regular basis throughout the year. The weighted average share price during the year<br />
was S$3.88 (2007: S$5.42).<br />
<strong>Sembcorp</strong> Marine Ltd’s options exercised in 2008 resulted in 8,742,155 (2007: 15,899,875) ordinary shares being<br />
issued at a weighted average share price of S$1.34 (2007: S$1.50) per ordinary share. <strong>Sembcorp</strong> Marine Ltd’s<br />
options were exercised on a regular basis throughout the year. The weighted average share price during the year<br />
was S$3.33 (2007: S$3.52).<br />
Fair Value of Share Options<br />
The fair value of services received in return for share options granted are measured by reference to the fair value<br />
of share options granted.<br />
<strong>Sembcorp</strong> Industries Ltd Share Options<br />
There were no share options granted during 2008.<br />
<strong>Sembcorp</strong> Marine Ltd Share Options<br />
There were no share options granted during 2008.<br />
b. Performance Share Plan<br />
Under the Performance Share Plan, the awards granted conditional on performance targets are set based on<br />
medium-term corporate objectives at the start of each rolling three-year performance qualifying period. A specific<br />
number of performance shares shall be awarded at the end of the three-year performance cycle depending on the<br />
extent of the achievement of the performance conditions established at the onset.<br />
The performance levels were calibrated based on Wealth Added and Total Shareholder Return. For each performance<br />
measure, three distinct performance levels were set. A minimum of threshold performance must be achieved to<br />
trigger an achievement factor, which in turn determines the number of shares to be finally awarded. Performance<br />
shares to be delivered will range between 0% to 150% of the conditional performance shares awarded.<br />
Senior management participants are required to hold a minimum percentage of the shares released to them under<br />
the Performance Share Plan and Restricted Stock Plan to maintain a beneficial ownership stake in the Group, for<br />
the duration of their employment or tenure with the Group. A maximum cap is set based on a multiple of the<br />
individual participant’s Annual Base Salary. Any excess can be sold off, but in the event of a shortfall, they have a<br />
two calendar year period to meet the minimum percentage requirement.<br />
4. SHARE-BASED INCENTIVE PLANS (cont’d)<br />
b. Performance Share Plan<br />
i. <strong>Sembcorp</strong> Industries Ltd Performance Shares<br />
The details of performance shares of <strong>Sembcorp</strong> Industries Ltd awarded during the year since commencement<br />
of the Performance Share Plan (aggregate) were as follows:<br />
Aggregate<br />
additional<br />
Aggregate conditional Aggregate<br />
Conditional original performance Aggregate Aggregate conditional<br />
performance conditional shares awarded conditional conditional performance<br />
Performance shares awarded performance due to performance performance shares<br />
shares participants during the year shares awarded modification shares released shares lapsed outstanding<br />
2008<br />
Director of the Company:<br />
Tang Kin Fei 400,000 2,240,000 73,720 (931,240) (359,914) 1,236,484<br />
Key executives<br />
of the Group 550,000 5,555,000 69,989 (1,423,859) (2,878,682) 1,504,280<br />
950,000 7,795,000 143,709 (2,355,099) (3,238,596) 2,740,764<br />
2007<br />
Director of the Company:<br />
Tang Kin Fei 400,000 1,840,000 73,720 (289,486) (359,914) 1,264,320<br />
Key executives<br />
of the Group 490,000 5,005,000 69,989 (889,064) (2,867,986) 1,317,939<br />
890,000 6,845,000 143,709 (1,178,550) (3,227,900) 2,582,259<br />
With the Committee’s approval on the achievement factor for the achievement of the performance targets for<br />
the performance period 2005 to 2007, a total of 1,176,549 (2007: 252,850) performance shares were released,<br />
of which an additional 395,750 (2007: Nil) performance shares were awarded for the over-achievement of the<br />
performance targets. These shares were released via the issuance of treasury shares.<br />
The total number of performance shares in awards granted conditionally and representing 100% of targets<br />
to be achieved, but not released as at end 2008, was 2,740,764 (2007: 2,582,259). Based on the multiplying<br />
factor, the actual release of the awards could range from zero to a maximum of 4,111,146 (2007: 3,873,389)<br />
performance shares.<br />
146 Delivering Essential Solutions <strong>Sembcorp</strong> Industries Annual Report 2008 147
Notes to the<br />
Financial Statements<br />
Year Ended December 31, 2008<br />
4. SHARE-BASED INCENTIVE PLANS (cont’d)<br />
b. Performance Share Plan (cont’d)<br />
ii. Performance shares of a listed subsidiary<br />
The details of performance shares of <strong>Sembcorp</strong> Marine Ltd awarded during the year since commencement of<br />
the Performance Share Plan (aggregate) were as follows:<br />
2008 2007<br />
Conditional performance shares awarded during the financial year 790,000 700,000<br />
Aggregate conditional performance shares awarded 5,215,000 4,395,000<br />
Additional performance shares awarded arising<br />
from targets met during the year 542,500 –<br />
Additional performance shares awarded arising<br />
from bonus shares issued during the year – 830,000<br />
Aggregate conditional performance shares released (2,721,900) (1,555,400)<br />
Aggregate conditional performance shares lapsed (425,600) (764,600)<br />
Aggregate conditional performance shares outstanding 2,610,000 2,905,000<br />
No performance shares of <strong>Sembcorp</strong> Marine Ltd were awarded to the directors of the Company.<br />
The total number of <strong>Sembcorp</strong> Marine Ltd’s performance shares in awards granted conditionally and<br />
representing 100% of targets to be achieved, but not released as at end 2008, was 2,610,000 (2007: 2,905,000).<br />
Based on the multiplying factor, the actual release of the awards could range from zero to a maximum of<br />
3,915,000 (2007: 4,357,500) performance shares. During the year, a total of 790,000 (2007: 700,000) <strong>Sembcorp</strong><br />
Marine Ltd’s performance shares were released by the Committee in the form of existing shares transferred to<br />
such participants for the performance period 2008 to 2010.<br />
Fair value of performance shares<br />
The fair values of the performance shares are estimated using a Monte Carlo simulation methodology at the<br />
grant dates.<br />
The fair values of performance shares granted during the year are as follows:<br />
4. SHARE-BASED INCENTIVE PLANS (cont’d)<br />
b. Performance Share Plan (cont’d)<br />
ii. Performance shares of a listed subsidiary (cont’d)<br />
Fair value of performance shares (cont’d)<br />
The expected volatility is based on the historical volatility over the most recent period that is close to the<br />
expected life of the performance shares.<br />
During the year, the Group charged S$5,981,000 (2007: S$4,970,000) to the income statement based on the fair<br />
value of the performance shares at the grant date being expensed over the vesting period.<br />
c. Restricted Stock Plan<br />
From 2007, share option grant was ceased and entirely replaced with restricted stocks award of an equivalent fair<br />
value.<br />
Under the Restricted Stock Plan, the awards granted conditional on performance targets are set based on corporate<br />
objectives at the start of each rolling two-year performance qualifying period. The performance criteria are set and<br />
performance levels for the restricted stocks are calibrated based on Return on Total Assets and Total Shareholder<br />
Return.<br />
For awards granted before 2008, three distinct performance levels are set for each performance measure. A<br />
minimum threshold performance must be achieved to trigger an achievement factor, which in turn determines the<br />
number of shares to be finally awarded. Based on the criteria, restricted stocks to be delivered will range from 0%<br />
to 130% of the conditional restricted stocks awarded.<br />
For awards granted in 2008, four distinct performance levels are set for each performance measure. A minimum<br />
threshold performance must be achieved to trigger an achievement factor, which in turn determines the number<br />
of shares to be finally awarded. Based on the criteria, restricted stocks to be delivered will range from 0% to 150%<br />
of the conditional restricted stocks awarded.<br />
The managerial participants of the Group will be awarded restricted stocks under the Restricted Stock Plan, while<br />
the non-managerial participants of the Group will receive their awards in an equivalent cash value. This cashsettled<br />
notional restricted stocks award for non-managerial participants is known as the <strong>Sembcorp</strong> Challenge<br />
Bonus.<br />
Fair value of Fair value of Fair value of Fair value of<br />
<strong>Sembcorp</strong> <strong>Sembcorp</strong> <strong>Sembcorp</strong> <strong>Sembcorp</strong><br />
Industries Ltd Industries Ltd Marine Ltd Marine Ltd<br />
Performance Performance Performance Performance<br />
Share granted Share granted Share granted Share granted<br />
on April 7, 2008 on April 9, 2007 on April 7, 2008 on June 12, 2007<br />
Fair value at measurement date S$2.08 S$5.35 S$2.65 S$4.25<br />
Assumptions under the Monte Carlo model<br />
Share price S$4.26 S$5.50 S$3.77 S$4.78<br />
Expected volatility:<br />
<strong>Sembcorp</strong> Industries Ltd / <strong>Sembcorp</strong> Marine Ltd 32.4% 25.5% 30.9% 24.6%<br />
Morgan Stanley Capital International<br />
(“MSCI”) AC Asia Pacific excluding<br />
Japan Industrials Index 21.9% 12.9% 21.9% 13.8%<br />
Correlation with MSCI 60.6% 40.1% 61.3% 30.0%<br />
Risk-free interest rate 1.1% 2.5% 1.1% 2.5%<br />
Expected dividend 4.7% 3.2% 5.0% 4.9%<br />
A specific number of restricted stocks shall be awarded at the end of the two-year performance cycle depending<br />
on the extent of the achievement of the performance conditions established at the onset. There is a further vesting<br />
period of three years after the performance period, during which one-third of the awarded shares are released<br />
each year to managerial participants. Non-managerial participants will receive the equivalent in cash at the end of<br />
the two-year performance cycle, with no further vesting conditions.<br />
Senior management participants are required to hold a minimum percentage of the shares released to them under<br />
the Restricted Stock Plan and Performance Share Plan to maintain a beneficial ownership stake in the Group, for<br />
the duration of their employment or tenure with the Group. A maximum cap is set based on a multiple of the<br />
individual participant’s Annual Base Salary. Any excess can be sold off, but in the event of a shortfall, they have a<br />
two calendar year period to meet the minimum percentage requirement.<br />
148 Delivering Essential Solutions <strong>Sembcorp</strong> Industries Annual Report 2008 149
Notes to the<br />
Financial Statements<br />
Year Ended December 31, 2008<br />
4. SHARE-BASED INCENTIVE PLANS (cont’d)<br />
c. Restricted Stock Plan (cont’d)<br />
i. <strong>Sembcorp</strong> Industries Ltd Restricted Stocks<br />
The details of restricted stocks of <strong>Sembcorp</strong> Industries Ltd awarded during the year since commencement of<br />
the Restricted Stock Plan (aggregate) were as follows:<br />
Aggregate<br />
additional<br />
Aggregate conditional Aggregate<br />
Conditional original restricted Aggregate Aggregate conditional<br />
restricted conditional stocks awarded conditional conditional restricted<br />
Restricted stocks awarded restricted due to restricted restricted stocks<br />
stocks participants during the year stocks awarded modification stocks released stocks lapsed outstanding<br />
2008<br />
Directors of the Company:<br />
Peter Seah Lim Huat 23,500 47,000 484 – – 47,484<br />
Tang Kin Fei 126,000 318,000 6,785 (30,416) – 315,426<br />
Goh Geok Ling 13,700 27,400 282 – – 27,682<br />
Richard Hale, OBE 17,000 34,000 350 – – 34,350<br />
Evert Henkes 7,000 14,000 144 – – 14,144<br />
Lee Suet Fern 13,700 27,400 282 – – 27,682<br />
Other executives<br />
of the Group 1,977,300 4,728,100 93,425 (409,185) (508,255) 4,162,821<br />
2,178,200 5,195,900 101,752 (439,601) (508,255) 4,629,589<br />
2007<br />
Directors of the Company:<br />
Peter Seah Lim Huat 23,500 23,500 484 – – 23,984<br />
Tang Kin Fei 126,000 192,000 6,785 – – 198,785<br />
Goh Geok Ling 13,700 13,700 282 – – 13,982<br />
Richard Hale, OBE 17,000 17,000 350 – – 17,350<br />
Evert Henkes 7,000 7,000 144 – – 7,144<br />
Lee Suet Fern 13,700 13,700 282 – – 13,982<br />
K Shanmugam 13,700 13,700 282 – – 13,982<br />
Other executives<br />
of the Group 1,753,300 2,737,100 93,143 – (229,212) 2,601,031<br />
1,967,900 3,017,700 101,752 – (229,212) 2,890,240<br />
With the Committee’s approval on the achievement factor for the achievement of the performance targets for<br />
the performance period 2006 to 2007, a total of 439,601 restricted stocks were released. An additional 279,793<br />
restricted stocks were awarded for the over-achievement of the performance targets. These restricted stocks<br />
were released via the issuance of treasury shares. There was no release of restricted stocks in the year 2007.<br />
The total number of restricted stocks outstanding, including award(s) achieved but not released, as at end 2008,<br />
was 4,629,589 (2007: 2,890,240). Of this, the total number of restricted stocks in awards granted conditionally<br />
and representing 100% of targets to be achieved, but not released was 3,900,597 (2007: 2,890,240). Based on<br />
the multiplying factor, the actual release of the conditional awards could range from zero to a maximum of<br />
5,491,236 (2007: 3,757,312) restricted stocks.<br />
4. SHARE-BASED INCENTIVE PLANS (cont’d)<br />
c. Restricted Stock Plan (cont’d)<br />
i. <strong>Sembcorp</strong> Industries Ltd Restricted Stocks (cont’d)<br />
A total of 600,000 (2007: 546,000) notional restricted stocks of <strong>Sembcorp</strong> Industries Ltd’s shares were awarded<br />
on April 7, 2008 for the <strong>Sembcorp</strong> Challenge Bonus for non-managerial participants for the performance<br />
period 2008 to 2009. With the Committee’s approval during the year, an additional 11,248 notional restricted<br />
stocks for the performance period 2007 to 2008 were added to the outstanding awards as a result of the<br />
Special Dividend payment in April 2007, therefore the total outstanding notional restricted stocks for the<br />
performance period 2007 to 2008 is 557,248.<br />
ii.<br />
The total number of notional restricted stocks in awards for the <strong>Sembcorp</strong> Challenge Bonus granted<br />
conditionally and representing 100% of targets to be achieved, but not released as at end 2008, was 1,157,248<br />
(2007: 546,000). Based on the multiplying factor, the number of notional restricted stocks to be converted into<br />
the funding pool could range from zero to a maximum of 1,624,422 (2007: 709,800).<br />
Restricted stocks of a listed subsidiary<br />
The details of restricted stocks of <strong>Sembcorp</strong> Marine Ltd awarded during the year since commencement of the<br />
Restricted Stock Plan (aggregate) were as follows:<br />
Aggregate<br />
additional<br />
Aggregate conditional Aggregate<br />
Conditional original restricted Aggregate Aggregate conditional<br />
restricted conditional stocks awarded conditional conditional restricted<br />
Restricted stocks awarded restricted due to restricted restricted stocks<br />
stocks participants during the year stocks awarded bonus issue stocks released stocks lapsed outstanding<br />
2008<br />
Directors of the Company:<br />
Tang Kin Fei 12,000 25,500 5,400 – – 30,900<br />
Goh Geok Ling 22,000 44,000 8,800 – – 52,800<br />
Other participants 3,539,000 7,534,632 1,931,720 (708,128) (556,966) 8,679,151<br />
3,573,000 7,604,132 1,945,920 (708,128) (556,966) 8,762,851<br />
2007<br />
Directors of the Company:<br />
Tang Kin Fei 13,500 13,500 5,400 – – 18,900<br />
Goh Geok Ling 22,000 22,000 8,800 – – 30,800<br />
Other participants 3,819,690 5,042,090 1,931,720 – (229,825) 6,743,985<br />
3,855,190 5,077,590 1,945,920 – (229,825) 6,793,685<br />
The total number of <strong>Sembcorp</strong> Marine Ltd’s restricted stocks in awards granted conditionally and representing<br />
100% of targets to be achieved, but not released as at end of 2008, was 8,762,851 (2007: 6,793,685 1 ). Based<br />
on the multiplying factor, the actual release of the awards could range from zero to a maximum of 11,391,706<br />
(2007: 8,831,791 2 ) restricted stocks. In 2008, an additional 477,893 restricted stocks were awarded for the overachievement<br />
of the performance targets for the performance period 2006 to 2007.<br />
Notes:<br />
1. Includes 1,046,458 notional restricted stocks in awards for the Challenge Bonus.<br />
2. Includes 1,360,396 notional restricted stocks in awards for the Challenge Bonus.<br />
150 Delivering Essential Solutions <strong>Sembcorp</strong> Industries Annual Report 2008 151
Notes to the<br />
Financial Statements<br />
Year Ended December 31, 2008<br />
4. SHARE-BASED INCENTIVE PLANS (cont’d)<br />
c. Restricted Stock Plan (cont’d)<br />
ii. Restricted stocks of a listed subsidiary (cont’d)<br />
A total of 957,400 (2007: 816,250) notional restricted stocks of <strong>Sembcorp</strong> Marine Ltd’s shares were awarded on<br />
April 7, 2008 for the Challenge Bonus for the performance period 2008 to 2009.<br />
The total number of notional restricted stocks in awards for the Challenge Bonus granted conditionally and<br />
representing 100% of targets to be achieved, but not released as at end 2008, was 1,866,248 (2007: 1,046,458).<br />
Based on the multiplying factor, the number of notional restricted stocks to be converted into the funding<br />
pool could range from zero to a maximum of 2,606,642 (2007: 1,360,396).<br />
Fair value of restricted stocks<br />
The fair values of the restricted stocks are estimated using a Monte Carlo simulation methodology at the grant<br />
dates.<br />
The fair values of restricted stocks granted during the year are as follows:<br />
Fair value of Fair value of<br />
<strong>Sembcorp</strong> <strong>Sembcorp</strong> Fair value of Fair value of<br />
Industries Ltd Industries Ltd <strong>Sembcorp</strong> <strong>Sembcorp</strong><br />
Restricted Stocks Restricted Stocks Marine Ltd Marine Ltd<br />
granted on granted on Restricted Stocks Restricted Stocks<br />
April 7, 2008 and April 9, 2007 and granted on granted on<br />
August 1, 2008 August 1, 2007 April 7, 2008 June 12, 2007<br />
5. (DEFICIT) / SURPLUS IN OTHER RESERVES<br />
Group<br />
Company<br />
2008 2007 2008 2007<br />
Note S$’000 S$’000 S$’000 S$’000<br />
Reserve for own shares (a) (34,731) – (34,731) –<br />
Currency translation reserve (b) (121,650) (37,383) – –<br />
Other reserves (c) 114,000 676,831 22,620 23,699<br />
(42,381) 639,448 (12,111) 23,699<br />
a. Reserve for Own Shares<br />
At December 31, 2008, the Company held 8,377,867 (2007: Nil) of its own uncancelled shares as treasury shares.<br />
b. Currency Translation Reserve<br />
The currency translation reserve comprises:<br />
i. foreign exchange differences arising from the translation of the financial statements of foreign operations<br />
whose functional currencies are different from the presentation currency of the Group;<br />
ii.<br />
exchange differences on monetary items which form part of the Group’s net investment in foreign operations;<br />
and<br />
iii. gains or losses on instruments used to hedge the Company’s net investment in foreign operations that are<br />
determined to be effective hedges.<br />
Fair value at measurement date S$3.07 S$4.79 S$3.06 S$4.15<br />
Assumptions under the Monte Carlo model<br />
Share price S$4.26 S$5.50 S$3.77 S$4.78<br />
Expected volatility:<br />
<strong>Sembcorp</strong> Industries Ltd / <strong>Sembcorp</strong> Marine Ltd 32.4% 25.5% 30.9% 24.6%<br />
Straits Times Index (“STI”) 15.9% 10.2% 15.9% 10.0%<br />
Correlation with STI 69.7% 49.5% 47.6% 14.1%<br />
Risk-free interest rate 0.9%-1.3% 2.4%-2.6% 0.9%-1.3% 2.4%-2.6%<br />
Expected dividend 4.7% 3.2% 5.0% 4.9%<br />
The expected volatility is based on the historical volatility over the most recent period that is close to the<br />
expected life of the restricted stocks.<br />
During the year, the Group charged S$14,293,000 (2007: S$12,817,000) to the income statement based on the<br />
fair value of restricted stocks at the grant date being expensed over the vesting period.<br />
Fair value of <strong>Sembcorp</strong> Challenge Bonus<br />
During the year, the Group charged S$7,820,000 (2007: S$1,568,000) to the income statement based on the<br />
market values of the shares at the balance sheet date. The compensation cost for <strong>Sembcorp</strong> Challenge Bonus<br />
recorded in liabilities amounted to S$9,391,000 (2007: S$1,571,221) as at December 31, 2008. The fair value of<br />
the compensation cost is based on the notional number of restricted stocks awarded for <strong>Sembcorp</strong> Challenge<br />
Bonus and the market price at the vesting date.<br />
152 Delivering Essential Solutions <strong>Sembcorp</strong> Industries Annual Report 2008 153
Notes to the<br />
Financial Statements<br />
Year Ended December 31, 2008<br />
5. (DEFICIT) / SURPLUS IN OTHER RESERVES (cont’d)<br />
c. Other Reserves<br />
Group<br />
Company<br />
5. (DEFICIT) / SURPLUS IN OTHER RESERVES (cont’d)<br />
c. Other Reserves (cont’d)<br />
Group<br />
Company<br />
Share-based<br />
Share-based<br />
Capital Merger payments Fair value Hedging payments<br />
reserve reserve reserve reserve reserve Total reserve<br />
S$’000 S$’000 S$’000 S$’000 S$’000 S$’000 S$’000<br />
At January 1, 2008 342,252 29,201 37,525 293,223 (25,370) 676,831 23,699<br />
Net fair value changes of<br />
available-for-sale<br />
financial assets, net of tax – – – (278,803) – (278,803) –<br />
Net fair value changes of<br />
available-for-sale<br />
financial assets transferred<br />
to the income statement,<br />
net of tax – – – (725) – (725) –<br />
Net fair value, changes of<br />
cash flow hedges<br />
transferred to the<br />
income statement – – – – (1,296) (1,296) –<br />
Net fair value changes of<br />
cash flow hedges,<br />
net of tax – – – – (148,431) (148,431) –<br />
Share of hedging reserve<br />
of associates and<br />
joint venture companies – – – – (89,022) (89,022) –<br />
Share-based payments – – 18,134 – – 18,134 11,008<br />
Treasury shares transferred<br />
to employees – – (28,690) – – (28,690) (12,087)<br />
Treasury shares held<br />
by subsidiary (34,379) – – – – (34,379) –<br />
Realisation of reserve<br />
upon disposal of<br />
investments and changes<br />
in group structure 7 – 117 257 – 381 –<br />
At December 31, 2008 307,880 29,201 27,086 13,952 (264,119) 114,000 22,620<br />
Share-based<br />
Share-based<br />
Capital Merger payments Fair value Hedging payments<br />
reserve reserve reserve reserve reserve Total reserve<br />
S$’000 S$’000 S$’000 S$’000 S$’000 S$’000 S$’000<br />
At January 1, 2007 345,907 29,201 18,907 120,919 (26,276) 488,658 13,793<br />
Net fair value changes<br />
of available-for-sale<br />
financial assets, net of tax – – – 265,686 – 265,686 –<br />
Net fair value changes<br />
of available-for-sale<br />
financial assets transferred<br />
to the income statement,<br />
net of tax – – – (90,652) – (90,652) –<br />
Net fair value changes of<br />
cash flow hedges, net of tax – – – – 19,554 19,554 –<br />
Share of hedging reserve<br />
of associates and<br />
joint venture companies – – – – (18,648) (18,648) –<br />
Share-based payments – – 18,725 – – 18,725 9,906<br />
Realisation of reserve<br />
upon disposal of<br />
investments and changes<br />
in group structure (3,655) – (107) (2,730) – (6,492) –<br />
At December 31, 2007 342,252 29,201 37,525 293,223 (25,370) 676,831 23,699<br />
Other reserves include:<br />
i. Capital reserve comprises capitalisation of accumulated profits for the issue of bonus shares, capital reserve<br />
(net of goodwill) on consolidation and equity accounting, capital redemption reserve and convertible loan<br />
stock reserve.<br />
ii.<br />
Merger reserve represents the difference between the value of shares issued by the Company in exchange for<br />
the value of shares acquired in respect of the acquisition of subsidiaries accounted for under the pooling-ofinterests<br />
method.<br />
iii. Share-based payments reserve comprises the cumulative value of services received from employees recorded<br />
on grant of equity-settled share options, performance shares and performance based restricted stocks. The<br />
expense for service received is recognised over the performance period and / or vesting period. The amount in<br />
the share-based payments reserve is retained when the option is exercised or expires.<br />
iv. Fair value reserve includes the cumulative net change in the fair value of available-for-sale investments until<br />
the investments are derecognised.<br />
v. Hedging reserve comprises the effective portion of the cumulative net change in the fair value of cash flow<br />
hedging instruments related to hedged transactions that have not yet occurred.<br />
154 Delivering Essential Solutions <strong>Sembcorp</strong> Industries Annual Report 2008 155
Notes to the<br />
Financial Statements<br />
Year Ended December 31, 2008<br />
6. PROPERTY, PLANT AND EQUIPMENT<br />
Leasehold and<br />
Furniture,<br />
freehold land, Tools and fittings and Capital<br />
buildings and Improvements Quays and Plant and workshop office Motor work-inwet<br />
berthage to premises dry docks machinery Marine vessels equipment equipment vehicles progress Total<br />
Note S$’000 S$’000 S$’000 S$’000 S$’000 S$’000 S$’000 S$’000 S$’000 S$’000<br />
Group<br />
Cost / Valuation<br />
Balance at January 1, 2008 668,125 39,500 327,595 2,431,107 8,042 39,052 107,591 56,130 296,764 3,973,906<br />
Translation adjustments (9,836) (589) – (174,904) – – (9) (711) (37,943) (223,992)<br />
Additions 61,063 263 – 53,018 7,814 1,916 8,769 3,775 225,087 361,705<br />
Reclassification 27,505 240 884 156,874 345 – 2,392 160 (188,400) –<br />
Disposals / Write-offs (5,333) (262) – (100,098) (345) (1,356) (6,467) (2,661) (87) (116,609)<br />
Disposal of subsidiaries (14,045) – – (22,811) – – (140) (281) (3,827) (41,104)<br />
Balance at December 31, 2008 727,479 39,152 328,479 2,343,186 15,856 39,612 112,136 56,412 291,594 3,953,906<br />
Accumulated Depreciation<br />
and Impairment Losses<br />
Balance at January 1, 2008 231,858 19,427 131,989 822,694 7,354 28,664 87,132 43,079 – 1,372,197<br />
Translation adjustments (1,590) (301) 2 (44,876) – 14 89 (532) – (47,194)<br />
Depreciation for the year 34(b) 22,147 2,125 7,592 144,676 583 3,836 9,720 3,177 – 193,856<br />
Reclassification (2,752) 90 53 1,220 185 – 1,726 (522) – –<br />
Disposals / Write-offs (4,946) (65) – (37,263) (188) (1,341) (6,205) (2,571) – (52,579)<br />
Disposal of subsidiaries (3,629) – – (14,861) – – (84) (184) – (18,758)<br />
Allowance made for impairment – net 34(b) – – – 7,807 – – – – – 7,807<br />
Balance at December 31, 2008 241,088 21,276 139,636 879,397 7,934 31,173 92,378 42,447 – 1,455,329<br />
Carrying Amount<br />
At December 31, 2008 486,391 17,876 188,843 1,463,789 7,922 8,439 19,758 13,965 291,594 2,498,577<br />
156 Delivering Essential Solutions <strong>Sembcorp</strong> Industries Annual Report 2008 157
Notes to the<br />
Financial Statements<br />
Year Ended December 31, 2008<br />
6. PROPERTY, PLANT AND EQUIPMENT (cont’d)<br />
Leasehold and<br />
Furniture,<br />
freehold land, Tools and fittings and Capital<br />
buildings and Improvements Quays and Plant and workshop office Motor work-inwet<br />
berthage to premises dry docks machinery Marine vessels equipment equipment vehicles progress Total<br />
Note S$’000 S$’000 S$’000 S$’000 S$’000 S$’000 S$’000 S$’000 S$’000 S$’000<br />
Group<br />
Cost / Valuation<br />
Balance at January 1, 2007 816,493 40,348 328,196 2,121,581 53,887 38,420 98,843 53,694 276,630 3,828,092<br />
Reclassification to investment properties<br />
on adoption of FRS 40 7 (50,868) (728) – – – – – – – (51,596)<br />
Balance at January 1, 2007, restated 765,625 39,620 328,196 2,121,581 53,887 38,420 98,843 53,694 276,630 3,776,496<br />
Translation adjustments (5,506) 120 (50) (29,765) – (235) (575) (134) (4,167) (40,312)<br />
Additions 13,784 37 3 66,491 34 5,060 12,493 4,339 354,640 456,881<br />
Reclassification 35,148 – – 292,878 223 (13) 145 (38) (327,661) 682<br />
Disposals / Write-offs (6,595) (116) (554) (12,648) (46,102) (47) (3,022) (1,444) (2,678) (73,206)<br />
Acquisition of subsidiaries – – – – – – 17 – – 17<br />
Disposal of subsidiaries (134,331) (161) – (7,430) – (4,133) (310) (287) – (146,652)<br />
Balance at December 31, 2007 668,125 39,500 327,595 2,431,107 8,042 39,052 107,591 56,130 296,764 3,973,906<br />
Accumulated Depreciation<br />
and Impairment Losses<br />
Balance at January 1, 2007 271,375 17,554 125,225 711,366 9,880 28,378 82,378 41,661 5,770 1,293,587<br />
Reclassification to investment properties<br />
on adoption of FRS 40 7 (15,526) (682) – – – – – – – (16,208)<br />
Balance at January 1, 2007, restated 255,849 16,872 125,225 711,366 9,880 28,378 82,378 41,661 5,770 1,277,379<br />
Translation adjustments (1,011) 41 (7) (7,379) – (100) (334) (101) (16) (8,907)<br />
Depreciation for the year 34(b) 20,742 2,685 7,267 132,293 2,434 3,435 8,465 2,785 – 180,106<br />
Reclassification – – – 3,950 – – – – (3,950) –<br />
Disposals / Write-offs (8,069) (104) (496) (13,059) (4,960) (39) (3,077) (1,138) (1,804) (32,746)<br />
Disposal of subsidiaries (35,653) (67) – (4,698) – (3,010) (298) (128) – (43,854)<br />
Allowance made / (reversed)<br />
for impairment – net 34(b) – – – 221 – – (2) – – 219<br />
Balance at December 31, 2007 231,858 19,427 131,989 822,694 7,354 28,664 87,132 43,079 – 1,372,197<br />
Carrying Amount<br />
At December 31, 2007 436,267 20,073 195,606 1,608,413 688 10,388 20,459 13,051 296,764 2,601,709<br />
158 Delivering Essential Solutions <strong>Sembcorp</strong> Industries Annual Report 2008 159
Notes to the<br />
Financial Statements<br />
Year Ended December 31, 2008<br />
6. PROPERTY, PLANT AND EQUIPMENT (cont’d)<br />
In 2008, the impairment losses relates mainly to the writing down of plant and machinery by a subsidiary, <strong>Sembcorp</strong><br />
Environment Pte Ltd. The subsidiary made an assessment of the recoverable amount of its assets and made an<br />
impairment to certain parts of its plant and machinery which are no longer in use amounting to S$7.8 million.<br />
In 2007, property, plant and equipment of net book value amounting to S$682,000 were reclassified from investment<br />
property (Note 7).<br />
Leasehold and<br />
Furniture,<br />
freehold land, Improve- fittings and Capital<br />
buildings and ments Quays and Plant and office Motor work-inwet<br />
berthage to premises dry docks machinery equipment vehicles progress Total<br />
Note S$’000 S$’000 S$’000 S$’000 S$’000 S$’000 S$’000 S$’000<br />
Company<br />
Cost<br />
Balance at January 1, 2008 312 2,019 – – 6,134 324 – 8,789<br />
Additions – 92 – 11,455 1,414 – 54,105 67,066<br />
Reclassification – – – 23,982 – – (23,982) –<br />
Disposals / Write-offs (1) – – (2,097) (302) – – (2,400)<br />
Acquisition 37 16,831 – 8,280 384,415 1,074 24 36,632 447,256<br />
Balance at<br />
December 31, 2008 17,142 2,111 8,280 417,755 8,320 348 66,755 520,711<br />
Accumulated Depreciation<br />
and Impairment Losses<br />
Balance at January 1, 2008 15 1,534 – – 3,748 70 – 5,367<br />
Depreciation for the year 868 509 407 26,130 2,059 89 – 30,062<br />
Disposals / Write-offs – – – – (121) – – (121)<br />
Balance at<br />
December 31, 2008 883 2,043 407 26,130 5,686 159 – 35,308<br />
Carrying Amount<br />
At December 31, 2008 16,259 68 7,873 391,625 2,634 189 66,755 485,403<br />
6. PROPERTY, PLANT AND EQUIPMENT (cont’d)<br />
Furniture,<br />
fittings and<br />
Capital<br />
Leasehold Improvements office Motor work-inbuilding<br />
to premises equipment vehicles progress Total<br />
S$’000 S$’000 S$’000 S$’000 S$’000 S$’000<br />
Company<br />
Cost<br />
Balance at January 1, 2007 312 2,056 5,052 324 620 8,364<br />
Additions – 16 1,535 – – 1,551<br />
Reclassification – – 566 – (566) –<br />
Disposals / Write-offs – (53) (1,019) – (54) (1,126)<br />
Balance at December 31, 2007 312 2,019 6,134 324 – 8,789<br />
Accumulated Depreciation<br />
and Impairment Losses<br />
Balance at January 1, 2007 10 667 3,330 5 – 4,012<br />
Depreciation for the year 5 867 1,436 65 – 2,373<br />
Disposals / Write-offs – – (1,018) – – (1,018)<br />
Balance at December 31, 2007 15 1,534 3,748 70 – 5,367<br />
Carrying Amount<br />
At December 31, 2007 297 485 2,386 254 – 3,422<br />
Group<br />
i. Property, plant and equipment with the following net book values have been pledged to secure loan facilities<br />
granted to subsidiaries:<br />
Group<br />
2008 2007<br />
Freehold land and buildings 25,111 36,106<br />
Leasehold land and buildings 11,737 17,735<br />
Plant and machinery 756,964 891,907<br />
Capital work-in-progress 121,181 157,001<br />
Other assets 736 2,123<br />
915,729 1,104,872<br />
S$’000<br />
S$’000<br />
ii.<br />
Assets with net book value of S$1,587,000 (2007: S$1,403,000) were acquired under finance lease.<br />
iii. Included in the cost of leasehold land and buildings, quays and dry docks and plant and machinery are amounts<br />
of S$120,866,000, S$100,900,000 and S$667,000 respectively which were stated at valuation. The revaluation was<br />
done on a one-off basis prior to January 1, 1997.<br />
iv. During the year, interest and direct staff costs amounting to S$1,076,000 (2007: S$6,179,000) and S$1,849,000<br />
(2007: S$3,017,000), respectively were capitalised as capital work-in-progress.<br />
160 Delivering Essential Solutions <strong>Sembcorp</strong> Industries Annual Report 2008 161
Notes to the<br />
Financial Statements<br />
Year Ended December 31, 2008<br />
7. INVESTMENT PROPERTIES<br />
Group<br />
2008 2007<br />
Note S$’000 S$’000<br />
8. INVESTMENTS IN SUBSIDIARIES<br />
Company<br />
2008 2007<br />
S$’000<br />
S$’000<br />
Cost<br />
Balance at January 1 48,664 –<br />
Reclassification from property, plant and equipment on adoption of FRS 40 6 – 51,596<br />
Balance at January 1, restated 48,664 51,596<br />
Translation adjustments (3,939) (426)<br />
Additions – 10<br />
Reclassification to property, plant and equipment 6 – (682)<br />
Disposals (317) (1,834)<br />
Balance at December 31 44,408 48,664<br />
Accumulated Depreciation and Impairment Losses<br />
Balance at January 1 17,373 –<br />
Reclassification from property, plant and equipment on adoption of FRS 40 6 – 16,208<br />
Balance at January 1, restated 17,373 16,208<br />
Depreciation for the year 34(b) 1,007 610<br />
Allowance made for impairment – net 34(b) 69 555<br />
Balance at December 31 18,449 17,373<br />
Carrying Amount<br />
At December 31 25,959 31,291<br />
Investment properties with net book values of S$9,451,000 (2007: S$13,707,000) have been pledged to secure loan<br />
facilities granted to a subsidiary.<br />
The fair value of the investment properties as at the balance sheet date is S$51,900,000 (2007: S$65,989,000). The fair<br />
value, determined by independent professional valuers, is based on market values, being the estimated amount for<br />
which a property could be exchanged on the date of the valuation between a willing buyer and a willing seller in an<br />
arm’s length transaction after proper marketing wherein the parties had each acted knowledgeably, prudently and<br />
without compulsion.<br />
At cost and carrying value:<br />
Quoted equity shares 713,048 705,432<br />
Unquoted equity shares 503,951 502,951<br />
Preference shares 257,500 257,500<br />
Share-based payments reserve – effect of adopting INT FRS 108 12,071 13,557<br />
1,486,570 1,479,440<br />
Details of subsidiaries are set out in Note 47 to the financial statements.<br />
9. INTERESTS IN ASSOCIATES<br />
Group<br />
2008 2007<br />
Interests in associates 564,388 515,487<br />
The carrying value as at year end includes goodwill on acquisition as follows:<br />
S$’000<br />
Group<br />
S$’000<br />
2008 2007<br />
Balance at beginning of the year 55 –<br />
Additions – 55<br />
Balance at end of the year 55 55<br />
The fair value of the equity interest of a listed associate, with a carrying amount of S$204,426,000 (2007: S$202,902,000),<br />
amounts to S$69,247,000 (2007: S$562,631,000) based on the last transacted market price as at December 31, 2008<br />
(December 31, 2007).<br />
S$’000<br />
S$’000<br />
In the absence of current prices in an active market, the fair values are determined by considering the aggregate of<br />
the estimated cash flow expected to be received from renting out the properties. A yield that reflects the specific risks<br />
inherent in the cash flows then is applied to the net annual cash flows to obtain the fair values.<br />
Summarised financial information of associates is as follows:<br />
Group<br />
2008 2007<br />
S$’000<br />
S$’000<br />
Combined results<br />
Turnover 3,340,714 3,077,491<br />
Profit for the year 362,736 406,191<br />
Combined assets and liabilities<br />
Total assets 10,293,602 7,467,430<br />
Total liabilities 8,067,968 5,427,336<br />
The summarised financial information relating to associates disclosed above is not adjusted for the percentage of<br />
ownership held by the Group.<br />
162 Delivering Essential Solutions <strong>Sembcorp</strong> Industries Annual Report 2008 163
Notes to the<br />
Financial Statements<br />
Year Ended December 31, 2008<br />
9. INTERESTS IN ASSOCIATES (cont’d)<br />
The Group’s interest in an associate has been pledged to banks to secure credit facilities granted to the associate.<br />
At December 31, 2008, an associate of a subsidiary has net liability of S$407.3 million (2007: S$123.5 million). As the<br />
Group has provided guarantees to the banks in respect of the bank loans taken up by the associate, the Group has<br />
accordingly taken up its share of the net liability of the associate to the extent of the Group’s legal obligation of<br />
S$139.6 million (2007: S$49.3 million).<br />
The Group’s share of capital commitment of associates at balance sheet date was S$19,154,000 (2007: S$50,741,000).<br />
Details of the significant associates are set out in Note 48 to the financial statements.<br />
10. INTERESTS IN JOINT VENTURES<br />
Group<br />
2008 2007<br />
Interests in joint ventures 280,816 270,389<br />
The carrying value as at year end includes goodwill on acquisition as follows:<br />
S$’000<br />
Group<br />
S$’000<br />
2008 2007<br />
Balance at beginning of the year 2,074 7,570<br />
Translation during the year (155) 16<br />
Reclassified to assets held for sale (Note 21) – (5,512)<br />
Balance at end of the year 1,919 2,074<br />
Summarised financial information of joint ventures, representing the Group’s share, is as follows:<br />
S$’000<br />
Group’s share<br />
S$’000<br />
2008 2007<br />
Combined results<br />
Turnover 330,568 371,984<br />
Expenses (281,350) (307,298)<br />
Profit before income tax 49,218 64,686<br />
Income tax expense (3,994) (3,872)<br />
Impairment of goodwill – (4,471)<br />
Profit for the year 45,224 56,343<br />
S$’000<br />
S$’000<br />
10. INTERESTS IN JOINT VENTURES (cont’d)<br />
The Group’s interest in a joint venture with a carrying amount of S$50,088,000 (2007: S$64,837,000) as at the balance<br />
sheet date has been pledged to banks to secure credit facilities granted to the joint venture entity.<br />
Details of significant joint ventures are set out in Note 48 to the financial statements.<br />
11. OTHER <strong>FINANCIAL</strong> ASSETS<br />
Group<br />
2008 2007<br />
Note S$’000 S$’000<br />
a. Non-current Assets<br />
Available-for-sale financial assets:<br />
– Equity shares 143,169 694,242<br />
– Unit trusts and funds 2,878 6,775<br />
146,047 701,017<br />
Financial assets at fair value through profit or loss:<br />
– Forward foreign exchange contracts – 206<br />
– Equity shares 33 69<br />
Cash flow hedges:<br />
– Interest rate swaps – 828<br />
– Fuel oil swaps – 6,114<br />
146,080 708,234<br />
b. Current Assets<br />
Financial assets at fair value through profit or loss:<br />
– Interest rate swaps – 800<br />
– Forward foreign exchange contracts 52 12,853<br />
– Foreign exchange swap contracts 2,386 541<br />
– Others 1 96<br />
Cash flow hedges:<br />
– Interest rate swaps – 2,481<br />
– Forward foreign exchange contracts 1,823 908<br />
– Fuel oil swaps – 49,970<br />
– Forward electricity sale 25,507 –<br />
19 29,769 67,649<br />
Combined assets and liabilities<br />
Non-current assets 456,958 389,508<br />
Current assets 327,449 232,649<br />
Current liabilities (210,825) (119,769)<br />
Non-current liabilities (310,525) (234,073)<br />
Minority interest (836) –<br />
Net assets 262,221 268,315<br />
Capital commitments 12,394 1,645<br />
164 Delivering Essential Solutions <strong>Sembcorp</strong> Industries Annual Report 2008 165
Notes to the<br />
Financial Statements<br />
Year Ended December 31, 2008<br />
12. LONG-TERM RECEIVABLES AND PREPAYMENTS<br />
Group<br />
Company<br />
2008 2007 2008 2007<br />
Note S$’000 S$’000 S$’000 S$’000<br />
13. TRADE RECEIVABLES<br />
Group<br />
Company<br />
2008 2007 2008 2007<br />
Note S$’000 S$’000 S$’000 S$’000<br />
Long-term trade receivables 13 1,968 984 – –<br />
Service concession receivables (a) 167,146 – – –<br />
Finance lease receivables due after 12 months 14 18,025 21,400 – –<br />
Loan receivables (unsecured) – 2,656 – –<br />
Amount due from related parties 15 21,099 1,310 – –<br />
Prepayments (b) 22,922 25,870 940 –<br />
Staff loans 233 – – –<br />
Recoverables 8 8 – –<br />
231,401 52,228 940 –<br />
Allowance for doubtful loan receivables – (2,656) – –<br />
231,401 49,572 940 –<br />
a. Service concession receivables<br />
This relates to a 25-year agreement between a subsidiary and PUB (grantor) to design, build, own and operate a<br />
NEWater plant. The construction of the new plant started in April 2008 and will treat and convert feedwater to<br />
NEWater starting from May 2010. At the end of the concession period, the subsidiary will transfer the plant to the<br />
grantor. This arrangement falls within the scope of INT FRS 112.<br />
Under the terms of the agreement, the subsidiary will receive a minimum guarantee sum from the grantor in<br />
exchange for services performed. The subsidiary recognises this service concession receivable as it has a contractual<br />
right under the concession arrangement. The financial receivable is measured on initial recognition at its fair value.<br />
b. Prepayments<br />
Prepayments relate primarily to:<br />
Group<br />
i. Connection fees prepaid under the Generation Connection and Use of System Agreement for the use of the<br />
transmission lines; and<br />
ii.<br />
Service fees prepaid under the Gasoil Supply and Storage Agreement for the usage of the tank.<br />
Company<br />
i. Prepayments relate to connection and capacity charges prepaid for the use of pipelines and piperacks.<br />
ii.<br />
Prepayments are charged to the income statement on a straight-line basis over the period of prepayments.<br />
Trade receivables including work completed<br />
but unbilled 596,024 661,138 15,280 –<br />
Allowance for doubtful receivables (16,740) (15,171) – –<br />
579,284 645,967 15,280 –<br />
Trade receivables due within 1 year 19 (577,316) (644,983) (15,280) –<br />
12 1,968 984 – –<br />
Included in trade receivables of the Group are retention monies on contracts amounting to S$755,000 (2007:<br />
S$1,235,602).<br />
14. FINANCE LEASE RECEIVABLES<br />
Minimum Estimated Total gross Unearned Net value<br />
lease residual investment interest of lease<br />
payment value in lease income receivables<br />
Note S$’000 S$’000 S$’000 S$’000 S$’000<br />
Group<br />
2008<br />
Within 1 year 4,218 – 4,218 (844) 3,374<br />
After 1 year but within 5 years 16,875 3,000 19,875 (1,850) 18,025<br />
21,093 3,000 24,093 (2,694) 21,399<br />
Amount due within 1 year 19 (4,218) – (4,218) 844 (3,374)<br />
12 16,875 3,000 19,875 (1,850) 18,025<br />
2007<br />
Within 1 year 16,875 1,500 18,375 (2,824) 15,551<br />
After 1 year but within 5 years 16,875 – 16,875 (2,474) 14,401<br />
After 5 years 4,219 3,000 7,219 (220) 6,999<br />
37,969 4,500 42,469 (5,518) 36,951<br />
Amount due within 1 year 19 (16,875) (1,500) (18,375) 2,824 (15,551)<br />
12 21,094 3,000 24,094 (2,694) 21,400<br />
Under the terms of the lease agreements, no contingent rents are recognised. These lease receivables relate mainly to<br />
leases of marine vessels, whereby the lessees have the option to purchase the marine vessels during the term of the<br />
leases.<br />
166 Delivering Essential Solutions <strong>Sembcorp</strong> Industries Annual Report 2008 167
Notes to the<br />
Financial Statements<br />
Year Ended December 31, 2008<br />
15. AMOUNTS DUE FROM RELATED PARTIES<br />
Minority shareholders<br />
Associates Joint ventures of subsidiaries Total<br />
16. INTANGIBLE ASSETS<br />
Goodwill Others Total<br />
Note S$’000 S$’000 S$’000<br />
2008 2007 2008 2007 2008 2007 2008 2007<br />
Note S$’000 S$’000 S$’000 S$’000 S$’000 S$’000 S$’000 S$’000<br />
Group<br />
Amounts due from:<br />
Trade 9,124 13,289 1,685 4,731 – 41 10,809 18,061<br />
Non-trade 2,811 7,053 13,927 14,041 – 2 16,738 21,096<br />
Loans 5,887 11,851 20,816 1,027 – – 26,703 12,878<br />
17,822 32,193 36,428 19,799 – 43 54,250 52,035<br />
Allowance for<br />
doubtful receivables (13,827) (18,339) (13,219) (13,225) – – (27,046) (31,564)<br />
3,995 13,854 23,209 6,574 – 43 27,204 20,471<br />
Amount due within 1 year 19 (3,712) (13,571) (2,393) (5,547) – (43) (6,105) (19,161)<br />
12 283 283 20,816 1,027 – – 21,099 1,310<br />
The long-term loans to associates and joint ventures are unsecured and not expected to be repaid in the next 12 months.<br />
Subsidiaries Associates Joint Ventures Total<br />
2008 2007 2008 2007 2008 2007 2008 2007<br />
Note S$’000 S$’000 S$’000 S$’000 S$’000 S$’000 S$’000 S$’000<br />
Company<br />
Amounts due from<br />
related parties 8,333 21,424 190 – 581 9 9,104 21,433<br />
Allowance for<br />
doubtful receivables (187) – – – – – (187) –<br />
19 8,146 21,424 190 – 581 9 8,917 21,433<br />
The amounts due from subsidiaries are unsecured, repayable on demand and interest-free, except for an amount of<br />
S$178,000 (2007: S$535,000) which bears an effective interest rate of 2.17% per annum (2007: 4.45% per annum).<br />
Group<br />
Cost<br />
Balance at January 1, 2008 105,440 8,163 113,603<br />
Translation adjustments 47 213 260<br />
Additions 4,573 1,865 6,438<br />
Disposal of subsidiaries – (1,668) (1,668)<br />
Write-offs 34(b) – (283) (283)<br />
Balance at December 31, 2008 110,060 8,290 118,350<br />
Accumulated Amortisation and Impairment Losses<br />
Balance at January 1, 2008 110 3,983 4,093<br />
Translation adjustments – 47 47<br />
Amortisation charge for the year 34(b) – 102 102<br />
Disposal of subsidiaries – (480) (480)<br />
Write-offs 34(b) – (183) (183)<br />
Balance at December 31, 2008 110 3,469 3,579<br />
Carrying Amount<br />
At December 31, 2008 109,950 4,821 114,771<br />
Cost<br />
Balance at January 1, 2007 107,222 4,582 111,804<br />
Translation adjustments (13) (60) (73)<br />
Additions 1,738 1,033 2,771<br />
Reclassification (to) / from other categories of assets (3,507) 2,611 (896)<br />
Write-offs 34(b) – (3) (3)<br />
Balance at December 31, 2007 105,440 8,163 113,603<br />
Accumulated Amortisation<br />
and Impairment Losses<br />
Balance at January 1, 2007 – 1,892 1,892<br />
Translation adjustments – (27) (27)<br />
Amortisation charge for the year 34(b) – 2,118 2,118<br />
Allowance for impairment loss 34(b) 110 – 110<br />
Balance at December 31, 2007 110 3,983 4,093<br />
Carrying Amount<br />
At December 31, 2007 105,330 4,180 109,510<br />
168 Delivering Essential Solutions <strong>Sembcorp</strong> Industries Annual Report 2008 169
Notes to the<br />
Financial Statements<br />
Year Ended December 31, 2008<br />
16. INTANGIBLE ASSETS (cont’d)<br />
At Jan 1, 2007<br />
and Dec 31, 2007 Acquisition At Dec 31, 2008<br />
Note S$’000 S$’000 S$’000<br />
Company<br />
2007 & 2008<br />
Corporate club membership 90 – 90<br />
Goodwill 37 – 18,946 18,946<br />
Total 90 18,946 19,036<br />
The Company’s goodwill relates to goodwill of SUT on the acquisition of the SUT Division during the year.<br />
Impairment Testing for Goodwill<br />
For the purpose of impairment testing, goodwill is allocated to the Group’s operating divisions which represent the<br />
lowest level within the Group at which the goodwill is monitored for internal management purposes.<br />
The aggregate carrying amounts of goodwill allocated to each unit are as follows:<br />
Group<br />
2008 2007<br />
Note S$’000 S$’000<br />
Cash-Generating Unit (“CGU”)<br />
SUT Division (a) 18,946 18,946<br />
<strong>Sembcorp</strong> Cogen Pte Ltd (b) 26,378 26,378<br />
<strong>Sembcorp</strong> Gas Pte Ltd (c) 41,986 41,986<br />
SembRamky Environmental Management Private Limited (d) 4,394 4,394<br />
Multiple units of insignificant goodwill 18,246 13,626<br />
109,950 105,330<br />
The recoverable amounts are determined based on calculations of the value-in-use. These calculations use cash flow<br />
projections from years 2009 to 2017, of which the projections for the first five years are based on financial budgets<br />
/ forecasts approved by management and that for the remaining years are based on the same cash flow since 2013.<br />
Management has applied past experience in operating the business to forecast the performance and believes that this<br />
cash flow projection period was justified in consideration of the long-term nature of CGUs’ businesses. Zero terminal<br />
value is assumed and discount rates ranging from 5.74% to 6.00% have been used. At the balance sheet date, based<br />
on the following key assumptions, management believes that the recoverable amounts exceed their carrying amounts.<br />
a. SUT Division<br />
i. Market demand and supply for industrial utilities and services are updated for changes during the year;<br />
ii. Cash flows beyond the budget period are estimated based on the long-term offtake contracts with its existing<br />
customers in the captive market in which it operates.<br />
b. <strong>Sembcorp</strong> Cogen Pte Ltd<br />
i. Demand and supply for electricity and electricity spark spread are updated for changes in market conditions;<br />
ii.<br />
Required plant maintenance and associated maintenance cost have been accounted for in the forecast of the<br />
plant’s gross profit;<br />
iii. Expected capital expenditure for replenishment of parts has been included in the forecast in accordance with<br />
the plant maintenance programme; and<br />
16. INTANGIBLE ASSETS (cont’d)<br />
Impairment Testing for Goodwill (cont’d)<br />
b. <strong>Sembcorp</strong> Cogen Pte Ltd (cont’d)<br />
iv. Cash flows beyond the budget period are estimated based on plant availability and load factors as well as<br />
changes in operating costs due to normal wear and tear, maintenance cycles and inflation.<br />
c. <strong>Sembcorp</strong> Gas Pte Ltd<br />
i. Depreciating USD / SGD exchange rate and High Sulphur Fuel Oil (“HSFO”) prices compared to prior year;<br />
ii.<br />
Gross profit margin is expected to remain stable as the pricing of both customer and supplier contracts are<br />
pegged to the HSFO prices;<br />
iii. Expected capital expenditure for plant refurbishment has been included in the forecast in accordance with the<br />
plant maintenance programme; and<br />
iv. Cash flows beyond the budget period are estimated based on the contracted sales and purchase quantities of<br />
gas over the remaining period of the existing contracts with the major customers and the gas supplier.<br />
d. SembRamky Environmental Management Private Limited<br />
These calculations use cash flow projections based on management’s 5-year financial forecast of the company.<br />
The forecasted revenue and operating expenses are based on past performance and its expectation of market<br />
development.<br />
17. DEFERRED TAX ASSETS AND LIABILITIES<br />
Movements in deferred tax assets and liabilities (prior to offsetting of balances) during the year are as follows:<br />
Recognised in<br />
income<br />
statement Recognised Translation<br />
At Jan 1, 2008 (Note 33) in equity adjustments At Dec 31, 2008<br />
S$’000 S$’000 S$’000 S$’000 S$’000<br />
Group<br />
2008<br />
Deferred tax liabilities<br />
Property, plant and equipment 260,322 48,094 – (32,458) 275,958<br />
Interest in associates 5,091 963 – – 6,054<br />
Other financial assets 116,439 625 (62,843) (1,922) 52,299<br />
Trade and other receivables 277 60 – – 337<br />
Other items 7,723 1,304 – (2,106) 6,921<br />
Total 389,852 51,046 (62,843) (36,486) 341,569<br />
Deferred tax assets<br />
Property, plant and equipment (3,508) 157 – 3,030 (321)<br />
Inventories (22) – – – (22)<br />
Trade receivables (282) (1,317) – – (1,599)<br />
Trade and other payables (528) (125) – – (653)<br />
Tax losses (1,162) 555 – (40) (647)<br />
Provisions (15,318) (2,860) – 5,095 (13,083)<br />
Other items (21,288) 1,345 (68,343) (215) (88,501)<br />
Total (42,108) (2,245) (68,343) 7,870 (104,826)<br />
170 Delivering Essential Solutions <strong>Sembcorp</strong> Industries Annual Report 2008 171
Notes to the<br />
Financial Statements<br />
Year Ended December 31, 2008<br />
17. DEFERRED TAX ASSETS AND LIABILITIES (cont’d)<br />
Recognised<br />
in income Acquisition /<br />
statement Recognised (disposal) Translation<br />
At Jan 1, 2007 (Note 33) in equity of subsidiary adjustments At Dec 31, 2007<br />
S$’000 S$’000 S$’000 S$’000 S$’000 S$’000<br />
17. DEFERRED TAX ASSETS AND LIABILITIES (cont’d)<br />
Deferred tax assets have not been recognised in respect of the following items:<br />
Group<br />
2008 2007<br />
S$’000<br />
S$’000<br />
Group<br />
2007<br />
Deferred tax liabilities<br />
Property, plant and equipment 241,546 21,649 – 812 (3,685) 260,322<br />
Interest in associates 1,948 3,143 – – – 5,091<br />
Other financial assets 48,699 – 67,766 – (26) 116,439<br />
Trade and other receivables 1,852 (1,575) – – – 277<br />
Other items 5,290 4,316 (1,702) – (181) 7,723<br />
Total 299,335 27,533 66,064 812 (3,892) 389,852<br />
Deferred tax assets<br />
Property, plant and equipment (3,884) 376 – – – (3,508)<br />
Inventories (10) (12) – – – (22)<br />
Trade receivables (917) 635 – – – (282)<br />
Trade and other payables – (528) – – – (528)<br />
Tax losses (2,619) 1,460 – – (3) (1,162)<br />
Provisions (14,268) (1,466) – – 416 (15,318)<br />
Other items (20,019) 1,279 (2,660) – 112 (21,288)<br />
Total (41,717) 1,744 (2,660) – 525 (42,108)<br />
Recognised<br />
Recognised<br />
in income in income Acquisition<br />
At Jan 1, 2007 statement At Dec 31, 2007 statement (Note 37) At Dec 31, 2008<br />
S$’000 S$’000 S$’000 S$’000 S$’000 S$’000<br />
Company<br />
2007 & 2008<br />
Deferred tax liabilities<br />
Property, plant and equipment 195 – 195 5,809 44,667 50,671<br />
Total 195 – 195 5,809 44,667 50,671<br />
Deferred tax liabilities and assets are set off when there is a legally enforceable right to set off current tax assets against<br />
current tax liabilities and when the deferred taxes relate to the same taxation authority. The amounts determined after<br />
appropriate offsetting included in the balance sheet are as follows:<br />
Group<br />
Company<br />
2008 2007 2008 2007<br />
S$’000 S$’000 S$’000 S$’000<br />
Deferred tax liabilities 271,960 385,567 50,671 195<br />
Deferred tax assets (35,217) (37,823) – –<br />
236,743 347,744 50,671 195<br />
Deductible temporary differences 33,715 18,644<br />
Tax losses 35,874 41,319<br />
Capital allowances 27,368 24,413<br />
96,957 84,376<br />
Of the above tax losses, tax losses of the Group amounting to S$4,312,000 (2007: S$20,518,000) will expire between<br />
2009 and 2011 (2007: 2008 and 2012). The deductible temporary differences and capital allowances do not expire<br />
under current tax legislation.<br />
Deferred tax assets have not been recognised under the following circumstances:<br />
a. Where they are qualified for offset against the tax liabilities of member companies within the Group under the<br />
Loss Transfer System of Group Relief but the terms of the transfer have not been ascertained as at year end; and<br />
b. Where it is uncertain that future taxable profit will be available against which the Group can utilise the benefits.<br />
18. INVENTORIES AND WORK-IN-PROGRESS<br />
Group<br />
Company<br />
2008 2007 2008 2007<br />
Note S$’000 S$’000 S$’000 S$’000<br />
Raw materials 97,768 72,532 4,582 –<br />
Finished goods 69,488 41,417 4,771 –<br />
167,256 113,949 9,353 –<br />
Allowance for inventory obsolescence (8,370) (7,286) – –<br />
158,886 106,663 9,353 –<br />
Work-in-progress (a) 790,960 1,550,384 – –<br />
949,846 1,657,047 9,353 –<br />
a. Work-in-progress:<br />
Costs and attributable profits 3,651,155 5,149,233 1,343 –<br />
Allowance for foreseeable losses (4,254) (1,297) – –<br />
3,646,901 5,147,936 1,343 –<br />
Progress billings (3,830,974) (4,166,293) (1,343) –<br />
(184,073) 981,643 – –<br />
Comprising:<br />
Work-in-progress 790,960 1,550,384 – –<br />
Excess of progress billings over work-in-progress (975,033) (568,741) – –<br />
(184,073) 981,643 – –<br />
172 Delivering Essential Solutions <strong>Sembcorp</strong> Industries Annual Report 2008 173
Notes to the<br />
Financial Statements<br />
Year Ended December 31, 2008<br />
19. TRADE AND OTHER RECEIVABLES<br />
Group<br />
Company<br />
2008 2007 2008 2007<br />
Note S$’000 S$’000 S$’000 S$’000<br />
23. TRADE AND OTHER PAYABLES<br />
Group<br />
Company<br />
2008 2007 2008 2007<br />
Note S$’000 S$’000 S$’000 S$’000<br />
Trade receivables 13 577,316 644,983 15,280 –<br />
Current portion of finance lease 14 3,374 15,551 – –<br />
Amount due from related parties 15 6,105 19,161 8,917 21,433<br />
Other receivables, deposits and prepayments 20 595,385 655,267 193,182 176,877<br />
Other financial assets 11 29,769 67,649 – –<br />
Advance to suppliers 7,152 2,085 – –<br />
1,219,101 1,404,696 217,379 198,310<br />
20. OTHER RECEIVABLES, DEPOSITS AND PREPAYMENTS<br />
Group<br />
Company<br />
2008 2007 2008 2007<br />
Note S$’000 S$’000 S$’000 S$’000<br />
Deposits 7,356 5,789 1,124 671<br />
Prepayments 34,196 46,124 2,391 542<br />
Tax recoverable 259,896 214,991 175,394 174,984<br />
Sundry receivables 81,761 67,834 467 740<br />
Unbilled receivables 207,593 287,539 13,294 –<br />
Loan receivables 7,234 21,079 – –<br />
Recoverable 6,300 19,660 572 –<br />
Interest receivable 601 845 – –<br />
604,937 663,861 193,242 176,937<br />
Allowance for doubtful receivables (9,552) (8,594) (60) (60)<br />
19 595,385 655,267 193,182 176,877<br />
Unbilled receivables represent revenue accrued for sale of utilities services, electricity, gas and other related products.<br />
21. ASSETS HELD FOR SALE<br />
The assets held for sale in 2007 include interests in joint ventures. At the end of 2007, a wholly-owned subsidiary entered<br />
into a sales agreement for the sale of certain joint ventures. The sale was completed in June 2008 by the subsidiary.<br />
22. CASH AND CASH EQUIVALENTS<br />
Group<br />
Company<br />
2008 2007 2008 2007<br />
Note S$’000 S$’000 S$’000 S$’000<br />
Bank balances, fixed deposits and cash 2,400,954 1,296,892 45,541 189,470<br />
Bank overdrafts 29 – (889) – –<br />
Cash and cash equivalents in<br />
the consolidated cash flow statement 2,400,954 1,296,003 45,541 189,470<br />
Included in the Group’s cash and cash equivalents at the balance sheet date are amounts of S$7.5 million (2007: S$13.5<br />
million) held in countries with foreign exchange control restrictions.<br />
Trade payables 1,500,869 1,302,592 3,264 –<br />
Advance payments from customers 36,673 27,667 555 –<br />
Other financial liabilities 24 166,738 28,941 – –<br />
Amount due to related parties 25 10,248 18,399 232,086 215,227<br />
Other payables and accrued charges 26 906,906 864,828 80,629 33,956<br />
2,621,434 2,242,427 316,534 249,183<br />
24. OTHER <strong>FINANCIAL</strong> LIABILITIES<br />
Group<br />
2008 2007<br />
Note S$’000 S$’000<br />
a. Current Liabilities<br />
Financial liabilities at fair value through profit or loss:<br />
– Interest rate swaps 1,001 1,457<br />
– Forward foreign exchange contracts 127 34<br />
– Foreign exchange swap contracts 2,454 82<br />
– Commodity contracts 44 1,006<br />
Cash flow hedges:<br />
– Interest rate swaps 6,703 184<br />
– Forward foreign exchange contracts 72,530 6,453<br />
– Foreign exchange swap contracts 1,261 –<br />
– Fuel oil swap contracts 82,618 188<br />
– Forward electricity sale – 19,537<br />
23 166,738 28,941<br />
b. Non-current Liabilities<br />
Cash flow hedges:<br />
– Interest rate swaps 10,913 1,192<br />
– Forward foreign exchange contracts 50,506 1,079<br />
– Fuel oil swap contracts 3,669 –<br />
30 65,088 2,271<br />
25. AMOUNTS DUE TO RELATED PARTIES<br />
Minority shareholders<br />
Associates Joint ventures of subsidiaries Total<br />
2008 2007 2008 2007 2008 2007 2008 2007<br />
Note S$’000 S$’000 S$’000 S$’000 S$’000 S$’000 S$’000 S$’000<br />
Group<br />
Amounts due to:<br />
Trade – 4,762 2,034 3,591 312 244 2,346 8,597<br />
Non-trade 1,604 3,045 5,364 5,329 – 492 6,968 8,866<br />
Loans – – – – 8,585 5,420 8,585 5,420<br />
1,604 7,807 7,398 8,920 8,897 6,156 17,899 22,883<br />
Amounts due after 1 year 30 – – – – (7,651) (4,484) (7,651) (4,484)<br />
23 1,604 7,807 7,398 8,920 1,246 1,672 10,248 18,399<br />
174 Delivering Essential Solutions <strong>Sembcorp</strong> Industries Annual Report 2008 175
Notes to the<br />
Financial Statements<br />
Year Ended December 31, 2008<br />
25. AMOUNTS DUE TO RELATED PARTIES (cont’d)<br />
Loans from minority shareholders of subsidiaries of S$7,651,000 (2007: S$4,484,000) bear interest at rates ranging from<br />
3.53% to 7.02% (2007: 3.53%) per annum and are unsecured and repayable from 2011 to 2014.<br />
The remaining non-trade amounts and loans due to related parties are unsecured, interest-free and repayable on demand.<br />
Subsidiaries Associates Total<br />
2008 2007 2008 2007 2008 2007<br />
Note S$’000 S$’000 S$’000 S$’000 S$’000 S$’000<br />
Company<br />
Amounts due to related parties (i) 25,888 25,223 – 4 25,888 25,227<br />
Loan from a related party (ii) 664,932 190,000 – – 664,932 190,000<br />
690,820 215,223 – 4 690,820 215,227<br />
Amounts due after 1 year 30 (458,734) – – – (458,734) –<br />
23 232,086 215,223 – 4 232,086 215,227<br />
i. The amounts due to related parties are unsecured, interest-free and repayable on demand.<br />
ii.<br />
The loans from a related party comprise:<br />
a. S$206,000,000 (2007: S$190,000,000) which are unsecured, repayable on demand and bear an effective interest<br />
rate of 1.23% (2007: 2.59%) per annum.<br />
b. S$458,700,000 (2007: S$Nil) which are unsecured, repayable on December 31, 2013 and bear an effective<br />
interest rate of 2.48% (2007: Nil) per annum.<br />
26. OTHER PAYABLES AND ACCRUED CHARGES<br />
Group<br />
Company<br />
2008 2007 2008 2007<br />
Note S$’000 S$’000 S$’000 S$’000<br />
Accrued operating expenses 675,400 729,196 75,366 29,794<br />
Deposits 14,204 13,554 – –<br />
Accrued interest payable 5,374 7,401 – 441<br />
Other payables 72,348 114,677 5,263 3,721<br />
Share of net liability of an associate 9 139,580 – – –<br />
23 906,906 864,828 80,629 33,956<br />
27. PROVISIONS<br />
Obligations<br />
relating to<br />
Loan disposal of Onerous Restoration<br />
undertakings business Claims contracts costs Warranty Others Total<br />
S$’000 S$’000 S$’000 S$’000 S$’000 S$’000 S$’000 S$’000<br />
Group<br />
Balance at beginning of the year 9,167 11,454 4,238 8,680 5,309 2,800 184 41,832<br />
Translation adjustments – – – – (2) 132 – 130<br />
Provisions made / (written back)<br />
during the year, net 2,217 – (3,016) – 1,200 29,136 – 29,537<br />
Provisions utilised during the year (1,645) – – (1,500) – (7,350) – (10,495)<br />
Reclassification – – – – – 13,003 – 13,003<br />
Balance at end of the year 9,739 11,454 1,222 7,180 6,507 37,721 184 74,007<br />
Provisions due:<br />
– within 1 year 9,739 11,454 1,222 3,433 – 37,721 184 63,753<br />
– after 1 year – – – 3,747 6,507 – – 10,254<br />
9,739 11,454 1,222 7,180 6,507 37,721 184 74,007<br />
Obligations<br />
relating to<br />
disposal of<br />
Restoration<br />
business Claims costs Total<br />
Note S$’000 S$’000 S$’000 S$’000<br />
Company<br />
Balance at beginning of the year 11,454 – 500 11,954<br />
Acquisition 37 – 3,780 – 3,780<br />
Provisions written back during the year, net – (2,559) – (2,559)<br />
Balance at end of the year 11,454 1,221 500 13,175<br />
Provisions due:<br />
– within 1 year 11,454 1,221 – 12,675<br />
– after 1 year – – 500 500<br />
11,454 1,221 500 13,175<br />
Loan Undertakings<br />
This relates to the Group’s share of loan undertakings of associates and subsidiaries.<br />
Obligations Relating to Disposal of Business<br />
This mainly relates to the disposal of business in which the Group and the Company retains certain obligations in<br />
respect of contracts pursuant to the Sale and Purchase Agreement.<br />
Onerous Contracts<br />
The provision for onerous contracts relates to the Group’s exposure to the unavoidable cost of meeting its obligations<br />
under the contracts, which exceeds the expected benefits to be derived by the Group. The provision is measured at the<br />
present value of the lower of the expected cost of terminating the contract and the expected net cost of continuing<br />
with the contract. Before a provision is established, the Group recognises any impairment loss on the assets associated<br />
with the contracts.<br />
176 Delivering Essential Solutions <strong>Sembcorp</strong> Industries Annual Report 2008 177
Notes to the<br />
Financial Statements<br />
Year Ended December 31, 2008<br />
27. PROVISIONS (cont’d)<br />
Restoration Costs<br />
Restoration costs relating to cost of dismantling and removing assets and restoring the premises to its original condition<br />
as stipulated in the operating lease agreements. The subsidiaries expect to incur the liability upon termination of the<br />
lease.<br />
Warranty<br />
The provision for warranty is based on estimates made from historical warranty data associated with similar projects.<br />
28. RETIREMENT BENEFIT OBLIGATIONS<br />
Group<br />
2008 2007<br />
Note S$’000 S$’000<br />
Provision for retirement gratuities (a) 1,932 2,809<br />
Defined benefit obligations (b) 11,620 21,300<br />
13,552 24,109<br />
Non-current 13,552 24,109<br />
a. Provision for Retirement Gratuities<br />
Group<br />
2008 2007<br />
Balance at beginning of the year 2,809 3,303<br />
Provision utilised during the year (407) (494)<br />
Less: Amount due within 12 months (470) –<br />
Balance at end of the year 1,932 2,809<br />
b. Defined Benefit Obligations<br />
The defined benefit plan and the related costs are assessed in accordance with the advice of professionally qualified<br />
actuaries. The pension scheme is funded by the payment of contributions to separately administered trust funds.<br />
Details of the plans are as follows:<br />
S$’000<br />
Group<br />
S$’000<br />
2008 2007<br />
Present value of funded obligations 151,053 244,774<br />
Fair value of plan assets (158,761) (253,504)<br />
Surplus in the plan (7,708) (8,730)<br />
Actuarial gains not recognised in accordance with FRS 19 19,328 30,030<br />
Net liability recognised in the balance sheet 11,620 21,300<br />
S$’000<br />
S$’000<br />
28. RETIREMENT BENEFIT OBLIGATIONS (cont’d)<br />
b. Defined Benefit Obligations (cont’d)<br />
The proportion of fair value of plan assets at the balance sheet is analysed as follows:<br />
Group<br />
2008 2007<br />
% %<br />
Equity instruments 40.08 52.79<br />
Debt instruments 53.45 39.83<br />
Other assets 6.47 7.38<br />
100.00 100.00<br />
The plan assets do not include any of the Group’s own financial instruments, nor any property occupied by, or other<br />
assets used by the Group.<br />
Changes in the present value of defined benefit obligations are as follows:<br />
Group<br />
2008 2007<br />
Opening defined benefit obligations 244,774 259,498<br />
Translation adjustments (65,871) (7,458)<br />
Current service costs 3,302 4,338<br />
Interest cost 12,465 13,247<br />
Actuarial gains (36,223) (22,115)<br />
Benefits paid (7,630) (2,946)<br />
Employee contributions 236 210<br />
151,053 244,774<br />
Changes in the present value of plan assets are as follows:<br />
S$’000<br />
Group<br />
S$’000<br />
2008 2007<br />
Opening fair value of plan assets 253,504 239,537<br />
Translation adjustments (69,135) (7,603)<br />
Expected return on plan assets 14,268 16,473<br />
Actuarial (losses) / gains (38,322) 676<br />
Contributions by employer 5,840 7,157<br />
Benefits paid (7,630) (2,946)<br />
Employee contributions 236 210<br />
158,761 253,504<br />
S$’000<br />
S$’000<br />
178 Delivering Essential Solutions <strong>Sembcorp</strong> Industries Annual Report 2008 179
Notes to the<br />
Financial Statements<br />
Year Ended December 31, 2008<br />
28. RETIREMENT BENEFIT OBLIGATIONS (cont’d)<br />
b. Defined Benefit Obligations (cont’d)<br />
Expenses recognised in the income statement are as follows:<br />
Group<br />
2008 2007<br />
S$’000<br />
S$’000<br />
28. RETIREMENT BENEFIT OBLIGATIONS (cont’d)<br />
b. Defined Benefit Obligations (cont’d)<br />
Principal actuarial assumptions (cont’d)<br />
The history of existing plans as of December 31 is as follows:<br />
2008 2007 2006 2005 2004 2003<br />
S$’000 S$’000 S$’000 S$’000 S$’000 S$’000<br />
Current service costs 3,302 4,338<br />
Interest costs 12,465 13,247<br />
Expected return on plan assets (14,268) (16,473)<br />
Actuarial losses (320) –<br />
1,179 1,112<br />
The expense is recognised in the following line items in the income statement:<br />
Group<br />
2008 2007<br />
Cost of sales 2,642 3,469<br />
Administrative expenses 660 869<br />
Other expenses (2,123) (3,226)<br />
1,179 1,112<br />
Actual (loss) / return in value of plan assets (24,054) 17,149<br />
Principal actuarial assumptions<br />
Principal actuarial assumptions at the balance sheet date are as follows:<br />
S$’000<br />
Group<br />
S$’000<br />
2008 2007<br />
% %<br />
Group<br />
Present value of<br />
funded obligations 151,053 244,774 259,498 259,598 224,690 180,838<br />
Fair value of plan assets (158,761) (253,504) (239,537) (201,898) (166,914) (136,778)<br />
(Surplus) / Deficit in the plan (7,708) (8,730) 19,961 57,700 57,776 44,060<br />
The Group expects to pay S$4,700,000 in contributions to defined benefit plans in 2009.<br />
29. INTEREST-BEARING BORROWINGS<br />
Group<br />
Company<br />
2008 2007 2008 2007<br />
Note S$’000 S$’000 S$’000 S$’000<br />
Current liabilities<br />
Bank overdrafts 22 – 889 – –<br />
Secured term loans (a) 81,750 101,442 – –<br />
Unsecured term loans (b) 202,613 406,615 – 150,000<br />
Finance lease liabilities (c) 1,405 1,248 – –<br />
285,768 510,194 – 150,000<br />
Non-current liabilities<br />
Secured term loans (a) 319,740 470,997 – –<br />
Unsecured term loans (b) 200,000 350,773 – –<br />
Finance lease liabilities (c) 2,810 1,716 – –<br />
522,550 823,486 – –<br />
808,318 1,333,680 – 150,000<br />
Discount rate at December 31 6.2 5.8<br />
Expected return on plan assets at December 31 5.6 6.4<br />
Future rate of annual salary increases 4.3 4.7<br />
Future rate of pension increases 2.0 3.2<br />
Maturity of liabilities (excluding finance lease liabilities)<br />
Group<br />
Company<br />
2008 2007 2008 2007<br />
S$’000 S$’000 S$’000 S$’000<br />
Past service cost and net actuarial results are amortised over the estimated service life of the employees under plan<br />
benefits. The estimated service life for pension plans is 9 years (2007: 13 years).<br />
Assumptions regarding future mortality are based on published statistics and mortality tables. The expected life<br />
expectancy of an individual retiring at age 65 is 21 (2007: 21) for male and 23 (2007: 23) for female.<br />
Within 1 year 284,363 508,946 – 150,000<br />
After 1 year but within 5 years 432,164 641,784 – –<br />
After 5 years 87,576 179,986 – –<br />
Total borrowings 804,103 1,330,716 – 150,000<br />
180 Delivering Essential Solutions <strong>Sembcorp</strong> Industries Annual Report 2008 181
Notes to the<br />
Financial Statements<br />
Year Ended December 31, 2008<br />
29. INTEREST-BEARING BORROWINGS (cont’d)<br />
a. Secured Term Loans<br />
The secured loans are collaterised by the following assets:<br />
29. INTEREST-BEARING BORROWINGS (cont’d)<br />
c. Finance Lease Liabilities<br />
The Group has obligations under finance leases that are payable as follows:<br />
Group<br />
Net Book Value<br />
2008 2007<br />
Property, plant and equipment and investment property 925,180 1,118,579<br />
b. Unsecured Term Loans<br />
Included in the unsecured term loans are medium term notes of the Group as follows:<br />
• In 2004, a wholly-owned subsidiary of the Company, <strong>Sembcorp</strong> Financial Services Pte Ltd (the “Issuer”),<br />
established a S$1.5 billion Multicurrency Multi-Issuer Debt Issuance Programme (the “Programme”). Pursuant<br />
to this, the Company, together with the Issuer and other certain subsidiaries of the Company (the “Issuing<br />
Subsidiaries”), may from time to time issue debt under the Programme subject to availability of funds from the<br />
market. The obligations of the Issuing Subsidiaries under the notes will be fully guaranteed by the Company.<br />
The Programme has not been utilised as at December 31, 2008.<br />
The Programme replaced the S$2.0 billion Multicurrency Debt Issuance Programme established by the Company<br />
(“the Existing Programme”) in October 2000. No further debt issuances will be made by the Company under<br />
its Existing Programme. The outstanding debt issuances of S$150 million was fully settled upon its maturity on<br />
June 6, 2008 and the Existing Programme was terminated.<br />
• In 2004, a subsidiary, <strong>Sembcorp</strong> Marine Ltd (“SCM”) established a S$500 million Multicurrency Multi-Issuer<br />
Debt Issuance Programme (the “Programme”) pursuant to which SCM with its subsidiaries, Jurong Shipyard<br />
Pte Ltd and Sembawang Shipyard Pte Ltd (“Issuing SCM Subsidiaries”), may from time to time issue the notes<br />
subject to availability of funds from the market. The obligations of Issuing SCM Subsidiaries under the notes<br />
will be fully guaranteed by SCM.<br />
Under the Programme, SCM or any of the Issuing SCM Subsidiaries may from time to time issue notes in series<br />
or tranches in Singapore Dollars and / or any other currency. Such notes are listed on the Singapore Exchange<br />
Securities Trading Limited and are cleared through the Central Depository (Pte) Ltd.<br />
The principal amount of the notes issued by SCM amounted to S$150 million (2007: S$285 million), bears an<br />
interest rate of 3.00% (2007: 2.82% to 3.00%) per annum and is due by September 26, 2009 (2007: 2008 to 2009).<br />
S$’000<br />
S$’000<br />
2008 2007<br />
Payments Interest Principal Payments Interest Principal<br />
S$’000 S$’000 S$’000 S$’000 S$’000 S$’000<br />
Group<br />
Within 1 year 1,574 169 1,405 1,375 127 1,248<br />
After 1 year but<br />
within 5 years 3,178 368 2,810 1,968 252 1,716<br />
Total 4,752 537 4,215 3,343 379 2,964<br />
Under the terms of the lease agreements, no contingent rents are payable. The interest rates range from 2.50% to<br />
7.42% (2007: 2.50% to 7.42%) per annum.<br />
30. OTHER LONG-TERM LIABILITIES<br />
Group<br />
Company<br />
2008 2007 2008 2007<br />
Note S$’000 S$’000 S$’000 S$’000<br />
Deferred income (a) 91,342 25,885 3,728 –<br />
Deferred grants (b) 17,815 26,348 – –<br />
Other long-term payables (c) 6,171 5,555 – –<br />
Other financial liabilities 24 65,088 2,271 – –<br />
Amount due to related parties 25 7,651 4,484 458,734 –<br />
Share of net liability of an associate 9 – 49,299 – –<br />
188,067 113,842 462,462 –<br />
a. Deferred income relates mainly to advance payments received from customers in respect of connection and<br />
capacity charges for the supply and delivery of gas and utilities, the difference between the fair value of the<br />
construction services provided and the fair value of the financial asset receivable.<br />
b. Deferred grants relate to government grants for capital assets.<br />
c. Other long-term payables relate primarily to retention monies of subsidiaries.<br />
182 Delivering Essential Solutions <strong>Sembcorp</strong> Industries Annual Report 2008 183
Notes to the<br />
Financial Statements<br />
Year Ended December 31, 2008<br />
31. TURNOVER<br />
Group<br />
2008 2007<br />
Sale of gas, water, electricity and related services 4,197,760 3,601,171<br />
Ship and rig repair, building, conversion and related services 4,989,922 4,442,078<br />
Construction and engineering related activities 131,957 115,497<br />
Environment management and related services 213,685 206,940<br />
Service concession revenue 129,964 –<br />
Others 265,125 253,092<br />
9,928,413 8,618,778<br />
32. FINANCE COSTS<br />
S$’000<br />
Group<br />
S$’000<br />
2008 2007<br />
Interest paid and payable to:<br />
– associates and joint ventures – 69<br />
– bank loans and others 43,764 52,219<br />
Amortisation of capitalised transaction costs<br />
and transactions costs written off 1,099 1,189<br />
Interest rate swap<br />
– fair value through profit or loss (456) 448<br />
44,407 53,925<br />
33. INCOME TAX EXPENSE<br />
S$’000<br />
Group<br />
S$’000<br />
2008 2007<br />
Current tax expense<br />
Current year 125,311 150,715<br />
Over provided in prior years (43,161) (44,228)<br />
82,150 106,487<br />
Deferred tax expense<br />
Movements in temporary differences 29,040 44,789<br />
Under provided in prior years 19,761 2,469<br />
Change in tax rate – (17,981)<br />
48,801 29,277<br />
Income tax expense 130,951 135,764<br />
S$’000<br />
S$’000<br />
33. INCOME TAX EXPENSE (cont’d)<br />
Reconciliation of effective tax rate<br />
Group<br />
2008 2007<br />
Profit for the year 730,994 651,342<br />
Total income tax expense 130,951 135,764<br />
Share of results of associates and joint ventures (126,096) (153,196)<br />
Profit before share of results of associates and joint ventures, and income tax expense 735,849 633,910<br />
Income tax using Singapore tax rate of 18% 132,453 114,103<br />
Effect of reduction in tax rates – (17,981)<br />
Effect of different tax rates in other countries 13,013 20,118<br />
Tax incentives and income not subject to tax (27,924) (12,189)<br />
Expenses not deductible for tax purposes 38,433 76,759<br />
Utilisation of tax benefits (6,118) (4,442)<br />
Over provided in prior years (23,400) (41,759)<br />
Deferred tax benefit not recognised 8,241 990<br />
Others (3,747) 165<br />
Income tax expense 130,951 135,764<br />
On January 22, 2009, the Minister for Finance announced in his Budget speech that the corporate income tax rate will<br />
be reduced from 18% to 17% from the year of assessment 2010. The tax expense for the Company and its Singapore<br />
subsidiaries within the Group for the year ended December 31, 2008 have been computed at the rate of 18%, being<br />
the corporate income tax rate in effect as at that date.<br />
34. PROFIT FOR THE YEAR<br />
The following items have been included in arriving at profit for the year:<br />
S$’000<br />
Group<br />
S$’000<br />
2008 2007<br />
a. Staff costs<br />
Staff costs 698,409 650,087<br />
Included in staff costs are:<br />
Share-based payments 31,253 26,237<br />
Contributions to:<br />
– defined benefit plan 3,302 4,338<br />
– defined contribution plan 28,593 26,187<br />
S$’000<br />
S$’000<br />
184 Delivering Essential Solutions <strong>Sembcorp</strong> Industries Annual Report 2008 185
Notes to the<br />
Financial Statements<br />
Year Ended December 31, 2008<br />
34. PROFIT FOR THE YEAR (cont’d)<br />
Group<br />
2008 2007<br />
Note S$’000 S$’000<br />
34. PROFIT FOR THE YEAR (cont’d)<br />
Group<br />
2008 2007<br />
Note S$’000 S$’000<br />
b. Other expenses<br />
Allowance made / (written back) for impairment losses<br />
– property, plant and equipment 6 7,807 219<br />
– investments in subsidiaries – 226<br />
– interests in associates – 918<br />
– interests in joint ventures – 560<br />
– interests in other investments 486 (619)<br />
– receivables 1,291 (10,290)<br />
– investment properties 7 69 555<br />
– intangible assets 16 – 110<br />
Allowance made / (written back) for:<br />
– inventory obsolescence 2,465 (189)<br />
– foreseeable losses on construction contracts 2,957 963<br />
Amortisation of intangible assets 16 102 2,118<br />
Audit fees paid / payable<br />
– auditors of the Company 1,421 907<br />
– other auditors 614 1,409<br />
Non-audit fees paid / payable<br />
– auditors of the Company 119 151<br />
– other auditors 307 390<br />
Depreciation of property, plant and equipment, and investment properties 194,863 180,741<br />
Professional fee paid to directors or a firm in which a director is a member 97 632<br />
Operating lease expenses 18,623 18,081<br />
Property, plant and equipment written off 3,203 1,154<br />
Intangible assets written off 16 100 3<br />
Bad debts written off 237 3,799<br />
c. Non-operating income (net)<br />
Net exchange loss (19,564) (10,056)<br />
Net change in fair value of derivative instruments (36,668) 922<br />
Grants received<br />
– income related 83 67<br />
Gross dividend income 9,771 6,985<br />
Gain / (Loss) from disposal of<br />
– property, plant and equipment (net) 18,393 4,788<br />
– investment properties – 5,125<br />
– subsidiaries – 5,284<br />
– associates – 46,865<br />
– joint ventures 35 261<br />
– other financial assets (38,135) (72,320)<br />
Interest income<br />
– associates and joint ventures 94 –<br />
– banks and others 35,772 46,709<br />
d. Material and unusual items included in:<br />
Non-operating income (net)<br />
Gain on divestment of investments – 276,557<br />
Foreign exchange losses arising from Unauthorised Transactions<br />
in a wholly-owned subsidiary of <strong>Sembcorp</strong> Marine Ltd (i) (43,749) (302,922)<br />
(43,749) (26,365)<br />
Income tax expense on material and unusual items above – (49,517)<br />
Net material and unusual items before minority interests (43,749) (75,882)<br />
Less: Minority interests 16,821 44,860<br />
(26,928) (31,022)<br />
i. Arising from the various unauthorised foreign exchange transactions entered into previously by an employee<br />
of a subsidiary of the Company, <strong>Sembcorp</strong> Marine Ltd (“SCM”), for the account of one of its wholly-owned<br />
subsidiaries, Jurong Shipyard Pte Ltd (“JSPL”), S$302.9 million was charged to the income statement in 2007.<br />
During the year, another S$43.7 million had been charged to the income statement following the full and final<br />
amicable settlement of BNP Paribas’s claim of S$73.1 million, strictly on commercial basis.<br />
Going forward, JSPL intends to recover the S$289.9 million paid to Societe Generale (“SG”) in 2007 as JSPL’s<br />
position is that the underlying transactions with SG are not valid and binding. If JSPL succeeds in doing so,<br />
there will be an inflow of funds to be recognised in the financial statements at that relevant point in time.<br />
ii. Certain underbillings relating to prior years had been noted between two subsidiaries. No material impact<br />
on Group turnover and PATMI has arisen from this. Its net impact has been recognised in the current year,<br />
increasing profit attributable to minority interests and decreasing the profit attributable to the shareholders<br />
of the Company.<br />
35. EARNINGS PER SHARE<br />
a. Basic earnings per share<br />
Basic earnings per share is based on:<br />
Group<br />
2008 2007<br />
i. Profit attributable to shareholders of the Company 507,061 526,217<br />
ii.<br />
S$’000<br />
No. of shares<br />
S$’000<br />
No. of shares<br />
’000 ’000<br />
Weighted average number of ordinary shares:<br />
Issued ordinary shares at beginning of the year 1,783,783 1,770,178<br />
Effects of share options exercised 2,767 9,254<br />
Effect of own shares held (7,635) –<br />
Weighted average number of ordinary shares at the end of the year 1,778,915 1,779,432<br />
186 Delivering Essential Solutions <strong>Sembcorp</strong> Industries Annual Report 2008 187
Notes to the<br />
Financial Statements<br />
Year Ended December 31, 2008<br />
35. EARNINGS PER SHARE (cont’d)<br />
b. Diluted earnings per share<br />
Diluted earnings per share is based on:<br />
Group<br />
2008 2007<br />
S$’000<br />
S$’000<br />
36. DIVIDENDS AND CAPITAL DISTRIBUTION<br />
Subject to the approval by the shareholders at the next Annual General Meeting, the directors have proposed a final<br />
ordinary one-tier tax exempt dividend of 11.0 cents (2007: one-tier tax exempt dividend of 15.0 cents) per share<br />
amounting to an estimated net dividend of S$195,467,000 (2007: S$266,890,000) in respect of the year ended December<br />
31, 2008, based on the share capital as at that date.<br />
The proposed dividend of 11.0 (2007:15.0) cents per share has not been included as a liability in the financial statements.<br />
i. Profit attributable to shareholders of the Company 507,061 526,217<br />
The weighted average number of ordinary shares adjusted for the unissued ordinary shares under the Share<br />
Option Plan was arrived at as follows:<br />
ii.<br />
No. of shares<br />
No. of shares<br />
’000 ’000<br />
Weighted average number of shares issued used in the calculation<br />
of basic earnings per share 1,778,915 1,779,432<br />
Weighted average number of unissued ordinary shares from:<br />
– share options 12,363 20,468<br />
– performance shares 3,774 3,505<br />
– restricted stocks 5,576 3,165<br />
Number of shares that would have been issued at fair value (6,741) (7,748)<br />
Weighted average number of ordinary shares 1,793,887 1,798,822<br />
For the purpose of calculating diluted earnings per ordinary share, the weighted average numbers of ordinary<br />
shares outstanding are adjusted for the effects of all dilutive potential ordinary shares. The Company has three<br />
categories of dilutive potential ordinary shares: share options, performance shares and restricted stocks.<br />
For share options, the weighted average number of ordinary shares in issue is adjusted to take into account the<br />
dilutive effect arising from the exercise of all outstanding share options granted to employees where such shares<br />
would be issued at a price lower than the fair value (average share price during the year). The difference between<br />
the weighted average number of shares to be issued at the exercise prices under the options and the weighted<br />
average number of shares that would have been issued at the fair value based on assumed proceeds from the issue<br />
of these shares are treated as ordinary shares issued for no consideration. The number of such shares issued for no<br />
consideration is added to the number of ordinary shares outstanding in the computation of diluted earnings per<br />
share. No adjustment is made to the profit attributable to shareholders of the Company.<br />
For performance shares and restricted stocks, the weighted average number of ordinary shares in issue is adjusted<br />
as if all dilutive performance shares and restricted stocks are released. No adjustment is made to the profit<br />
attributable to shareholders of the Company.<br />
37. SIGNIFICANT ACQUISITIONS AND DISPOSALS<br />
Group<br />
There have been no other significant acquisitions and disposals of subsidiaries in 2007 and 2008.<br />
Company<br />
In January 2008, the Company entered into an internal restructuring with its wholly-owned subsidiary, <strong>Sembcorp</strong><br />
Utilities Pte Ltd, for the acquisition of the entire assets, liabilities and businesses of <strong>Sembcorp</strong> Utilities & Terminals<br />
(“SUT”) and Propylene Purification Unit (“PPU”) divisions, including their current employees. The assets and liabilities<br />
were transferred at net book value as at December 31, 2007.<br />
The acquisition is accounted for using “as-if-pooling” method. No restatement was made to the comparatives.<br />
The effect of the acquisition is set out below:<br />
Note<br />
Company<br />
Non-current assets<br />
Property, plant and equipment 6 447,256<br />
Long-term receivables and prepayments 1,059<br />
Intangible assets 16 18,946<br />
467,261<br />
Current assets<br />
Inventories and work-in-progress 8,630<br />
Trade and other receivables 59,386<br />
Cash and cash equivalents 43,611<br />
111,627<br />
Total assets 578,888<br />
Non-current liabilities<br />
Deferred tax liabilities 17 44,667<br />
Trade and other payables 4,087<br />
48,754<br />
S$’000<br />
Current liabilities<br />
Trade and other payables 67,748<br />
Provisions 27 3,780<br />
71,528<br />
Total liabilities 120,282<br />
Net identificable assets acquired 458,606<br />
188 Delivering Essential Solutions <strong>Sembcorp</strong> Industries Annual Report 2008 189
Notes to the<br />
Financial Statements<br />
Year Ended December 31, 2008<br />
38. RELATED PARTIES<br />
Group<br />
a. Related party transactions<br />
The Group had the following significant transactions with related parties during the year:<br />
Group<br />
2008 2007<br />
Related Corporations<br />
Sales 165 13<br />
Purchases including rental 2,470 –<br />
Associates and Joint Ventures<br />
Sales 41,251 39,376<br />
Purchases including rental 21,542 255,737<br />
b. Compensation of key management personnel<br />
The Group considers the directors of the Company (including the Group President & Chief Executive Officer<br />
(“CEO”) of the Company), the Group President & CEO of <strong>Sembcorp</strong> Marine Ltd, the President & Chief Operating<br />
Officer (“COO”) of <strong>Sembcorp</strong> Marine Ltd, the Executive Chairman of <strong>Sembcorp</strong> Industrial Parks Ltd, the Executive<br />
Vice President of <strong>Sembcorp</strong> Utilities (UK) Limited, the Group Chief Financial Officer and the Executive Vice<br />
President of Group Business Development to be key management personnel in accordance with FRS 24 Related<br />
Party Disclosures. These persons have the authority and responsibility for planning, directing and controlling the<br />
activities of the Group.<br />
The key management personnel compensation is as follows:<br />
S$’000<br />
Group<br />
S$’000<br />
2008 2007<br />
Directors’ fees and remuneration 5,663 5,508<br />
Other key management personnel remuneration 6,797 8,227<br />
12,460 13,735<br />
Fair value of share-based compensation 5,408 5,956<br />
Remuneration includes salary (which includes employer CPF, allowances, fees and other emoluments) and bonus<br />
(which includes AWS, discretionary bonus, performance targets bonus, performance shares and restricted stocks<br />
released during the year).<br />
In addition to the above, the Company provides medical benefits to all employees including key management<br />
personnel.<br />
The Group adopts an incentive compensation plan, which is tied to the creation of Economic Value Added (“EVA”),<br />
as well as to attainment of individual and Group performance goals for its key executives. A “bonus bank” is used<br />
to hold incentive compensation credited in any year. Typically, one-third of the available balance is paid out in<br />
cash each year, with the balance being carried forward to the following year. Such carried forward balances of the<br />
bonus bank may either be reduced or increased in future, based on the yearly EVA performance of the Group and<br />
its subsidiaries.<br />
S$’000<br />
S$’000<br />
38. RELATED PARTIES (cont’d)<br />
Group (cont’d)<br />
b. Compensation of key management personnel (cont’d)<br />
The fair value of share-based compensation relates to share options, performance shares and restricted stocks<br />
granted during the year. The amount charged to the income statement is determined in accordance with FRS 102<br />
Share-based Payment.<br />
Company<br />
a. The Company has provided a corporate guarantee to a subsidiary, <strong>Sembcorp</strong> Cogen Pte Ltd (“SembCogen”) which<br />
on January 15, 1999, entered into a long-term contract (“End User Agreement”) with a fellow subsidiary, <strong>Sembcorp</strong><br />
Gas Pte Ltd (“SembGas”) to purchase natural gas over the period of 22 years.<br />
Under the End User Guarantee Agreement, the Company and one of its subsidiaries, <strong>Sembcorp</strong> Utilities Pte Ltd<br />
issued corporate guarantees in favour of SembGas for 70% and 30% respectively of SembCogen’s obligations<br />
under the End User Agreement.<br />
b. The Company has provided financial guarantees for the indebtedness of other companies within the Group; the<br />
Company considers these to be insurance arrangements and treats them as contingent liabilities. Details of the<br />
guarantees are set out in Note 40 to the financial statements.<br />
39. <strong>FINANCIAL</strong> INSTRUMENTS<br />
Financial risk management objectives and policies<br />
The Group’s activities expose it to market risk (including interest rate risk, foreign currency risk and price risk), credit<br />
risk and liquidity risk.<br />
As part of the Group’s Enterprise Risk Management framework, Group treasury policies and financial authority limits<br />
are documented and reviewed periodically. The policies set out the parameters for management of Group liquidity,<br />
counterparty risk, foreign exchange and derivative transactions and financing.<br />
The Group utilises foreign exchange contracts, foreign exchange swaps, interest rate swaps, interest rate options,<br />
zero cost collars, contracts for difference and various financial instruments to manage exposures to interest rate,<br />
foreign exchange and commodity price risks arising from operating, financing and investment activities. Exposures to<br />
foreign currency risks are also hedged naturally by a matching sale or purchase of a matching asset or liability of the<br />
same currency and amount where possible. All such transactions must involve underlying assets or liabilities and no<br />
speculative transactions are allowed.<br />
The financial authority limits seek to limit and mitigate transactional risks by setting out the threshold of approvals<br />
required for the entry into contractual obligations and investments.<br />
a. Market risk<br />
Market risk is the risk that changes in market prices, such as interest rates, foreign exchange rates and prices<br />
will affect the Group’s income or the value of its holdings of financial instruments. The objective of market risk<br />
management is to manage and reduce market risk exposures within acceptable parameters.<br />
i. Interest rate risk<br />
The Group’s policy is to maintain an efficient and optimal interest cost structure using a mix of fixed and<br />
variable rate debts and long-term and short-term borrowings.<br />
The Group enters into interest rate swaps to reduce its exposure to interest rate volatility. In accordance with<br />
the Group’s policy, the duration of such interest rate swaps must not exceed the tenor of the underlying debt.<br />
190 Delivering Essential Solutions <strong>Sembcorp</strong> Industries Annual Report 2008 191
Notes to the<br />
Financial Statements<br />
Year Ended December 31, 2008<br />
39. <strong>FINANCIAL</strong> INSTRUMENTS (cont’d)<br />
a. Market risk (cont’d)<br />
i. Interest rate risk (cont’d)<br />
Effective interest rates and repricing analysis<br />
In respect of interest-earning financial assets and interest-bearing financial liabilities, the following table<br />
indicates effective interest rates at balance sheet date and the periods in which they are repriced:<br />
Effective Within Between After<br />
interest rate 1 year 1 to 5 years 5 years Total<br />
Note % S$’000 S$’000 S$’000 S$’000<br />
Group<br />
2008<br />
Financial assets<br />
Finance lease receivables 14 4.25 3,374 18,025 – 21,399<br />
Balances with related parties 0.01 4,111 – – 4,111<br />
Loan receivables 2.74 1,745 – – 1,745<br />
Other receivables 4.39 19,226 – – 19,226<br />
Fixed deposits and bank balances 3.17 1,926,781 – – 1,926,781<br />
1,955,237 18,025 – 1,973,262<br />
Financial liabilities<br />
Secured term loans:<br />
– Floating rate loans 4.76 (398,582) (8,000) – (406,582)<br />
– Effect of interest rate swaps (0.24) 308,300 (231,699) (76,601) –<br />
Total secured term loans (90,282) (239,699) (76,601) (406,582)<br />
Unsecured term loans:<br />
– Floating rate loans 2.13 (202,905) – – (202,905)<br />
– Effect of interest rate swaps 1.00 200,000 (200,000) – –<br />
(2,905) (200,000) – (202,905)<br />
– Fixed rate loans 2.48 (49,763) – – (49,763)<br />
Medium-term notes 3.10 (149,945) – – (149,945)<br />
Total unsecured term loans 29 (202,613) (200,000) – (402,613)<br />
Lease liabilities 29 5.20 (1,405) (2,810) – (4,215)<br />
Balances with related parties 5.39 – (7,651) – (7,651)<br />
(294,300) (450,160) (76,601) (821,061)<br />
39. <strong>FINANCIAL</strong> INSTRUMENTS (cont’d)<br />
a. Market risk (cont’d)<br />
i. Interest rate risk (cont’d)<br />
Effective interest rates and repricing analysis (cont’d)<br />
Effective Within Between After<br />
interest rate 1 year 1 to 5 years 5 years Total<br />
Note % S$’000 S$’000 S$’000 S$’000<br />
Group<br />
2007<br />
Financial assets<br />
Finance lease receivables 14 4.25 15,551 14,401 6,999 36,951<br />
Balances with related parties 0.01 4,748 – – 4,748<br />
Loan receivables 2.11 17,491 – – 17,491<br />
Other receivables 4.04 23,908 – – 23,908<br />
Fixed deposits and bank balances 3.03 1,230,463 – – 1,230,463<br />
1,292,161 14,401 6,999 1,313,561<br />
Financial liabilities<br />
Secured term loans:<br />
– Floating rate loans 5.51 (536,067) – – (536,067)<br />
– Effect of interest rate swaps 0.40 258,249 (171,014) (87,235) –<br />
(277,818) (171,014) (87,235) (536,067)<br />
– Fixed rate loans 3.93 (12,000) (32,000) – (44,000)<br />
Total secured term loans (289,818) (203,014) (87,235) (580,067)<br />
Unsecured term loans:<br />
– Floating rate loans 3.19 (204,015) – – (204,015)<br />
– Effect of interest rate swaps (0.08) 200,000 (200,000) – –<br />
(4,015) (200,000) – (204,015)<br />
– Fixed rate loans 4.53 (253,504) – – (253,504)<br />
Medium-term notes 3.56 (150,000) (149,869) – (299,869)<br />
Total unsecured term loans 29 (407,519) (349,869) – (757,388)<br />
Bank overdrafts 29 5.00 (889) – – (889)<br />
Lease liabilities 29 5.51 (1,248) (1,716) – (2,964)<br />
Balances with related parties 3.53 (8) (4,484) – (4,492)<br />
(699,482) (559,083) (87,235) (1,345,800)<br />
Sensitivity analysis<br />
It is estimated that a one percentage point change in interest rate at the reporting date would increase /<br />
(decrease) equity and profit before income tax by the following amounts. This analysis assumes that all other<br />
variables, in particular foreign currency rates, remain constant.<br />
192 Delivering Essential Solutions <strong>Sembcorp</strong> Industries Annual Report 2008 193
Notes to the<br />
Financial Statements<br />
Year Ended December 31, 2008<br />
39. <strong>FINANCIAL</strong> INSTRUMENTS (cont’d)<br />
a. Market risk (cont’d)<br />
i. Interest rate risk (cont’d)<br />
Effective interest rates and repricing analysis (cont’d)<br />
Profit before income tax<br />
Equity<br />
100 bp 100 bp 100 bp 100 bp<br />
Increase Decrease Increase Decrease<br />
S$’000 S$’000 S$’000 S$’000<br />
Group<br />
December 31, 2008<br />
Variable rate financial instruments 1,401 (1,401) 17,659 (17,659)<br />
December 31, 2007<br />
Variable rate financial instruments 9,489 (9,489) 11,739 (11,739)<br />
Notional amount<br />
At December 31, 2008, the Group had interest rate swaps with an aggregate notional amount of S$544,030,000<br />
(2007: S$691,308,000) whereby it receives a variable interest rate and pays a fixed rate interest ranging from<br />
2.65% to 6.0% (2007: 2.78% to 5.95%) per annum on the notional amount. The Company classifies these<br />
interest rate swaps as cash flow hedges.<br />
39. <strong>FINANCIAL</strong> INSTRUMENTS (cont’d)<br />
a. Market risk (cont’d)<br />
i. Interest rate risk (cont’d)<br />
Effective interest rates and repricing analysis (cont’d)<br />
Effective Within Between<br />
interest rate 1 year 1 to 5 years Total<br />
% S$’000 S$’000 S$’000<br />
Company<br />
2007<br />
Financial assets<br />
Balances with related parties 4.45 535 – 535<br />
Fixed deposits and bank balances 1.82 189,470 – 189,470<br />
190,005 – 190,005<br />
Financial liabilities<br />
Unsecured term loans:<br />
– Fixed rate loans 4.12 (150,000) – (150,000)<br />
Balances with related parties 2.59 (190,000) – (190,000)<br />
(340,000) – (340,000)<br />
Profit before income tax<br />
Equity<br />
Effective Within Between<br />
interest rate 1 year 1 to 5 years Total<br />
% S$’000 S$’000 S$’000<br />
100 bp 100 bp 100 bp 100 bp<br />
Increase Decrease Increase Decrease<br />
S$’000 S$’000 S$’000 S$’000<br />
Company<br />
2008<br />
Financial assets<br />
Balances with related parties 2.17 178 – 178<br />
Fixed deposits and bank balances 0.66 45,541 – 45,541<br />
45,719 – 45,719<br />
Financial liabilities<br />
Balances with related parties 2.12 (206,198) (458,734) (664,932)<br />
ii.<br />
Company<br />
December 31, 2008<br />
Variable rate financial instruments (3,956) 3,956 – –<br />
December 31, 2007<br />
Variable rate financial instruments – * – * – –<br />
* Amount less than S$1,000.<br />
Foreign currency risk<br />
The Group operates globally and is exposed to foreign currency exchange rate volatility primarily for United<br />
States dollars (“USD”), pounds sterling (“GBP”), euros (“EURO”), Australian dollars (“AUD”) and Chinese<br />
renminbi (“RMB”) on sales and purchases of assets and liabilities, which arise from the daily course of operations.<br />
Such risks are hedged either by forward foreign exchange contracts in respect of actual or forecasted currency<br />
exposures which are reasonably certain or hedged naturally by a matching sale or purchase of a matching asset<br />
or liability of the same currency and amount.<br />
194 Delivering Essential Solutions <strong>Sembcorp</strong> Industries Annual Report 2008 195
Notes to the<br />
Financial Statements<br />
Year Ended December 31, 2008<br />
39. <strong>FINANCIAL</strong> INSTRUMENTS (cont’d)<br />
a. Market risk (cont’d)<br />
ii. Foreign currency risk (cont’d)<br />
The Group’s exposure to foreign currencies is as follows:<br />
SGD USD GBP EURO Others<br />
S$’000 S$’000 S$’000 S$’000 S$’000<br />
Group<br />
2008<br />
Financial assets<br />
Cash and cash equivalents 98,220 928,866 98 71,687 12,088<br />
Trade and other receivables 14,239 339,173 5,205 27,535 10,964<br />
Other financial assets – 2,365 – (23) 1,990<br />
112,459 1,270,404 5,303 99,199 25,042<br />
Financial liabilities<br />
Trade and other payables * 101,965 273,561 3,875 44,655 8,881<br />
Interest-bearing borrowings – 139,235 1,912 – 1,937<br />
101,965 412,796 5,787 44,655 10,818<br />
39. <strong>FINANCIAL</strong> INSTRUMENTS (cont’d)<br />
a. Market risk (cont’d)<br />
ii. Foreign currency risk (cont’d)<br />
Notional amount<br />
At the balance sheet date, the Group had foreign exchange contracts with the following notional amounts:<br />
Group<br />
2008 2007<br />
Notional amount Notional amount<br />
Foreign exchange forward contracts 2,980,835 915,499<br />
Foreign exchange swap agreements 175,811 107,287<br />
3,156,646 1,022,786<br />
Sensitivity analysis<br />
A 10% strengthening of the following currencies against the functional currencies of the Company and its<br />
subsidiaries at the balance sheet date would have increased / (decreased) equity and profit before income tax<br />
by the amounts shown below. The analysis assumes that all other variables, in particular interest rates, remain<br />
constant. The analysis is performed on the same basis for 2007.<br />
S$’000<br />
S$’000<br />
Net financial assets / (liabilities) 10,494 857,608 (484) 54,544 14,224<br />
SGD USD GBP EURO Others<br />
S$’000 S$’000 S$’000 S$’000 S$’000<br />
Equity<br />
S$’000<br />
Group<br />
Profit before<br />
income tax<br />
S$’000<br />
2007<br />
Financial assets<br />
Cash and cash equivalents 41,217 305,687 37,924 114,767 22,335<br />
Trade and other receivables 15,366 134,976 125 4,975 20,105<br />
Other financial assets – 69,847 – – 15,291<br />
56,583 510,510 38,049 119,742 57,731<br />
Financial liabilities<br />
Trade and other payables * 169,239 208,659 40,141 48,108 19,248<br />
Interest-bearing borrowing – 66,171 – – 11,567<br />
169,239 274,830 40,141 48,108 30,815<br />
Net financial (liabilities) / assets (112,656) 235,680 (2,092) 71,634 26,916<br />
* Excludes share of net liability of an associate<br />
Company<br />
The Company’s financial assets and liabilities are predominantly denominated in Singapore dollars at balance<br />
sheet dates.<br />
2008<br />
SGD 6,106 63,485<br />
USD 202,810 44,577<br />
EURO 517 5,858<br />
Others (198) 1,192<br />
2007<br />
SGD – 11,266<br />
USD 39,869 (54,262)<br />
EURO 1,608 7,163<br />
Others – 2,483<br />
A 10% weakening of the above currencies against the functional currencies of the Company and its subsidiaries<br />
at the balance sheet date would have had the equal but opposite effect on the above currencies to the<br />
amounts shown above, on the basis that all other variables remain constant.<br />
196 Delivering Essential Solutions <strong>Sembcorp</strong> Industries Annual Report 2008 197
Notes to the<br />
Financial Statements<br />
Year Ended December 31, 2008<br />
39. <strong>FINANCIAL</strong> INSTRUMENTS (cont’d)<br />
a. Market risk (cont’d)<br />
iii. Price risk<br />
Equity securities price risk<br />
The Group is exposed to equity securities price risk because of the investments held by the Group which are<br />
classified on the consolidated balance sheet either as available-for-sale or at fair value through profit or loss.<br />
Sensitivity analysis<br />
If prices for equity securities increase by 10% with all other variables held constant, the increase in equity and<br />
profit before income tax will be:<br />
Group<br />
2008 2007<br />
Equity 14,605 70,102<br />
Profit before income tax 3 7<br />
A 10% decrease in the underlying equity prices would have had the equal but opposite effect to the amounts<br />
shown above. The analysis is performed on the same basis for 2007 and assumes that all other variables remain<br />
constant.<br />
Commodity risk<br />
The Group hedges against fluctuations in commodity prices that affect revenue and cost. Exposures are<br />
managed via swaps, options, contracts for difference, fixed price and forward contracts.<br />
Contracts for differences are entered into with a counterparty at a strike price, with or without fixing the<br />
quantity upfront, to hedge against adverse price movements on the sale of electricity. Naphtha swaps are<br />
entered into for fixed quantity to hedge revenue indexed to naphtha. Exposure to price fluctuations arising<br />
on the purchase of fuel is managed via fuel oil swaps where the price of fuel is indexed to a benchmark fuel<br />
price index, for example Singapore High Sulphur Fuel Oil (“HSFO”) 180 CST fuel oil.<br />
For precious metal commodities, such as gold, exposures to fluctuations in price are hedged through the use of<br />
forward contracts or options that fix the purchases at an agreed price. The quantum of commitment is based<br />
on actual or forecasted requirements.<br />
Sensitivity analysis<br />
If prices for commodities increase by 10% with all other variables held constant, the increase in equity and<br />
profit before income tax will be:<br />
S$’000<br />
Group<br />
S$’000<br />
2008 2007<br />
S$’000<br />
S$’000<br />
39. <strong>FINANCIAL</strong> INSTRUMENTS (cont’d)<br />
a. Market risk (cont’d)<br />
iii. Price risk<br />
Notional amount<br />
At the balance sheet date, the Group had financial instruments with the following notional contract amounts:<br />
2008 2007<br />
Notional amount Notional amount<br />
Group<br />
Fuel oil swap agreements 199,483 155,682<br />
Power swap contracts 116,053 95,856<br />
Commodity contracts – 6,775<br />
315,536 258,313<br />
b. Credit risk<br />
The Group monitors its exposure to credit risks arising from sales to trade customers on an on-going basis, and<br />
credit evaluations are done on customers that require credit. The credit quality of customers is assessed after taking<br />
into account its financial position and past experience with the customers.<br />
The Group only deals with pre-approved customers and financial institutions with good credit rating. To minimise<br />
the Group’s counterparty risk, the Group enters into derivative transactions only with creditworthy institutions.<br />
Cash and fixed deposits are placed in banks and financial institutions with good credit rating.<br />
As the Group and the Company does not hold any collateral, the maximum exposure to credit risk is the carrying<br />
amount of each financial asset, including derivative financial instruments, in the balance sheet.<br />
The Group’s and the Company’s maximum exposure to credit risk for loans and receivables at the balance sheet<br />
date is as follows:<br />
Group<br />
S$’000<br />
Company<br />
S$’000<br />
2008 2007 2008 2007<br />
S$’000 S$’000 S$’000 S$’000<br />
By business activity<br />
Utilities 527,117 580,889 38,381 –<br />
Marine 575,379 543,899 – –<br />
Environment 36,524 41,174 – –<br />
Industrial parks 5,150 10,640 – –<br />
Others 32,149 40,085 4,791 23,386<br />
1,176,319 1,216,687 43,172 23,386<br />
Equity 4,637 15,178<br />
Profit before income tax – 559<br />
A 10% decrease in the prices for commodities would have had the equal but opposite effect to the amounts<br />
shown above. The analysis is performed on the same basis for 2007 and assumes that all other variables remain<br />
constant.<br />
198 Delivering Essential Solutions <strong>Sembcorp</strong> Industries Annual Report 2008 199
Notes to the<br />
Financial Statements<br />
Year Ended December 31, 2008<br />
39. <strong>FINANCIAL</strong> INSTRUMENTS (cont’d)<br />
b. Credit risk (cont’d)<br />
The age analysis of current trade and other receivables is as follows:<br />
Gross Impairment Gross Impairment<br />
2008 2008 2007 2007<br />
S$’000 S$’000 S$’000 S$’000<br />
Group<br />
Not past due 752,178 8,343 849,454 1,075<br />
Past due 0 to 3 months 79,483 2,840 80,284 562<br />
Past due 3 to 6 months 17,779 2,582 46,019 892<br />
Past due 6 to 12 months 9,128 1,009 31,352 1,562<br />
More than 1 year 53,842 23,904 80,451 36,568<br />
912,410 38,678 1,087,560 40,659<br />
Company<br />
Not past due 32,457 – 670 –<br />
Past due 0 to 3 months 3,054 – 15,232 –<br />
Past due 3 to 6 months 1,292 – 2,036 –<br />
Past due 6 to 12 months 606 – 3,073 –<br />
More than 1 year 691 247 1,162 60<br />
38,100 247 22,173 60<br />
Movements in the allowance for impairment of current and non-current trade and other receivables are as follows:<br />
Group<br />
Company<br />
2008 2007 2008 2007<br />
S$’000 S$’000 S$’000 S$’000<br />
Balance at beginning of the year 57,985 87,046 60 60<br />
Currency translation difference (686) (129) – –<br />
Allowance made 11,546 2,893 187 –<br />
Allowance utilised (4,355) (16,673) – –<br />
Allowance written back (10,255) (13,183) – –<br />
Acquisition of subsidiaries – (53) – –<br />
Disposal of subsidiaries (897) (1,916) – –<br />
Balance at end of the year 53,338 57,985 247 60<br />
The allowance account in respect of trade and other receivables is used to record impairment losses unless the<br />
Group is satisfied that no recovery of the amount owing is possible. At that point, the financial asset is considered<br />
irrecoverable and the amount charged to the allowance account is written against the carrying amount of the<br />
impaired financial asset.<br />
39. <strong>FINANCIAL</strong> INSTRUMENTS (cont’d)<br />
c. Liquidity risk<br />
The Group manages its liquidity risk with the view to maintaining a healthy level of cash and cash equivalents<br />
appropriate to the operating environment and expected cash flows of the Group. Liquidity requirements are<br />
maintained within the credit facilities established and are adequate and available to the Group to meet its<br />
obligations.<br />
The table below analyses the maturity profile of the Group’s and the Company’s financial liabilities (including<br />
derivative financial liabilities) based on expected contractual undiscounted cash inflows / (outflows), including<br />
interest payments and excluding the impact of netting agreements:<br />
Cash Flows<br />
Carrying Contractual Less than Between Over<br />
amount cash flow 1 year 1 and 5 years 5 years<br />
S$’000 S$’000 S$’000 S$’000 S$’000<br />
Group<br />
2008<br />
Derivatives<br />
Derivative financial liabilities 231,826<br />
– inflow 2,958,465 2,246,599 711,866 –<br />
– outflow (3,188,897) (2,417,282) (771,202) (413)<br />
Derivative financial assets (4,261)<br />
– inflow 156,629 156,629 – –<br />
– outflow (152,368) (152,368) – –<br />
Non-derivative financial liabilities<br />
Trade and other payables * 2,272,217 (2,273,268) (2,260,683) (12,585) –<br />
Interest–bearing borrowings 808,318 (840,870) (301,407) (450,008) (89,455)<br />
3,308,100 (3,340,309) (2,728,512) (521,929) (89,868)<br />
2007<br />
Derivatives<br />
Derivative financial liabilities 31,212<br />
– inflow 218,737 198,479 20,258 –<br />
– outflow (252,313) (228,799) (23,466) (48)<br />
Derivative financial assets (15,319)<br />
– inflow 789,983 784,607 5,376 –<br />
– outflow (775,080) (770,218) (4,862) –<br />
Non-derivative financial liabilities<br />
Trade and other payables * 2,174,903 (2,174,903) (2,164,864) (10,039) –<br />
Bank overdrafts 889 (889) (889) – –<br />
Interest–bearing borrowings 1,332,791 (1,400,733) (568,279) (647,201) (185,253)<br />
3,524,476 (3,595,198) (2,749,963) (659,934) (185,301)<br />
200 Delivering Essential Solutions <strong>Sembcorp</strong> Industries Annual Report 2008 201
Notes to the<br />
Financial Statements<br />
Year Ended December 31, 2008<br />
39. <strong>FINANCIAL</strong> INSTRUMENTS (cont’d)<br />
c. Liquidity risk (cont’d)<br />
Cash Flows<br />
Carrying Contractual Less than Between<br />
amount cash flow 1 year 1 and 5 years<br />
S$’000 S$’000 S$’000 S$’000<br />
39. <strong>FINANCIAL</strong> INSTRUMENTS (cont’d)<br />
d. Estimation of fair values<br />
Securities<br />
The fair value of financial assets at fair value through profit or loss, and available-for-sale financial assets, is based<br />
on quoted market prices (bid price) at the balance sheet date without any deduction for transaction costs. If the<br />
market for a quoted financial asset is not active, and for unquoted financial assets, the Group establishes fair value<br />
by using valuation techniques.<br />
Company<br />
2008<br />
Trade and other payables * 774,713 (834,605) (327,976) (506,629)<br />
2007<br />
Trade and other payables * 249,183 (249,183) (249,183) –<br />
Interest-bearing borrowings 150,000 (153,103) (153,103) –<br />
399,183 (402,286) (402,286) –<br />
* Excludes deposits, advance payments from customers and share of net liability of an associate<br />
The following table indicates the periods in which the cash flow associated with derivatives that are cash flow<br />
hedges are expected to impact the income statement.<br />
Cash Flows<br />
Carrying Contractual Less than Between Over<br />
amount cash flow 1 year 1 and 5 years 5 years<br />
S$’000 S$’000 S$’000 S$’000 S$’000<br />
Group<br />
2008<br />
Derivative financial liabilities 228,200<br />
– inflow 2,849,920 2,138,054 711,866 –<br />
– outflow (3,076,726) (2,305,111) (771,202) (413)<br />
Derivative financial assets (27,330)<br />
– inflow 94,605 94,605 – –<br />
– outflow (67,275) (67,275) – –<br />
200,870 (199,476) (139,727) (59,336) (413)<br />
2007<br />
Derivative financial liabilities 28,633<br />
– inflow 180,316 160,058 20,258 –<br />
– outflow (211,477) (187,963) (23,466) (48)<br />
Derivative financial assets (60,301)<br />
– inflow 60,685 54,263 6,422 –<br />
– outflow – – – –<br />
(31,668) 29,524 26,358 3,214 (48)<br />
Derivatives<br />
Forward exchange contracts are either marked to market using listed market prices at the balance sheet date<br />
or, if a listed market price is not available, the fair value is estimated by discounting the difference between the<br />
contractual forward price and the current spot rate.<br />
The fair value of interest rate swaps, based on current interest rates curves, is the estimated amount that the Group<br />
is expected to receive or pay to terminate the swap with the swap counterparties at the balance sheet date.<br />
The fair value of fuel oil swaps contracts is their quoted market price at the balance sheet date, being the present<br />
value of the quoted forward fuel oil price.<br />
Contracts for differences are accounted for based on the difference between the contracted price entered into with<br />
the counterparty and the reference price. The fair value of contracts for differences cannot be reliably measured as<br />
the financial instrument does not have quoted market prices in an active market. The gains and losses for contracts<br />
for differences are taken to the income statement upon settlement.<br />
The electricity forward sale with option to buyback contracts is entered into with a single counterparty for a fixed<br />
volume and its fair value is determined based on forward sale and forecasted spot purchase prices quoted in the<br />
market as at balance sheet date.<br />
Non-derivative financial liabilities<br />
Fair values are calculated based on discounted expected future principal and interest cash flows at the market<br />
rate of interest at the reporting date. For finance leases, the market rate of interest is determined by reference to<br />
similar lease agreements.<br />
Other financial assets and liabilities<br />
The carrying amounts of financial assets and liabilities with a maturity of less than one year (including trade and<br />
other receivables, cash and cash equivalents, and trade and other payables) are assumed to approximate their fair<br />
values because of the short period to maturity. All other financial assets and liabilities are discounted to determine<br />
their fair values.<br />
Where discounted cash flow techniques are used, estimated future cash flows are based on management’s best<br />
estimates and the discount rate is a market-related rate for a similar instrument at the balance sheet date. Where<br />
other pricing models are used, inputs are based on market-related data at the balance sheet date.<br />
202 Delivering Essential Solutions <strong>Sembcorp</strong> Industries Annual Report 2008 203
Notes to the<br />
Financial Statements<br />
Year Ended December 31, 2008<br />
39. <strong>FINANCIAL</strong> INSTRUMENTS (cont’d)<br />
e. Financial instruments not carried at fair value<br />
The aggregate net fair values of recognised financial assets and liabilities which are not carried at fair value in the<br />
balance sheet as at December 31 are represented in the following table:<br />
2008 2007<br />
Carrying Fair Carrying Fair<br />
amount value amount value<br />
S$’000 S$’000 S$’000 S$’000<br />
Group<br />
Financial liabilities<br />
Medium-term notes (149,945) (149,945) (299,869) (297,810)<br />
Term loans (20,000) (20,000) (32,000) (33,620)<br />
Unrecognised gain – 439<br />
Company<br />
Financial liabilities<br />
Medium-term notes – – (150,000) (150,000)<br />
Unrecognised loss – –<br />
The fair value of the medium-term notes is based on their listed market prices.<br />
f. Capital management<br />
The Group aims to maintain a strong capital base so as to maintain investor, creditor and market confidence and<br />
to sustain future development and growth of its businesses, while at the same time maintaining an appropriate<br />
dividend policy to reward shareholders. The Group monitors Economic Value Added attributable to shareholders,<br />
which the Group defines as net operating profit after tax less capital charge excluding minority interests.<br />
Management also monitors the level of dividends to ordinary shareholders.<br />
The Group seeks to maintain a balance between the higher returns that might be possible with higher levels of<br />
borrowings and the advantages and security afforded by a sound capital position. The Group records a net cash<br />
position as at December 31, 2008 (2007: net gearing ratio of 0.01).<br />
40. CONTINGENT LIABILITIES (UNSECURED)<br />
Group<br />
Group<br />
2008 2007<br />
Note S$’000 S$’000<br />
Outstanding litigation – 73,117<br />
Guarantees given to banks to secure banking facilities provided to:<br />
– Associates and joint ventures (a) – 197,209<br />
– Others 7,441 –<br />
40. CONTINGENT LIABILITIES (UNSECURED) (cont’d)<br />
Group (cont’d)<br />
a. In consideration of a consortium of banks making available to Emirates <strong>Sembcorp</strong> Water & Power Company P.J.S.C<br />
(“ESWPC”) (a private joint stock company incorporated under the laws of the United Arab Emirates and the Emirate<br />
of Fujairah) a US$220 million equity bridge loan facility (“EBL”), <strong>Sembcorp</strong> Utilities Pte Ltd (“SCU”) guarantees the<br />
payment of its proportionate 40% share of the sums relating to the EBL by ESWPC to the banks. The aggregate<br />
liability of SCU, including outstanding interest, shall not exceed an amount of US$90.6 million.<br />
Additionally, in consideration of the contracting banks entering into interest rate swap hedging agreements<br />
relating to the EBL (“EBH”) with ESWPC, SCU guarantees its proportionate 40% share of the amounts falling due<br />
on the EBH, payable by ESWPC to the banks. The aggregate liability of SCU shall not exceed an amount of US$6.5<br />
million. The maturity date for these hedging agreements is on February 1, 2009.<br />
At balance sheet date, as the Group has provided the guarantee, the Group has accordingly taken up its share of<br />
the net liability of an ESWPC of S$139.6 million (2007: S$49.3 million).<br />
b. A Wayleave Agreement was entered into between SembGas and the Government of Singapore with respect<br />
to certain pipelines where SembGas would indemnify the Government of Singapore against all claims, actions,<br />
demands, proceedings, liabilities, damages, costs and expenses arising out of or in connection with any occurrence<br />
during the use, maintenance or operations of these pipelines. No such claim has arisen to date.<br />
c. A subsidiary, <strong>Sembcorp</strong> Air Products (Hyco) Pte Ltd’s (“SembAP”) Synthesis Gas and Hydrogen Plant had an<br />
unplanned shutdown from June 26, 2008 to August 4, 2008 which gave rise to a claim by its main customer for<br />
termination based on non-supply of synthesis gas and hydrogen during this period. SembAP is disputing the claim<br />
on the basis that the shutdown was an event of force majeure and accordingly no provision has been made for the<br />
claim pending resolution of the dispute.<br />
Company<br />
a. The Company has provided guarantees to banks to secure banking facilities provided to a wholly-owned subsidiary,<br />
<strong>Sembcorp</strong> Financial Services Pte Ltd. These financial guarantee contracts are accounted for as insurance contracts.<br />
The principal risk to which the Company is exposed is credit risk in connection with the guarantee contracts it<br />
has issued. The credit risk represents the loss that would be recognised upon a default by the parties to which<br />
the guarantees were given on behalf of. To mitigate these risks, management continually monitors the risks and<br />
has established processes including performing credit evaluations of the parties it is providing the guarantee on<br />
behalf of.<br />
There are no terms and conditions attached to the guarantee contracts that would have a material effect on the<br />
amount, timing and uncertainty of the Company’s future cash flows.<br />
Estimates of the Company’s obligation arising from financial guarantee contracts may be affected by future events,<br />
which cannot be predicted with any certainty. The assumptions made may well vary from actual experience so that<br />
the actual liability may vary considerably from the best estimates. As of balance sheet date, there is no provision<br />
made in respect of the obligations.<br />
Performance guarantees granted for contracts awarded to the Group<br />
(including guarantees granted on behalf of associates and joint ventures) 238,596 35,057<br />
204 Delivering Essential Solutions <strong>Sembcorp</strong> Industries Annual Report 2008 205
Notes to the<br />
Financial Statements<br />
Year Ended December 31, 2008<br />
40. CONTINGENT LIABILITIES (UNSECURED) (cont’d)<br />
Company (cont’d)<br />
a. Intra-group financial guarantees comprise guarantees granted by the Company to banks in respect of banking<br />
facilities amounting to S$1,239 million (2007: S$1,265 million), of which S$200 million was drawn down as at<br />
balance sheet dates. The periods in which the financial guarantees expire are as follows:<br />
Company<br />
2008 2007<br />
Less than 1 year 1,239,063 1,064,922<br />
Between 1 to 5 years – 200,000<br />
1,239,063 1,264,922<br />
b. The Company has provided a corporate guarantee to a subsidiary, SembCogen which entered into a long-term<br />
contract (“End User Agreement”) with a fellow subsidiary, SembGas to purchase natural gas over the period of 22<br />
years with effect from 1999.<br />
Under the End User Guarantee Agreement, the Company and one of its subsidiaries, <strong>Sembcorp</strong> Utilities Pte Ltd,<br />
issued corporate guarantees in favour of SembGas for 70% and 30% respectively of SembCogen’s obligations<br />
under the End User Agreement.<br />
41. COMMITMENTS<br />
Commitments not provided for in the financial statements are as follows:<br />
S$’000<br />
Group<br />
S$’000<br />
2008 2007<br />
Capital expenditure for:<br />
– Commitments in respect of contracts placed 56,502 56,961<br />
– Amounts approved by directors but not contracted 121,988 122,720<br />
– Uncalled capital and commitments to subscribe for additional shares in investments 137,870 123,220<br />
316,360 302,901<br />
At the balance sheet date, commitments in respect of payments for non-cancellable operating leases with a term of<br />
more than one year are as follows:<br />
Group<br />
S$’000<br />
Company<br />
S$’000<br />
2008 2007 2008 2007<br />
S$’000 S$’000 S$’000 S$’000<br />
Lease payments due:<br />
Within 1 year 24,447 25,774 6,213 808<br />
Between 1 and 5 years 40,696 49,462 18,019 –<br />
After 5 years 79,629 84,430 36,260 –<br />
144,772 159,666 60,492 808<br />
41. COMMITMENTS (cont’d)<br />
i. On January 15, 1999, <strong>Sembcorp</strong> Gas Pte Ltd (“SembGas”) entered into a long-term Gas Sales Agreement to purchase<br />
natural gas over a period of 22 years. SembGas also entered into agreements with certain customers for the on-sale<br />
of this gas, which agreements incorporated provisions, which specifically deal with, inter-alia, SembGas’ liability for<br />
shortfalls in deliveries of gas and relief from such liability in certain circumstances.<br />
ii. On April 15, 2008, SembGas entered into another agreement (which agreement became unconditional and<br />
effective as of October 31, 2008) to import natural gas over a period of 15 years, with first delivery of gas targeted<br />
to take place between 2010 and 2011.<br />
The Group leases out its investment properties. Non-cancellable operating lease rentals are receivable as follows:<br />
Group<br />
2008 2007<br />
Lease receivable:<br />
Within 1 year 3,097 2,484<br />
Between 1 and 5 years 4,848 3,952<br />
7,945 6,436<br />
42. SEGMENT REPORTING<br />
Segment information is presented in respect of the Group’s business and geographical segments. The business segments<br />
are based on the Group’s management and internal reporting structure.<br />
Inter-segment pricing is determined on mutually agreed terms.<br />
Segment results, assets and liabilities include items directly attributable to a segment as well as those that can be<br />
allocated on a reasonable basis.<br />
a. Business Segments<br />
The Group comprises the following main business segments:<br />
The Utilities segment’s principal activities are in provision of centralised utilities, energy and water. It offers<br />
industrial utilities and services such as energy, steam, industrial water and wastewater treatment to energy<br />
intensive users. It operates in Singapore, the United Kingdom, China, Vietnam and the United Arab Emirates.<br />
The Marine segment focuses on repair, building and conversion of ships and rigs, and on offshore engineering.<br />
The Environment segment provides integrated waste management services and undertakes waste-to-resource<br />
businesses in the Asia Pacific region.<br />
The Industrial Parks segment owns, develops, markets and manages industrial parks and townships in Asia.<br />
Others / Corporate segment comprises businesses relating to minting, design and construction activities, offshore<br />
engineering and the corporate companies.<br />
b. Geographical Segments<br />
The Group operates in three principal geographical areas, Singapore, Europe and the Rest of Asia. In presenting<br />
information on the basis of geographical segments, segment revenue is based on the geographical location of<br />
customers. Segment assets are based on the geographical location of the assets.<br />
S$’000<br />
S$’000<br />
206 Delivering Essential Solutions <strong>Sembcorp</strong> Industries Annual Report 2008 207
Notes to the<br />
Financial Statements<br />
Year Ended December 31, 2008<br />
42. SEGMENT REPORTING (cont’d)<br />
a. Business Segments<br />
Industrial Others /<br />
Utilities Marine Environment Parks Corporate Elimination Total<br />
S$’000 S$’000 S$’000 S$’000 S$’000 S$’000 S$’000<br />
42. SEGMENT REPORTING (cont’d)<br />
a. Business Segments (cont’d)<br />
Industrial Others /<br />
Utilities Marine Environment Parks Corporate Elimination Total<br />
S$’000 S$’000 S$’000 S$’000 S$’000 S$’000 S$’000<br />
2008<br />
Turnover<br />
External sales 4,477,509 5,061,032 213,762 16,233 159,877 – 9,928,413<br />
Inter-segment sales 38,912 2,916 3,038 2,618 26,177 (73,661) –<br />
Total 4,516,421 5,063,948 216,800 18,851 186,054 (73,661) 9,928,413<br />
Results<br />
Segment results 289,866 467,031 (9,819) 7,575 (10,169) – 744,484<br />
Interest income 10,263 25,130 221 1,329 28,670 (29,841) 35,772<br />
Interest expense (40,725) (11,370) (2,366) 609 (20,396) 29,841 (44,407)<br />
259,404 480,791 (11,964) 9,513 (1,895) – 735,849<br />
Share of results<br />
of associates 568 55,304 16,590 8,410 – – 80,872<br />
Share of results<br />
of joint ventures 15,920 8,174 – 18,753 2,377 – 45,224<br />
275,892 544,269 4,626 36,676 482 – 861,945<br />
Income tax<br />
(expense) / credit (46,655) (91,937) (877) (460) 8,978 – (130,951)<br />
Minority interests (28,925) (188,641) (1,618) (4,667) (82) – (223,933)<br />
Profit for the year 200,312 263,691 2,131 31,549 9,378 – 507,061<br />
Assets<br />
Segment assets 2,865,194 4,331,584 162,884 195,780 941,664 (1,170,313) 7,326,793<br />
Interests in associates 5 249,086 43,139 272,158 – – 564,388<br />
Interests in joint ventures 110,387 36,409 1,097 74,854 58,069 – 280,816<br />
Tax assets 24,504 14,129 4,730 14,809 236,941 – 295,113<br />
Total assets 3,000,090 4,631,208 211,850 557,601 1,236,674 (1,170,313) 8,467,110<br />
Liabilities<br />
Segment liabilities 1,824,956 3,018,813 80,586 33,641 892,728 (1,170,313) 4,680,411<br />
Tax liabilities 218,466 232,510 6,880 14,537 49,449 – 521,842<br />
Total liabilities 2,043,422 3,251,323 87,466 48,178 942,177 (1,170,313) 5,202,253<br />
Capital expenditure 251,870 104,097 7,345 849 3,982 – 368,143<br />
Significant non-cash items<br />
Depreciation<br />
and amortisation 106,742 71,578 9,554 1,962 5,233 – 195,069<br />
Other non-cash items<br />
(including provisions,<br />
loss on disposal and<br />
exchange differences) 8,158 97,531 462 4,681 793 – 111,625<br />
2007<br />
Turnover<br />
External sales 3,736,082 4,511,582 205,074 23,335 142,705 – 8,618,778<br />
Inter-segment sales 29,506 1,541 2,415 2,502 4,522 (40,486) –<br />
Total 3,765,588 4,513,123 207,489 25,837 147,227 (40,486) 8,618,778<br />
Results<br />
Segment results 302,056 277,002 1,680 55,418 4,970 – 641,126<br />
Interest income 16,901 21,486 725 3,349 28,134 (23,886) 46,709<br />
Interest expense (40,940) (13,692) (2,275) – (20,904) 23,886 (53,925)<br />
278,017 284,796 130 58,767 12,200 – 633,910<br />
Share of results<br />
of associates 2,289 68,133 16,946 9,485 – – 96,853<br />
Share of results<br />
of joint ventures 23,980 5,515 (1,868) 19,631 9,085 – 56,343<br />
304,286 358,444 15,208 87,883 21,285 – 787,106<br />
Income tax<br />
(expense) / credit (59,160) (103,929) (1,199) (10,124) 38,648 – (135,764)<br />
Minority interests (14,899) (104,152) (364) (5,055) (655) – (125,125)<br />
Profit for the year 230,227 150,363 13,645 72,704 59,278 – 526,217<br />
Assets<br />
Segment assets 2,952,750 4,250,332 211,662 201,623 695,349 (641,074) 7,670,642<br />
Interests in associates 5 193,368 54,929 267,185 – – 515,487<br />
Interests in joint ventures 119,817 28,020 1,097 69,528 51,927 – 270,389<br />
Tax assets 36,544 5,086 3,468 13,453 194,263 – 252,814<br />
Total assets 3,109,116 4,476,806 271,156 551,789 941,539 (641,074) 8,709,332<br />
Liabilities<br />
Segment liabilities 1,714,207 2,469,233 124,765 36,521 620,979 (641,074) 4,324,631<br />
Tax liabilities 243,449 287,809 4,910 17,802 702 – 554,672<br />
Total liabilities 1,957,656 2,757,042 129,675 54,323 621,681 (641,074) 4,879,303<br />
Capital expenditure 324,125 106,764 25,434 185 3,142 – 459,650<br />
Significant non-cash items<br />
Depreciation<br />
and amortisation 102,672 64,441 7,291 2,800 5,655 – 182,859<br />
Other non-cash items<br />
(including provisions,<br />
loss on disposal and<br />
exchange differences) 5,591 10,293 1,052 8,380 3,037 – 28,353<br />
208 Delivering Essential Solutions <strong>Sembcorp</strong> Industries Annual Report 2008 209
Notes to the<br />
Financial Statements<br />
Year Ended December 31, 2008<br />
42. SEGMENT REPORTING (cont’d)<br />
b. Geographical Segments<br />
Singapore Rest of Asia Europe Others Consolidated<br />
S$’000 S$’000 S$’000 S$’000 S$’000<br />
2008<br />
Revenue from external customers 5,415,489 1,691,070 2,194,717 627,137 9,928,413<br />
Total assets 6,843,700 959,358 633,638 30,414 8,467,110<br />
Segment assets 6,335,017 338,649 622,713 30,414 7,326,793<br />
Capital expenditure 187,166 118,328 62,465 184 368,143<br />
2007<br />
Revenue from external customers 4,176,229 1,139,538 3,019,328 283,683 8,618,778<br />
Total assets 6,878,175 849,204 928,626 53,327 8,709,332<br />
Segment assets 6,411,462 297,798 910,273 51,109 7,670,642<br />
Capital expenditure 245,588 63,698 149,937 427 459,650<br />
43. SIGNIFICANT ACCOUNTING ESTIMATES AND JUDGEMENTS<br />
Estimates, assumptions concerning the future and judgements are made in the preparation of the financial statements.<br />
They affect the application of the Group’s accounting policies, reported amounts of assets, liabilities, income and<br />
expenses, and disclosures made. They are assessed on an on-going basis and are based on experience and relevant<br />
factors, including expectations of future events that are believed to be reasonable under the circumstances.<br />
Key sources of estimation uncertainty<br />
The key assumptions concerning the future and other key sources of estimation uncertainty at the balance sheet date,<br />
that have a significant risk of causing a material adjustment to the carrying amounts of assets and liabilities within the<br />
next financial year are discussed below.<br />
Information on other significant areas of estimation uncertainty and critical judgements in applying accounting<br />
policies that have the most significant effect on the amount recognised in the financial statements are described in<br />
the following notes:<br />
a. Impairment of goodwill<br />
The Group determines whether goodwill is impaired at least on an annual basis. This requires an estimation of the<br />
value in use of the cash-generating units to which the goodwill is allocated. Estimating the value in use requires<br />
the Group to make an estimate of the expected future cash flows from the cash-generating unit and also to<br />
choose a suitable discount rate in order to calculate the present value of those cash flows. Information about the<br />
assumptions and their risk factors relating to goodwill impairment are disclosed in Note 16.<br />
b. Income taxes<br />
The Group is subject to income taxes in numerous jurisdictions. Significant judgement is involved in determining<br />
the group-wide provision for income taxes. There are certain transactions and computation for which the ultimate<br />
tax determination is uncertain during the ordinary course of business. The Group recognises liabilities for expected<br />
tax issues based on estimates of whether additional taxes will be due. Where the final tax outcome of these<br />
matters is different from the amounts that were initially recorded, such differences will impact the income taxes<br />
and deferred tax provisions in the period in which such determination is made.<br />
43. SIGNIFICANT ACCOUNTING ESTIMATES AND JUDGEMENTS (cont’d)<br />
c. Pension assumptions<br />
The Group has decided on certain principal actuarial assumptions, as detailed in Note 28, in estimating its pension<br />
liability as at the balance sheet date. If there were adverse changes to these actuarial assumptions, then the<br />
Group’s unrecognised actuarial losses would increase with the risk that they would fall outside the corridor and<br />
would need to be recognised in the income statement.<br />
d. Depreciation of property, plant and equipment<br />
Property, plant and equipment are depreciated on a straight-line basis over their estimated useful lives.<br />
Management estimates the useful lives of these property, plant and equipment to be within 1 to 60 years. The<br />
carrying amount of the Group’s property, plant and equipment are set out in Note 6. Changes in the expected level<br />
of usage and technological developments could impact the economic useful lives and the residual values of these<br />
assets, therefore future depreciation charges could be revised.<br />
Critical accounting judgements in applying the Group’s accounting policies<br />
In the process of applying the Group’s accounting policies, management has made certain judgements, apart from<br />
those involving estimations, which have significant effect on the amounts recognised in the financial statements.<br />
a. Revenue recognition<br />
The Group has recognised revenue on construction contract, ship and rig repair, building and conversion based on<br />
the percentage of completion method in proportion to the stage of completion. The percentage of completion is<br />
assessed by reference to surveys of work performed. Significant judgement is required in determining the appropriate<br />
stage of completion and estimating a reasonable contribution margin for revenue and costs recognition.<br />
b. Impairment of investments and financial assets<br />
The Group follows the guidance of FRS 39 Financial Instruments: Recognition and Measurement on determining<br />
when an investment or financial asset is other than temporarily impaired. This determination requires significant<br />
judgement. The Group evaluates, among other factors, the duration and extent to which the fair value of an<br />
investment and financial asset is less than its cost; and the financial health of and near-term business outlook for<br />
the investment of financial asset, including factors such as industry and sector performance, changes in technology<br />
and operational and financing cash flow.<br />
44. SUBSEQUENT EVENTS<br />
a. In February 2009, the Group repaid US$88 million, which is the Group’s proportionate 40% share of the US$220<br />
million EBL taken by ESWPC. The US$88 million repayment represented an injection of approximately US$44<br />
million as equity interest into ESWPC and the remaining as a shareholder’s loan to ESWPC.<br />
b. Our subsidiary, <strong>Sembcorp</strong> Marine Ltd (“SCM”) acquired the remaining 30% equity interest in JPL Corporation Pte<br />
Ltd (“JPLC”) from its minority shareholders for a consideration of S$13,428,000.<br />
45. COMPARATIVE INFORMATION<br />
Certain comparatives in the financial statements have been changed from the previous year to be consistent with<br />
current year’s presentation.<br />
210 Delivering Essential Solutions <strong>Sembcorp</strong> Industries Annual Report 2008 211
Notes to the<br />
Financial Statements<br />
Year Ended December 31, 2008<br />
46. NEW OR REVISED ACCOUNTING STANDARDS AND INTERPRETATIONS<br />
The Group has not applied the following accounting standards (including their consequential amendments) and<br />
interpretations that have been issued as of the balance sheet date but are not yet effective:<br />
FRS 1 (revised 2008) Presentation of Financial Statements<br />
FRS 23 (revised 2007) Borrowing Costs<br />
Amendments to FRS 32 Financial Instruments: Presentation and FRS 1 Presentation of Financial Statements<br />
– Puttable Financial Instruments and Obligations Arising on Liquidation<br />
Amendments to FRS 39 Financial Instruments: Recognition and Measurement<br />
– Amendment relating to eligible hedged items<br />
Amendments to FRS 101 First-time Adoption of Financial Reporting Standards and FRS 27 Consolidated and Separate<br />
Financial Statements – Cost of an Investment in a Subsidiary, Jointly Controlled Entity or Associate<br />
Amendments to FRS 102 Share-based Payment – Vesting Conditions and Cancellations<br />
FRS 108<br />
Operating Segments<br />
Improvements to FRSs<br />
INT FRS 113<br />
Customer Loyalty Programmes<br />
INT FRS 116<br />
Hedges of a Net Investment in a Foreign Operation<br />
FRS 1 (revised 2008) will become effective for the Group’s financial statements for the year ending December 31,<br />
2009. The revised standard requires an entity to present, in a statement of changes in equity, all owner changes in<br />
equity. All non-owner changes in equity (i.e. comprehensive income) are required to be presented in one statement of<br />
comprehensive income or in two statements (a separate income statement and a statement of comprehensive income).<br />
Components of comprehensive income are not permitted to be presented in the statement of changes in equity. In<br />
addition, a statement of financial position is required at the beginning of the earliest comparative period following a<br />
change in accounting policy, the correction of an error or the reclassification of items in the financial statements. FRS<br />
1 (revised 2008) does not have any impact on the Group’s financial position or results.<br />
FRS 23 (revised 2007) will become effective for financial statements for the year ending December 31, 2009. FRS 23<br />
(revised 2007) removes the option to expense borrowing costs and requires an entity to capitalise borrowing costs<br />
directly attributable to the acquisition, construction or production of a qualifying asset as part of the cost of that asset.<br />
The Group’s current policy to capitalise borrowing costs is consistent with the requirement in the revised FRS 23.<br />
The amendments to FRS 32 and FRS 1 on puttable financial instruments will become effective for the Group’s financial<br />
statements for the year ending December 31, 2009. The amendments allow certain instruments that would normally be<br />
classified as liabilities to be classified as equity if and only if they meet certain conditions. The Group does not issue such<br />
puttable financial instruments and thus the application of these amendments is not expected to have any significant<br />
impact on the Group’s financial statements.<br />
46. NEW OR REVISED ACCOUNTING STANDARDS AND INTERPRETATIONS (cont’d)<br />
The amendments to FRS 102 on vesting conditions and cancellations will become effective for the Group’s financial<br />
statements for the year ending December 31, 2009. The amendments clarify the definition of vesting conditions and<br />
provide the accounting treatment for non-vesting conditions and cancellations. The application of these amendments<br />
is not expected to have any significant impact on the Group’s financial statements.<br />
FRS 108 will become effective for financial statements for the year ending December 31, 2009. FRS 108, which replaces<br />
FRS 14 Segment Reporting, requires identification and reporting of operating segments based on internal reports that<br />
are regularly reviewed by the Group’s chief operating decision maker in order to allocate resources to the segment and<br />
to assess its performance. Currently, the Group presents segment information in respect of its business and geographical<br />
segments. The adoption of FRS 108 is not expected to have any impact to the Group.<br />
Improvements to FRSs 2008 will become effective for the Group’s financial statements for the year ending December<br />
31, 2009, except for the amendment to FRS 105 Non-current Assets Held for Sale and Discontinued Operations which<br />
will become effective for the year ending December 31, 2010. Improvements to FRSs 2008 contain amendments to<br />
numerous accounting standards that result in accounting changes for presentation, recognition or measurement<br />
purposes and terminology or editorial amendments. The Group is in the process of assessing the impact of these<br />
amendments.<br />
INT FRS 113 will become effective for the Group’s financial statements for the year ending December 31, 2009. INT FRS 113<br />
concludes that where entities grant award credits as incentives to customers to buy their goods or services (e.g. loyalty<br />
points or free products), such customer loyalty programmes should be accounted for by taking a multiple sales approach,<br />
i.e. by deferring some of the revenue received from the initial sales transaction, to be recognised as revenue as and<br />
when the entity provides the goods or services promised under the customer loyalty programmes. The application of this<br />
Interpretation is not expected to have any significant impact on the Group’s financial statements.<br />
INT FRS 116 will become effective for the Group’s financial statements for the year ending December 31, 2009. INT FRS<br />
116 provides guidance on identifying foreign currency risks and hedging instruments that qualify for hedge accounting<br />
in the hedge of a net investment in a foreign operation. It also explains how an entity should determine the amounts<br />
to be reclassified from equity to profit or loss for both the hedging instrument and the hedged item. The application<br />
of this Interpretation is not expected to have any significant impact on the Group’s financial statements.<br />
Other than the changes in disclosures relating to FRS 1, the initial application of these standards (including their<br />
consequential amendments) and interpretations is not expected to have any material impact on the Group’s financial<br />
statements. The Group has not considered the impact of accounting standards issued after the balance sheet date.<br />
The amendments to FRS 39 on eligible hedged items will become effective for the Group’s financial statements for the<br />
year ending December 31, 2010. The amendments clarify how the principles that determine whether a hedged risk<br />
or portion of cash flows is eligible for designation should be applied in 2 particular situations: (i) the designation of a<br />
one-sided risk in a hedged item; and (ii) the designation of inflation in particular situations. The Group is in the process<br />
of assessing the impact of these amendments.<br />
The amendments to FRS 101 and FRS 27 on the cost of an investment in a subsidiary, jointly controlled entity or associate<br />
will become effective for the Company’s financial statements for the year ending December 31, 2009. The amendments<br />
remove the definition of “cost method” currently set out in FRS 27, and instead require an entity to recognise all<br />
dividend from a subsidiary, jointly controlled entity or associate as income in its separate financial statements when<br />
its right to receive the dividend is established. The application of these amendments is not expected to have any<br />
significant impact on the Company’s financial statements.<br />
212 Delivering Essential Solutions <strong>Sembcorp</strong> Industries Annual Report 2008 213
Notes to the<br />
Financial Statements<br />
Year Ended December 31, 2008<br />
47. SUBSIDIARIES<br />
Details of significant subsidiaries are as follows:<br />
48. ASSOCIATES AND JOINT VENTURES<br />
Details of significant associates and joint ventures are as follows:<br />
Effective equity<br />
held by the Group<br />
Country of 2008 2007<br />
Name of significant subsidiaries incorporation % %<br />
Utilities<br />
<strong>Sembcorp</strong> Utilities Pte Ltd Singapore 100 100<br />
<strong>Sembcorp</strong> Cogen Pte Ltd Singapore 100 100<br />
<strong>Sembcorp</strong> Gas Pte Ltd Singapore 70 70<br />
<strong>Sembcorp</strong> Air Products (Hyco) Pte Ltd Singapore 60 60<br />
<strong>Sembcorp</strong> Utilities (UK) Limited The United Kingdom 100 100<br />
Marine<br />
<strong>Sembcorp</strong> Marine Ltd Singapore 61.55 60.86<br />
Jurong Shipyard Pte Ltd Singapore 61.55 60.86<br />
PPL Shipyard Pte Ltd Singapore 52.32 51.73<br />
Sembawang Shipyard Pte Ltd Singapore 61.55 60.86<br />
SMOE Pte Ltd Singapore 61.55 60.86<br />
Environment<br />
<strong>Sembcorp</strong> Environment Pte. Ltd. (formerly known<br />
as <strong>Sembcorp</strong> Environmental Management Pte. Ltd.) Singapore 100 100<br />
SembWaste Pte Ltd Singapore 100 100<br />
Industrial Parks<br />
<strong>Sembcorp</strong> Industrial Parks Ltd (formerly known<br />
as <strong>Sembcorp</strong> Parks Holdings Ltd) Singapore 100 100<br />
Others<br />
<strong>Sembcorp</strong> Design and Construction Pte Ltd Singapore 100 100<br />
<strong>Sembcorp</strong> Financial Services Pte Ltd Singapore 100 100<br />
Singapore Precision Industries Pte Ltd Singapore 100 100<br />
KPMG LLP is the auditor of the significant Singapore incorporated subsidiaries and other member firms of KPMG<br />
International are auditors of the significant foreign incorporated subsidiaries.<br />
Effective equity<br />
held by the Group<br />
Country of 2008 2007<br />
Name of significant associates and joint ventures incorporation % %<br />
Utilities<br />
^<br />
Phu My 3 BOT Power Company Ltd Vietnam 33.33 33.33<br />
#<br />
Shanghai Cao Jing Cogeneration Co. Ltd People’s Republic of China 30.00 30.00<br />
@<br />
Shenzhen Chiwan Sembawang Engineering Co Ltd People’s Republic of China 32.00 32.00<br />
*<br />
Emirates <strong>Sembcorp</strong> Water & Power Company P.J.S.C United Arab Emirates 40.00 40.00<br />
Marine<br />
@@<br />
COSCO Shipyard Group People’s Republic of China 18.47 18.26<br />
Environment<br />
^^<br />
SembSITA Pacific Pte Ltd Singapore 40.00 40.00<br />
Industrial Parks<br />
**<br />
Gallant Venture Ltd Singapore 23.92 23.92<br />
##<br />
Vietnam Singapore Industrial Park JV Co Ltd Vietnam 40.44 40.44<br />
^^^<br />
Wuxi Singapore Industrial Park Development Co. Ltd People’s Republic of China 45.36 45.36<br />
The auditors of significant associates and joint ventures are as follows:<br />
^ Audited by Ernst & Young Vietnam Limited<br />
# Audited by PricewaterhouseCoopers Zhong Tian CPAs Limited Company<br />
@ Audited by BDO Shenzhen Dahua Tiancheng Certified Public Accountants<br />
* Audited by Ernst & Young, Abu Dhabi<br />
@@ Audited by Zhongrui Yuehua Certified Public Accountants Co., Ltd<br />
^^ Audited by Ernst & Young LLP<br />
** The consolidated financial statements of Gallant Venture Ltd, a company listed on Singapore Exchange, and its subsidiaries are audited by Foo,<br />
Kon & Tan Grant Thornton<br />
## Audited by KPMG Limited, Vietnam<br />
^^^ Audited by KPMG Huazhen Shanghai Branch<br />
214 Delivering Essential Solutions <strong>Sembcorp</strong> Industries Annual Report 2008 215
Supplementary<br />
Information<br />
Year Ended December 31, 2008<br />
(UNDER SGX-ST LISTING MANUAL REQUIREMENTS)<br />
A. DIRECTORS’ AND KEY EXECUTIVES’ REMUNERATION<br />
Summary compensation table for the year ended December 31, 2008<br />
(UNDER SGX-ST LISTING MANUAL REQUIREMENTS)<br />
B. INTERESTED PERSON TRANSACTIONS<br />
Interested person transactions carried out during the financial year which fall under Chapter 9 of the Listing Manual<br />
of the Singapore Exchange Securities Trading Limited (“SGX-ST”) are as follows:<br />
Taxable<br />
income from<br />
share-based<br />
Salary 1 compensation 2 Bonus 3 Directors’ fees Total<br />
Name of Director S$ S$ S$ S$ S$<br />
Peter Seah Lim Huat – 21,350 – 185,000 206,350<br />
Tang Kin Fei 869,041 3,992,632 3,992,215 – 8,853,888<br />
Goh Geok Ling – 40,688 – 113,000 153,688<br />
Richard Hale, OBE – 113,925 – 137,000 250,925<br />
Yong Ying-I – – – 103,000 103,000<br />
Evert Henkes – – – 100,000 100,000<br />
Lee Suet Fern – 48,650 – 115,000 163,650<br />
Bobby Chin Yoke Choong – – – 8,250 8,250<br />
K Shanmugam – 368,938 – 40,000 408,938<br />
869,041 4,586,183 3,992,215 801,250 10,248,689<br />
Taxable<br />
income from<br />
share-based<br />
Salary 1 compensation 2 Bonus 3 Total<br />
Name of Key Executive S$ S$ S$ S$<br />
Low Sin Leng 522,663 1,159,046 1,588,495 3,270,204<br />
Tan Cheng Guan 4 553,375 – 147,864 701,239<br />
Paul Gavens 517,976 361,005 269,389 1,148,370<br />
Ngiam Joke Mui 490,063 630,408 1,435,288 2,555,759<br />
Tan Kwi Kin 782,825 4,279,973 60,000 5,122,798<br />
Wong Weng Sun 399,298 1,201,995 30,000 1,631,293<br />
3,266,200 7,632,427 3,531,036 14,429,663<br />
Notes:<br />
1. The salary amount shown is inclusive of allowances, employer CPF, all fees other than directors’ fee and other emoluments.<br />
2. Taxable income from share-based compensation for the Directors and Key Executives are from the Company and a listed subsidiary’s sharebased<br />
compensation during the year. These relate to taxable gains and are not charged to the income statement.<br />
3. The bonus amount shown includes AWS, discretionary bonus and performance target bonus paid during the year.<br />
4. Mr Tan Cheng Guan joined the Company on July 1, 2007. His bonus relates to the period from July 1, 2007 till December 31, 2007. There is no<br />
taxable income from share-based compensation for Tan Cheng Guan as share plans granted to him have not yet vested.<br />
Details on the share options, performance shares and restricted stocks granted to the directors are set out in the Sharebased<br />
Incentive Plans of the Directors’ Report.<br />
Aggregate value of all interested person transactions conducted under a shareholders’ mandate<br />
pursuant to Rule 920 of the SGX-ST Listing Manual (excluding transactions less than S$100,000)<br />
Sale of goods and services<br />
Temasek Holdings (Private) Limited and its Associates<br />
– Tuas Power Ltd / PowerSeraya Limited 1 200,333<br />
– Temasek Capital (Private) Limited and its Associates 20,895<br />
– MediaCorp Pte Ltd and its Associates 5,432<br />
– PSA International Pte Ltd and its Associates 50,061<br />
– National University Hospital (S) Pte Ltd and its Associates 211<br />
– Singapore Power Ltd and its Associates 574<br />
– Certis Cisco Security Pte Ltd 1,832<br />
– Wildlife Reserves Singapore Pte Ltd and its Associates 530<br />
– Singapore Technologies Telemedia Pte Ltd and its Associates 877<br />
– Senoko Power Ltd 849<br />
– Mapletree Investments Pte Ltd and its Associates 6,148<br />
287,742<br />
Starhub Ltd and its Associates 8,900<br />
Singapore Airlines Limited and its Associates 7,660<br />
SNP Corporation Ltd and its Associates 492<br />
Singapore Food Industries Ltd and its Associates 233<br />
Singapore Telecommunications Ltd and its Associates 363<br />
SMRT Corporation Ltd and its Associates 418<br />
305,808<br />
Purchase of goods and services<br />
Temasek Holdings (Private) Limited and its Associates<br />
– Temasek Capital (Private) Limited and its Associates 2 822,952<br />
– Singapore Power Ltd and its Associates 6,596<br />
– Surbana Corporation Pte Ltd and its Associates 222<br />
829,770<br />
Singapore Technologies Engineering Ltd and its Associates 8,578<br />
CapitaLand Ltd and its Associates 415<br />
838,763<br />
Total interested person transactions 1,144,571<br />
Notes:<br />
1. This relates mainly to the sale of gas by <strong>Sembcorp</strong> Gas Pte Ltd to Tuas Power Ltd and PowerSeraya Limited for the generation of electricity.<br />
2. This relates mainly to the purchase of gas by <strong>Sembcorp</strong> Cogen Pte Ltd from <strong>Sembcorp</strong> Gas Pte Ltd for the generation of electricity.<br />
There was no transaction which was not conducted under the shareholders’ mandate pursuant to Rule 920 of the SGX<br />
Listing Manual during the period January 1, 2008 to December 31, 2008.<br />
2008<br />
S$’000<br />
216 Delivering Essential Solutions <strong>Sembcorp</strong> Industries Annual Report 2008 217
EVA<br />
Statement<br />
Year Ended December 31, 2008<br />
2008 2007<br />
Note S$’000 S$’000<br />
Net operating profit before income tax expense 735,849 633,910<br />
Adjust for:<br />
Share of associates’ and joint ventures’ profits 139,846 174,631<br />
Interest expense 1 47,521 57,783<br />
Others 2 5,199 2,397<br />
Adjusted profit before interest and tax 928,415 868,721<br />
Cash operating taxes 3 (104,536) (138,242)<br />
Net operating profit after tax (NOPAT) 823,879 730,479<br />
Average capital employed 4 5,419,183 5,158,888<br />
Weighted average cost of capital 5 5.8% 6.1%<br />
Capital charge 313,221 313,372<br />
5. The Weighted Average Cost of Capital is calculated in accordance with <strong>Sembcorp</strong> Industries Ltd Group EVA Policy as<br />
follows:<br />
i. Cost of Equity using Capital Asset Pricing Model with market risk premium at 6.0% (2007: 6.0%);<br />
ii.<br />
Risk-free rate of 2.74% (2007: 3.05%) based on yield-to-maturity of Singapore Government 10-years Bonds;<br />
iii. Ungeared beta ranging from 0.5 to 1.0 (2007: 0.5 to 1.0) based on <strong>Sembcorp</strong> Industries Ltd risk categorisation; and<br />
iv. Cost of Debt rate at 3.53% (2007: 4.12%) using 5-year Singapore Dollar Swap Offer Rate plus 55 basis points (2007:<br />
5-year Singapore Dollar Swap Offer Rate plus 75 basis points).<br />
6. Unusual items (“UI”) refer to divestment of subsidiaries, associates, joint ventures, long-term investments and disposal<br />
of major fixed assets.<br />
Economic Value Added (EVA) 510,658 417,107<br />
Minority share of EVA (174,888) (77,068)<br />
EVA attributable to shareholders 335,770 340,039<br />
Less: Unusual Items (UI) Gains 6 9,810 208,123<br />
EVA attributable to shareholders (exclude UI) 325,960 131,916<br />
Notes:<br />
1. Interest expense includes imputed interest on present value of operating leases and capitalised interest charged to<br />
income statement upon disposal of the assets.<br />
2. Other adjustments include recovery of investment costs, timing difference of allowances made for / (write-back) of<br />
doubtful debts, inventory obsolescence and goodwill written off / impaired and construction-in-progress.<br />
3. The reported current tax is adjusted for the statutory tax impact of interest expense.<br />
4. Monthly average total assets less non interest-bearing liabilities plus timing provision, goodwill written off / impaired<br />
and present value of operating leases.<br />
2008 2007<br />
S$’000<br />
S$’000<br />
Major Capital Components:<br />
Fixed assets 2,757,086 2,740,085<br />
Investments 1,116,191 1,231,615<br />
Other long-term assets 803,711 512,148<br />
Net working capital and long-term liabilities 742,195 675,040<br />
Average capital employed 5,419,183 5,158,888<br />
218 Delivering Essential Solutions <strong>Sembcorp</strong> Industries Annual Report 2008 219
Shareholders’<br />
Information<br />
Corporate<br />
Information<br />
STATISTICS OF SHAREHOLDERS AS OF FEBRUARY 23, 2009<br />
Issued and fully paid-up capital : S$554,036,964.88<br />
Number of issued shares : 1,785,351,540<br />
Number of shareholders : 27,041<br />
Class of shares<br />
: Ordinary shares with equal voting rights @<br />
SHAREHOLDINGS HELD BY THE PUBLIC<br />
Based on information available to the company as of February 23, 2009, 50.26% ** of the issued ordinary shares of the<br />
company is held by the public and therefore, the company has complied with Rule 723 of the SGX-ST Listing Manual.<br />
Substantial Shareholders Direct Interest Indirect Interest Total %**<br />
Temasek Holdings (Private) Limited 871,200,328 12,718,760 * 883,919,088 49.74<br />
TOP 20 SHAREHOLDERS AS OF FEBRUARY 23, 2009<br />
No. Name No. of Ordinary Shares Held %**<br />
1 Temasek Holdings (Private) Limited 871,200,328 49.02<br />
2 DBS Nominees Pte Ltd 255,437,332 14.37<br />
3 DBSN Services Pte Ltd 180,721,777 10.17<br />
4 Citibank Nominees S’pore Pte Ltd 96,436,030 5.43<br />
5 HSBC (Singapore) Nominees Pte Ltd 81,646,098 4.60<br />
6 United Overseas Bank Nominees Pte Ltd 51,336,923 2.89<br />
7 Raffles Nominees Pte Ltd 16,359,849 0.92<br />
8 Startree Investments Pte Ltd 9,400,000 0.53<br />
9 DB Nominees (S) Pte Ltd 7,372,372 0.42<br />
10 OCBC Nominees Singapore Pte Ltd 7,148,367 0.40<br />
11 Morgan Stanley Asia (S’pore) Pte Ltd 5,510,661 0.31<br />
12 Oversea Chinese Bank Nominees Pte Ltd 4,234,550 0.24<br />
13 TM Asia Life Singapore Ltd-Par Fund 3,390,580 0.19<br />
14 Tang Kin Fei 2,354,011 0.13<br />
15 Merrill Lynch (S’pore) Pte Ltd 2,221,621 0.13<br />
16 BNP Paribas Nominees S’pore Pte Ltd 2,187,334 0.12<br />
17 Royal Bank Of Canada (Asia) Ltd 2,118,000 0.12<br />
18 Phillip Securities Pte Ltd 1,671,195 0.09<br />
19 DBS Vickers Securities (S) Pte Ltd 1,361,715 0.08<br />
20 Low Sin Leng 1,314,227 0.07<br />
1,603,422,970 90.23<br />
@<br />
Ordinary shares purchased and held as treasury shares by the Company will have no voting rights.<br />
* Temasek is deemed to be interested in the 12,718,760 shares held by its other subsidiaries.<br />
** The percentage of issued ordinary shares is calculated based on the number of issued ordinary shares of the Company as of February 23, 2009<br />
excluding 8,249,992 ordinary shares held as treasury shares as at that date.<br />
ANALYSIS OF SHAREHOLDINGS AS OF FEBRUARY 23, 2009<br />
Range of Shareholdings No. of Ordinary Shareholders % No. of Ordinary Shares Held %<br />
1 – 999 2,945 10.89 1,642,354 0.09<br />
1,000 – 10,000 21,268 78.65 71,840,590 4.02<br />
10,001 – 1,000,000 2,805 10.37 97,942,364 5.49<br />
1,000,001 and above 23 0.09 1,613,926,232 90.40<br />
27,041 100.00 1,785,351,540 100.00<br />
REGISTERED OFFICE<br />
30 Hill Street #05-04<br />
Singapore 179360<br />
Tel: (65) 6723 3113<br />
Fax: (65) 6822 3254<br />
www.sembcorp.com<br />
BOARD OF DIRECTORS<br />
Peter Seah Lim Huat<br />
Chairman<br />
Tang Kin Fei<br />
Group President & CEO<br />
Goh Geok Ling<br />
Richard Hale, OBE<br />
Yong Ying-I<br />
Evert Henkes<br />
Lee Suet Fern<br />
Bobby Chin Yoke Choong<br />
EXECUTIVE COMMITTEE<br />
Peter Seah Lim Huat<br />
Chairman<br />
Goh Geok Ling<br />
Tang Kin Fei<br />
AUDIT COMMITTEE<br />
Richard Hale, OBE<br />
Chairman<br />
Lee Suet Fern<br />
Yong Ying-I<br />
Bobby Chin Yoke Choong<br />
EXECUTIVE RESOURCE &<br />
COMPENSATION COMMITTEE<br />
Peter Seah Lim Huat<br />
Chairman<br />
Goh Geok Ling<br />
NOMINATING COMMITTEE<br />
Peter Seah Lim Huat<br />
Chairman<br />
Goh Geok Ling<br />
RISK COMMITTEE<br />
Richard Hale, OBE<br />
Chairman<br />
Lee Suet Fern<br />
Yong Ying-I<br />
COMPANY SECRETARY<br />
Kwong Sook May<br />
REGISTRAR<br />
M & C Services<br />
138 Robinson Road #17-00<br />
The Corporate Office<br />
Singapore 068906<br />
Tel: (65) 6227 6660<br />
Fax: (65) 6225 1452<br />
BANKERS<br />
Citibank NA<br />
3 Temasek Avenue #17-00<br />
Centennial Tower<br />
Singapore 039190<br />
DBS Group<br />
6 Shenton Way<br />
DBS Building, Tower 1<br />
Singapore 068809<br />
Mizuho Corporate Bank Ltd<br />
168 Robinson Road #13-00<br />
Capital Tower<br />
Singapore 068912<br />
Oversea-Chinese Banking<br />
Corporation<br />
65 Chulia Street, #10-00<br />
OCBC Centre<br />
Singapore 049513<br />
Standard Chartered Bank<br />
6 Battery Road, #23-00<br />
Singapore 049909<br />
Sumitomo Mitsui Banking Corporation<br />
3 Temasek Avenue #06-01<br />
Centennial Tower<br />
Singapore 039190<br />
The Bank of Tokyo-Mitsubishi UFJ<br />
9 Raffles Place #01-01<br />
Republic Plaza<br />
Singapore 048619<br />
The Hongkong and Shanghai<br />
Banking Corporation<br />
21 Collyer Quay Level 3<br />
HSBC Building<br />
Singapore 049320<br />
United Overseas Bank<br />
80 Raffles Place<br />
UOB Plaza<br />
Singapore 048624<br />
AUDITORS<br />
KPMG LLP<br />
Public Accountants and<br />
Certified Public Accountants<br />
16 Raffles Quay #22-00<br />
Hong Leong Building<br />
Singapore 048581<br />
Partner-in-Charge: Yap Chee Meng<br />
(Appointed during the financial year<br />
ended December 31, 2008)<br />
220 Delivering Essential Solutions <strong>Sembcorp</strong> Industries Annual Report 2008 221