Structural Study through Magnetic and Spectroscopic Properties on ...
Structural Study through Magnetic and Spectroscopic Properties on ...
Structural Study through Magnetic and Spectroscopic Properties on ...

You also want an ePaper? Increase the reach of your titles
YUMPU automatically turns print PDFs into web optimized ePapers that Google loves.
Internati<strong>on</strong>al Journal of<br />
Chemical, Envir<strong>on</strong>mental <str<strong>on</strong>g>and</str<strong>on</strong>g><br />
Pharmaceutical Research<br />
Vol. 2, No.2-3, 83-91<br />
May-December, 2011<br />
<str<strong>on</strong>g>Structural</str<strong>on</strong>g> <str<strong>on</strong>g>Study</str<strong>on</strong>g> <str<strong>on</strong>g>through</str<strong>on</strong>g> <str<strong>on</strong>g>Magnetic</str<strong>on</strong>g> <str<strong>on</strong>g>and</str<strong>on</strong>g> <str<strong>on</strong>g>Spectroscopic</str<strong>on</strong>g> <str<strong>on</strong>g>Properties</str<strong>on</strong>g> <strong>on</strong> PbO-<br />
TiO 2 -B 2 O 3 Glass System Doped with Fe 3+ I<strong>on</strong><br />
T.V. Nagalakshmi 1 , A. Veerabhadra Rao 2 , N.V.V.S. Prasad 1 <str<strong>on</strong>g>and</str<strong>on</strong>g> K.A. Emmanuel 1,*<br />
1 Department of Chemistry, Sir C R Reddy Aut<strong>on</strong>omous College, Eluru-534 007, A.P., India.<br />
2 Department of Physics, Sir C R Reddy Aut<strong>on</strong>omous College, Eluru-534 007, A.P., India.<br />
*E-mail: kaekola@gmail.com<br />
Article History:<br />
Received: 1 June 2011<br />
Accepted: 14 August 2011<br />
ABSTRACT<br />
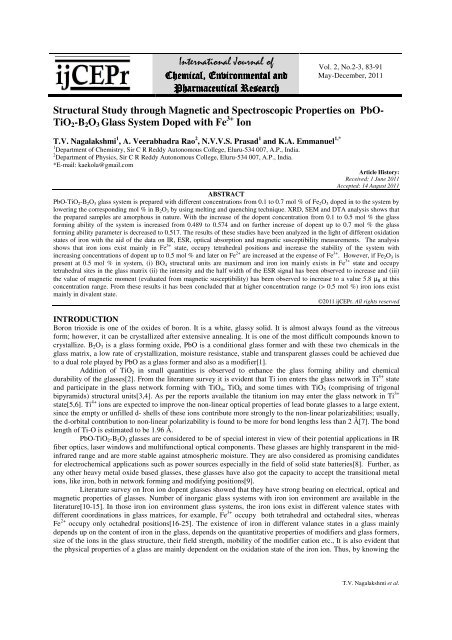
PbO-TiO 2 -B 2 O 3 glass system is prepared with different c<strong>on</strong>centrati<strong>on</strong>s from 0.1 to 0.7 mol % of Fe 2 O 3 doped in to the system by<br />
lowering the corresp<strong>on</strong>ding mol % in B 2 O 3 by using melting <str<strong>on</strong>g>and</str<strong>on</strong>g> quenching technique. XRD, SEM <str<strong>on</strong>g>and</str<strong>on</strong>g> DTA analysis shows that<br />
the prepared samples are amorphous in nature. With the increase of the dopent c<strong>on</strong>centrati<strong>on</strong> from 0.1 to 0.5 mol % the glass<br />
forming ability of the system is increased from 0.489 to 0.574 <str<strong>on</strong>g>and</str<strong>on</strong>g> <strong>on</strong> further increase of dopent up to 0.7 mol % the glass<br />
forming ability parameter is decreased to 0.517. The results of these studies have been analyzed in the light of different oxidati<strong>on</strong><br />
states of ir<strong>on</strong> with the aid of the data <strong>on</strong> IR, ESR, optical absorpti<strong>on</strong> <str<strong>on</strong>g>and</str<strong>on</strong>g> magnetic susceptibility measurements. The analysis<br />
shows that ir<strong>on</strong> i<strong>on</strong>s exist mainly in Fe 3+ state, occupy tetrahedral positi<strong>on</strong>s <str<strong>on</strong>g>and</str<strong>on</strong>g> increase the stability of the system with<br />
increasing c<strong>on</strong>centrati<strong>on</strong>s of dopent up to 0.5 mol % <str<strong>on</strong>g>and</str<strong>on</strong>g> later <strong>on</strong> Fe 2+ are increased at the expense of Fe 3+ . However, if Fe 2 O 3 is<br />
present at 0.5 mol % in system, (i) BO 4 structural units are maximum <str<strong>on</strong>g>and</str<strong>on</strong>g> ir<strong>on</strong> i<strong>on</strong> mainly exists in Fe 3+ state <str<strong>on</strong>g>and</str<strong>on</strong>g> occupy<br />
tetrahedral sites in the glass matrix (ii) the intensity <str<strong>on</strong>g>and</str<strong>on</strong>g> the half width of the ESR signal has been observed to increase <str<strong>on</strong>g>and</str<strong>on</strong>g> (iii)<br />
the value of magnetic moment (evaluated from magnetic susceptibility) has been observed to increase to a value 5.8 µ B at this<br />
c<strong>on</strong>centrati<strong>on</strong> range. From these results it has been c<strong>on</strong>cluded that at higher c<strong>on</strong>centrati<strong>on</strong> range (> 0.5 mol %) ir<strong>on</strong> i<strong>on</strong>s exist<br />
mainly in divalent state.<br />
©2011 ijCEPr. All rights reserved<br />
INTRODUCTION<br />
Bor<strong>on</strong> trioxide is <strong>on</strong>e of the oxides of bor<strong>on</strong>. It is a white, glassy solid. It is almost always found as the vitreous<br />
form; however, it can be crystallized after extensive annealing. It is <strong>on</strong>e of the most difficult compounds known to<br />
crystallize. B 2 O 3 is a glass forming oxide, PbO is a c<strong>on</strong>diti<strong>on</strong>al glass former <str<strong>on</strong>g>and</str<strong>on</strong>g> with these two chemicals in the<br />
glass matrix, a low rate of crystallizati<strong>on</strong>, moisture resistance, stable <str<strong>on</strong>g>and</str<strong>on</strong>g> transparent glasses could be achieved due<br />
to a dual role played by PbO as a glass former <str<strong>on</strong>g>and</str<strong>on</strong>g> also as a modifier[1].<br />
Additi<strong>on</strong> of TiO 2 in small quantities is observed to enhance the glass forming ability <str<strong>on</strong>g>and</str<strong>on</strong>g> chemical<br />
durability of the glasses[2]. From the literature survey it is evident that Ti i<strong>on</strong> enters the glass network in Ti 4+ state<br />
<str<strong>on</strong>g>and</str<strong>on</strong>g> participate in the glass network forming with TiO 4 , TiO 6 <str<strong>on</strong>g>and</str<strong>on</strong>g> some times with TiO 5 (comprising of trig<strong>on</strong>al<br />
bipyramids) structural units[3,4]. As per the reports available the titanium i<strong>on</strong> may enter the glass network in Ti 3+<br />
state[5,6]. Ti 4+ i<strong>on</strong>s are expected to improve the n<strong>on</strong>-linear optical properties of lead borate glasses to a large extent,<br />
since the empty or unfilled d- shells of these i<strong>on</strong>s c<strong>on</strong>tribute more str<strong>on</strong>gly to the n<strong>on</strong>-linear polarizabilities; usually,<br />
the d-orbital c<strong>on</strong>tributi<strong>on</strong> to n<strong>on</strong>-linear polarizability is found to be more for b<strong>on</strong>d lengths less than 2 Å[7]. The b<strong>on</strong>d<br />
length of Ti-O is estimated to be 1.96 Å.<br />
PbO-TiO 2 -B 2 O 3 glasses are c<strong>on</strong>sidered to be of special interest in view of their potential applicati<strong>on</strong>s in IR<br />
fiber optics, laser windows <str<strong>on</strong>g>and</str<strong>on</strong>g> multifuncti<strong>on</strong>al optical comp<strong>on</strong>ents. These glasses are highly transparent in the midinfrared<br />
range <str<strong>on</strong>g>and</str<strong>on</strong>g> are more stable against atmospheric moisture. They are also c<strong>on</strong>sidered as promising c<str<strong>on</strong>g>and</str<strong>on</strong>g>idates<br />
for electrochemical applicati<strong>on</strong>s such as power sources especially in the field of solid state batteries[8]. Further, as<br />
any other heavy metal oxide based glasses, these glasses have also got the capacity to accept the transiti<strong>on</strong>al metal<br />
i<strong>on</strong>s, like ir<strong>on</strong>, both in network forming <str<strong>on</strong>g>and</str<strong>on</strong>g> modifying positi<strong>on</strong>s[9].<br />
Literature survey <strong>on</strong> Ir<strong>on</strong> i<strong>on</strong> dopent glasses showed that they have str<strong>on</strong>g bearing <strong>on</strong> electrical, optical <str<strong>on</strong>g>and</str<strong>on</strong>g><br />
magnetic properties of glasses. Number of inorganic glass systems with ir<strong>on</strong> i<strong>on</strong> envir<strong>on</strong>ment are available in the<br />
literature[10-15]. In those ir<strong>on</strong> i<strong>on</strong> envir<strong>on</strong>ment glass systems, the ir<strong>on</strong> i<strong>on</strong>s exist in different valence states with<br />
different coordinati<strong>on</strong>s in glass matrices, for example, Fe 3+ occupy both tetrahedral <str<strong>on</strong>g>and</str<strong>on</strong>g> octahedral sites, whereas<br />
Fe 2+ occupy <strong>on</strong>ly octahedral positi<strong>on</strong>s[16-25]. The existence of ir<strong>on</strong> in different valance states in a glass mainly<br />
depends up <strong>on</strong> the c<strong>on</strong>tent of ir<strong>on</strong> in the glass, depends <strong>on</strong> the quantitative properties of modifiers <str<strong>on</strong>g>and</str<strong>on</strong>g> glass formers,<br />
size of the i<strong>on</strong>s in the glass structure, their field strength, mobility of the modifier cati<strong>on</strong> etc., It is also evident that<br />
the physical properties of a glass are mainly dependent <strong>on</strong> the oxidati<strong>on</strong> state of the ir<strong>on</strong> i<strong>on</strong>. Thus, by knowing the<br />
T.V. Nagalakshmi et al.
Vol.2, No.2-3, 83-91(2011)<br />
oxidati<strong>on</strong> state <str<strong>on</strong>g>and</str<strong>on</strong>g> the positi<strong>on</strong> of the ir<strong>on</strong> i<strong>on</strong> in the glass network by analytical methods <str<strong>on</strong>g>and</str<strong>on</strong>g> by studying the<br />
physical properties with certain physical measurements can analyze the systems clearly.<br />
The paramagnetic behaviour is exhibited by both ferrous <str<strong>on</strong>g>and</str<strong>on</strong>g> ferric i<strong>on</strong>s. Fe 2+ i<strong>on</strong> possesses a large magnetic<br />
moment due to spin-orbit interacti<strong>on</strong> of the 3d orbital whereas the magnetic moment of Fe 3+ i<strong>on</strong>s is small as the<br />
orbital angular momentum of these i<strong>on</strong>s is zero. Ir<strong>on</strong> i<strong>on</strong>s have str<strong>on</strong>g affinity to make b<strong>on</strong>ds with metal oxides<br />
such as PbO, TiO 2 & B 2 O 3 groups that may reinforce the glass structure <str<strong>on</strong>g>and</str<strong>on</strong>g> raise the glass durability[26].<br />
The main intenti<strong>on</strong> of the present study is to have a broad underst<str<strong>on</strong>g>and</str<strong>on</strong>g>ing over the influence of ir<strong>on</strong> i<strong>on</strong>s <strong>on</strong><br />
the structure of PbO-TiO 2 -B 2 O 3 glasses, from a systematic study <str<strong>on</strong>g>through</str<strong>on</strong>g> IR, ESR, OA <str<strong>on</strong>g>and</str<strong>on</strong>g> <str<strong>on</strong>g>Magnetic</str<strong>on</strong>g> Susceptibility<br />
studies. It is also useful to reveal the role of ir<strong>on</strong> i<strong>on</strong>s <str<strong>on</strong>g>and</str<strong>on</strong>g> their structural modifying ability with the aid of data <strong>on</strong><br />
magnetic <str<strong>on</strong>g>and</str<strong>on</strong>g> spectroscopic properties.<br />
MATERIALS AND METHODS<br />
Glasses are prepared with the following combinati<strong>on</strong> of chemicals in mol% are represented here under. All prepared<br />
samples are glasses (from the visual examinati<strong>on</strong>) <str<strong>on</strong>g>and</str<strong>on</strong>g> these are prepared with an increase in the c<strong>on</strong>centrati<strong>on</strong> of<br />
Fe 2 O 3 . We have prepared seven samples for the present study.<br />
F 0 : 35 PbO-05 TiO 2 -60 B 2 O 3<br />
F 1 : 35 PbO-05 TiO 2 -59.9 B 2 O 3 : 0.1 Fe 2 O 3<br />
F 2 : 35 PbO-05 TiO 2 -59.8 B 2 O 3 : 0.2 Fe 2 O 3<br />
F 3 : 35 PbO-05 TiO 2 -59.7 B 2 O 3 : 0.3 Fe 2 O 3<br />
F 4 : 35 PbO-05 TiO 2 -59.6 B 2 O 3 : 0.4 Fe 2 O 3<br />
F 5 : 35 PbO-05 TiO 2 -59.5 B 2 O 3 : 0.5 Fe 2 O 3<br />
F 6 : 35 PbO-05 TiO 2 -59.4 B 2 O 3 : 0.6 Fe 2 O 3<br />
F 7 : 35 PbO-05 TiO 2 -59.3 B 2 O 3 : 0.7 Fe 2 O 3<br />
Calculated quantities of reagent of TiO 2 , PbO, H 3 BO 3 <str<strong>on</strong>g>and</str<strong>on</strong>g> Fe 2 O 3 powders were thoroughly mixed in an agate mortar<br />
<str<strong>on</strong>g>and</str<strong>on</strong>g> melted in a platinum crucible in the temperature range 950-1000 o C in a PID temperature c<strong>on</strong>trolled furnace for<br />
about 1 h until a bubble free transparent liquid was formed. The so formed liquid was then poured in a brass mould<br />
<str<strong>on</strong>g>and</str<strong>on</strong>g> subsequently annealed at 300 o C using an annealing chamber. X-ray diffracti<strong>on</strong> <str<strong>on</strong>g>and</str<strong>on</strong>g> SEM analysis c<strong>on</strong>firmed the<br />
amorphous state of the glasses.<br />
The differential thermal analysis <strong>on</strong> these samples was carried out using STA 409C, Model DTA-TG with a<br />
programmed heating rate of 10 o C / min in the temperature range of 30-1000 º C.<br />
The samples were then ground <str<strong>on</strong>g>and</str<strong>on</strong>g> optically polished. The density d of these glasses was determined to an<br />
accuracy of 0.001 by st<str<strong>on</strong>g>and</str<strong>on</strong>g>ard principle of Archimedes' using o-xylene (99.99% pure) as the buoyant liquid.<br />
The IR spectra of the glasses were recorded by KBr pellet method. Glass powders (2 mg) were mixed with<br />
anhydrous potassium bromide powder (150 mg) <str<strong>on</strong>g>and</str<strong>on</strong>g> pressed into pellets at 2000 kg cm -2 . The spectra were recorded<br />
using a FT- IR Digital Excalibur 3000 Spectrophotometer with a resoluti<strong>on</strong> of 0.1 cm -1 in the range 400-2000 cm -1 .<br />
The optical absorpti<strong>on</strong> spectra of these glasses were recorded at room temperature in the wavelength range 350-800<br />
nm up to a resoluti<strong>on</strong> of 0.1 nm using Shimadzu UV-VIS-NIR Spectrophotometer Model 3101.<br />
The ESR spectra of the fine powders of the samples were recorded at room temperature <strong>on</strong> JES-FA 200 (ν<br />
= 9.21 GHz) ESR spectrometer with 100 KHz field modulati<strong>on</strong>. The magnetic susceptibility measurements were<br />
made at room temperature by Guoy’s method using fine powders of these glasses.<br />
RESULTS AND DISCUSSION<br />
The amorphous nature of prepared samples was c<strong>on</strong>formed by the absence of peaks in the X-ray diffracti<strong>on</strong> studies<br />
shown in Fig. (1). From the morphological study <str<strong>on</strong>g>through</str<strong>on</strong>g> SEM photographs (Fig.2), it is evident that the samples are<br />
amorphous <str<strong>on</strong>g>and</str<strong>on</strong>g> also the existence of glass transiti<strong>on</strong> temperature T g <str<strong>on</strong>g>and</str<strong>on</strong>g> crystalline temperature T c in the DTA traces<br />
(Fig.3), indicate that the samples prepared were of amorphous in nature.<br />
From the measured values of density d <str<strong>on</strong>g>and</str<strong>on</strong>g> calculated average molecular weight M , various physical<br />
parameters such as ir<strong>on</strong> i<strong>on</strong> c<strong>on</strong>centrati<strong>on</strong> N i <str<strong>on</strong>g>and</str<strong>on</strong>g> mean ir<strong>on</strong> i<strong>on</strong> separati<strong>on</strong> R i , polar<strong>on</strong> radius r p <str<strong>on</strong>g>and</str<strong>on</strong>g> the field strength<br />
around the dopent i<strong>on</strong> F i of these glasses are evaluated[27] <str<strong>on</strong>g>and</str<strong>on</strong>g> presented in Table 1.<br />
The curves exhibited in Fig.3 shows differential thermal analysis of all the glasses under study. From the<br />
curves it is clear that an endothermic effect due to glass transiti<strong>on</strong> temperature T g is noted in all samples. At still<br />
higher temperatures, an exothermic peak T c due to the crystal growth followed by an endothermic effect due to the<br />
melting effect denoted by T m, are also observed. The values of T g , T c <str<strong>on</strong>g>and</str<strong>on</strong>g> T m are tabulated which are obtained for all<br />
84<br />
T.V. Nagalakshmi et al.
Vol.2, No.2-3, 83-91(2011)<br />
the glass samples <str<strong>on</strong>g>and</str<strong>on</strong>g> they are furnished in Table 2. The single peak due to the glass transiti<strong>on</strong> temperature obtained<br />
in DTA pattern of all the glasses shows a good homogeneity of the prepared glass samples.<br />
The glasses which were doped with Fe 2 O 3 , the quantity (T c -T g ), which is proporti<strong>on</strong>al to glass forming ability, is<br />
found to increase where as the quantity (T m -T c ) which is inversely proporti<strong>on</strong>al to glass forming ability is found to<br />
decrease (Table 2) with increase in the c<strong>on</strong>tent of Fe 2 O 3 from 0.1 mol % to 0.5 mol % <str<strong>on</strong>g>and</str<strong>on</strong>g> bey<strong>on</strong>d this c<strong>on</strong>centrati<strong>on</strong><br />
these parameters are reversed in nature.<br />
Table 1Summary of data <strong>on</strong> various physical parameters of PbO- TiO 2 -B 2 O 3 : Fe 2 O 3 glasses<br />
Property<br />
Glass Samples<br />
F 0 F 1 F 2 F 3 F 4 F 5 F 6 F 7<br />
Density d ( g/cm 3 ) 4.48 4.52 4.67 5.06 5.12 5.19 5.22 5.29<br />
Avg. dissociati<strong>on</strong> rate(mg/h/cm 2 ) --- 1.0 0.9 0.8 0.6 0.4 0.9 1.2<br />
Avg. mol. wt. M 123.87 124.05 124.23 124.41 124.59 124.77 124.95 125.22<br />
Titanium i<strong>on</strong> c<strong>on</strong>c.<br />
N i ( 10 21 i<strong>on</strong>s/ cm 3 )<br />
---- 4.39 9.06 14.70 19.80 25.05 30.19 38.17<br />
Inter i<strong>on</strong>ic distance of titanium<br />
i<strong>on</strong>s R i ( Å )<br />
---- 6.11 4.80 4.08 3.70 3.42 3.21 2.97<br />
Field Strength F i (10 15 cm -2 ) ---- 3.30 5.35 7.39 9.02 10.50 11.90 14.00<br />
Polar<strong>on</strong> Radius r p (Å) ---- 2.46 1.93 1.64 1.49 1.38 1.29 1.20<br />
F 7<br />
F 6<br />
intensity (arb. units)<br />
F 5<br />
F 4<br />
F 3<br />
F 2<br />
F 1<br />
F 0<br />
13 23 33 43 53 63 73 83 93<br />
2 θ (degrees)<br />
Fig.1. X-Ray diffracti<strong>on</strong> pattern of PbO-TiO 2 -B 2 O 3 glasses doped with Fe 2 O 3<br />
Table-2: Summary of data <strong>on</strong> differential thermal analysis of PbO-TiO 2 -B 2 O 3 : Fe 2 O 3 glasses<br />
Sample Tg Tc Tm (Tc-Tg) (Tm-Tc) K gl =(Tc-Tg)/ (Tm-Tc)<br />
F 0 411 563 874 152 311 0.489<br />
F 1 417 575 880 158 305 0.518<br />
F 2 419 575 873 156 298 0.523<br />
F 3 422 580 874 158 294 0.537<br />
85<br />
T.V. Nagalakshmi et al.
F 4 423 583 880 160 297 0.539<br />
F 5 426 597 895 171 298 0.574<br />
F 6 422 583 891 161 308 0.523<br />
F 7 418 581 896 163 315 0.517<br />
Vol.2, No.2-3, 83-91(2011)<br />
Table-3: Summary of the data <strong>on</strong> b<str<strong>on</strong>g>and</str<strong>on</strong>g> positi<strong>on</strong>s (cm −1 ) of various absorpti<strong>on</strong> b<str<strong>on</strong>g>and</str<strong>on</strong>g>s in the IR spectra of PbO-TiO 2 -<br />
B 2 O 3 : Fe 2 O 3 glasses<br />
Glass<br />
BO 3<br />
(cm -1 )<br />
Borate groups<br />
BO 4<br />
(cm -1 )<br />
B-O-B<br />
(cm -1 )<br />
B<str<strong>on</strong>g>and</str<strong>on</strong>g> due to TiO 4<br />
(cm -1 )<br />
B<str<strong>on</strong>g>and</str<strong>on</strong>g><br />
due to<br />
Ti-O-Ti<br />
(cm -1 )<br />
B<str<strong>on</strong>g>and</str<strong>on</strong>g> due to<br />
PbO 4 units<br />
(cm -1 )<br />
F 0 1362 1038 723 723 650 480<br />
F 1 1367 1035 723 723 650 480<br />
F 2 1373 1031 723 723 650 480<br />
F 3 1383 1030 723 723 650 480<br />
F 4 1393 1023 723 723 650 480<br />
F 5 1398 1021 723 723 650 480<br />
F 6 1386 1033 723 723 650 480<br />
F 7 1360 1058 723 723 650 480<br />
Table-4: Summary of data <strong>on</strong> optical absorpti<strong>on</strong> spectra of PbO-TiO 2 -B 2 O 3 : Fe 2 O 3 glasses<br />
Transiti<strong>on</strong><br />
Glass Sample<br />
F 0 F 1 F 2 F 3 F 4 F 5 F 6 F 7<br />
Fe 3+ transiti<strong>on</strong>s (nm)<br />
A 1 (t 3 2g e 2 g) →a 4 T 1 (t 4 2g e g ) -- 540 540 540 540 540 540 540<br />
6 A 1 (t 3 2g e 2 g) →a 4 T 2 (t 4 2g e g ) -- 580 580 580 580 580 580 580<br />
6 A 1 (t 3 2g e 2 g) →a 4 T 1 (e 3 t 2 2) -- 787 787 787 787 787 787 787<br />
Fe 2+ transiti<strong>on</strong> (nm)<br />
5 T 2g → 5 E g -- 955 955 955 955 955 955 955<br />
Cut-off wavelength (nm) 401 391 389 386 383.1 378 393 396<br />
Optical b<str<strong>on</strong>g>and</str<strong>on</strong>g> gap (eV) -- 2.32 2.4 2.47 2.5 2.65 2.25 2.20<br />
Table-5: Data <strong>on</strong> magnetic properties of PbO-TiO 2 -B 2 O 3 : Fe 2 O 3 glasses<br />
Glass C<strong>on</strong>c. of Fe 2 O 3 (mol %) Susceptibility, χ (10 -5 , emu) µ (µ B )<br />
F 1 0.1 12.32 5.2<br />
F 2 0.2 13.56 5.3<br />
F 3 0.3 14.25 5.4<br />
F 4 0.4 19.24 5.5<br />
F 5 0.5 21.56 5.8<br />
F 6 0.6 7.25 4.7<br />
F 7 0.7 3.61 4.6<br />
The observed values of T g , T c <str<strong>on</strong>g>and</str<strong>on</strong>g> T m , the parameters (T c -T g ), (T m -T c ) <str<strong>on</strong>g>and</str<strong>on</strong>g> glass forming ability parameter<br />
known as Hruby’s parameter, K gl = (T c -T g )/(T m -T c ) are evaluated <str<strong>on</strong>g>and</str<strong>on</strong>g> presented in Table 2. The disparity of the<br />
86<br />
T.V. Nagalakshmi et al.
Vol.2, No.2-3, 83-91(2011)<br />
parameter (T c -T g )/(T m -T c ) with the c<strong>on</strong>centrati<strong>on</strong> of Fe 3+ i<strong>on</strong> indicates the maximum value for glass F 5 (Table 2)<br />
showing its highest glass forming ability am<strong>on</strong>g all the glasses prepared.<br />
The variati<strong>on</strong> of glass forming ability parameter called Hurby’s Parameter K gl with the c<strong>on</strong>centrati<strong>on</strong> of<br />
Fe 2 O 3 in the present glass system is increased with the increase in the c<strong>on</strong>centrati<strong>on</strong> of Fe 2 O 3 up to 0.5 mole % <str<strong>on</strong>g>and</str<strong>on</strong>g><br />
later <strong>on</strong> with the increase in the c<strong>on</strong>centrati<strong>on</strong> of Fe 2 O 3 the Hurby’s parameter is decreased.<br />
F<br />
F 0 F 3<br />
1<br />
F2<br />
F 4<br />
F 5<br />
F 6<br />
F 7<br />
Fig.2: Scanning Electr<strong>on</strong> Microgram of PbO-TiO 2 -B 2 O 3 : Fe 2 O 3 glasses.<br />
Tc<br />
Tm<br />
F7<br />
Tg<br />
F6<br />
F5<br />
F4<br />
F3<br />
Exo<br />
Endo<br />
F2<br />
F1<br />
F0<br />
350 450 550 650 750 850 950 1050<br />
Temperature, ( o C)<br />
Fig.3. Differential Thermal Analysis patterns of PbO-TiO 2-B 2O 3: Fe 2O 3 glasses<br />
The IR spectra of the samples prepared c<strong>on</strong>sists of following b<str<strong>on</strong>g>and</str<strong>on</strong>g>s; (i) B-O b<strong>on</strong>d of the trig<strong>on</strong>al BO 3 units in the<br />
regi<strong>on</strong> 1300-1400 cm -1 <str<strong>on</strong>g>and</str<strong>on</strong>g> these b<str<strong>on</strong>g>and</str<strong>on</strong>g>s are identified due to stretching relaxati<strong>on</strong> of BO b<strong>on</strong>ds (ii) the b<str<strong>on</strong>g>and</str<strong>on</strong>g>s due to<br />
vibrati<strong>on</strong> of BO 4 structural units in the regi<strong>on</strong> 1100-1200 cm -1 <str<strong>on</strong>g>and</str<strong>on</strong>g> (iii) the b<str<strong>on</strong>g>and</str<strong>on</strong>g> due to bending vibrati<strong>on</strong>s of B-O-B<br />
linkages are present in the regi<strong>on</strong> 722 cm -1 [26,28,29]. In all the glasses prepared PbO 4 structural units exhibited a<br />
b<str<strong>on</strong>g>and</str<strong>on</strong>g> at about 480 cm -1 [30,31]. With the introducti<strong>on</strong> of TiO 2 (0.1 mol %) into the glass network, two new b<str<strong>on</strong>g>and</str<strong>on</strong>g>s due<br />
to TiO 4 (730 cm -1 ) <str<strong>on</strong>g>and</str<strong>on</strong>g> Ti-O-Ti symmetric stretching vibrati<strong>on</strong>s of TiO 6 (650 cm -1 ) structural units have<br />
appeared[32,33].<br />
When we move from Sample F 0 to Sample F 5 , the intensity of sec<strong>on</strong>d group of b<str<strong>on</strong>g>and</str<strong>on</strong>g>s (b<str<strong>on</strong>g>and</str<strong>on</strong>g>s due to BO 4<br />
units) is observed to increase with a shifting of meta-center towards slightly lower wavenumber, where as, the<br />
intensity of the first group of b<str<strong>on</strong>g>and</str<strong>on</strong>g>s (b<str<strong>on</strong>g>and</str<strong>on</strong>g>s due to the BO 3 structural units) is observed to decrease. For further<br />
increase of Fe 2 O 3 , ie., for the samples F 6 & F 7 , the intensity of the first group of b<str<strong>on</strong>g>and</str<strong>on</strong>g>s is observed to increase at the<br />
expense of sec<strong>on</strong>d group of b<str<strong>on</strong>g>and</str<strong>on</strong>g>s.<br />
87<br />
T.V. Nagalakshmi et al.
Vol.2, No.2-3, 83-91(2011)<br />
BO 3 units<br />
BO 4 units<br />
B-O-B & TiO 4<br />
Transmittance, %<br />
Ti-O-Ti<br />
PbO 4 units<br />
F 7<br />
F 6<br />
F 5<br />
F 4<br />
F 3<br />
F 2<br />
F 1<br />
F 0<br />
2000<br />
1800<br />
1600<br />
1400<br />
1200<br />
1000<br />
800<br />
600<br />
400<br />
Wavenumber (cm -1 )<br />
Fig. 4: IR spectra of PbO-TiO 2 -B 2 O 3 :Fe 2 O 3 glasses.<br />
The OA spectra of prepared glasses recorded in the wavelength regi<strong>on</strong> 350-1100 nm are shown in Fig. 5. The<br />
absorpti<strong>on</strong> edge observed at 401 nm for the glass F 0 is observed to shift to 378 nm when we move from F 0 to F 5 .<br />
With further increase in the c<strong>on</strong>centrati<strong>on</strong> of Fe 2 O 3 , the edge is observed to shift gradually towards higher<br />
wavelength. The spectra of the glasses F 1 , F 2 , F 3 , F 4 <str<strong>on</strong>g>and</str<strong>on</strong>g> F 5 have exhibited absorpti<strong>on</strong> b<str<strong>on</strong>g>and</str<strong>on</strong>g>s at 540, 580 <str<strong>on</strong>g>and</str<strong>on</strong>g> 787 nm<br />
due to Fe 3+ i<strong>on</strong> transiti<strong>on</strong>s <str<strong>on</strong>g>and</str<strong>on</strong>g> a b<str<strong>on</strong>g>and</str<strong>on</strong>g> at 955 nm due to Fe 2+ i<strong>on</strong>s is observed in the spectra of F 6 <str<strong>on</strong>g>and</str<strong>on</strong>g> F 7 . With<br />
increase in the c<strong>on</strong>centrati<strong>on</strong> of Fe 2 O 3 bey<strong>on</strong>d 0.5 mol %, the b<str<strong>on</strong>g>and</str<strong>on</strong>g>s due to Fe 3+ i<strong>on</strong>s have been observed to fade<br />
away slowly where as the intensity of the b<str<strong>on</strong>g>and</str<strong>on</strong>g> due to Fe 2+ i<strong>on</strong>s is observed to increase gradually. Urbach plot is<br />
drawn between (αћω) 1/2 <str<strong>on</strong>g>and</str<strong>on</strong>g> ћω <str<strong>on</strong>g>and</str<strong>on</strong>g> this plot is represented in Fig (6). In Fig. 6, it is clear that some part of each<br />
curve of every sample is linear. The values of optical b<str<strong>on</strong>g>and</str<strong>on</strong>g> gap (E o ) obtained from the extrapolati<strong>on</strong> of the linear<br />
porti<strong>on</strong>s of these plots are presented in Table 4. The value of E o is found to increase with the increase in<br />
c<strong>on</strong>centrati<strong>on</strong> of Fe 2 O 3 from 0.1 to 0.5 mol % from a value 2.32 eV to 2.65 eV later <strong>on</strong> this value is decreased to 2.2<br />
eV <strong>on</strong> further increasing the dopent to 0.7 mol %.<br />
The ESR spectra of prepared glasses recorded at room temperature are shown in Fig. 7. The intensity of the ESR<br />
signal is observed to increase gradually with increase in the c<strong>on</strong>centrati<strong>on</strong> of Fe 2 O 3 in the glass matrix up to 0.5 mol<br />
%. This intense line centered at about g = 2. However, the intensity of this signal is decreased with the increase of<br />
the c<strong>on</strong>centrati<strong>on</strong> of Fe 2 O 3 bey<strong>on</strong>d 0.5 mol %. In the spectra of all the prepared samples a weak signal at g=4.3 also<br />
be detected.<br />
<str<strong>on</strong>g>Magnetic</str<strong>on</strong>g> susceptibility of the prepared glasses measured at room temperature is observed to increase with<br />
increase in Fe 2 O 3 c<strong>on</strong>tent in the glass compositi<strong>on</strong> (Table 5) up to 0.5 mol %, bey<strong>on</strong>d that the susceptibility is found<br />
to decrease. From the values of magnetic susceptibilities, the effective magnetic moments (µ eff ) are evaluated <str<strong>on</strong>g>and</str<strong>on</strong>g><br />
presented in Table 5. The value of µ eff is found to increase gradually from a value of 5.2 (for glass F 1 ) to a value of<br />
5.8 µ B (for glass F 5 ) with increase of Fe 2 O 3 up to 0.5 mol %. Later <strong>on</strong> with the increase of Fe 2 O 3 in the glass matrix<br />
the magnetic moment is decreased.<br />
B 2 O 3 is a well known glass former. Both lead oxide <str<strong>on</strong>g>and</str<strong>on</strong>g> titanium dioxide are modifiers. The introducti<strong>on</strong> of PbO <str<strong>on</strong>g>and</str<strong>on</strong>g><br />
TiO 2 into B 2 O 3 glass network is to c<strong>on</strong>vert the sp 2 planar BO 3 into more stable sp 3 tetrahedral BO 4 units in additi<strong>on</strong><br />
to n<strong>on</strong>-bridging oxygens (NBO’s). The existence of such BO 4 units in the present glass system is evident from IR<br />
spectral studies.<br />
When PbO is added into B 2 O 3 glass network it enters into the glass network by breaking up the B-O-B b<strong>on</strong>ds <str<strong>on</strong>g>and</str<strong>on</strong>g><br />
introduces coordinate defects known as dangling b<strong>on</strong>ds al<strong>on</strong>g with n<strong>on</strong>-bridging oxygen i<strong>on</strong>s. PbO may also<br />
participate in the glass network with PbO 4 structural units when lead i<strong>on</strong> is linked to four oxygens in a covalency<br />
b<strong>on</strong>d c<strong>on</strong>figurati<strong>on</strong>. Additi<strong>on</strong> of TiO 2 in small quantities will enhance the glass forming ability <str<strong>on</strong>g>and</str<strong>on</strong>g> chemical<br />
durability of the glasses. Ti i<strong>on</strong> enters the glass network in Ti 4+ state <str<strong>on</strong>g>and</str<strong>on</strong>g> participate in the glass network forming<br />
with TiO 4 , TiO 6 <str<strong>on</strong>g>and</str<strong>on</strong>g> some times with TiO 5 structural units. Ti 4+ i<strong>on</strong>s are expected to improve the n<strong>on</strong>-linear optical<br />
properties of lead borate glasses. The structure of the PbO-TiO 2 -B 2 O 3 : Fe 2 O 3 glass is represented in Fig. 8.<br />
88<br />
T.V. Nagalakshmi et al.
Vol.2, No.2-3, 83-91(2011)<br />
Optical density<br />
6 A 1 (t 3 2g e 2 g) a 4 T 1 (t 4 2ge g )<br />
F 5<br />
F4<br />
6 A 1 (t 3 2g e 2 g) a 4 T 2 (t 4 2ge g )<br />
F3F2<br />
F 1<br />
F 0<br />
F 6<br />
F 7<br />
6 A 1 (t 3 2g e 2 g) a 4 T 1 (e 3 t 2 2)<br />
5 T 2g 5 E g<br />
350 450 550 650 750 850 950 1050<br />
Wavelength, (nm)<br />
Fig. 5. Optical absorpti<strong>on</strong> spectra of PbO-TiO 2 -B 2 O 3 : Fe 2 O 3 glasses.<br />
10<br />
9<br />
8<br />
7<br />
(αhν)1/2 (cm -1 -eV) 1/2<br />
6<br />
5<br />
4<br />
3<br />
2<br />
1<br />
F 7 F 6 F 1 F2 F 3 F 4 F 5<br />
0<br />
2 2.4 2.8 3.2<br />
hν (eV)<br />
Fig. 6 A plot for evaluating the optical b<str<strong>on</strong>g>and</str<strong>on</strong>g> gap of PbO-TiO 2 -B 2 O 3 : Fe 2 O 3 glasses<br />
Ir<strong>on</strong> i<strong>on</strong>s are expected to exist mainly in Fe 3+ <str<strong>on</strong>g>and</str<strong>on</strong>g> Fe 2+ state in the present PbO-TiO 2 -B 2 O 3 glass network. The<br />
speciati<strong>on</strong> of ir<strong>on</strong> in these glasses is c<strong>on</strong>trolled by the following reversible reacti<strong>on</strong>:<br />
4Fe 2+ melt + O 2 melt atm. 4Fe 3+ melt + 2 O 2- melt<br />
The OA spectra of the prepared glasses have exhibited three absorpti<strong>on</strong> b<str<strong>on</strong>g>and</str<strong>on</strong>g>s at 787, 580 <str<strong>on</strong>g>and</str<strong>on</strong>g> 540 nm. Based <strong>on</strong><br />
selecti<strong>on</strong> rules <str<strong>on</strong>g>and</str<strong>on</strong>g> lig<str<strong>on</strong>g>and</str<strong>on</strong>g> field calculati<strong>on</strong>s, the first two b<str<strong>on</strong>g>and</str<strong>on</strong>g>s are identified due to FeO 6 group <str<strong>on</strong>g>and</str<strong>on</strong>g> the third b<str<strong>on</strong>g>and</str<strong>on</strong>g> is<br />
due to FeO 4 group 34, 35 . With increase in the c<strong>on</strong>centrati<strong>on</strong> of Fe 2 O 3 up to 0.5 mol %, the intensity of these b<str<strong>on</strong>g>and</str<strong>on</strong>g>s<br />
slowly increased at the expense of the absorpti<strong>on</strong> b<str<strong>on</strong>g>and</str<strong>on</strong>g> at 955 nm which is a characteristic b<str<strong>on</strong>g>and</str<strong>on</strong>g> for Fe 2+ i<strong>on</strong>s. This<br />
b<str<strong>on</strong>g>and</str<strong>on</strong>g> is identified due to 5 T 2g → 5 E g transiti<strong>on</strong> of Fe 2+ (d 6 ) i<strong>on</strong>s 36 .<br />
The diminishing intensity of the ESR signal with the increase in the c<strong>on</strong>centrati<strong>on</strong> of Fe 2 O 3 bey<strong>on</strong>d 0.5 mol %<br />
indicates a gradual decrease in the c<strong>on</strong>centrati<strong>on</strong> of Fe 3+ i<strong>on</strong>s in the glass network.<br />
The value of the effective magnetic moment (5.8 µ B ) obtained for glass F 5 c<strong>on</strong>firms the highest c<strong>on</strong>centrati<strong>on</strong> of Fe 3+<br />
i<strong>on</strong>s in this glass. The decrease in the value of µ eff from 5.8 µ B to a value of 4.6 µ B (for glass F 7 ) indicates a gradual<br />
growing c<strong>on</strong>centrati<strong>on</strong> of Fe 2+ i<strong>on</strong>s that take modifying positi<strong>on</strong>s in the glass network. Such Fe 2+ i<strong>on</strong>s may increase<br />
the degree of disorder in the glass network.<br />
89<br />
T.V. Nagalakshmi et al.
Vol.2, No.2-3, 83-91(2011)<br />
From the data of IR spectra, with the raise in the c<strong>on</strong>centrati<strong>on</strong> of Fe 2 O 3 , the intensity of the b<str<strong>on</strong>g>and</str<strong>on</strong>g>s due to BO 3<br />
structural units has been observed to decrease at the expense of the b<str<strong>on</strong>g>and</str<strong>on</strong>g>s due to BO 4 units up to 0.5 mol%. This<br />
observati<strong>on</strong> suggests a gradual increase in the c<strong>on</strong>centrati<strong>on</strong> of trivalent ir<strong>on</strong> i<strong>on</strong>s in the glass network that acts as<br />
former; as former, these i<strong>on</strong>s create more orderly arrangement in the glass network.<br />
F 7<br />
F 6<br />
F 5<br />
Intensity (arb. units)<br />
F 4<br />
F 3<br />
F 2<br />
F 1<br />
g=4.3<br />
g=2<br />
125 175 225 275 325 375 425<br />
Field, (mT)<br />
Fig. 7: ESR spectra of PbO-TiO 2 -B 2 O 3 : Fe 2 O 3 glasses<br />
CONCLUSIONS<br />
The following are the c<strong>on</strong>clusi<strong>on</strong>s drawn <strong>on</strong> PbO-TiO 2 -B 2 O 3 : Fe 2 O 3 glass system:<br />
1. The magnetic moment evaluated from magnetic susceptibility measurements of the glasses, increases from 5.2<br />
to 5.8 µ B with increasing c<strong>on</strong>centrati<strong>on</strong> of Fe 2 O 3 up to 0.5 mol % in the glass matrix <str<strong>on</strong>g>and</str<strong>on</strong>g> decreased to 4.6 µ B <strong>on</strong><br />
further increase of Fe 2 O 3 up to 0.7 mol %. From this result it is clear that Fe 3+ i<strong>on</strong> c<strong>on</strong>centrati<strong>on</strong> is increasing<br />
with the increase of Fe 2 O 3 c<strong>on</strong>centrati<strong>on</strong> <str<strong>on</strong>g>and</str<strong>on</strong>g> posses max at 0.5 mol % <str<strong>on</strong>g>and</str<strong>on</strong>g> bey<strong>on</strong>d this as the c<strong>on</strong>centrati<strong>on</strong> of<br />
Fe 2 O 3 increases then Fe 3+ i<strong>on</strong>s are c<strong>on</strong>verted into Fe 2+ state. Thus from the magnetic susceptibility<br />
measurements we can c<strong>on</strong>clude that the Sample-F 5 is a stable <strong>on</strong>e when compared to the other samples.<br />
2. The IR spectral investigati<strong>on</strong>s shows that with the increase in the c<strong>on</strong>centrati<strong>on</strong> of Fe 2 O 3 in the glass matrix<br />
from 0.1 to 0.5 mol % a gradual increase in the c<strong>on</strong>centrati<strong>on</strong> of Fe 3+ i<strong>on</strong>s that occupy tetrahedral positi<strong>on</strong>s<br />
which improves the orderliness of the glass matrix <str<strong>on</strong>g>and</str<strong>on</strong>g> pick up the stability of the sample. On further increase of<br />
Fe 2 O 3 c<strong>on</strong>centrati<strong>on</strong> bey<strong>on</strong>d 0.5 mol % Fe 2+ i<strong>on</strong>s are increased with the expense of Fe 3+ i<strong>on</strong>s. Fe 2+ i<strong>on</strong>s occupy<br />
the octahedral positi<strong>on</strong>s which decrease the stability of the glass system. Thus sample F 5 represents a good<br />
glass.<br />
3. The optical absorpti<strong>on</strong> <str<strong>on</strong>g>and</str<strong>on</strong>g> ESR spectral studies indicate the presence of part of ir<strong>on</strong> i<strong>on</strong>s in Fe 3+ state <str<strong>on</strong>g>and</str<strong>on</strong>g><br />
occupy tetrahedral positi<strong>on</strong>s when Fe 2 O 3 is added from 0.1 – 0.5 mol % ; when the c<strong>on</strong>centrati<strong>on</strong> of Fe 2 O 3 is in<br />
higher quantities (> 0.5 %), these i<strong>on</strong>s seems to exist in Fe 2+ state .<br />
90<br />
T.V. Nagalakshmi et al.
Vol.2, No.2-3, 83-91(2011)<br />
Finally the analysis of the results of the studies <strong>on</strong> the various physical properties (viz., optical, magnetic) <str<strong>on</strong>g>and</str<strong>on</strong>g> DTA<br />
indicates that the structure of PbO-TiO 2 -B 2 O 3 : glass is more stable when the c<strong>on</strong>centrati<strong>on</strong> of Fe 2 O 3 is about 0.5<br />
mol%.<br />
ACKNOWLEDGEMENTS<br />
The authors are thankful to Sri Chava Ramakrishna Rao, President, Sri Kakarala Rajendra vara Prasada Rao,<br />
Secretary of Sir C R Reddy Educati<strong>on</strong>al Instituti<strong>on</strong>s, Eluru <str<strong>on</strong>g>and</str<strong>on</strong>g> Sri Jasti Raja Rama Mohana Rao, Corresp<strong>on</strong>dent of<br />
Sir C R Reddy Aut<strong>on</strong>omous College, Eluru for their encouragement in carrying out this work in the research Lab.<br />
The authors are also very much pleased to Sri A.B. Lakshmi Narayana, Principal of the college for his help <str<strong>on</strong>g>and</str<strong>on</strong>g><br />
encouragement given during the course of this work in the college.<br />
REFERENCES<br />
1. Lakshminarayana. G, Buddhudu. S, Spectrochimica Acta Part A, 63 (2006) 295.<br />
2. Koudelka. L, Mosner. P, Zeyer. M, Jager. C, J. N<strong>on</strong>-Cryst.Solids, 326 (2003) 72<br />
3. Shimoji. N, Hashimoto. T, Nasu. H, Kamiya. K, J. N<strong>on</strong>-Cryst .Solids, 324 (2003) 50.<br />
4. Shaim. A, Et –tabirou. M, J. Mater. Chem. Phys., 80 (2003) 63.<br />
5. Paul. A, J. Mater.Sci., 10 (1975) 692.<br />
6. Brow. R.K, Warren.W.L, McIntyre.A, Day.D.E, Phys. Chem. Glasses, 38 (1997) 300.<br />
7. Lines.E, Phys. Rev. B 43 (1991) 11978.<br />
8. Damarawi.G.El., phys. stat. sol. A, 177 (2000) 385.<br />
9. Ardelean.I, Peteanu.M, Sim<strong>on</strong>.V, Filip.S, Ciorcas.F, Tordor.I J. Magnetism <str<strong>on</strong>g>and</str<strong>on</strong>g> <str<strong>on</strong>g>Magnetic</str<strong>on</strong>g> Materials, 196 (1999)<br />
257.<br />
10. Shapaan. M, Bardos. A, Varga. L.K, Lendvai. J, Mat Sci Eng A366 (2004) 6.<br />
11. Xiangyu Fang, Ch<str<strong>on</strong>g>and</str<strong>on</strong>g>ra Ray. S, Delbert Day. E, J N<strong>on</strong>-Cry Sol, 319 (2003) 314.<br />
12. Dos Santos. D.S, Dos Santos D.R, J N<strong>on</strong>-Cry Sol, 304 (2002) 56.<br />
13. Reis S.T, Faria D.L.A, Martinelli J.R, P<strong>on</strong>tuschka W.M, Day D.E, Partiti C.S.M, J N<strong>on</strong>-Cry Sol, 304 (2002)<br />
188.<br />
14. Giulio Ott<strong>on</strong>ello, Roberto Moretti, Luigi Marini, Marino Vetuschi Zuccolini, Chemical Geology 174 (2001)<br />
157.<br />
15. El-Desoky M.M, Taho<strong>on</strong>. K, Hassaan. M.Y, Mat Chem Phy, 69 (2001) 180.<br />
16. Pivac. B, Mogus-Milankovic. A, Day. D.E, J. N<strong>on</strong>-Crystal. Solids, 226 (1998) 41.<br />
17. Karabulut. M, J. N<strong>on</strong>-Crystal. Solids, 306 (2002) 182.<br />
18. Aziz. M.S, Abdel-Wahab F, Mostafa. A. G, El-Agwany. E. M, Mat. Chem. Phys. 91 (2005) 532.<br />
19. Ardelean. I, Toderas. M, Filip. S, J. Mag. <str<strong>on</strong>g>Magnetic</str<strong>on</strong>g> Mater. 227 (2004) 339.<br />
20. Murawski. L, Barczynski. R.J, Samatowicz. D, Solid State i<strong>on</strong>ics, 157 (2003) 293.<br />
21. Baia. L, Stefan. R, Kiefer. W, Sim<strong>on</strong>. S, J. Raman Spectroscopy, 36 (2005) 262.<br />
22. Salah. S.H, Kashif. I, Salem. S.M, Mostafa. A.G <str<strong>on</strong>g>and</str<strong>on</strong>g> Manakhly. K.A. El. Am. Inst. Phys. 765 (2005) 294.<br />
23. Lucian Baia, Razavan Stefan, J. N<strong>on</strong>-Crystal. Solids, 324 (2003) 109.<br />
24. Mogus-Milankovic. A, Santic. A., Gajovic. A, Day. D.E, J. N<strong>on</strong>-Crystal. Solids, 325 (2003) 76.<br />
25. Ray. C.S, Fang. X, J. N<strong>on</strong>-Crystal. Solids, 249 (1999) 1<br />
26. Veerabhadra Rao. A, Laxmikanth. C, Appa Rao. B, Veeraiah. N, J. Phys. Chem. Solids, 67, (2006) 2263.<br />
27. Chen. R, J.Appl.Phys. 40 (1969) 570.<br />
28. Khalifa. F.A, Batal. H.A. El, Azooz. A, Ind. J. Pure. & Appl. Phys. 36 (1998) 314.<br />
29. Nageswara Rao. P, Naga Raju. G, Krishna Rao. D, Veeraiah. N, J. Lumin. 117 (2006)53.<br />
30. Srinivasarao. G, Veeriah. N, J. Solid. State. Chem. 166 (2002) 104.<br />
31. Reddy M.R, Raju S.B, Veeraiah. N, J .Phys.Chem.Solids, 61 (2000) 1567.<br />
32. Wu. H.F, Lin. C.C, Shen. P, J.N<strong>on</strong>-Cryst.Sol. 209 (1997) 76.<br />
33. Laudisio. G, Ar<strong>on</strong>ne. A, Pernice P, Thermochimica Acta, 294 (1997) 173.<br />
34. Lacerda.S.R, Correia R.N, Fern<str<strong>on</strong>g>and</str<strong>on</strong>g>es. M.H.V, J.N<strong>on</strong>-Cryst.Sol.221 (1997) 255.<br />
35. Baiocchi. E, M<strong>on</strong>tenegro. A, Bettinelli. M, J. N<strong>on</strong>-Cryst. Solids, 46 (1981) 203.<br />
36. Albert Cott<strong>on</strong>. F, Wilkins<strong>on</strong>. G, Advanced Inorganic Chemistry, Wiley Eastern, New elhi 1976.<br />
[IJCEPR-169/2011]<br />
91<br />
T.V. Nagalakshmi et al.