Simultaneous Determination of Gallic acid, Catechin, Rutin, Ellagic ...
Simultaneous Determination of Gallic acid, Catechin, Rutin, Ellagic ...
Simultaneous Determination of Gallic acid, Catechin, Rutin, Ellagic ...

Create successful ePaper yourself
Turn your PDF publications into a flip-book with our unique Google optimized e-Paper software.
Original Article<br />
<strong>Simultaneous</strong> <strong>Determination</strong> <strong>of</strong> <strong>Gallic</strong> <strong>acid</strong>, <strong>Catechin</strong>, <strong>Rutin</strong>,<br />
<strong>Ellagic</strong> Acid and Quercetin in Flower Extracts <strong>of</strong> Michelia alba,<br />
Caesalpinia pulcherrima and Nelumbo nucifera by HPLC<br />
Weerasak Samee* and Suwanna Vorarat<br />
Natural Product Evaluation Center (NPEC), Department <strong>of</strong> Pharmaceutical Chemistry and Pharmacognosy, Faculty <strong>of</strong> Pharmacy,<br />
Srinakharinwirot University, Nakhon Nayok 26120, Thailand<br />
* Corresponding author: E-mail address: weerasak@swu.ac.th<br />
ABSTRACT<br />
<strong>Gallic</strong> <strong>acid</strong> (GA), catechin (CA), rutin (RU), ellagic <strong>acid</strong> (EA) and quercetin (QU) were analyzed simultaneously by HPLC with<br />
UV detection at 280 nm. The separation was carried out by Luna C18 reverse phase column (∅ 4.6 x 250 mm) packed with 5<br />
µm diameter particles. Solvent gradients were performed by dual pumping system, and varied the proportion <strong>of</strong> solvent A<br />
[water-acetic <strong>acid</strong> (25:1, v/v)] to solvent B (methanol). Solvent B was increased to 80% in 10 min at a flow rate <strong>of</strong> 1.0 mL/min.<br />
Calibration curves were found to be linear with ranges <strong>of</strong> 2.62 - 21.00, 10.85 - 86.80, 10.00 - 80.00, 10.05 - 80.40 and 10.05 -<br />
80.40 µg.mL -1 for GA, CA, RU, EA and QU respectively. The correlation coefficients <strong>of</strong> linear regression analysis and detection<br />
limits were 0.9994 - 0.9999 and 0.3709 - 1.3191 µg.mL -1 respectively. The contents <strong>of</strong> GA, CA, RU, EA and QU in the flower<br />
extracts <strong>of</strong> Michelia alba, Caesalpinia pulcherrima and Nelumbo nucifera were successfully determined at 5.0, 6.8, 9.2, 9.8 and<br />
11.3 min respectively with satisfactory reproducibility and recovery.<br />
Thai Pharm Health Sci J 2007;2(2):131-137 §<br />
Introduction<br />
§<strong>Gallic</strong> <strong>acid</strong> (GA), catechin (CA), rutin (RU), ellagic<br />
<strong>acid</strong> (EA) and quercetin (QU) are phenolic compounds.<br />
Structurally they have phenolic groups which serve as a<br />
source <strong>of</strong> readily available hydrogen atoms such that the<br />
subsequent radicals produced can be delocalized over<br />
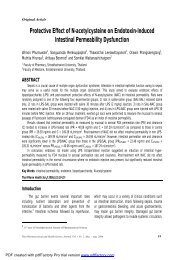
the phenolic structure (Figure 1). 1,2 The interest in these<br />
compounds is due to their pharmacological activity as<br />
radical scavengers. 3,4 They have been proved to have<br />
potential preventive and therapeutic effects in many<br />
diseases, where the oxidative stress has been<br />
implicated, including cardiovascular diseases, cancer,<br />
§ 12 th year <strong>of</strong> Srinakharinwirot Journal <strong>of</strong> Pharmaceutical Science<br />
neurodegenerative disorders and in aging. 5-9 The<br />
phenolics are also <strong>of</strong> interest in food, cosmetic and<br />
pharmaceutical industries, as substitutes for synthetic<br />
antioxidants. These five phenolics widely distribute in the<br />
plant kingdom. 10-12 Several chromatographic methods<br />
have been documented for determination <strong>of</strong> GA, CA, RU,<br />
EA and QU in plants 13-18 but none on simultaneous<br />
determination <strong>of</strong> these five phenolics in flowers by HPLC<br />
method. In this study, HPLC with UV detector was<br />
developed for simultaneous determination <strong>of</strong> GA, CA,<br />
RU, EA and QU in the flower extracts <strong>of</strong> Michelia alba,<br />
Caesalpinia pulcherrima and Nelumbo nucifera. The<br />
assay was validated to determine linearity, precision,<br />
recovery, selectivity and stability.<br />
Thai Pharmaceutical and Health Science Journal, Vol. 2 No. 2, May. – Aug. 2007 131
HO<br />
OH<br />
OH<br />
HO<br />
COOH<br />
HO<br />
O<br />
OH<br />
HO<br />
O<br />
OH<br />
HO<br />
<strong>Gallic</strong> <strong>acid</strong><br />
<strong>Catechin</strong><br />
OH<br />
OH<br />
O<br />
OH<br />
Quercetin<br />
OH<br />
O<br />
O<br />
OH<br />
HO<br />
O<br />
OH<br />
HO<br />
OH<br />
O<br />
OH<br />
O<br />
HO<br />
O<br />
<strong>Ellagic</strong> <strong>acid</strong><br />
O<br />
OH<br />
OH<br />
O<br />
O<br />
OH<br />
OH<br />
OH OH<br />
<strong>Rutin</strong><br />
OH<br />
Figure 1 Chemical structures <strong>of</strong> gallic <strong>acid</strong> (GA), catechin (CA), rutin (RU), ellagic <strong>acid</strong> (EA) and quercetin (QU)<br />
Materials and Methods<br />
Reagents<br />
GA was purchased from Sigma (MO, USA). CA, EA,<br />
RU and QU from Fluka (Steinheim, Germany). Acetic<br />
<strong>acid</strong>, ethanol and methanol (HPLC grade) were<br />
purchased from Merck (Darmstadt, Germany).<br />
Apparatus<br />
Chromatographic analysis was carried out by Luna<br />
C18 reverse-phase column (∅ 4.6 mm x 250 mm)<br />
packed with 5 µm diameter particles. HPLC system<br />
(Thermo separation product (TSP), U.S.A.) was<br />
combined with a dual pump (SpectraSYSTEM P1500), a<br />
UV detector (SpectraSYSTEM UV1000) and an<br />
autosampler (SpectraSYSTEM AS3000). Chromatograms<br />
were analyzed with the TSP PC1000 s<strong>of</strong>tware.<br />
Standard preparation<br />
Standard stock solutions <strong>of</strong> five phenolic compounds<br />
were prepared in methanol, at concentrations <strong>of</strong> 0.420,<br />
0.434, 0.400, 0.402 and 0.402 mg.mL -1 for GA, CA, RU,<br />
EA and QU respectively. All standard solutions were<br />
filtered through 0.45 µm membrane filter (Millipore), and<br />
injected by autosampler.<br />
Sample preparation<br />
The fresh flowers <strong>of</strong> M. alba, C. pulcherrima and N.<br />
nucifera were washed and dried at 60 °C. Then, dried<br />
flowers were ground to fine powder. The extraction was<br />
carried out using 2 g <strong>of</strong> powdered flowers with 50 mL <strong>of</strong><br />
95% ethanol under 80 KHz, 45° C in ultrasonic<br />
extraction device for 30 min, repeated twice. The extract<br />
was collected and filtered; the filtrate was dried at 50 °C<br />
under reduced pressure in a rotary evaporator. The dried<br />
crude extract was dissolved in the 100 mL mobile phase.<br />
After filtering through a filter paper and a 0.45 µm<br />
membrane filter (Millipore), the extract was injected into<br />
HPLC by autosampler.<br />
132 Thai Pharmaceutical and Health Science Journal, Vol. 2 No. 2, May. – Aug. 2007
Results and Discussions<br />
Optimization <strong>of</strong> chromatographic conditions<br />
The five phenolic compounds, GA, CA, RU, EA and<br />
QU, are polar molecules. In the beginning, various<br />
proportions <strong>of</strong> either methanol-water or acetonitrile-water<br />
system were used as mobile phases but separation was<br />
not satisfactory. The presence <strong>of</strong> <strong>acid</strong> in a mobile phase<br />
system gave a much better separation for GA, CA, RU,<br />
EA and QU except it could not separate baseline RU and<br />
EA. The gradient elution <strong>of</strong> solvent A [water-acetic <strong>acid</strong><br />
(25:1 v/v)] and solvent B (methanol) had a significant<br />
effect on the resolution <strong>of</strong> compounds. As a result,<br />
solvent gradients were formed, using dual pumping<br />
system, by varying the proportion <strong>of</strong> solvent A<br />
[water-acetic <strong>acid</strong> (25:1, v/v)] to solvent B (methanol).<br />
Solvent B was increased to 50% in 4 min and<br />
subsequently increased to 80% in 10 min at a flow rate<br />
<strong>of</strong> 1.0 mL/min. Detection wavelength was 280 nm.<br />
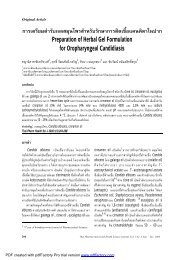
Figure 2 Chromatographic pr<strong>of</strong>ile using gradient elution.<br />
The peaks correspond to five reference<br />
standard phenolic compounds: 1 = gallic <strong>acid</strong><br />
(t R = 5.0 min); 2 = catechin (t R = 6.8 min); 3 =<br />
rutin (t R = 9.2 min); 4 = ellagic <strong>acid</strong> (t R = 9.9<br />
min) and 5 = quercetin (t R = 11.3 min)<br />
measured at 280 nm.<br />
It can be seen from Figure 2 that a good separation<br />
can be achieved within 15 min using the condition<br />
described. Symmetrical, sharp and well-resolved peaks<br />
were observed for GA, CA, RU, EA and QU. The elution<br />
order and the retention times for GA, CA, RU, EA and<br />
QU were 5.0, 6.8, 9.2, 9.9 and 11.3 min respectively.<br />
The proposed method was validated regarding recovery,<br />
linearity, detection limit, precision, selectivity and stability.<br />
Linearity, precision and detection limit<br />
A series <strong>of</strong> the standard mixture solutions <strong>of</strong> these<br />
five phenolic compounds were tested to determine the<br />
linearity between the standard mixture concentrations<br />
and peak areas. The standard response curve for each<br />
phenolic was a linear regression fitted to triplicate values<br />
obtained at each <strong>of</strong> five concentrations (2.62 – 21, 10.85<br />
- 86.80, 10 – 80, 10.05 – 80.40 and 10.05 - 80.40<br />
µg.mL -1 for GA, CA, RU, EA and QU respectively). The<br />
linearity relationship between peak areas and<br />
concentrations was good and the correlation coefficients<br />
(r 2 ) were greater than 0.9994 for all curves.<br />
The results <strong>of</strong> regression analysis on calibration<br />
curves and detection limits are presented in Table 1. The<br />
detection limits <strong>of</strong> five phenolic compounds were<br />
between 0.3709 and 1.3191 µg.mL -1 evaluated on the<br />
basis <strong>of</strong> a signal-to-noise ratio <strong>of</strong> 3 (S/N = 3).<br />
Standard mixture solutions <strong>of</strong> two concentrations, at<br />
high and low concentrations, were injected five times to<br />
determine the reproducibility <strong>of</strong> the peak areas and<br />
retention times under the optimum conditions. Intra-day<br />
and inter-day relative standard deviations (R.S.D.) for<br />
retention time and peak areas are considerably low<br />
(Table 2) indicating that the precision is good. Stability <strong>of</strong><br />
crude extract was tested every 24 h for 7 days, and was<br />
found to be rather stable throughout the 7-day period<br />
(R.S.D. < 2.0%).<br />
Thai Pharmaceutical and Health Science Journal, Vol. 2 No. 2, May. – Aug. 2007 133
Table 1 Validation data from calibration curves <strong>of</strong> five phenolic compounds<br />
Compound<br />
Regression equation<br />
(n =5)<br />
Correlation<br />
coefficient (r 2 )<br />
Linearity range<br />
(µg.mL -1 )<br />
Detection limit<br />
(µg.mL -1 )<br />
GA y = 24440(± 189)x – 201.73(± 33.8) 0.9994 2.625 - 21.0 0.3709<br />
CA y = 6544.8(± 47)x – 57.76(± 11.39) 0.9999 10.85 - 86.8 1.3191<br />
RU y = 8295.9(± 71)x + 121.99(± 36.47) 0.9997 10.0 - 80.0 0.9757<br />
EA y = 15329(± 246)x – 245.43(± 40.07) 0.9995 10.05 - 80.4 0.5999<br />
QU y = 13868 (± 133)x + 182.21(± 31.41) 0.9999 10.05 - 80.4 0.5706<br />
Table 2 Precision <strong>of</strong> standard solutions at low and high concentrations (n = 5)<br />
Compound<br />
Concentration<br />
(µg.mL -1 )<br />
Peak area<br />
(% R.S.D.)<br />
Intra-day precision<br />
Retention time<br />
(% R.S.D.)<br />
Peak area<br />
(% R.S.D.)<br />
Inter-day precision<br />
Retention time<br />
(% R.S.D.)<br />
GA 2.62 1.11 0.38 1.20 0.41<br />
21.00 0.99 0.31 1.13 0.34<br />
CA 10.85 1.15 0.42 1.18 0.40<br />
86.80 0.67 0.31 1.06 0.32<br />
RU 10.00 1.01 0.47 1.25 0.43<br />
80.00 0.98 0.28 1.23 0.32<br />
EA 10.05 1.65 0.31 1.75 0.35<br />
80.40 1.03 0.34 1.66 0.36<br />
QU 10.05 1.31 0.29 1.65 0.34<br />
80.40 0.92 0.36 1.15 0.33<br />
Sample analysis and recovery<br />
The ethanol extracts <strong>of</strong> M. alba, C. pulcherrima and<br />
N. nucifera flowers were analysed under the proposed<br />
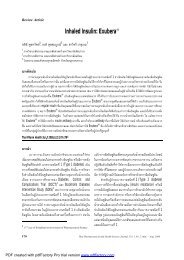
conditions. The chromatographic separations <strong>of</strong> GA,<br />
CA, RU, EA and QU in ethanol extracts <strong>of</strong> these<br />
flowers are shown in Figures 3(a) – (c). The content<br />
<strong>of</strong> each phenolic compound was calculated from the<br />
corresponding calibration curve and presented as the<br />
mean <strong>of</strong> five determinations as shown in Table 3. It<br />
was found that M. alba. and N. nucifera flower extracts<br />
contained CA, RU, EA and QU, while C. pulcherrima<br />
flower extract contained GA, CA, RU and EA.<br />
The recovery experiments <strong>of</strong> the five phenolic<br />
compounds were performed by adding GA, CA, RU,<br />
EA and QU standard solutions (20 and 60 µg.mL -1 ) to<br />
the flower extracts, which were treated according to<br />
the procedure described in sample preparation section<br />
for five times. The recovery <strong>of</strong> the five phenolic<br />
compounds was between 96.34 and 102.56% (see<br />
Table 4).<br />
134 Thai Pharmaceutical and Health Science Journal, Vol. 2 No. 2, May. – Aug. 2007
(a)<br />
(b)<br />
Figure 3 HPLC chromatograms <strong>of</strong> (a) M. alba, (b) C.<br />
pulcherrima and (c) N. nucifera ethanolic<br />
extracts Peaks: 1 = gallic <strong>acid</strong> (t R = 5.0 min);<br />
2 = catechin (t R = 6.8 min); 3 = rutin (t R = 9.2<br />
min); 4 = ellagic <strong>acid</strong> (t R = 9.9 min) and 5 =<br />
quercetin (t R = 11.3 min)<br />
(c)<br />
Table 3 Contents <strong>of</strong> five phenolic compounds in the extract <strong>of</strong> flowers (n=5)<br />
Compound<br />
M. alba C. pulcherrima N. nucifera<br />
Content (mg.g -1 ) % R.S.D. Content (mg.g -1 ) % R.S.D. Content (mg.g -1 ) % R.S.D.<br />
GA ND a - b 2.07 1.81 ND a - b<br />
CA 0.62 2.12 3.69 1.44 7.03 1.50<br />
RU 3.18 1.70 6.21 2.14 4.89 1.79<br />
EA 1.44 2.07 3.63 2.30 5.18 1.97<br />
QU 3.05 1.33 ND a - b 0.68 1.81<br />
a<br />
ND = not detected, b not applicable.<br />
Table 4 Recoveries <strong>of</strong> the five phenolic compounds in the flower extracts (n=5)<br />
Compound<br />
Amount added M. alba C. pulcherrima N. nucifera<br />
(µg.mL -1 ) Recovery (%) R.S.D. (%) Recovery (%) R.S.D. (%) Recovery (%) R.S.D. (%)<br />
GA 20 98.56 1.35 101.32 1.42 98.84 1.05<br />
60 99.70 1.11 102.56 1.36 99.13 0.98<br />
CA 20 96.94 1.58 98.03 1.26 100.68 1.35<br />
60 98.05 1.49 99.62 1.24 100.19 1.22<br />
RU 20 98.06 1.03 96.87 1.53 97.51 1.60<br />
60 98.90 1.18 97.25 1.58 99.69 1.25<br />
EA 20 97.75 1.68 96.34 1.72 98.42 1.28<br />
60 99.15 1.22 97.08 1.36 98.17 1.08<br />
QU 20 99.64 1.38 100.73 1.09 99.29 1.76<br />
60 99.41 1.07 99.65 1.02 98.76 1.30<br />
Thai Pharmaceutical and Health Science Journal, Vol. 2 No. 2, May. – Aug. 2007 135
Conclusions<br />
A new HPLC method to simultaneously analyze gallic<br />
<strong>acid</strong>, catechin, rutin, ellagic <strong>acid</strong> and qurecetin has been<br />
developed and validated for stability, linearity, accuracy<br />
and precision. This HPLC procedure provided excellent<br />
identification and quantification <strong>of</strong> these five phenolic<br />
compounds presented in M. alba, C. pulcherrima and N.<br />
nucifera flowers with a short analysis time (15 min). The<br />
experimental results indicated that C. pulcherrima flower<br />
extract contained an especially high concentration <strong>of</strong><br />
gallic <strong>acid</strong> (2.07 mg.g -1 dry weight). It was also shown<br />
that catechin, rutin and ellagic <strong>acid</strong> were detected in all<br />
flower extracts and M. alba flower contained highest<br />
amount <strong>of</strong> quercetin (3.05 mg.g -1 dry weight). Since the<br />
phenolic compounds have been <strong>of</strong> interest <strong>of</strong> health<br />
benefits, the present analytical study could be a potential<br />
application to identify and quantify the phenolic<br />
compounds in other flower extracts.<br />
Acknowledgements<br />
This work was supported by Srinakharinwirot<br />
University research fund. The authors would like to thank<br />
the Natural Product Evaluation Center (NPEC), Faculty<br />
<strong>of</strong> Pharmacy, Srinakharinwirot University for providing<br />
research facilities.<br />
References<br />
1. Robards K, Prenzler PD, Tucker G, Swatsitang P, Glover<br />
W. Phenolic compounds and their role in oxidative<br />
processes in fruits. Food Chem 1999;66:401-436.<br />
2. Nikolic KM. Theoretical study <strong>of</strong> phenolic antioxidants<br />
properties in reaction with oxygen-centered radicals. J<br />
Mol Struc: THEOCHEM 2006;774(1-3):95-105.<br />
3. Azzi A, Davies KJA, Kelly F. Free radical biology –<br />
terminology and critical thinking. FEBS Lett 2004;558:<br />
3-6.<br />
4. Baydar NG, Özkan G, Yaşar S. Evaluation <strong>of</strong> the<br />
antiradical and antioxidant potential <strong>of</strong> grape extracts.<br />
Food Control 2007;18(9):1131-1136.<br />
5. Wu LC, Hsu HW, Chen YC, Chiu CC, Lin YI, Ho JAA.<br />
Antioxidant and antiproliferative activities <strong>of</strong> red pitaya.<br />
Food Chem 2006;95:319-327.<br />
6. Duthie GG, Duthie SJ, Kyle JAM. Plant polyphenols in<br />
cancer and heart disease: implications as nutritional<br />
antioxidants. Nu. Res Rev 2000;13:79-106.<br />
7. Myhrstad MCW, Carlsen H, Nordström O, Blomhuff R,<br />
Moskaung JO. Flavonoids increase the intracellular<br />
glutathione level by transactivation <strong>of</strong> the<br />
γ-glutamylcysteine synthetase catalytical subunit<br />
promoter. Free Rad Biol Med 2002;32:386-393.<br />
8. Sun AY, Chen YM. Oxidative stress and<br />
neurodegenerative disorders. J Biomed Sci 1998;5:401-<br />
414.<br />
9. Frankel EN, Kanner J, German JB, Parks E, Kinsella JE.<br />
Inhibition <strong>of</strong> oxidation <strong>of</strong> human low-density lipoprotein<br />
by phenolic substances in red wine. Lancet 1993;341:<br />
454-457.<br />
10. Justesen U, Knuthsen P. Composition <strong>of</strong> flavonoids in<br />
fresh herbs and calculation <strong>of</strong> flavonoid intake by use <strong>of</strong><br />
herbs in traditional Danish dishes. Food Chem 2001;73:<br />
245-250.<br />
11. Soong YY, Barlow PJ. Antioxidant activity and phenolic<br />
content <strong>of</strong> selected fruit seeds. Food Chem 2004;88:411-<br />
417.<br />
12. Rizzo M, Ventrice D, Varone MA, Sidari R, Carini A.<br />
HPLC determination <strong>of</strong> phenolics adsorbed on yeasts. J<br />
Pharm Biomed Anal 2006;42:46-55.<br />
13. Amakura Y, Okada M, Tsuji S, Tonogai Y. <strong>Determination</strong><br />
<strong>of</strong> phenolic <strong>acid</strong>s in fruit juices by isocratic column liquid<br />
chromatography. J Chromatogr A 2000;891:183-188.<br />
14. Siriwoharn T, Wrolstad RE. Polyphenolic composition <strong>of</strong><br />
marion and evergreen blackberries. J Food Sci 2004;69:<br />
233-240.<br />
15. Zu Y, Li C, Fu Y, Zhao C. <strong>Simultaneous</strong> determination <strong>of</strong><br />
catechin, rutin, quercetin, kaempferol and isorhamnetin<br />
in the extract <strong>of</strong> sea buckthorn (Hippophae rhamnoides<br />
L.) leaves by RP-HPLC with DAD. J Pharm Biomed Anal<br />
2006;41:714-719.<br />
16. Soong YY, Barlow PJ. Quantification <strong>of</strong> gallic <strong>acid</strong> and<br />
ellagic <strong>acid</strong> from longan (Dimocarpus longan Lour.) seed<br />
and mango (Mangifera indica L.) kernel and their effects<br />
on antioxidant activity. Food Chem 2006;97:524-530.<br />
17. Proestos C, Sereli D, Komaitis M. <strong>Determination</strong> <strong>of</strong><br />
phenolic compounds in aromatic plants by RP-HPLC and<br />
136 Thai Pharmaceutical and Health Science Journal, Vol. 2 No. 2, May. – Aug. 2007
GC-MS. Food Chem 2006;95:44-52.<br />
18. Yang XR, Ye CX, Xu JK, Jiang YM. <strong>Simultaneous</strong><br />
analysis <strong>of</strong> purine alkaloids and catechins in Camellia<br />
sinensis, Camellia ptilophylla and Camellia assamica var.<br />
kucha by HPLC. Food Chem 2007;100:1132-1136.<br />
Thai Pharmaceutical and Health Science Journal, Vol. 2 No. 2, May. – Aug. 2007 137