NECSA Conference Cooking Up The Profits!
NECSA Conference Cooking Up The Profits!
NECSA Conference Cooking Up The Profits!

Create successful ePaper yourself
Turn your PDF publications into a flip-book with our unique Google optimized e-Paper software.
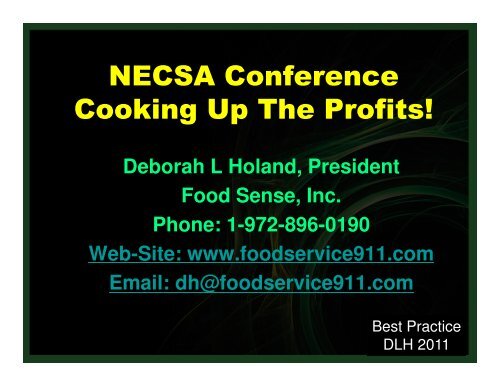
<strong>NECSA</strong> <strong>Conference</strong><br />
<strong>Cooking</strong> <strong>Up</strong> <strong>The</strong> <strong>Profits</strong>!<br />
Deborah L Holand, President<br />
Food Sense, Inc.<br />
Phone: 1-972-896-0190<br />
Web-Site: www.foodservice911.com<br />
Email: dh@foodservice911.com<br />
Best Practice<br />
DLH 2011
Presentation Overview<br />
Best Practices to Profitable Foodservice:<br />
1. Establish Clear Strategic Operational Plan<br />
2. Create Strong Value Proposition Concepts<br />
3. Engineer High Variety, Low Complexity Menus<br />
4. Engineer High DQPS & Penny Profit Menus<br />
5. Develop EFR Delivery & Cost Control Systems<br />
Best Practice<br />
DLH 2011
Presentation Overview<br />
Best Practices to Profitable Foodservice:<br />
6. Develop Efficient Production & Service Models<br />
7. Manage Par Levels Daily to Reduce OOS & Waste<br />
8. Execute Daily Sales and Profit Control Systems<br />
9. Execute Effective Sales & Marketing Programs<br />
10. Execute Consistent Standards of Excellence<br />
Best Practice<br />
DLH 2011
Best Practice #1<br />
Establish Clear Strategic Operational Plan:<br />
1. Perform Thorough Strategic Assessment<br />
2. Review Organizational Strengths &<br />
Weaknesses for Operations Support Needs<br />
3. Develop a Strong Value Proposition Standard<br />
4. Apply Effective Menu Engineering Strategies<br />
5. Develop Operational Enablers for Success<br />
Leave no stone unturned!<br />
Best Practice<br />
DLH 2011
Best Practice #2<br />
Create Strong Value Proposition Concepts:<br />
1. Identify Key Customer Behaviors & Trends<br />
2. Develop Product Profiles & Specs<br />
3. Engineer Efficient & Profitable Menu Models<br />
4. Develop Effective Design & Marketing Strategies<br />
5. Consider Value Equation in all Decisions:<br />
• Quality + Variety + Freshness + Consistency +<br />
Convenience + Atmosphere / Price = Value<br />
Price is Simply an “Anti” into the Game!<br />
Best Practice<br />
DLH 2011
Best Practice #3<br />
Engineer High Variety, Low Complexity Menus:<br />
1. Anticipate QSR, LSR and FSR Trends<br />
2. Develop Recipes 10 Ingredients or Less<br />
3. Develop Recipes 5 Labor Steps or less<br />
4. Ensure Each Ingredients used Min. 3 times<br />
5. KISS! Less is More! Consistency is key!<br />
Make your Inventory Work for You!<br />
Best Practice<br />
DLH 2011
Best Practice #4<br />
Engineer High DQPS & Penny Profit Menus :<br />
1. Constantly Review Monthly Stats DQPS<br />
2. Deploy Accurate ABC Menu Costing Models<br />
3. Review Penny Profit Opportunities Monthly<br />
4. Constantly Revise Specs and Recipes to Drive<br />
Penny Profit to highest levels<br />
5. Ensure Consistent Product Presentations<br />
We Take Dollars to the Bank, not Percentages!<br />
Best Practice<br />
DLH 2011
Cost Accounting & Recipe<br />
Management<br />
Costing Accounting<br />
• Target A Maximum 35=40% Food Cost<br />
• Benchmark Waste Targets 6% Maximum<br />
• Report Running Food Cost Not Supplies<br />
• Include Labor Factors For Fully Loaded P&L<br />
• Target Profit Before Facilities Allocation 30-35%<br />
Example: Computrition, Foodtrak, Pinnacle,<br />
In-house.<br />
Best Practice<br />
DLH 2011
Case Study Example<br />
Elements: Before: After: .<br />
• Value Weak, Not Clear Strong, Focused<br />
• Appeal<br />
Low Quality Diversified, Healthful<br />
• Selection Stagnant, Repetitive TOD & DOW Sets<br />
• Identity Low Price, Flat Value Price, Leader<br />
• Price Low Profit Model Competitive, High PQ<br />
• Efficiency High Shrink Below Avg. Shrink<br />
• Execution<br />
Labor Intense<br />
High DQPS & SPMH<br />
Complex, Low EFR Simplified, Strong EFR<br />
Best Practice<br />
DLH 2011
Penny Profit Menu<br />
Engineering Matrix<br />
Penny Profit Per Item Sold<br />
$2.50<br />
$2.25<br />
$2.00<br />
$1.75<br />
$1.50<br />
$1.25<br />
$1.00<br />
$.75<br />
$.50<br />
Seafood<br />
Salad<br />
Wedge<br />
Turkey<br />
Sub<br />
Greek<br />
Wrap<br />
Chicken<br />
Salad<br />
Wedge<br />
Turkey<br />
Wedge<br />
Chicken<br />
Salad<br />
Croissant<br />
Seafood<br />
Salad Pita<br />
Dijon Ham<br />
Swiss<br />
Smoked<br />
Ham Sub<br />
.5 1 1.5 2 2.5 3 3.5 4 4.5 5 5.5 6 6.5 7 7.5<br />
Best Practice<br />
Daily Average Quantity Sold per Store<br />
DLH 2011
Penny Profit Menu<br />
Engineering Matrix<br />
Penny Profit Per Item Sold<br />
$2.50<br />
$2.25<br />
$2.00<br />
$1.75<br />
$1.50<br />
$1.25<br />
$1.00<br />
$.75<br />
$.50<br />
Seafood<br />
Salad<br />
Wedge<br />
Losers<br />
Turkey<br />
Sub<br />
Greek<br />
Wrap<br />
Chicken<br />
Salad<br />
Wedge<br />
Turkey<br />
Wedge<br />
Chicken<br />
Salad<br />
Croissant<br />
Seafood<br />
Salad Pita<br />
Winners<br />
Dijon Ham<br />
Swiss<br />
.5 1 1.5 2 2.5 3 3.5 4 4.5 5 5.5 6 6.5 7 7.5<br />
Daily Average Quantity Sold per Store<br />
Smoked<br />
Ham Sub<br />
Best Practice<br />
DLH 2011
CASE STUDY MODEL<br />
Retail Fresh Sandwich Program<br />
Revitalization Initiative for In-House Production Program<br />
Before<br />
After<br />
Financial Impact<br />
Fav/-Unfav<br />
Full-Svce Full/Self<br />
Financial Performance Only Service Variance Chg %<br />
Weekly Sales per Store $ 588 $ 784 $ 196 33%<br />
- Daily Quantity Sold 28 35 7 25%<br />
- Total Item Selection Count 63 34 29 46%<br />
- Daily Qty Sold per Sku 0.44 1.03 0.58 132%<br />
<strong>The</strong>oretical GPM 57% 66% 9% 16%<br />
- Shrink 15% 6% 9% 60%<br />
- Net Gross Profit 42% 60% 18% 43%<br />
Direct Labor 30.3% 26.0% 4% 14%<br />
- SPLH Productivity $ 23.14 $ 26.92 $ 3.78 16%<br />
Direct Supplies 6.5% 4.5% 2% 31%<br />
Direct Net Profit 5% 30% 24% 462%<br />
Best Practice<br />
DLH 2011<br />
Total Store Expense Alloc. 30% 27% 3% 10%<br />
Annual Net Income/(Loss) -25% 3% 27% 110%
Best Practice #5<br />
Develop EFR Delivery & Cost Control Systems :<br />
1. Back Door all Ingredient and Inventory Items<br />
2. Structure Efficient Route Distribution Cycles<br />
3. Cross-Dock Highly Perishable Items<br />
4. Negotiate Mark-ups by Product Storage Specs<br />
5. Negotiate Vendor Rebates & Distribution<br />
Guarantees of Min. Shelf Life Delivery Specs<br />
Back Door All Items to Know TRUE Costs!<br />
Best Practice<br />
DLH 2011
Choosing Distributors<br />
• Start With Your Distributors Order Guide Of Products.<br />
• Ask Distributor For Product Rankings For All<br />
Movement.<br />
• Negotiate Frozen, Refrigerated And Shelf Stable<br />
Mark-up Separately, Along With A Cross-dock Option.<br />
• Source <strong>The</strong> Back Door Of All Distributors And<br />
Vendors! Not Just Food And Beverage But Packaging<br />
As Well.<br />
• Partner On Vendor Promotions And Rebates.<br />
• Have Force-out Program To Ensure Timely Entry.<br />
• It’s A Partnership…it Takes Both To Be Successful!<br />
Best Practice<br />
DLH 2011
Supply Chain Systems<br />
EFR Efficient Foodservice Response<br />
• Delivered Pre-packaged Ready Self Serve. Main &<br />
Collateral<br />
• Finished Main Ingredients: Bulk Instant Ready-Salad,<br />
Soup, Main Dishes, Prep Grilled Chicken, Bulk Desserts /<br />
Bakery<br />
• Prep Ready Ingredients: Pre-sliced/Chopped, Bases i.e.<br />
Sauces, Pull-Thaw & Bake Items<br />
• Foodservice Commissary Outsourcing: Consider local<br />
Cater<br />
• Cross-docking Fresh Foods through Distribution to Store<br />
GOAL CREATE THE ILLUSION OF FRESH ON-SITE<br />
Best Practice<br />
MINIMIZING PREP. VENDOR PARTNERSHIPS KEY!<br />
DLH 2011
Best Practice #6<br />
Develop Efficient Production & Service Models :<br />
1. Conduct Time & Motion Studies of Products<br />
2. Target Production Max. Speed 3 minutes Item<br />
3. Minimize all in-house Prep Possible to Control<br />
Cost & Consistency, No Quality Compromises<br />
4. Utilize Daily Production Schedules to Track<br />
Par Levels, OOS and Waste. Profit Driver!<br />
5. Offer Fast Service Models, Self-Service/To-Go<br />
Perception is Key…We Serve it Your Way!<br />
Best Practice<br />
DLH 2011
Labor Management -<br />
SPLH<br />
• SPLH – Sales per Labor Hour<br />
• Schedule based on Production<br />
• Front-Load Production<br />
• Time Clock Management<br />
Plan Labor by Shift not by Day<br />
Calculate SPLH by TOD Shift<br />
When able report by shift<br />
Live Productivity Receipts<br />
Best Practice<br />
DLH 2011
Best Practice #7<br />
Manage Par Levels Daily to Reduce OOS & Waste:<br />
1. Establish Daily Production Schedule Standard<br />
2. Determine Daily Par Levels by TOD/DOW<br />
3. Record Daily On-Hand Counts by Venue<br />
4. Take OOS Counts Min. 2 times per day<br />
5. Record Waste by Item Daily & REACT!<br />
Deploy Zero Tolerance Policy - 100% Compliance!<br />
Best Practice<br />
DLH 2011
OOS & Waste Tracking<br />
• Record Waste on Production Logs<br />
• Report Waste from Back Office<br />
• Adjust Sales Projections using OOS<br />
and Waste<br />
Example:<br />
Prod OH/OOS Waste<br />
Ham Sandwich 5 3/0 1<br />
Turkey Sand 4 0/11am 0<br />
Egg Salad 3 /7pm 0<br />
Adjust and react DAILY!<br />
Best Practice<br />
DLH 2011
OOS - Out of Stock<br />
Management<br />
• OOS Counts – Minimum twice per day<br />
Pre-Lunch 10:30am, After Lunch 2pm<br />
Pre-dinner 5pm, After Dinner 7pm<br />
• Design reporting for Zero Sales off back<br />
office<br />
• Track Out of Stocks on Production Logs<br />
• Record and React! Sales will go up 20%+<br />
Best Practice<br />
DLH 2011
Production Management<br />
TOD/DOW<br />
• Report Sales by Day part<br />
TOD – Time of Day<br />
DOW – Day of Week<br />
• Production Logs<br />
Track waste and out of stocks twice day<br />
One tool to manage the entire program<br />
Daily accountability at store level is<br />
critical!<br />
Best Practice<br />
DLH 2011
Best Practice #8<br />
Execute Daily Sales and Profit Control Systems:<br />
1. Daily Sales & Profit Log – Accountable Weekly<br />
• Store Sales, FS Sales, COGS, Meat Cost, Supplies,<br />
Labor Cost & Productivity, Direct Profit<br />
2. Production Schedules – Pars, OOS & Waste<br />
3. Labor Productivity Schedules – Shift SPLH<br />
4. Cost Accounting & Recipe Management<br />
5. Analyze Performance Opportunity Gaps<br />
Communicate Results and REACT!<br />
Best Practice<br />
DLH 2011
Performance Gap<br />
Analysis<br />
• Rank Stores on Sales, <strong>The</strong>n on<br />
Margin<br />
• Opportunity Gaps are Key!<br />
Example:<br />
Sales Rank Margin Rank Gap<br />
Store #1 $20k 1 52% 5 -4<br />
Store #5 $18k 2 54% 4 +2<br />
Store #4 $15k 3 56% 3 0<br />
Store #3 $14k 4 57% 1 +3<br />
Best Practice<br />
DLH 2011
Best Practice #9<br />
Execute Effective Sales & Marketing Programs :<br />
1. Internal Marketing Drives Impulsive Sales<br />
2. Design Venues for Visual Appeal Slow Times<br />
3. Value Proposition Drives Repeat Business<br />
4. Daily Specials can Drive Sales 20-30%+<br />
5. Plan Menu <strong>Up</strong>grades Minimum Spring/Fall<br />
Constantly <strong>Up</strong>grade Menu, before Competition<br />
Downgrades YOU! Brand Awareness!<br />
Best Practice<br />
DLH 2011
Essential Brand Building<br />
and Marketing Materials<br />
• P.O.S. Display<br />
• Venue Signage<br />
• Menu Boards &<br />
Daily Specials<br />
Easels<br />
• Printed To-Go<br />
Menus<br />
• Register / Door<br />
Signage<br />
• Delivery Service<br />
• Napkin Holders<br />
• Training Materials<br />
• Logo Packaging<br />
• Grab n Go Impulse<br />
• Pedestal Signs<br />
• Uniforms, Name<br />
tags, Promo<br />
Buttons<br />
Best Practice<br />
DLH 2011
Best Practice #10<br />
Execute Consistent Standards of Excellence :<br />
1. Adopt a Zero Tolerance Policy to Key Food<br />
Safety and Execution Standards<br />
2. Set Excellence Bar High Above Min. Standard<br />
3. Provide Tools of Success – Train, Train, Train!<br />
4. Execute Reward & Accountability Systems<br />
5. Constantly Evolve Operations and Menus<br />
Develop Culture of Pro-Change and to Constantly<br />
Exceed Customer Expectations!<br />
Best Practice<br />
DLH 2011
For your Complimentary<br />
Foodservice Scorecard &<br />
PQ Survey tool<br />
please contact:<br />
Deborah Holand<br />
972-896-0190 – phone<br />
dh@foodservice911.com<br />
Best Practice<br />
DLH 2011