

TimkenSteel-2014-Annual-Report-FINAL-03112015_v001_d4t4ig
TimkenSteel-2014-Annual-Report-FINAL-03112015_v001_d4t4ig
TimkenSteel-2014-Annual-Report-FINAL-03112015_v001_d4t4ig

You also want an ePaper? Increase the reach of your titles
YUMPU automatically turns print PDFs into web optimized ePapers that Google loves.
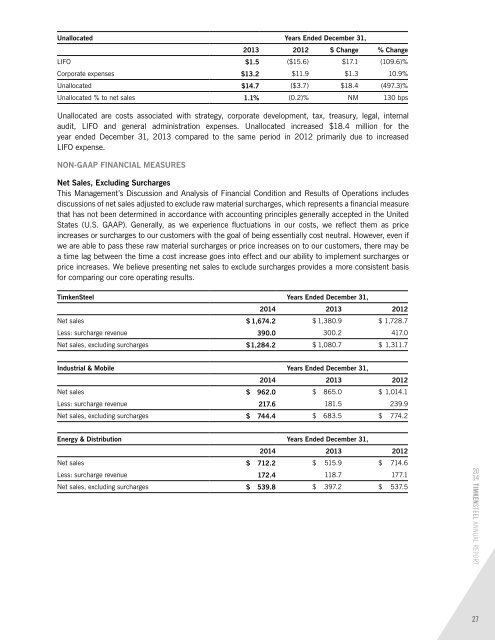
Unallocated Years Ended December 31,<br />
2013 2012 $ Change % Change<br />
LIFO $1.5 ($15.6) $17.1 (109.6)%<br />
Corporate expenses $13.2 $11.9 $1.3 10.9%<br />
Unallocated $14.7 ($3.7) $18.4 (497.3)%<br />
Unallocated % to net sales 1.1% (0.2)% NM 130 bps<br />
Unallocated are costs associated with strategy, corporate development, tax, treasury, legal, internal<br />
audit, LIFO and general administration expenses. Unallocated increased $18.4 million for the<br />
year ended December 31, 2013 compared to the same period in 2012 primarily due to increased<br />
LIFO expense.<br />
NON-GAAP FINANCIAL MEASURES<br />
Net Sales, Excluding Surcharges<br />
This Management’s Discussion and Analysis of Financial Condition and Results of Operations includes<br />
discussions of net sales adjusted to exclude raw material surcharges, which represents a financial measure<br />
that has not been determined in accordance with accounting principles generally accepted in the United<br />
States (U.S. GAAP). Generally, as we experience fluctuations in our costs, we reflect them as price<br />
increases or surcharges to our customers with the goal of being essentially cost neutral. However, even if<br />
we are able to pass these raw material surcharges or price increases on to our customers, there may be<br />
a time lag between the time a cost increase goes into effect and our ability to implement surcharges or<br />
price increases. We believe presenting net sales to exclude surcharges provides a more consistent basis<br />
for comparing our core operating results.<br />
<strong>TimkenSteel</strong> Years Ended December 31,<br />
<strong>2014</strong> 2013 2012<br />
Net sales $ 1,674.2 $ 1,380.9 $ 1,728.7<br />
Less: surcharge revenue 390.0 300.2 417.0<br />
Net sales, excluding surcharges $ 1,284.2 $ 1,080.7 $ 1,311.7<br />
Industrial & Mobile Years Ended December 31,<br />
<strong>2014</strong> 2013 2012<br />
Net sales $ 962.0 $ 865.0 $ 1,014.1<br />
Less: surcharge revenue 217.6 181.5 239.9<br />
Net sales, excluding surcharges $ 744.4 $ 683.5 $ 774.2<br />
Energy & Distribution Years Ended December 31,<br />
<strong>2014</strong> 2013 2012<br />
Net sales $ 712.2 $ 515.9 $ 714.6<br />
Less: surcharge revenue 172.4 118.7 177.1<br />
Net sales, excluding surcharges $ 539.8 $ 397.2 $ 537.5<br />
20<br />
14<br />
TIMKENSTEEL ANNUAL REPORT<br />
27