

East Midlands Regional Spatial Strategy 2005/06
East Midlands Regional Spatial Strategy 2005/06
East Midlands Regional Spatial Strategy 2005/06

Create successful ePaper yourself
Turn your PDF publications into a flip-book with our unique Google optimized e-Paper software.
Table 4.24 - Continued<br />
Blaby<br />
Broxtowe<br />
Erewash<br />
Gedling<br />
Leicester City<br />
Nottingham<br />
Oadby and Wigston<br />
Total<br />
Jobs in 2003 Jobs in 2004* Jobs in <strong>2005</strong> % Change<br />
2004-05<br />
35,405<br />
32,743<br />
37,160<br />
31,237<br />
155,889<br />
179,416<br />
16,568<br />
1,768,296<br />
41,470<br />
33,384<br />
37,162<br />
27,796<br />
158,270<br />
182,071<br />
18,117<br />
1,803,658<br />
45,589<br />
35,329<br />
39,446<br />
29,967<br />
159,556<br />
184,911<br />
18,848<br />
1,858,204<br />
9.9<br />
5.8<br />
6.1<br />
7.8<br />
0.8<br />
1.6<br />
4.0<br />
3.0<br />
Rural<br />
Category<br />
LU<br />
LU<br />
LU<br />
LU<br />
LU<br />
LU<br />
LU<br />
Source: Annual Business Inquiry<br />
* 2004 data has been revised by ONS and differs from that published in the previous monitoring report<br />
The rural classification used to identify the rural nature of local authorities is the Defra rural and urban<br />
classification which can be found at the following website:<br />
http://statistics.defra.gov.uk/esg/rural_resd/rural_definition.asp.<br />
The classification shows the percentage of the area classified as rural, and then identifies the area as being either<br />
major urban (MU;1); large urban (LU;2); other urban (OU;3); significant rural (SR;4); rural-50 (R50;5) and rural-80<br />
(R80;6) where R50 is where at 50% is rural and R80 where at least 80% is rural<br />
Table 4.25 - Number of Jobs in Rural Categories<br />
Rural Category Jobs 2003 Jobs 2004* Jobs <strong>2005</strong> % Change 04-05<br />
R80<br />
R50<br />
SR<br />
OU<br />
LU<br />
Total<br />
274,130<br />
289,265<br />
282,319<br />
434,164<br />
488,418<br />
1,768,296<br />
276,<strong>06</strong>5<br />
290,482<br />
288,970<br />
449,871<br />
498,270<br />
1,803,659<br />
285,683<br />
305,757<br />
294,858<br />
458,260<br />
513,646<br />
1,858,204<br />
Source: Annual Business Inquiry<br />
Defra Rural categories<br />
*2004 data has been revised by ONS and differs from that published in the previous monitoring report<br />
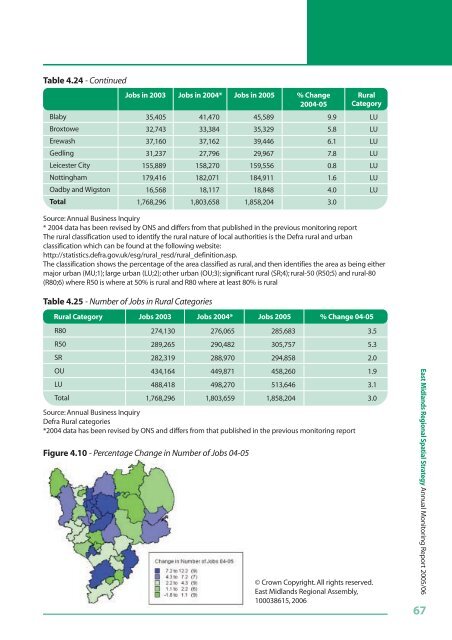
Figure 4.10 - Percentage Change in Number of Jobs 04-05<br />
3.5<br />
5.3<br />
2.0<br />
1.9<br />
3.1<br />
3.0<br />
© Crown Copyright. All rights reserved.<br />
<strong>East</strong> <strong>Midlands</strong> <strong>Regional</strong> Assembly,<br />
100038615, 20<strong>06</strong><br />
<strong>East</strong> <strong>Midlands</strong> <strong>Regional</strong> <strong>Spatial</strong> <strong>Strategy</strong> Annual Monitoring Report <strong>2005</strong>/<strong>06</strong><br />
67


