Cruise report - Coastal Observatory, Liverpool Bay, Irish Sea
Cruise report - Coastal Observatory, Liverpool Bay, Irish Sea
Cruise report - Coastal Observatory, Liverpool Bay, Irish Sea

Create successful ePaper yourself
Turn your PDF publications into a flip-book with our unique Google optimized e-Paper software.
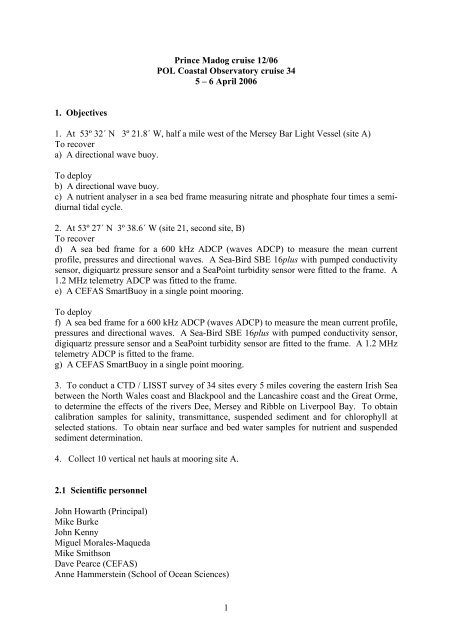
Prince Madog cruise 12/06<br />
POL <strong>Coastal</strong> <strong>Observatory</strong> cruise 34<br />
5 – 6 April 2006<br />
1. Objectives<br />
1. At 53º 32´ N 3º 21.8´ W, half a mile west of the Mersey Bar Light Vessel (site A)<br />
To recover<br />
a) A directional wave buoy.<br />
To deploy<br />
b) A directional wave buoy.<br />
c) A nutrient analyser in a sea bed frame measuring nitrate and phosphate four times a semidiurnal<br />
tidal cycle.<br />
2. At 53º 27´ N 3º 38.6´ W (site 21, second site, B)<br />
To recover<br />
d) A sea bed frame for a 600 kHz ADCP (waves ADCP) to measure the mean current<br />
profile, pressures and directional waves. A <strong>Sea</strong>-Bird SBE 16plus with pumped conductivity<br />
sensor, digiquartz pressure sensor and a <strong>Sea</strong>Point turbidity sensor were fitted to the frame. A<br />
1.2 MHz telemetry ADCP was fitted to the frame.<br />
e) A CEFAS SmartBuoy in a single point mooring.<br />
To deploy<br />
f) A sea bed frame for a 600 kHz ADCP (waves ADCP) to measure the mean current profile,<br />
pressures and directional waves. A <strong>Sea</strong>-Bird SBE 16plus with pumped conductivity sensor,<br />
digiquartz pressure sensor and a <strong>Sea</strong>Point turbidity sensor are fitted to the frame. A 1.2 MHz<br />
telemetry ADCP is fitted to the frame.<br />
g) A CEFAS SmartBuoy in a single point mooring.<br />
3. To conduct a CTD / LISST survey of 34 sites every 5 miles covering the eastern <strong>Irish</strong> <strong>Sea</strong><br />
between the North Wales coast and Blackpool and the Lancashire coast and the Great Orme,<br />
to determine the effects of the rivers Dee, Mersey and Ribble on <strong>Liverpool</strong> <strong>Bay</strong>. To obtain<br />
calibration samples for salinity, transmittance, suspended sediment and for chlorophyll at<br />
selected stations. To obtain near surface and bed water samples for nutrient and suspended<br />
sediment determination.<br />
4. Collect 10 vertical net hauls at mooring site A.<br />
2.1 Scientific personnel<br />
John Howarth (Principal)<br />
Mike Burke<br />
John Kenny<br />
Miguel Morales-Maqueda<br />
Mike Smithson<br />
Dave Pearce (CEFAS)<br />
Anne Hammerstein (School of Ocean Sciences)<br />
1
Martin Preston (<strong>Liverpool</strong> University)<br />
Conrad Chapman (<strong>Liverpool</strong> University)<br />
2.2 Ship’s officers and crew<br />
Steve Duckworth (Master)<br />
Dean Atkinson (Chief Officer)<br />
Aneurin Griffin(Chief Engineer)<br />
Les Black (Second Engineer)<br />
Phil Jones (A.B.)<br />
Leon Evans (A.B.)<br />
William Cummings (A.B.)<br />
Bernard Cannon (Cook)<br />
3. Narrative (times in GMT)<br />
The SmartBuoy toroid, anchor chain clumps, two sea-bed frames and instrumentation were<br />
loaded onto RV Prince Madog on the afternoon of 4 April 2006, after low water. Loading of<br />
the heavy gear was delayed until a mechanic had come to fix the tractor brakes. The<br />
SmartBuoy toroid was rolled down the walkway. The ADCP and nutrient frames were set up<br />
on the afterdeck and the tower and instruments fitted to the SmartBuoy toroid.<br />
RV Prince Madog left Menai Bridge at 07:00 on 5 April; see Figure 1 for the cruise track.<br />
Recording of surface sampling and the ship’s ADCP were started at 07:57, near Puffin Island<br />
but the pump for the underway sampling was not switched on until 08:37. Mooring site B<br />
(CTD station 21) was reached at 09:50 and the first CTD recorded. The ADCP release was<br />
fired at 10:05 but the ADCP did not surface. The ship manoeuvred closer (75 m) to the<br />
deployed site and the releases were fired again. The ADCP did not surface. There was no<br />
indication that the ADCP had moved since deployment. Several passes were made with a<br />
loop of wire behind the ship and although it is possible the ADCP frame was seen on the echo<br />
sounder, it did not surface. On about the tenth pass the ADCP finally surfaced at 12:30,<br />
although the weak link in the dragging loop had not broken. It appeared that the pellet line<br />
had been caught as this was now severed. One of the pellets was recovered (the other had no<br />
rope through it) followed by the frame at 12:46 and the ballast weight at 12:50. There was no<br />
indication as to why the frame had failed to surface although only one burn wire had been<br />
activated. (There was also no indication why the second burn wire had not melted.) The<br />
replacement ADCP was deployed at 13:16 and the SmartBuoy at 13:34. The original<br />
SmartBuoy was recovered at 13:39 – it had possibly moved as the recovery position appeared<br />
to be about 1.4 km east of the deployed position. The second CTD was recorded.<br />
The Mersey Bar site was reached at 15:14 and the nutrient analyser frame deployed. The<br />
wave Buoy was recovered between 15:30 and 15:45 and the replacement buoy deployed at<br />
16:13. A CTD was recorded followed by ten vertical net hauls for zooplankton, five with a 1<br />
m diameter ring and five with a 0.5 m diameter ring. The CTD survey then commenced with<br />
sites 10, 35, 2 – 15. By this time (08:00 on 6 April) the weather and sea state had become<br />
marginal for CTD operations so site 18 was next visited. However it was too rough and a<br />
southward course made down to 22, where a CTD was possible. Although the Welsh<br />
coastline was followed westward in the hope that Anglesey would provide shelter from the<br />
west south west gales it was too rough at station 23 but ok at 34. After a couple of hours<br />
2
sheltering in Conwy and Llandudno <strong>Bay</strong> the conditions were tested and found to be much<br />
improved so the remaining CTDs, except for site 16, were recorded, finishing at 03:08 on 7<br />
April. Surface monitoring and the ship’s ADCP were switched off a 05:07 and she was<br />
alongside at Menai Bridge at 05:45.<br />
The cruise had been very successful considering the time of year, with all the major<br />
objectives met and the CTD grid completed, except for one site. Some sites showed a high<br />
degree of saline stratification, up to 3 psu.<br />
Figure 1. <strong>Cruise</strong> track.<br />
4. Moorings (times in GMT)<br />
4.1 The set up of the recovered instruments was as follows:<br />
Site B<br />
d) Site B. Waves ADCP 600 kHz RDI 2390.<br />
Mode 1: 100 pings every 10 minutes (velocity standard deviation 0.007 m s -1 ).<br />
35 x 1 m bins (2.65 – 36.65 m above the bed).<br />
Beam co-ordinates - speeds, correlation, echo intensity, % good.<br />
Sound velocity calculated from temperature, depth and salinity of 32.<br />
Fitted with a pressure sensor and 1Gbyte PCMCIA memory; hourly wave recording enabled.<br />
Clock reset at 16:36:00 on 2 February 2006; delayed start 08:00:00 on 6 February 2006.<br />
Stopped at 19:00:00 on 5 April 2006. Record length 270,576 kbytes.<br />
3
<strong>Sea</strong>-Bird 16plus S/N 4737 on base of frame with pumped conductivity sensor underneath.<br />
<strong>Sea</strong>Point turbidity sensor: S/N 10489 taped to roll bar; set up for 0 - 125 FTU range.<br />
Sample interval 600 s;<br />
Clock set at 17:214:00 on 5 February; delayed start at 11:00:00 on 6 February 2006.<br />
Last sample at 16:00:03 on 19 April 2006. Record length 11667 samples.<br />
Telemetry ADCP 1.2 MHz RDI 0572.<br />
Mode 1: 100 pings every 10 minutes (velocity standard deviation 0.003 m s -1 ).<br />
30 x 1 m bins (2.15 – 31.65 m above the bed).<br />
Earth co-ordinates - speeds, correlation, echo intensity, % good.<br />
Sound velocity calculated from temperature, depth and salinity of 32.<br />
Fitted with a pressure sensor and 512 Mbyte PCMCIA memory.<br />
Clock reset at 16:27:00 on 2 February 2006; delayed start 11:50:00 on 8 February 2006.<br />
Last sample at 18:50 on 5 April 2006. Record length 3,047,424 bytes.<br />
Linquest modem 008602.<br />
The frame (no number) was fitted with two Benthos releases (SN 72858) – Rx 14.5 kHz, Tx<br />
12.0 kHz, release A and (S/N 72863) – Rx 12.0 kHz, Tx 13.5 kHz, release A both with burn<br />
wire, and a spooler with 200m of rope for recovery of the ballast weight.<br />
e) SmartBuoy Mooring.<br />
The CEFAS SmartBuoy is fitted with a surface CTD (including turbidity and fluorescence<br />
sensors). Bags for measurement of bacterial activity were fitted to the frame.<br />
There was no other instrumentation on the mooring.<br />
The single point mooring was composed mainly of ½" long link chain, marked by a 1.8 m<br />
diameter toroid and anchored by a half tonne clump of scrap chain.<br />
Table 1. Recovered mooring positions and times.<br />
Latitude Longitude Water Recovery<br />
(N) (W) Depth Time Date<br />
(m)<br />
Wave buoy (Site A) 53º 31.991´ 3º 21.204´ 25.0 15:30 05/04/06<br />
Waves ADCP (Site B) 53º 26.863´ 3º 38.186´ 24.6 10:05 05/04/06<br />
Smart Buoy (Site B) 53º 26.624´ 3º 37.215´ 23.8 13:39 05/04/06<br />
4.2 The set up of the deployed instruments was as follows:<br />
Site A<br />
c) Ecolab nutrient analyser measuring nitrate and phosphate four times in a semi-diurnal tidal<br />
cycle.<br />
The frame D1 was fitted with two Benthos releases 72850 – Rx 11.5 kHz, Tx 12.0 kHz,<br />
release C and 67679 – Rx 11.5 kHz, Tx 12.0 kHz, release B both with a burn wire, and a<br />
spooler with 200m of rope for recovery of the ballast weight.<br />
4
Site B<br />
f) Site B. Waves ADCP 600 kHz RDI 5806; .<br />
Mode 1: 100 pings every 10 minutes (velocity standard deviation 0.007 m s -1 ).<br />
35 x 1 m bins (2.65 – 36.65 m above the bed).<br />
Beam co-ordinates - speeds, correlation, echo intensity, % good.<br />
Sound velocity calculated from temperature, depth and salinity of 32.<br />
Fitted with a pressure sensor and 1Gbyte PCMCIA memory; hourly wave recording enabled.<br />
Clock reset at 13:31:00 on 4 April; delayed start 06:00:00 on 5 April 2006.<br />
<strong>Sea</strong>-Bird 16plus S/N 4736 on base of frame with pumped conductivity sensor underneath.<br />
<strong>Sea</strong>Point turbidity sensor taped to roll bar; set up for 0 - 125 FTU range.<br />
Sample interval 600 s; digiquartz integration time 40s, range=400; run pump 0.5s, 1 s delay.<br />
Clock set at 07:39:30 on 5 April 2006; delayed start at 11:00:00 on 5 April 2006.<br />
Telemetry ADCP 1.2 MHz RDI 3052.<br />
Mode 1: 100 pings every 10 minutes (velocity standard deviation 0.003 m s -1 ).<br />
Earth co-ordinates - speeds, correlation, echo intensity, % good.<br />
Sound velocity calculated from temperature, depth and salinity of 32.<br />
Fitted with a pressure sensor and 1 Gbyte PCMCIA memory.<br />
Clock reset at 13:09:30 on 4 April 2006; delayed start 11:50:00 on 5 April 2006.<br />
The frame D5 was fitted with two Benthos releases 72381 – Rx 11.0 kHz, Tx 12.0 kHz,<br />
release B and 71904 – Rx 10.0 kHz, Tx 12.0 kHz, release C both with a fizz link, and a<br />
spooler with 200m of rope for recovery of the ballast weight.<br />
g) SmartBuoy Mooring.<br />
The CEFAS SmartBuoy is fitted with a surface CTD (including turbidity and fluorescence<br />
sensors). The frame was fitted with bags for the determination of bacterial degradation.<br />
No other instrumentation was fitted to the mooring.<br />
The single point mooring was composed mainly of ½" long link chain, marked by a 1.8 m<br />
diameter toroid and anchored by a half tonne clump of scrap chain.<br />
Table 2. Deployed mooring positions and times.<br />
Latitude Longitude Water Deployed<br />
(N) (W) Depth Time Date<br />
(m)<br />
Wave buoy (Site A) 53º 32.022´ 3º 21.259´ 25.5 16:13 05/04/06<br />
Nutrient frame (Site A) 53º 32.277´ 3º 21.288´ 15:14 05/04/06<br />
Waves ADCP (Site B) 53º 26.861´ 3º 38.283´ 25.0 13:16 05/04/06<br />
Smart Buoy (Site B) 53º 26.730´ 3º 37.675´ 25.0 13:34 05/04/06<br />
(Telemetry toroid 53º 26.898´ 3º 38.226´)<br />
5. CTD<br />
5
The <strong>Sea</strong>-Bird 911 CTD recorded downwelling PAR light levels (CEFAS light sensor),<br />
temperature, conductivity, transmittance, oxygen (no calibration samples) and fluorescence at<br />
24 Hz. The frame was fitted with an altimeter, which was not totally reliable, so that<br />
measurements were taken to within an estimated 3 m above the bed. The rosette will take<br />
twelve 10 l water bottles although the capacity is reduced by one (for the LISST-25) and by<br />
two to accommodate a bottle with reversing thermometers. Two water bottles were fired near<br />
bed and two near the surface, when needed. One of the near bed bottles was fitted with two<br />
electronic thermometers to check the CTD temperature data. Water samples were taken from<br />
this bottle for calibration of the CTD salinity data. (At the CEFAS stations, see below, this<br />
bottle was fired near the surface). Water samples were taken from the near surface and near<br />
bed bottles and frozen for nutrient analysis by NOC (nitrate, phosphate, silicate), and also<br />
were filtered to determine suspended sediment load and calibrate the CTD transmissometer,<br />
by the School of Ocean Sciences. Water samples from the second near surface bottle from<br />
stations 1, 5 – 9 and 11 were filtered for chlorophyll and suspended sediment determination<br />
and some filtrate was preserved with mercuric chloride for nutrient determination by CEFAS.<br />
A LISST-25 particle sizer was fitted to the CTD and its data logged on the <strong>Sea</strong>-Bird data<br />
logging system. A LISST-100 particle sizer with internal logging was also attached to the<br />
CTD frame and its data periodically downloaded for analysis by SOS. Copies of the <strong>Sea</strong>-<br />
Bird binary files were taken off for processing and calibration at BODC / POL.<br />
Table 3. Nominal CTD positions.<br />
Site Latitude Longitude Visited Chlorophyll Suspended Trace<br />
(N) (W) on this & nutrients Sediments/ metal<br />
cruise<br />
nutrients<br />
1 53º 32´ 3º 21.8´ yes yes yes yes<br />
2 53º 37´ 3º 13.4´ yes yes yes<br />
3 53º 42´ 3º 13.4´ yes yes yes<br />
4 53º 47´ 3º 13.4´ yes yes yes<br />
5 53º 52´ 3º 21.8´ yes yes yes<br />
6 53º 47´ 3º 21.8´ yes yes yes<br />
7 53º 42´ 3º 21.8´ yes yes yes<br />
8 53º 37´ 3º 21.8´ yes yes yes<br />
9 53º 32´ 3º 21.8´ yes yes yes<br />
10 53º 27´ 3º 13.4´ yes yes yes<br />
11 53º 27´ 3º 21.8´ yes yes yes<br />
12 53º 27´ 3º 30.2´ yes yes yes<br />
13 53º 32´ 3º 30.2´ yes yes yes<br />
14 53º 37´ 3º 30.2´ yes yes yes<br />
15 53º 42´ 3º 30.2´ yes yes yes<br />
16 53º 47´ 3º 30.2´ no<br />
17 53º 47´ 3º 38.6´ yes yes<br />
18 53º 42´ 3º 38.6´ yes yes<br />
19 53º 37´ 3º 38.6´ yes yes<br />
20 53º 32´ 3º 38.6´ yes yes yes<br />
21 53º 27´ 3º 38.6´ yes yes yes yes<br />
22 53º 23´ 3º 38.6´ yes yes yes<br />
23 53º 23´ 3º 47.0´ yes yes yes<br />
24 53º 27´ 3º 47.0´ yes yes yes<br />
25 53º 32´ 3º 47.0´ yes yes yes<br />
6
26 53º 37´ 3º 47.0´ yes yes<br />
27 53º 42´ 3º 47.0´ yes yes<br />
28 53º 47´ 3º 47.0´ yes yes<br />
29 53º 47´ 3º 55.4´ yes yes<br />
30 53º 42 3º 55.4´ yes yes<br />
31 53º 37´ 3º 55.4´ yes yes<br />
32 53º 32´ 3º 55.4´ yes yes<br />
33 53º 27´ 3º 55.4´ yes yes<br />
34 53º 22´ 3º 55.4´ yes yes yes<br />
35 53º 32´ 3º 15.9´ yes yes yes<br />
Table 4. Surface and bottom parameters from CTD, noted in log book.<br />
Nominal positions.<br />
CTD Site Nuts Latitude Longitude Water<br />
no (N) (W) depth Temp Salinity<br />
(m) (deg)<br />
T/ B T / B T / B<br />
1 21 1/ 2 53º 27´ 3º 38.6´ 24 7.1 / 7.0 32.6 / 33.0<br />
4 1 3/ 4 53º 32´ 3º 21.8´ 26 7.6 / 7.0 30.1 / 33.1<br />
5 10 5/ 6 53º 27´ 3º 13.4´ 17 7.8 / 7.2 30.1 / 32.0<br />
6 35 7/ 8 53º 31.9´ 3º 15.9´ 13 7.1 / 7.2 30.5 / 30.9<br />
7 2 9/10 53º 37´ 3º 13.4´ 13 6.9 / 6.9 31.0 / 31.2<br />
8 3 11/12 53º 42´ 3º 13.4´ 18 7.0 / 6.7 31.1 / 31.7<br />
9 4 13/14 53º 47´ 3º 13.4´ 16 6.8 / 6.8 31.5 / 31.5<br />
10 5 15/16 53º 52´ 3º 21.8´ 15 6.4 / 6.4 31.8 / 31.8<br />
11 6 17/18 53º 47´ 3º 21.8´ 20 6.5 / x.x 31.7 / xx.x<br />
12 7 19/20 53º 42´ 3º 21.8´ 25 7.1 / 6.8 31.5 / 32.9<br />
13 8 21/22 53º 37´ 3º 21.8´ 28 7.2 / 6.9 30.9 / 32.4<br />
14 9 23/24 53º 32´ 3º 21.8´ 29 7.3 / 7.0 30.4 / 33.1<br />
15 11 25/26 53º 27´ 3º 21.8´ 20 7.1 / 7.0 32.2 / 32.5<br />
16 12 27/28 53º 27´ 3º 30.2´ 21 7.1 / 7.1 32.8 / 32.8<br />
17 13 29/30 53º 32´ 3º 30.2´ 33 7.3 / 7.0 32.2 / 33.2<br />
18 14 31/32 53º 37´ 3º 30.2´ 30 7.1 / 7.2 32.1 / 33.4<br />
19 15 33/34 53º 42´ 3º 30.2´ 38 6.9 / 6.9 32.1 / 33.1<br />
20 22 35/36 53º 23´ 3º 38.6´ 11 7.6 / 7.6 32.5 / 32.5<br />
21 34 37/38 53º 22´ 3º 55.4´ 24 7.3 / 7.3 33.1 / 33.1<br />
22 23 39/40 53º 23´ 3º 47.0´ 20 7.3 / 7.3 33.3 / 33.3<br />
23 24 41/42 53º 27´ 3º 47.0´ 35 7.3 / 7.3 33.5 / 33.5<br />
24 25 43/44 53º 32´ 3º 47.0´ 45 7.4 / 7.4 33.8 / 33.8<br />
25 20 45/46 53º 32´ 3º 38.6´ 36 7.3 / 7.3 33.6 / 33.7<br />
26 19 47/48 53º 37´ 3º 38.6´ 34 7.1 / 7.3 33.4 / 33.7<br />
27 18 49/50 53º 42´ 3º 38.6´ 40 6.9 / 7.0 32.0 / 33.4<br />
28 17 51/52 53º 47´ 3º 38.6´ 36 6.7 / 6.9 31.8 / 33.4<br />
29 28 53/54 53º 47´ 3º 47.0´ 41 6.9 / 7.1 32.4 / 33.6<br />
30 29 55/56 53º 47´ 3º 55.4´ 42 7.1 / 7.2 33.6 / 33.7<br />
31 30 57/58 53º 42 3º 55.4´ 42 7.1 / 7.2 33.7 / 33.7<br />
33 27 59/60 53º 42´ 3º 47.0´ 41 6.9 / 7.1 32.7 / 33.6<br />
33 26 61/62 53º 37´ 3º 47.0´ 40 7.2 / 7.3 33.5 / 33.8<br />
34 31 63/64 53º 37´ 3º 55.4´ 44 7.3 / 7.4 33.8 / 33.9<br />
7
35 32 65/66 53º 32´ 3º 55.4´ 46 7.5 / 7.6 33.9 / 33.9<br />
36 33 67/68 53º 27´ 3º 55.4´ 38 7.3 / 7.5 33.6 / 33.8<br />
6. Surface sampling<br />
The intake for the surface sampling system is located underneath RV Prince Madog, at about<br />
3 m below sea level. The parameters recorded every minute by the WS Oceans system are:<br />
Date, Solar Radiation (W m -2 ), PAR (µmols / m 2 s), Air Temperature (ºC), Relative Humidity,<br />
Relative Wind Speed (m s -1 ), Relative Wind Direction (º) – zero indicates wind on the bow,<br />
Transmissance, Hull Temperature (ºC), Barometric Pressure (mbar), Fluorescence, Turbidity,<br />
Salinity, Minimum Air Temp (ºC), Maximum Air Temp (ºC), Wind Gust (m s -1 ), GPS Time,<br />
Latitude, Longitude, Barometric Pressure Minimum (mbar), Barometric Pressure Maximum<br />
(mbar), Conductivity sensor water temperature (ºC). <strong>Sea</strong> surface temperature, salinity and<br />
transmittance were calibrated against the CTD by BODC.<br />
Met. data were recorded every minute from 07:58 on 5 April (underway data from 08:37<br />
when the pump was switched on) until 05:07 on 7 April 2006 starting and ending at Puffin<br />
Island. There was a gap between 12:12 and 12:39 on 5 April. Copies of the data were taken<br />
off the ship as an Excel file, along with a copy of the ship’s navigation data.<br />
The ship was fitted with a 300 kHz ADCP set to record 25 x 2m bins, the bin nearest the<br />
surface was at 5.1 m depth, every 30 seconds with 29 pings / ensemble. Data were recorded<br />
from 07:57 on 5 April until 05:07 on 7 April 2006 starting and ending at Puffin Island.<br />
Acknowledgements<br />
The assistance of the master, officers, and crew contributed greatly to the success and safety<br />
of the cruise.<br />
8