Refresh of Joint Strategic Needs Assessment PDF 2 MB - Meetings ...
Refresh of Joint Strategic Needs Assessment PDF 2 MB - Meetings ...
Refresh of Joint Strategic Needs Assessment PDF 2 MB - Meetings ...

Create successful ePaper yourself
Turn your PDF publications into a flip-book with our unique Google optimized e-Paper software.
Health and Wellbeing<br />
in Halton<br />
A <strong>Joint</strong> <strong>Strategic</strong> <strong>Needs</strong> <strong>Assessment</strong><br />
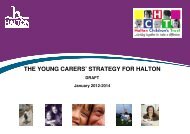
Executive Summary 2010/2011<br />
www.halton.gov.uk/jsna
Health and Wellbeing in Halton<br />
A <strong>Joint</strong> <strong>Strategic</strong> <strong>Needs</strong> <strong>Assessment</strong><br />
Executive Summary 2010/2011<br />
1. Introduction<br />
This is a summary <strong>of</strong> ‘Health and Wellbeing in Halton’, Halton’s <strong>Joint</strong><br />
<strong>Strategic</strong> <strong>Needs</strong> <strong>Assessment</strong>. The full report can be accessed via the<br />
Halton Borough Council website at<br />
http://www3.halton.gov.uk/healthandsocialcare/healthandmedicaladvice/<br />
healthjointstrategicneedsassessment/<br />
A <strong>Joint</strong> <strong>Strategic</strong> <strong>Needs</strong> <strong>Assessment</strong> (JSNA) is a means by which Primary<br />
Care Trusts and Local Authorities describe the future <strong>of</strong> health and wellbeing<br />
needs <strong>of</strong> local populations and the strategic direction <strong>of</strong> service delivery to<br />
meet these needs.<br />
Put simply, this is a blueprint for the way Halton Borough Council and the<br />
local NHS develop and understand the health, well being and social care<br />
needs <strong>of</strong> people who live in Halton. It does this by:<br />
• Bringing together all the relevant information around health, well being<br />
and social care needs;<br />
• Using local knowledge and evidence <strong>of</strong> effectiveness <strong>of</strong> current<br />
services, it helps identify gaps in service provision, and makes<br />
recommendations for consideration by commissioners<br />
• Setting out key priorities for action plans to help us meet those needs<br />
in the<br />
• future;<br />
• Providing the basis for all the key strategies and plans produced by the<br />
Council and the local NHS to help them get the right services from the<br />
right providers.<br />
This then allows us and other relevant service providers to:<br />
• Be better informed and prepared to meet the needs <strong>of</strong> a changing<br />
population now and in the future;<br />
• Work more effectively together to reduce the health inequalities;<br />
• Provide value for money.<br />
A JSNA should not be seen as a product but as a process to inform local<br />
planning and commissioning including the Sustainable Community Strategy,<br />
and Children and Young People’s Plan.<br />
1
2. The Halton Approach<br />
Halton produced the first JSNA – Health and Wellbeing in Halton, in 2008<br />
which provided a snap shot <strong>of</strong> the Borough’s health and wellbeing at that time.<br />
Health and Wellbeing in Halton provided the evidence on which health and<br />
social care Commissioners and decision makers identified the key health and<br />
wellbeing issues now and in the future.<br />
In autumn 2009 an update was produced based on new data available that<br />
illustrated any significant changes in key messages from the original Health<br />
and Wellbeing in Halton.<br />
During 2010 a full update <strong>of</strong> the JSNA was undertaken. A JSNA Working<br />
Group with representatives from both Halton Borough Council and the Halton<br />
and St Helens NHS Trust was set up. The Working Group’s role was to<br />
provide data and analysis from their specialist area, providing the context to<br />
the ‘hard’ data. Not only was health, adult social care and children’s services<br />
represented, but also the wider determinants <strong>of</strong> health including transport,<br />
housing and employment.<br />
An overarching <strong>Strategic</strong> Board was established to provide strategic direction<br />
and guidance for the JSNA process and consisting <strong>of</strong>:<br />
• <strong>Strategic</strong> Director, Health & Community Directorate, Halton Borough<br />
Council<br />
• <strong>Strategic</strong> Director, Children & Young People Directorate, Halton<br />
Borough Council<br />
• Director <strong>of</strong> Public Health Strategy, Halton & St Helens NHS<br />
• Divisional Manager for Planning and Commissioning, Halton Borough<br />
Council<br />
How to use the JSNA<br />
The JSNA has been set out in chapters; where key issues are highlighted,<br />
information about what services are making a difference and the key priorities<br />
for the future are identified. The JSNA is intended to be an on line tool,<br />
enabling the reader to go straight to the chapters that they require. Each<br />
chapter references other relevant chapters that can provide wider context,<br />
allowing the reader to access all relevant and interlinking information to the<br />
subject area.<br />
The JSNA main report is built on a wealth <strong>of</strong> information about Halton that is<br />
gathered both locally and nationally. There are hyper links to reference<br />
materials and relevant supporting information throughout the chapters. Using<br />
these hyperlinks will take you to external websites that contain the most<br />
current data, analysis, strategies etc.<br />
This assessment has not been done in isolation. Results <strong>of</strong> local and national<br />
consultations, surveys and research with people who use services, carers,<br />
residents and service providers have been used to inform the JSNA.<br />
2
3. Halton’s demographic pr<strong>of</strong>ile – what does Halton look like?<br />
Population<br />
Since 2001, the population <strong>of</strong> Halton has increased steadily to its current<br />
estimate <strong>of</strong> 118,700 (2009). The table below shows the population<br />
breakdown by age.<br />
Population <strong>of</strong> Halton, breakdown by age, 2009<br />
Total 0-15 16-64 65+<br />
Halton 118,700 24,000 77,600 17,100<br />
The total population rose from an estimate <strong>of</strong> 118,500 in 2008; this rise was<br />
found in the Older People age-range (65+). This group went from 16,800 in<br />
2008 to 17,100 in 2009 whilst the 0-15 population saw a reduction <strong>of</strong> 100.<br />
The Halton pr<strong>of</strong>ile matches the general shape <strong>of</strong> that for England & Wales see<br />
figure 1.<br />
Figure1: Population pyramid showing population distribution for Halton<br />
and England & Wales, 2009<br />
90+ Females<br />
85-89<br />
80-84<br />
75-79<br />
70-74<br />
65-69<br />
60-64<br />
55-59<br />
50-54<br />
45-49<br />
40-44<br />
35-39<br />
30-34<br />
25-29<br />
20-24<br />
15-19<br />
10-14<br />
5-9<br />
1-4<br />
Under 1<br />
Males<br />
England &<br />
Wales<br />
Source: Office for National Statistics<br />
A few key points, showing comparisons with the England & Wales pr<strong>of</strong>ile, are<br />
highlighted below<br />
Halton has a higher proportion <strong>of</strong>:<br />
• Children and Young People, aged 1-24<br />
• Older working age, aged 45-59<br />
Halton has a lower proportion <strong>of</strong>:<br />
• Younger working age, aged 25-44<br />
• Older People, aged over 60<br />
In the long term (2008-2023), Halton's population is projected to grow by 4%<br />
from 118,500 to 122,900<br />
3
The growth in older people will increase the demands for both formal and<br />
informal support. While small decreases in the working age population mean<br />
there are fewer people to provide and pay for this additional support.<br />
Ethnicity<br />
The ethnic composition <strong>of</strong> Halton remains predominantly white, with 97.7% <strong>of</strong><br />
the population falling into this category. This is a significantly higher rate than<br />
at either regional (92.1%) or national level (88.2%). This would suggest that<br />
there is a lack <strong>of</strong> ethnic diversity in Halton which is not such an issue within<br />
wider boundaries.<br />
Religion<br />
Compared to regional and national figures, Halton has a higher percentage <strong>of</strong><br />
people <strong>of</strong> Christian faith and a lower percentage <strong>of</strong> people <strong>of</strong> Muslim faith and<br />
people with no religion<br />
Housing tenure<br />
In 2008 the proportion <strong>of</strong> Owner Occupied and Private Rented Dwelling Stock<br />
in Halton (75%) was lower than the regional (81.2%) and national averages<br />
(81.8%). At 25%, a significantly higher proportion <strong>of</strong> the population rent<br />
housing from a Registered Social Landlord (RSL) than the regional (12.9%)<br />
and national (9.5%) averages.<br />
Deprivation<br />
As a result <strong>of</strong> its industrial legacy, particularly from the chemical industries,<br />
Halton has inherited a number <strong>of</strong> physical, environmental and social problems<br />
Halton shares many <strong>of</strong> the social and economic problems more associated<br />
with its urban neighbours on Merseyside. The Index <strong>of</strong> Multiple Deprivation<br />
(IMD) for 2010 is one <strong>of</strong> the most comprehensive sources <strong>of</strong> deprivation<br />
indicators, as some 37 different indicators are used. It shows for example that<br />
overall, Halton is ranked 27th nationally (a ranking <strong>of</strong> 1 indicates that an area<br />
is the most deprived), which is third highest on Merseyside, behind Knowsley<br />
and Liverpool, and 9th highest in the North West. Other authorities, St Helens<br />
(51st), Wirral (60th) and Sefton (92nd), are all less deprived compared to<br />
Halton<br />
The Index <strong>of</strong> Multiple Deprivation for 2010 suggests that deprivation has<br />
worsened in the borough. Since ranking 30th in 2007 there has been an<br />
increase in 2010 to the 27th most deprived Authority in England.<br />
The population living in the top 10% most deprived areas nationally has been<br />
a useful comparator over time to see whether the number <strong>of</strong> people severely<br />
affected by deprivation is decreasing in Halton. This proportion has remained<br />
consistent from 2007 to 2010; with 26% <strong>of</strong> the total population <strong>of</strong> Halton<br />
residing within the top 10% most deprived LSOA’s nationally. This is<br />
compared in 2010 to the national figure <strong>of</strong> 10% and the Liverpool City Region<br />
figure <strong>of</strong> 31%.<br />
4
4. Halton’s health and wellbeing – where are we now?<br />
Health across Halton has improved over the last 10 years. Life expectancy at<br />
birth has increased, deaths from circulatory disease and most cancers have<br />
decreased, rates <strong>of</strong> smoking have decreased. Breastfeeding rates are<br />
improving and the number <strong>of</strong> women who are smoking during pregnancy has<br />
reduced recently. However, whilst these improvements are commendable for<br />
most <strong>of</strong> these factors the England rates have improved at a greater pace over<br />
the same period widening the gap between the borough and the country as a<br />
whole.<br />
Closing the gap in life expectancy remains an enormous challenge. Strong<br />
partnerships are required to tackle the lifestyle factors that underlie the<br />
mortality rates and the social determinants that in turn influence the lifestyle<br />
choices people make<br />
The reasons for the gap in life expectancy are detailed in figure 2, with<br />
circulatory disease, cancers and respiratory diseases making up 70% <strong>of</strong> the<br />
gap in females and 62% in males.<br />
Figure 2<br />
One measure <strong>of</strong> morbidity is limiting long term illness (LLTI) which reflects an<br />
individual’s perception <strong>of</strong> how healthy they are. For Halton and St Helens, the<br />
boroughs that make up our PCT, the ratio <strong>of</strong> those with a limiting long term<br />
illness is higher across all age groups than the England and North West rates.<br />
Rates overall are marginally higher for Halton than for St Helens. All age<br />
groups suffer the burden and possible employment and social consequences<br />
<strong>of</strong> having long-term conditions and disabilities. The older age groups in<br />
Halton have a greater burden <strong>of</strong> chronic conditions and disabilities than the<br />
average experienced in England and North West. As the proportion <strong>of</strong> the<br />
population that is aged over 65 is predicted to rise, it is likely the number <strong>of</strong><br />
people in older age living with limiting long-term illness will also rise. The<br />
number <strong>of</strong> people aged 65 and over with LLTI will rise by 47.36% overall with<br />
the greatest percentage rise being in the 85+ age group 2010 and 2025.<br />
5
5. Factors affecting health and wellbeing in Halton – what are our<br />
priorities?<br />
Whilst acknowledging that there are a plethora <strong>of</strong> factors affecting Halton<br />
resident’s health and wellbeing, from factors that have a significant impact on<br />
a small proportion <strong>of</strong> the local population, to factors that have a less<br />
significant impact on the wider population, the JSNA focuses on those factors<br />
that highlight the greatest health inequalities amongst the local population.<br />
Below are a number <strong>of</strong> the priority areas affecting Halton resident’s health and<br />
wellbeing, as identified by the Health Inequalities National Support Team visit<br />
to Halton in 2009 and other local indicators from both the local authority and<br />
the PCT.<br />
The lists <strong>of</strong> factors below, and the associated priorities, are not exhaustive,<br />
but highlight factors that have impact on health inequalities in Halton. Please<br />
visit the JSNA page on Halton Borough Council’s website to access the full list<br />
<strong>of</strong> chapters which includes further analysis, identification <strong>of</strong> key issues and<br />
further recommendations and priorities.<br />
A list <strong>of</strong> Chapters contained in the JSNA can be found in Appendix 1 to this<br />
executive summary.<br />
A summary <strong>of</strong> the main local and / or national commissioning plans and<br />
strategies can be found in Appendix 2<br />
Environmental Factors<br />
Community Safety<br />
Alcohol related crime in Halton has reduced by 11% compared to last year<br />
and all violent crime has reduced by 12%, although in almost half <strong>of</strong> the<br />
violent crime incidents reported, alcohol was a contributing cause, as it was in<br />
15% <strong>of</strong> the overall incidents <strong>of</strong> anti social behaviour. During 2009 46 % <strong>of</strong> total<br />
alcohol related crimes committed within Halton occurred within the wards that<br />
make up the boroughs town centres (Widnes - Appleton, Kingsway and<br />
Riverside, Runcorn - Mersey).<br />
The number <strong>of</strong> people leaving drug services having completed their treatment<br />
has been steadily improving. In 2008/09 Halton’s ‘planned exit’ performance<br />
was in line with the regional average. By the end <strong>of</strong> the first half <strong>of</strong> 2009/10,<br />
they were at 41%; this is in the second highest quarter <strong>of</strong> national<br />
performance. Halton was amongst the top performers nationally in 2008/09 for<br />
reducing <strong>of</strong>fending related to using heroin and/or crack cocaine. Halton has a<br />
high percentage, 85%, <strong>of</strong> people using heroin and/or crack cocaine seen by<br />
its drug services.<br />
Vulnerable adults are people who, for whatever reason, are at greater than<br />
normal risk <strong>of</strong> abuse. Older people, especially those who are unwell, frail,<br />
confused and unable either to stand up for themselves or keep track <strong>of</strong> their<br />
affairs are vulnerable. Other vulnerable adults include people who are open to<br />
abuse because <strong>of</strong> learning difficulties, physical disabilities or mental illness<br />
6
Halton has historically experienced high levels <strong>of</strong> reporting, which is likely to<br />
be due to the following:<br />
• Demographic changes – increasing number <strong>of</strong> frail people<br />
• Large number <strong>of</strong> people with learning disabilities<br />
• High level <strong>of</strong> health needs<br />
• High levels <strong>of</strong> deprivation and unemployment<br />
• Due to publicity, and through the provision <strong>of</strong> multi-agency training<br />
• Raised awareness <strong>of</strong> the need to recognise abuse and respond<br />
appropriately, within the population<br />
Referral numbers increased from 2004-2007, reduced from 2007-2010, but<br />
have significantly increased throughout the period April-December 2010 over<br />
the same period in the previous year. 359 abuse allegations were reported in<br />
total to Halton Borough Council in the year 2009-10. The reduction in referrals<br />
may have resulted from refinement <strong>of</strong> procedures followed in processing<br />
referrals, so whilst we continue to encourage people to refer concerns and<br />
allegations, decisions are then taken about the best course <strong>of</strong> action to deal<br />
with them. Managers and practitioners take account <strong>of</strong> service user views on<br />
the way their circumstances are managed, resulting in some referrals not<br />
being progressed through the safeguarding adults procedures. Some will<br />
result in other activity which will not be counted in the alleged abuse data e.g.<br />
care management, complaints procedure, contract monitoring or disciplinary<br />
proceedings. It is likely that recent steps taken to raise awareness, including<br />
training <strong>of</strong> staff and volunteers, and publicity, have contributed to the increase<br />
in referrals.<br />
During the period July to September 2010 there have been a total <strong>of</strong> 25 Race<br />
Hate, 6 Homophobic and no Disability incidents reported to the Police.<br />
Of the 31 incidents recorded 19 have been found to meet the Hate Crime<br />
criteria<br />
In the Halton Places Survey carried out in October 2008, 21% <strong>of</strong> respondents<br />
stated that they agreed that ‘The police and other local public services are<br />
successfully dealing with anti social behaviour and crime in their local area.’<br />
This compares to a UK average <strong>of</strong> 26%.<br />
Community Safety Priorities<br />
• Focus on borough wide enforcement activity, both proactive and<br />
reactive which is intelligence led and demand driven<br />
• Promote awareness <strong>of</strong> vulnerable adults and their right to be safe in<br />
local communities.<br />
• Ensure there is a strong multi-agency response to the safety, wellbeing<br />
and dignity <strong>of</strong> vulnerable adults.<br />
• Equip staff and partner agencies with the necessary tools to both<br />
safeguard vulnerable adults and ensure their dignity is respected.<br />
7
Housing<br />
The neighbourhood that someone lives in, the type <strong>of</strong> property that they<br />
occupy and the condition <strong>of</strong> that home, all have a huge impact on their health<br />
and well being. Research has clearly demonstrated that poor housing is a key<br />
determinant <strong>of</strong> health outcomes, being intrinsically linked to poor health, a<br />
reduced life expectancy, and a reduced overall quality <strong>of</strong> life / sense <strong>of</strong><br />
wellbeing.<br />
There is great variation in housing tenure in Halton. Owner occupancy varies<br />
from 99% <strong>of</strong> households in Birchfield to 6% <strong>of</strong> households in Windmill Hill,<br />
which has the greatest percentage <strong>of</strong> social rented dwellings. Birchfield on<br />
the other hand, contains no social rented dwellings. A significant proportion <strong>of</strong><br />
social rented housing is located in the New Town estates in Runcorn.<br />
The greatest proportion <strong>of</strong> privately rented accommodation is in Appleton,<br />
where 9% <strong>of</strong> households are privately rented compared with only 1% in<br />
Birchfield and Windmill Hill. Overall in Halton, 66% <strong>of</strong> households are owner<br />
occupied, 28% are socially rented and 4% privately rented, with the remainder<br />
being shared ownership dwellings, tied to employment tenancies or<br />
households living rent free.<br />
When housing tenure is compared to health deprivation, it becomes clear that<br />
there is a strong correlation. The eight most deprived wards in terms <strong>of</strong> health<br />
have the lowest proportion <strong>of</strong> owner occupation in Halton, whereas the eight<br />
wards with the lowest health deprivation have the highest levels <strong>of</strong> owner<br />
occupancy.<br />
At the time <strong>of</strong> writing the Housing Chapter for the JSNA the Council had<br />
commissioned a <strong>Strategic</strong> Housing Market <strong>Assessment</strong> to update and refresh<br />
this data along with its Mid-Mersey Growth Point partners, St. Helen’s and<br />
Warrington. A first draft <strong>of</strong> the report on the findings relating to Halton reveals<br />
the following headline results –<br />
• Halton’s ageing population will lead to increased demand for specialist<br />
housing and falling household sizes will mean smaller dwellings are<br />
more suitable for some households.<br />
• There has been an increase in the housing stock over the last decade<br />
and increases are likely to be required in the future. There is an<br />
imbalance in the housing <strong>of</strong>fer with the proportions <strong>of</strong> terraced housing<br />
and social rented stock being particularly high<br />
• Affordability is a key issue for Halton with the average property price<br />
being five times the average income. This, coupled with increased<br />
demand for social housing along with falling stock levels, leads to a<br />
total net annual need for 891 affordable dwellings per annum (this<br />
figure is significantly higher than the 176 found by the Housing <strong>Needs</strong><br />
<strong>Assessment</strong> <strong>of</strong> 2006).<br />
• There are high levels <strong>of</strong> housing unsuitability for those with some form<br />
<strong>of</strong> disability or support need and a range <strong>of</strong> adaptations and support<br />
are required to resolve these issues.<br />
• There are a high proportion <strong>of</strong> households containing pensioners in the<br />
borough and this is likely to increase further in the future, leading to an<br />
8
increased need for specialist accommodation and the expansion <strong>of</strong><br />
support services that are already in place. Older person households<br />
are also <strong>of</strong>ten under-occupied.<br />
• A significant proportion <strong>of</strong> housing need / demand in Halton arises from<br />
families with dependent children and lone parent groups are<br />
particularly disadvantaged and concentrated in social and private<br />
rented housing.<br />
Housing priorities<br />
• Improve conditions in the private rented sector<br />
• Improve the provision <strong>of</strong> supported housing for an ageing population<br />
• The prioritisation <strong>of</strong> the development <strong>of</strong> housing to meet the needs <strong>of</strong><br />
those with disabilities<br />
• Continue to provide specialist advice and support to Homeowners by<br />
retaining Mortgage Rescue Adviser post. If the post is removed then<br />
Halton will be unable to administer the Mortgage Rescue Scheme<br />
which has recently received financial backing for a period <strong>of</strong> 4 years.<br />
• Increase the supply <strong>of</strong> affordable housing in the Borough in line with<br />
the recommendations <strong>of</strong> the Housing <strong>Needs</strong> Survey<br />
• Work with housing providers to reduce the incidence and perceptions<br />
<strong>of</strong> Anti Social Behaviour<br />
Economy and Child Poverty<br />
Halton’s economy is relatively small by national standards. Halton has a very<br />
low level <strong>of</strong> economic resilience, ranked 283 out <strong>of</strong> 324 local authority areas<br />
(Experian July 2010). The impact <strong>of</strong> the significant reductions in levels <strong>of</strong><br />
public sector spending expected from 2011 onwards will have a major impact<br />
on Halton’s economy, in addition we have an ageing static population with a<br />
shrinking proportion <strong>of</strong> economically active residents.<br />
In the past the mismatch in the needs <strong>of</strong> local, new and incoming businesses<br />
and the skills <strong>of</strong> Halton’s local people has meant that opportunity and need<br />
have been out <strong>of</strong> balance, contributing to the continuing widespread<br />
deprivation in Halton. The skills and knowledge base <strong>of</strong> Halton’s workforce is<br />
low, reducing the ability <strong>of</strong> Halton’s residents to compete for existing and new<br />
jobs both within and outside the Borough. There is a significant skills deficit<br />
both with regard to basic skills, but also in relation higher skills demanded by<br />
the sectors that are likely to see the greatest degree <strong>of</strong> growth over the<br />
coming years (scientific, technology and advanced manufacturing) and also<br />
generic management skills<br />
Halton’s median resident weekly pay increased from £345.9 in 2008 to £370.6<br />
in 2009, this was the largest increase in gross weekly pay out <strong>of</strong> the 6 local<br />
authorities in the Liverpool City Region during the period<br />
Job Seekers Allowance (JSA) claim rate in Halton was 5.9% in April 2010; this<br />
is greater than the North West (4.5%) and Great Britain (4.1%) figures. The<br />
9
ward with the lowest unemployment rate was Daresbury, with a rate <strong>of</strong> 2.3%.<br />
Windmill Hill ward had the highest unemployment rate in Halton in April 2010<br />
with a rate <strong>of</strong> 10.7%.<br />
Child Poverty is defined as the number <strong>of</strong> children living in families in receipt<br />
<strong>of</strong> Child Tax Credit whose reported income is less than 60 per cent <strong>of</strong> the<br />
average income or in receipt <strong>of</strong> Income Support or (Income-Based) Job<br />
Seekers Allowance, divided by the total number <strong>of</strong> children in the area.<br />
The North West <strong>of</strong> England has above average incidents <strong>of</strong> children living in<br />
poverty. With 23.5% <strong>of</strong> children under 16 and 22.8% (726,000) <strong>of</strong> all children<br />
living in low income households, <strong>of</strong> which 167,770 live in the Liverpool City<br />
Region. In Halton just under 26.4% <strong>of</strong> children live in poverty, placing Halton<br />
below the Liverpool City Region average. The most recent figures from 2008<br />
reveal that in total there are 6,550 children living in poverty in Halton. Of these<br />
5,520 children live in out <strong>of</strong> work families and 1,030 live in households<br />
classified as in-work.<br />
According to the 2007 figures, Birchfield ward has the lowest percentage <strong>of</strong><br />
children in poverty, with fewer than 3% <strong>of</strong> children being in poverty. However,<br />
over half <strong>of</strong> children (54.4%) within Windmill Hill ward are classed as being in<br />
poverty. Interestingly, the neighbouring ward <strong>of</strong> Daresbury has one <strong>of</strong> lowest<br />
percentages.<br />
Key underlying causes <strong>of</strong> child and family poverty in Halton include low family<br />
aspirations and a cycle <strong>of</strong> benefit dependency, <strong>of</strong>ten <strong>of</strong> an intergenerational<br />
nature.<br />
Economic and Child Poverty Priorities<br />
• To foster a culture <strong>of</strong> enterprise and entrepreneurship and make Halton<br />
an ideal place to start and grow a business<br />
• To promote and increase the employability <strong>of</strong> local people and remove<br />
barriers to employment to get more people into work<br />
• To develop a culture where learning is valued and raise skill levels<br />
throughout the adult population and across the local workforce<br />
• Cultural challenge and raising aspirations<br />
• Early intervention<br />
• A whole family approach<br />
• Providing a single point <strong>of</strong> access to support services<br />
Lifestyle Factors<br />
Substance misuse<br />
Problematic drug users are defined as heroin and/or crack cocaine users. In<br />
Halton it has been estimated that there are between 569 and 919 Problematic<br />
Drug Users (PDUs). The prevalence <strong>of</strong> PDUs in Halton is 9.2 per 1000 (aged<br />
between 15 & 64 years old). This is just below the prevalence in England <strong>of</strong><br />
10
9.76. Locally prevalence estimates range from 7.5 in Cheshire, 8.4 in<br />
Warrington and 11.7 in St Helens through to 24.1 in Liverpool<br />
Patterns <strong>of</strong> drug use are changing, and in common with national trends,<br />
Halton is seeing more people under the age <strong>of</strong> 25 presenting to services with<br />
issues around cannabis, alcohol and cocaine use, rather than heroin and<br />
crack cocaine. As yet there is insufficient information to estimate the<br />
prevalence <strong>of</strong> this drug use<br />
Substance Misuse Priorities<br />
• Continue to reduce the impact <strong>of</strong> drug related crime through close<br />
working with the police, probation & court services.<br />
• Reduce the harm that is caused to individuals through their drug use by<br />
providing easy access to screening, vaccination & health improvement<br />
programmes.<br />
• Continue to meaningfully involve service users, carers & families in the<br />
development <strong>of</strong> drug services<br />
Alcohol<br />
Alcohol has a major impact on cirrhosis, hypertension, cancer, and mental<br />
illness. In Halton the rate <strong>of</strong> hospital admissions for alcohol related harm is<br />
high and rising in line with national trends. The current rate <strong>of</strong> hospital<br />
admission for alcohol related harm is 2,464 per 100,000. Compared to our<br />
statistical neighbours cluster which includes PCTs with similar levels <strong>of</strong> socio<br />
economic status Halton and St Helens PCT admissions are average at 2,200,<br />
with Knowsley PCT performing worst at 2,500 and Stoke on Trent PCT<br />
performing best at 1,550.<br />
Halton has been identified as the eighth worst local authority area in England<br />
for alcohol related harm and the 50th worst area for binge drinking (2010<br />
LAPE). Reducing alcohol related harm is one <strong>of</strong> our key areas for investment<br />
and development in the next five years.<br />
A recent report analysing alcohol consumption with teenage conceptions i.e.<br />
conceptions to women under the age <strong>of</strong> 18, showed that, at both local<br />
authority and ward levels, there is a significant positive relationship between<br />
teenage conceptions and alcohol-related hospital admissions in young<br />
people. This relationship is independent <strong>of</strong> deprivation<br />
Alcohol Priorities:<br />
• Develop a robust social marketing and wider communication approach<br />
to engage the public in a debate about actions to reduce harmful<br />
drinking, tailored to different communities’ needs<br />
• There needs to be an assessment <strong>of</strong> continuity/standards <strong>of</strong> care<br />
across the health and care system for alcohol services. Standardised,<br />
evidence-based care pathways and screening assessment tools, need<br />
to be localised and developed.<br />
11
• Health impact assessments should be conducted as part <strong>of</strong> the<br />
planning application process for new and expanding/change <strong>of</strong> use<br />
licensed premises. This should include the wider impacts <strong>of</strong> the<br />
development on other health priorities such as promoting healthy<br />
eating, physical activity, teenage pregnancy and promoting and<br />
improving mental wellbeing as well as the impact on alcohol<br />
consumption<br />
Obesity<br />
Obesity has a major impact on cardiovascular disease, cancer and diabetes.<br />
Adult overweight and obesity rates in Halton are high. The 2006 Life Style<br />
Survey indicated the percentage <strong>of</strong> overweight residents has increased from<br />
52% in 2001 to 56.6% in 2006. Obesity within Halton has also increased with<br />
20.2% <strong>of</strong> residents measuring as obese in 2006 compared to 15.1% in 2001<br />
According to 2009 & 2010 Health Pr<strong>of</strong>iles the percentage <strong>of</strong> adults classified<br />
as obese in Halton has risen slightly between 2003-5 and 2006-8. However<br />
rates remain above the England average.<br />
Obesity Priorities<br />
• Continue with an emphasis on population level approaches to increase<br />
physical activity and improve the diet <strong>of</strong> the adult population<br />
• There should be interventions to reduce obesity in women <strong>of</strong> child<br />
bearing age in deprived areas as part <strong>of</strong> a programme to reduce infant<br />
mortality<br />
• The needs <strong>of</strong> frail older people in care homes regarding adequate<br />
nutrition should be addressed and the level <strong>of</strong> malnutrition <strong>of</strong> this and<br />
others groups determined<br />
Tobacco Control and Smoking<br />
Smoking has a major impact on cancer, chronic obstructive pulmonary disease<br />
(bronchitis and emphysema) and cardiovascular disease. Halton has<br />
improved its smoking quit rate year on year for the past 5 years. Halton and<br />
St Helens now has the 4 th highest quit rate in the North West at 1104.74 per<br />
100,000. The stop smoking rate for pregnant women has improved during<br />
2010 with 25.5% staying quit at time <strong>of</strong> delivery in the first 2 quarters <strong>of</strong><br />
2009/10 compared to 22.5% in 2008/9.<br />
Smoking priorities<br />
• There is a need to continue embedding smoking education and<br />
support to all schools e.g. through teachers and school nurse training<br />
on tobacco control.<br />
• The normalisation <strong>of</strong> smoke-free lifestyles underpins all actions to<br />
support smoking prevention and cessation. Local partners should<br />
build on the work undertaken on smoke-free public places to extend<br />
the range <strong>of</strong> smoke-free environments.<br />
12
• Partners should continue to develop strategies to tackle illegal sales <strong>of</strong><br />
cigarettes and sales to those under-18.<br />
Sexually Transmitted Disease<br />
Research highlights that sexually transmitted infections (STIs) are not<br />
distributed evenly across the population, and inequalities exist across age,<br />
area and ethnic groups. STI rates are highest amongst teenage and young<br />
adult populations, and there are specific area based inequalities evident in<br />
that rates are disproportionately higher in deprived areas.<br />
Locally, excluding syphilis, (as numbers are very small), the biggest increase<br />
in numbers has been for uncomplicated gonorrhoea where there has been<br />
920% increase from 10 cases in 1996 to 102 in 2008. This compares with a<br />
16% decrease across the North West where number have been reducing<br />
since 2006.<br />
Chlamydial infection which is the most common bacterial sexually transmitted<br />
infection has seen increases across the 2 clinics (<strong>of</strong> the Halton & St Helens<br />
NHS Trust) <strong>of</strong> 827% between 1996 and 2008, this compares with 13% across<br />
the North West.<br />
The number <strong>of</strong> herpes cases diagnosed locally has increased by 183%, this<br />
compares with 87% across the North West<br />
The number <strong>of</strong> cases <strong>of</strong> anogenital warts has also increased over the time<br />
period by 99% , this compares with 20% across the North West<br />
These rises in infections can not definitely be linked to residents <strong>of</strong> Halton and<br />
St Helens but recently published resident based data shows that Halton and<br />
St Helens has high levels <strong>of</strong> infections <strong>of</strong> diagnosed chlamydia, gonorrhoea<br />
and genital warts, therefore showing higher levels <strong>of</strong> acute STI rates than the<br />
North West as a whole.<br />
In the 15-24 year old population Halton and St Helens has the third highest<br />
levels <strong>of</strong> chlamydia diagnosis in the North West. This may be due to a very<br />
effective screening programme in this age group actively finding people with<br />
chlamydia who are asymptomatic.<br />
Sexually Transmitted Disease Priorities:<br />
• To continue STI surveillance locally so that any clusters can be<br />
identified, working closely with service providers who maybe the first to<br />
identify clusters<br />
• To continue STI surveillance to identify trends and impacts <strong>of</strong><br />
interventions<br />
• To continue to develop and strengthen the health promotion and<br />
improvement messages locally and working with services health and<br />
other services in contact with ‘at-risk’ populations to deliver key<br />
messages<br />
13
• To develop other health related venues that could opportunistically<br />
provide health care interventions for STI’s such as Pharmacies<br />
providing screening and treatment for Chlamydia<br />
Teenage Pregnancy<br />
Since the baseline was established in 1998 we have seen a fluctuating picture<br />
in the numbers <strong>of</strong> conceptions reported. There has been no sustainable<br />
reduction over time. The rate increased from 52.3 in 2008 to 58.9 in 2009,<br />
placing Halton as having the 13 th highest rate in England. However, in quarter<br />
4 2009 Halton saw a reduction in the rate <strong>of</strong> conception. Halton is seeing a<br />
reduction in the percentage <strong>of</strong> conceptions leading to termination. In England,<br />
the percentage in 2009 was 49%. In Halton the percentage was 41%. This<br />
could mean that contraception is being used more effectively and termination<br />
is not being used as a form <strong>of</strong> contraception. Although the numbers are very<br />
low for under 16 conceptions, Halton is seeing a small increase in the rate <strong>of</strong><br />
conceptions to girls aged 13-15.<br />
Teenage Pregnancy Priorities:<br />
• Continuing to extending provision and access to a full range and choice<br />
<strong>of</strong> sexual health information, advice and services available in identified<br />
locations and at times appropriate to meet the needs <strong>of</strong> the local young<br />
people.<br />
• There is a need to urgently develop holistic school, college, sixth form<br />
and work based holistic health services including sexual health, drugs<br />
and alcohol and other risk taking behaviours.<br />
• Work with partners across schools in the borough to support increased<br />
training and development opportunities to teachers responsible for<br />
delivering Sex and Relationship Education and Personal Health and<br />
Social Education.<br />
Conditions<br />
Around half a million people die in England each year, <strong>of</strong> whom almost two<br />
thirds are aged over 75. The large majority <strong>of</strong> deaths at the start <strong>of</strong> the 21 st<br />
century follow a period <strong>of</strong> chronic illness such as heart disease, cancer,<br />
stroke, chronic respiratory disease, neurological disease or dementia. Most<br />
deaths (58%) occur in NHS hospitals, with around 18% occurring at home,<br />
17% in care homes, 4% in hospices and 3% elsewhere<br />
Halton’s JSNA identifies cardio vascular disease (CVD) and cancers as the<br />
predominant influence on reducing mortality rates<br />
Cancer<br />
In Halton the incidence <strong>of</strong> cancer is rare before the age <strong>of</strong> 50. Admissions for<br />
all types rise from the 50-54 age band, peaking at 65-69 years. Cancer<br />
deaths make up 28% <strong>of</strong> total deaths among those over 50 years <strong>of</strong> age.<br />
Overall lung cancer accounts for the largest proportion <strong>of</strong> cancer deaths<br />
(23.2%) followed by colorectal at 9.6% and breast cancer at 7.8%. The rate<br />
<strong>of</strong> all cancer deaths is slightly higher in Halton across all age bands but the<br />
difference is only significant in the 85+ age group. Survival from lung cancer in<br />
Halton and St Helens is 30% after one year: one <strong>of</strong> the eight best rates in the<br />
14
North West. Survival from bowel cancer at one year is excellent at 71%.<br />
Survival from breast cancer at one year is high at 96%. The “Get Checked”<br />
campaign aims to improve cancer early diagnosis and is focussed in the<br />
poorest areas in Halton.<br />
Cancer Priorities<br />
• Continue to support the Early Detection/ Healthy Communities<br />
Collaborative for Cancer in Halton to raise awareness <strong>of</strong> the signs and<br />
symptoms <strong>of</strong> cancer and promote early presentation to health services<br />
• Ensure cancer prevention is part <strong>of</strong> all commissioners’ approach to tackling<br />
premature deaths from cancers.<br />
• Reducing other risk taking behaviours including alcohol and promoting<br />
better diet and more active lifestyles.<br />
• Improving the expertise <strong>of</strong> cancer treatment services – balancing<br />
concentration <strong>of</strong> specialist skills with improved access<br />
• Continue to support and develop care pathways for Cancer locality teams<br />
to ensure improved access to diagnosis and treatment<br />
Coronary Heart Disease (CHD), Hypertension and Stroke (collectively<br />
known as cardio vascular disease)<br />
2009 data for Halton indicates deaths from CHD had reduced. GP registers<br />
for patients at high risk <strong>of</strong> CHD, hypertension and stroke are in place to<br />
address the problem <strong>of</strong> under diagnosis.<br />
Admissions to hospital due to Coronary Heart Disease (CHD) are<br />
predominantly seen in the older age bands, admission rates are statistically<br />
significantly higher than the Halton borough rates in Grange, Halton Castle,<br />
Halton Lea, Ditton, Mersey and Norton South<br />
CHD and Hypertension Priorities<br />
• Further Data collection and analysis - One <strong>of</strong> the Health Inequalities<br />
National Support Team recommendations was a greater use by public<br />
health <strong>of</strong> prescribing and Quality Outcomes Framework data. Also,<br />
further investigation/research is needed into how accurate the<br />
prevalence estimates for heart failure are likely to be.<br />
• The predicted increases in (CHD) and hypertension need to be<br />
factored in to the setting <strong>of</strong> performance targets and monitor <strong>of</strong> health<br />
outcomes for all Locally Enhanced Services<br />
• Continued roll out <strong>of</strong> the Health Check Plus programme.<br />
Stroke Priorities<br />
• Consistent and well co-coordinated stroke prevention measures.<br />
• Access to specialist stroke rehabilitation in hospital immediately<br />
following acute episode.<br />
15
• Well co-ordinated community stroke services that <strong>of</strong>fer personalised<br />
and • Ensure continued collaboration and engagement with multidisciplinary<br />
teams to ensure that we are able to deliver against a better<br />
stroke pathway.<br />
Coronary Obstructive Pulmonary Disease (COPD)<br />
COPD includes two main diseases, bronchitis and emphysema. Asthma may<br />
also be included but only where there is some degree <strong>of</strong> chronic airway<br />
obstruction<br />
The major risk factor for developing COPD is smoking. It makes up 80% <strong>of</strong><br />
the burden <strong>of</strong> the disease. The disease now effects men and women almost<br />
equally due to the increase in the number <strong>of</strong> women who smoke. Deprivation<br />
is associated with smoking prevalence and thus areas <strong>of</strong> high deprivation are<br />
linked to higher COPD prevalence.<br />
Modelled estimates suggest that unless concerted action is taken, due to<br />
changes in population, the prevalence <strong>of</strong> COPD will increase.<br />
Figure 3 shows the estimated prevalence <strong>of</strong> COPD in Halton up to 2020.<br />
Death rates vary across the borough, with death rates for those over 40 from<br />
COPD during 2005-09 highest in Halton Castle, Mersey, Halton Lea, Ditton<br />
and Appleton wards.<br />
Figure 3: modelled estimated prevalence <strong>of</strong> COPD in those aged 16+,<br />
Halton, 2005-2020.<br />
Modelled Estimates <strong>of</strong> Prevalence <strong>of</strong> Chronic Obstructive Pulmonary Disease (COPD),<br />
ages 16 and over, Halton<br />
7.0%<br />
6.0%<br />
Males<br />
Females<br />
5.0%<br />
Percentage<br />
4.0%<br />
3.0%<br />
2.0%<br />
1.0%<br />
0.0%<br />
2005 2006 2007 2008 2009 2010 2015 2020<br />
Year<br />
Source: APHO<br />
COPD Priorities<br />
• Commissioning <strong>of</strong> appropriate community specialist services that are<br />
outcome focussed: to include education and self-care, prevention and<br />
management <strong>of</strong> exacerbations, pulmonary rehabilitation, keeping<br />
people healthy and at home<br />
• Early detection and diagnosis <strong>of</strong> COPD<br />
16
• Development <strong>of</strong> a consistent, integrated pathway through services<br />
Diabetes<br />
Diabetes has a major impact on heart disease, stroke, lower limb amputation,<br />
renal disease, impotence in men and kidney disease. The Diabetes Health<br />
<strong>Needs</strong> <strong>Assessment</strong> completed in November 2007 clearly indicates that there<br />
will be a significant increase in the number <strong>of</strong> patients with Type 2 Diabetes<br />
who will require quality systematic disease management.<br />
The estimated excess deaths among people with diabetes indicator records<br />
the number <strong>of</strong> years <strong>of</strong> life lost due to mortality from diabetes. The rate for<br />
Halton for the period 2006-08 is 3.1 years lost. Halton has a lower rate than<br />
its comparators for this period.<br />
Diabetes Priorities<br />
• There are low numbers <strong>of</strong> diabetic patients accessing patient education<br />
programmes. This should be investigated both from a service provider<br />
and client perspective before any expansion programme is planned<br />
• One <strong>of</strong> the Health Inequality Support Team’s recommendations was a<br />
greater use by public health <strong>of</strong> prescribing and quality and outcomes<br />
framework (QOF) data. Closer links need to be developed between<br />
Public Health Evidence & Intelligence Team and Medicines<br />
Management and further analysis <strong>of</strong> relevant prescribing<br />
data/information made. A Pharmacy Health <strong>Needs</strong> <strong>Assessment</strong> has<br />
recently been started which should aid this dialogue.<br />
• Retinopathy screening (eye test for people with diabetes) has improved<br />
over the last year and uptake is now at 81% (the minimum national<br />
standard is 80%). Maintaining and improving further uptake and<br />
ensuring grading quality remain priorities for the PCT.<br />
Mental Health<br />
The North West Public Health Observatory in 2009 undertook the Mental<br />
Wellbeing Survey which sampled 500 people across Halton and St Helens<br />
and asked individuals a series <strong>of</strong> questions aimed at measuring wellbeing for<br />
the borough. The survey showed 35.4% <strong>of</strong> adults living within Halton and St<br />
Helens had above average mental wellbeing which was significantly higher<br />
than the North West average (20.4%). The number <strong>of</strong> adults who measures<br />
themselves as having below average mental wellbeing (4.9%) was<br />
significantly lower than the North West average (16.8%).<br />
Changes in the population structure mean that whilst it is predicted that there<br />
will be a slight decline in the number <strong>of</strong> adults aged 18-64 with mental health<br />
disorders in Halton, the number <strong>of</strong> older people suffering with depression and<br />
severe depression is predicted to rise.<br />
Mental Health Priorities<br />
• Commission initiatives that promote earlier detection and interventions<br />
for people suffering with mental health problems.<br />
17
• Develop joint strategies with relevant partners to promote recovery,<br />
and improve the mental well-being and mental health outcomes <strong>of</strong> the<br />
people <strong>of</strong> Halton, that also addresses the broader determinants <strong>of</strong><br />
mental health.<br />
• Ensure that commissioned services are accessible to all and consider<br />
those who may be particularly at risk <strong>of</strong> experiencing health<br />
inequalities.<br />
Dementia<br />
Data for 2007/08 indicates that 1269 patients across Halton and St Helens<br />
Primary Care Trust (PCT) are registered as having dementia (0.4%). Figures<br />
from Projecting Older People Population Information (POPPI) estimate that<br />
numbers <strong>of</strong> dementia sufferers over 65 years old could increase by 155% by<br />
2025, with over 4,000 patients in Halton and St Helens. Overall for the PCT,<br />
numbers <strong>of</strong> males over 65 years old presenting with dementia is expected to<br />
increase by 105% compared to 43% in females.<br />
Dementia Priorities<br />
• Development <strong>of</strong> Dementia Peer Support<br />
• Commissioning <strong>of</strong> <strong>Assessment</strong>, Care and Treatment Service<br />
• Commissioning <strong>of</strong> Dementia Care Advisors<br />
• Training for pr<strong>of</strong>essionals in basic awareness<br />
• Advanced training for pr<strong>of</strong>essionals<br />
• Improved quality in existing services i.e. memory clinic, Community<br />
Mental Health Team etc.<br />
Vulnerable Groups<br />
Older People<br />
Older people and those with long-term conditions are the most intensive users<br />
<strong>of</strong> the most expensive services. People with long-term conditions are not just<br />
high users <strong>of</strong> primary and specific acute services but also social care and<br />
community services, and urgent and emergency care. Numbers are<br />
increasing due to factors such as an ageing population, health inequalities<br />
and certain lifestyle choices that people make. Because <strong>of</strong> their vulnerability,<br />
simple problems can make their condition deteriorate rapidly, putting them at<br />
high risk <strong>of</strong> unplanned hospital admissions or long-term institutionalisation<br />
By 2026, at a national level, older people will account for almost half (48 per<br />
cent) <strong>of</strong> the number <strong>of</strong> new households, resulting in 2.4 million more ‘older’<br />
households than there are today<br />
Older People Priorities<br />
• Ensure that there is enough affordable and quality accommodation<br />
• A wider range <strong>of</strong> community based services are developed and<br />
commissioned to meet the range <strong>of</strong> health related illnesses that affect<br />
older people e.g. Stroke, COPD, Dementia etc.<br />
• Commissioners need to address the continuing issue <strong>of</strong> falls in older<br />
people, both in relation to the prevention <strong>of</strong> falls and the quality <strong>of</strong> care<br />
if someone does have a fall.<br />
18
• Continuing to deliver high quality Intermediate Care services to support<br />
improved rehabilitation rather than reliance on Residential Care.<br />
• Investigate the full potential <strong>of</strong> technology, such as Telecare and<br />
Telehealth, to support care closer to home for older people.<br />
Vulnerable Children<br />
One way <strong>of</strong> assessing vulnerability is by the Children in Need. The definition<br />
<strong>of</strong> a child being in need is taken from Section 17(10) Children Act 1989,<br />
whereby:<br />
• He/She is unlikely to achieve or maintain, or to have the opportunity <strong>of</strong><br />
achieving or maintaining, a reasonable standard <strong>of</strong> heath or<br />
development without the provision for him/her <strong>of</strong> services by a local<br />
authority.<br />
• His/Her health and development is likely to be significantly impaired or<br />
further impaired, without the provision for him/her <strong>of</strong> such services.<br />
• He/She is disabled<br />
There were 685 Children in Need in Halton in 2009/10. The ward containing<br />
the highest number <strong>of</strong> Children in Need during the period was Kingsway (63<br />
children), the ward with the lowest number in the Children in Need category<br />
was Beechwood<br />
There were 137 Children in Care in Halton in 2009/10. The ward containing<br />
the highest number <strong>of</strong> Children in Care during the period was Halton Lea (17<br />
children), four wards in the borough had no Children in Care throughout the<br />
period; these were Beechwood, Birchfield, Daresbury and Farnworth<br />
There were 81 Children subject to Child Protection plans in Halton in 2009/10.<br />
The ward containing the highest number <strong>of</strong> these children was Halton Lea (11<br />
children), seven wards in the borough had no Children subject to Child<br />
Protection plans throughout the period; these were Beechwood, Birchfield,<br />
Farnworth, Broadheath, Ditton, Hale and Heath.<br />
Analysis <strong>of</strong> Serious Case Reviews clearly show that there is a high degree <strong>of</strong><br />
overlap between neglect and other forms <strong>of</strong> child abuse, and that a failure to<br />
respond confidently to the indicators <strong>of</strong> neglect will significantly compromise a<br />
child in fulfilling their potential. Neglect may involve a parent or carer failing to:<br />
• Provide adequate food, clothing and shelter (including exclusion from<br />
home or abandonment);<br />
• Protect a child from physical and emotional harm or danger;<br />
• Ensure adequate supervision;<br />
• Ensure access to appropriate medical care or treatment;<br />
• It may also include neglect <strong>of</strong>, or unresponsiveness to, a child’s basic<br />
emotional needs<br />
19
The majority <strong>of</strong> children subject to Child Protection Plans, are recorded as<br />
Neglect as the category <strong>of</strong> abuse as shown in the chart below.<br />
Children subject to Child Protection Plans, by category <strong>of</strong><br />
abuse, 31/03/2010<br />
Physical abuse only<br />
Neglect Only<br />
Likelihood <strong>of</strong> Sexual<br />
Likelihood <strong>of</strong> Physical<br />
Likelihood <strong>of</strong> Neglect<br />
Likelihood <strong>of</strong> Emotional<br />
Emotional abuse only<br />
0 5 10 15 20 25 30<br />
Accidental and Non Accidental injury to children hospital admissions-<br />
Attendance at A&E is not coded using the ICD-10 classifications used for<br />
hospital admissions or deaths. It is not possible to select only those that have<br />
resulted for an accidental injury rather than a deliberate one. However, the<br />
vast majority will be due to an accident in the home or outside it. In 2009-10<br />
there were 1008 attendances at A&E in those under the age <strong>of</strong> 16. It has not<br />
been possible to determine how many are multiple attendances by one<br />
individual but it is nevertheless useful in helping to estimate the relative<br />
importance accidental injury plays. Thirty seven percent (37%) <strong>of</strong> all<br />
attendances at A&E amongst those under the age <strong>of</strong> 16 were due to injuries.<br />
Vulnerable Children Priorities<br />
• Improve parenting support and support for children in need <strong>of</strong><br />
safeguarding,<br />
• Ensure robust safeguarding processes are in place<br />
• Improve outcomes for children in need <strong>of</strong> safeguarding.<br />
Adults with a learning disability and adults with a physical/sensory<br />
disability<br />
Adults with learning disabilities are one <strong>of</strong> the most vulnerable groups in<br />
society, experiencing health inequalities, social exclusion and stigmatisation.<br />
In general, adults with learning disabilities have greater and more complex<br />
health needs than the general population, and <strong>of</strong>ten these needs are not<br />
identified or treated.<br />
Life expectancy <strong>of</strong> this group is shorter than the general population, though<br />
this has increased recently. In addition a number <strong>of</strong> national reports have<br />
highlighted that adults with learning disabilities <strong>of</strong>ten experience barriers to<br />
accessing healthcare services, and poor levels <strong>of</strong> care. Indeed, adults with<br />
learning disabilities are more likely to die from a preventable cause than the<br />
general population<br />
20
The percentage <strong>of</strong> adults with learning disabilities in employment within<br />
Halton is 3.7%. This is lower than the regional average (5.2%) and<br />
considerably lower than the average national rate (6.8%)<br />
Physical impairments may be congenital or acquired at any age, be<br />
temporary, long-term, or fluctuating. People with physical impairments may<br />
<strong>of</strong>ten have unique & multi-dimensional requirements. Sensory impairments<br />
may, like physical impairments, be congenital or acquired at any age. They<br />
are more prevalent with age as are additional sensory or other impairments.<br />
Most sensory impairments develop gradually and are <strong>of</strong>ten secondary to other<br />
disabilities.<br />
There are 5,968 people between the ages <strong>of</strong> 18 and 64 in Halton that have a<br />
physical disability. The majority <strong>of</strong> these (67%) are aged between 45 and 64<br />
with 26% aged between 25 and 44 and 7% between 16 and 24. 3,117 people<br />
between the ages <strong>of</strong> 18 and 64 have a sensory disability. The majority <strong>of</strong><br />
these (89%) are aged between 45 and 64 with 10% aged between 25 and 44<br />
and only 1% between 16 and 24.<br />
Priorities for adults with learning, physical or sensory disability<br />
• To support progress in delivering the National Service Framework for<br />
Long Term (Neurological) Conditions in Halton consultation has<br />
identified the need for better access to integrated Neurological<br />
Rehabilitation and Enablement services and better co-ordination <strong>of</strong><br />
support for the voluntary sector.<br />
• To support adults and young people in transition to adult services with<br />
learning disabilities<br />
21
6. Conclusion<br />
Early detection is likely to reduce costs and improve outcomes in the major<br />
disease areas. Action on these areas should continue as they are likely to<br />
make the most difference in the short and longer term.<br />
Some changes in prevalence suggest new priority areas:<br />
• Injury prevention- due to increased hospital admissions and deaths.<br />
This could be linked with the alcohol agenda<br />
• Mental health more broadly than early detection <strong>of</strong> depression is a<br />
priority area due to the rise in suicides and undetermined injury. The<br />
economic recession and changes in benefits may also increase<br />
demands on services.<br />
• Sexual health due to high prevalence rates<br />
• Child health- particularly infant mortality linked with maternity services<br />
and child and adolescent mental health services. Childhood obesity<br />
has levelled but should remain a priority due to the potential high<br />
impact.<br />
There are some longer term trends in our population and needs which will<br />
impact on priorities:<br />
• The numbers <strong>of</strong> frail older people will increase with increased need for<br />
services including dementia, obesity, falls prevention, chronic disease<br />
management hearing, vision and continence services.<br />
• The numbers <strong>of</strong> people with a severe learning disability will also<br />
increase.<br />
How will the JSNA be used?<br />
The JSNA will be used to inform commissioning decisions and with the<br />
forthcoming changes planned under the Health and Social Care Bill , the<br />
JSNA will become a main evidence driver for the Health and Wellbeing Board<br />
that will operate within Halton. A responsibility <strong>of</strong> the new Health and Well<br />
Being Board will be to develop a high level strategy (joint Health and<br />
Wellbeing strategy) to address health inequalities, using the findings <strong>of</strong> the<br />
JSNA to direct strategy.<br />
22
7. Want to have your say or get involved?<br />
If you would like to comment on how health inequalities in Halton can be<br />
reduced or require this document in a different format please use the contact<br />
details below:<br />
Policy Officer (Health)<br />
People & Communities Policy Team<br />
2nd Floor Runcorn Town Hall<br />
Heath Road<br />
Runcorn<br />
WA7 5TD<br />
01928 704521<br />
Emma.bragger@halton.gov.uk<br />
If you want to comment on health, well being or social care services in Halton,<br />
or get involved with people who can represent your views contact:<br />
Halton Local Involvement Network (the LINK):<br />
www.haltonlink.org.uk.<br />
Halton LINk, Sefton House, Public Hall Street, Runcorn WA7 1NG<br />
01928 592405<br />
23
Appendix 1: Health and Wellbeing in Halton Contents<br />
Chapters covered by this JSNA<br />
Adult Immunisations<br />
Adult Obesity<br />
Alcohol (Adults)<br />
Cancer<br />
Child Accidental Injury<br />
Child Immunisations<br />
Child Obesity<br />
Child Poverty<br />
Children and Young People Mental Health and Emotional Wellbeing<br />
Community Safety<br />
Coronary Obstructive Pulmonary Disease<br />
Coronary Heart Disease<br />
Dementia<br />
Demographics<br />
Dental<br />
Diabetes<br />
Economy<br />
Housing<br />
Hypertension (high blood pressure)<br />
Mental health<br />
Older People<br />
Older People Falls<br />
Overall health and Wellbeing<br />
Physical, Sensory and Learning Disability<br />
Pregnancy<br />
24
Sexually Transmitted Infection<br />
Smoking<br />
Substance Misuse (Adults)<br />
Substance Misuse (Children & Young People)<br />
Teenage Pregnancy<br />
Transport<br />
Vulnerable Children<br />
25
Appendix 2: Summary <strong>of</strong> Commissioning Plans/Strategies<br />
Chapter<br />
Adult<br />
Immunisations<br />
Adult Obesity<br />
Alcohol<br />
(Adults)<br />
Cancer<br />
Commissioning Plans/Strategies (Local and/or national)<br />
Department <strong>of</strong> Health (2008) Healthy Weight, Healthy Lives - A<br />
Cross Government Strategy for England<br />
Signs for improvement: Commissioning interventions to reduce<br />
alcohol-related harm (DH 2009).<br />
Department <strong>of</strong> Health (2007) Cancer Reform Strategy<br />
Child<br />
Accidental<br />
Injury<br />
Child<br />
Immunisations<br />
Child Obesity<br />
Child Poverty<br />
Children's Trust Commissioning Framework<br />
Reducing differences in the uptake <strong>of</strong> immunisations<br />
Department <strong>of</strong> Health (2008) Healthy Weight, Healthy Lives - A<br />
Cross Government Strategy for England.<br />
Children's Trust Commissioning Framework<br />
Children and Children's Trust Commissioning Framework<br />
Young People<br />
Mental Health<br />
and Emotional<br />
Wellbeing<br />
Community Halton Anti Social Behaviour Plan<br />
Safety<br />
Coronary National Strategy for COPD<br />
Obstructive<br />
Pulmonary<br />
Disease<br />
Coronary<br />
Heart Disease<br />
Department <strong>of</strong> Health (2000) National Service Framework for<br />
Coronary Heart Disease<br />
Dementia St Helens and Halton <strong>Joint</strong> Commissioning Strategy for Dementia,<br />
available from Sue Wallace-Bonner, Operational Director Older<br />
People Halton Borough Council, Runcorn Town Hall 0151 471 7533<br />
Demographics n/a<br />
Dental<br />
Diabetes National Service Framework for Diabetes (2001)<br />
Diabetes Commissioning Toolkit (2006)<br />
Economy Liverpool City Region Employment Strategy<br />
http://www.liverpoolcitystrategyces.org.uk/about/<br />
Housing Commissioning Strategy for Extra Care, May 2008<br />
http://www2.halton.gov.uk/pdfs/socialcareandhealth/stratextracare08<br />
Hypertension<br />
Halton Housing Strategy 2008 to 2011 http://hbccms.haltonborough.gov.uk/content/housing/housingstrategy/?a=5441<br />
Prevention <strong>of</strong> cardiovascular disease<br />
26
Mental health<br />
Older People<br />
Cross Government Mental Health Outcomes Strategy<br />
No Health Without Mental Health<br />
Older People's <strong>Joint</strong> Commissioning Strategy 2009-2012, available<br />
from Sue Wallace-Bonner, Operational Director- Older People,<br />
Runcorn Town Hall 0151 471 7533<br />
Older People<br />
Falls<br />
Overall health n/a<br />
and Wellbeing<br />
Physical, http://www.valuingpeoplenow.dh.gov.uk<br />
Sensory and<br />
Learning<br />
Disability<br />
Pregnancy Maternity Matters (DH 2007)<br />
Sexually<br />
Transmitted<br />
Infection<br />
Better Prevention, Better Services, Better Sexual Health: The<br />
National Strategy for Sexual Health and HIV. DoH, July 2001-<br />
<strong>Refresh</strong>ed 2008 by the Independent Advisory Group for Sexual<br />
Health<br />
(http://www.dh.gov.uk/assetRoot/04/07/44/86/04074486.pdf)<br />
Smoking<br />
Substance<br />
Misuse<br />
(Adults)<br />
Substance<br />
Misuse<br />
(Children<br />
Young<br />
People)<br />
Teenage<br />
Pregnancy<br />
Transport<br />
Vulnerable<br />
Children<br />
&<br />
A Smokefree Future: A comprehensive tobacco control strategy for<br />
England (Department <strong>of</strong> Health, 2010)<br />
2010 National Drug Strategy<br />
http://www.home<strong>of</strong>fice.gov.uk/publications/drugs/drug-strategy/drugstrategy-2010?view=Binary<br />
Children's Trust Commissioning Framework<br />
Children's Trust Commissioning Framework<br />
Local Transport Plan<br />
http://www3.halton.gov.uk/transportandstreets/transportpolicy/<br />
Children's Trust Commissioning Framework<br />
27