Business Case for the SunShine CoaSt airport Master Plan
Business Case for the SunShine CoaSt airport Master Plan
Business Case for the SunShine CoaSt airport Master Plan

You also want an ePaper? Increase the reach of your titles
YUMPU automatically turns print PDFs into web optimized ePapers that Google loves.
<strong>Business</strong> <strong>Case</strong> <strong>for</strong> <strong>the</strong> Sunshine Coast Airport n <strong>Master</strong> <strong>Plan</strong> (November 2009)<br />
This results in a reduced payload,<br />
particularly when considering trans-<br />
Tasman flights.<br />
The proposed new east-west runway<br />
13/31 will provide a take-off distance<br />
of 2,450 metres in each direction<br />
with a runway width of 45 metres,<br />
opening up <strong>the</strong> <strong>airport</strong> to a range<br />
of wide-bodied aircraft servicing<br />
international operations. The <strong>airport</strong><br />
is currently constrained in <strong>the</strong> amount<br />
and type of industries that can be<br />
attracted to this port from an aviation<br />
perspective as <strong>the</strong> larger aircraft<br />
cannot be accommodated on <strong>the</strong><br />
current runway. The new east-west<br />
runway is expected to provide greater<br />
opportunity.<br />
03.4 Projected<br />
passenger demand<br />
A thorough study of <strong>the</strong> SCA and<br />
its anticipated traffic growth was<br />
commissioned and undertaken by<br />
TFI and published in August 2009.<br />
The study examined several different<br />
scenarios <strong>for</strong> traffic growth. These are<br />
summarised below.<br />
■■<br />
Current runway scenarios based<br />
on continued use of <strong>the</strong> existing<br />
runway with its limitations:<br />
––<br />
central version based on<br />
economic assumptions as<br />
outlined in this report; and<br />
––<br />
high and low versions based<br />
largely on variations in<br />
economic assumptions and<br />
implications.<br />
■■<br />
A new east-west runway 13/31<br />
runway scenarios that allow <strong>for</strong>:<br />
––<br />
recovery of a proportion of<br />
flights lost due to wea<strong>the</strong>r/wind<br />
conditions and <strong>the</strong> narrow<br />
runway. This amounts to 2.5<br />
per cent of passengers per<br />
year;<br />
––<br />
increased route options and<br />
no restrictions on trans-<br />
Tasman activity; and<br />
––<br />
Additional passengers<br />
resulting from this scenario<br />
are added to <strong>the</strong> baseline<br />
<strong>for</strong>ecasts.<br />
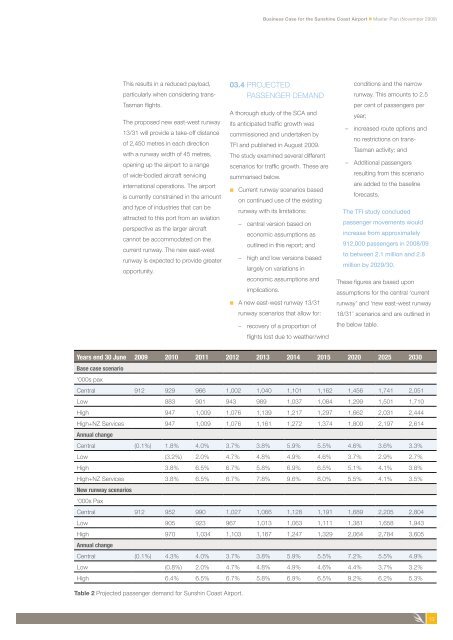
The TFI study concluded<br />
passenger movements would<br />
increase from approximately<br />
912,000 passengers in 2008/09<br />
to between 2.1 million and 2.8<br />
million by 2029/30.<br />
These figures are based upon<br />
assumptions <strong>for</strong> <strong>the</strong> central ‘current<br />
runway’ and ‘new east-west runway<br />
18/31’ scenarios and are outlined in<br />
<strong>the</strong> below table.<br />
Years end 30 June 2009 2010 2011 2012 2013 2014 2015 2020 2025 2030<br />
Base case scenario<br />
‘000s pax<br />
Central 912 929 966 1,002 1,040 1,101 1,162 1,456 1,741 2,051<br />
Low 883 901 943 989 1,037 1,084 1,299 1,501 1,710<br />
High 947 1,009 1,076 1,139 1,217 1,297 1,662 2,031 2,444<br />
High+NZ Services 947 1,009 1,076 1,161 1,272 1,374 1,800 2,197 2,614<br />
Annual change<br />
Central (0.1%) 1.8% 4.0% 3.7% 3.8% 5.9% 5.5% 4.6% 3.6% 3.3%<br />
Low (3.2%) 2.0% 4.7% 4.8% 4.9% 4.6% 3.7% 2.9% 2.7%<br />
High 3.8% 6.5% 6.7% 5.8% 6.9% 6.5% 5.1% 4.1% 3.8%<br />
High+NZ Services 3.8% 6.5% 6.7% 7.8% 9.6% 8.0% 5.5% 4.1% 3.5%<br />
New runway scenarios<br />
‘000s Pax<br />
Central 912 952 990 1,027 1,066 1,128 1,191 1,689 2,205 2,804<br />
Low 905 923 967 1,013 1,063 1,111 1,381 1,658 1,943<br />
High 970 1,034 1,103 1,167 1,247 1,329 2,064 2,784 3,605<br />
Annual change<br />
Central (0.1%) 4.3% 4.0% 3.7% 3.8% 5.9% 5.5% 7.2% 5.5% 4.9%<br />
Low (0.8%) 2.0% 4.7% 4.8% 4.9% 4.6% 4.4% 3.7% 3.2%<br />
High 6.4% 6.5% 6.7% 5.8% 6.9% 6.5% 9.2% 6.2% 5.3%<br />
Table 2 Projected passenger demand <strong>for</strong> Sunshin Coast Airport.<br />
13