The Inflation Cycle of 2002 to 2015 - Uhlmann Price Securities
The Inflation Cycle of 2002 to 2015 - Uhlmann Price Securities
The Inflation Cycle of 2002 to 2015 - Uhlmann Price Securities

Create successful ePaper yourself
Turn your PDF publications into a flip-book with our unique Google optimized e-Paper software.
Industrial Portfolio Strategy<br />
<strong>The</strong> <strong>Inflation</strong> <strong>Cycle</strong> <strong>of</strong> <strong>2002</strong> <strong>to</strong> <strong>2015</strong> ⎯ April 19, <strong>2002</strong> -32- Legg Mason Wood Walker, Inc.<br />
ects that China will have 349 million people aged 35 <strong>to</strong> 49. In addition <strong>to</strong> economic growth implications, we<br />
believe that China is a developing country with a greater propensity <strong>to</strong> consume raw materials and foreign<br />
capital. This situation may aggravate the U.S. current account deficit in the coming years by reducing the<br />
succor provided by the capital account surplus, and weakening the U.S. dollar, in our view.<br />
<strong>The</strong> Commodity <strong>Price</strong> Sensitivity <strong>of</strong> the U.S. Economy<br />
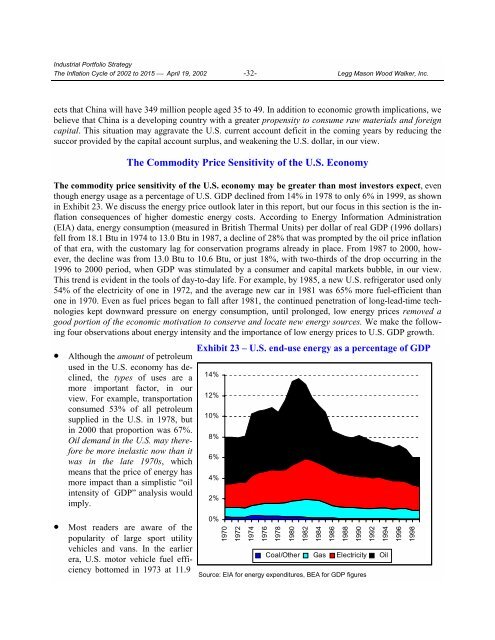
<strong>The</strong> commodity price sensitivity <strong>of</strong> the U.S. economy may be greater than most inves<strong>to</strong>rs expect, even<br />
though energy usage as a percentage <strong>of</strong> U.S. GDP declined from 14% in 1978 <strong>to</strong> only 6% in 1999, as shown<br />
in Exhibit 23. We discuss the energy price outlook later in this report, but our focus in this section is the inflation<br />
consequences <strong>of</strong> higher domestic energy costs. According <strong>to</strong> Energy Information Administration<br />
(EIA) data, energy consumption (measured in British <strong>The</strong>rmal Units) per dollar <strong>of</strong> real GDP (1996 dollars)<br />
fell from 18.1 Btu in 1974 <strong>to</strong> 13.0 Btu in 1987, a decline <strong>of</strong> 28% that was prompted by the oil price inflation<br />
<strong>of</strong> that era, with the cus<strong>to</strong>mary lag for conservation programs already in place. From 1987 <strong>to</strong> 2000, however,<br />
the decline was from 13.0 Btu <strong>to</strong> 10.6 Btu, or just 18%, with two-thirds <strong>of</strong> the drop occurring in the<br />
1996 <strong>to</strong> 2000 period, when GDP was stimulated by a consumer and capital markets bubble, in our view.<br />
This trend is evident in the <strong>to</strong>ols <strong>of</strong> day-<strong>to</strong>-day life. For example, by 1985, a new U.S. refrigera<strong>to</strong>r used only<br />
54% <strong>of</strong> the electricity <strong>of</strong> one in 1972, and the average new car in 1981 was 65% more fuel-efficient than<br />
one in 1970. Even as fuel prices began <strong>to</strong> fall after 1981, the continued penetration <strong>of</strong> long-lead-time technologies<br />
kept downward pressure on energy consumption, until prolonged, low energy prices removed a<br />
good portion <strong>of</strong> the economic motivation <strong>to</strong> conserve and locate new energy sources. We make the following<br />
four observations about energy intensity and the importance <strong>of</strong> low energy prices <strong>to</strong> U.S. GDP growth.<br />
• Although the amount <strong>of</strong> petroleum<br />
used in the U.S. economy has declined,<br />
the types <strong>of</strong> uses are a<br />
more important fac<strong>to</strong>r, in our<br />
view. For example, transportation<br />
consumed 53% <strong>of</strong> all petroleum<br />
supplied in the U.S. in 1978, but<br />
in 2000 that proportion was 67%.<br />
Oil demand in the U.S. may therefore<br />
be more inelastic now than it<br />
was in the late 1970s, which<br />
means that the price <strong>of</strong> energy has<br />
more impact than a simplistic “oil<br />
intensity <strong>of</strong> GDP” analysis would<br />
imply.<br />
Exhibit 23 – U.S. end-use energy as a percentage <strong>of</strong> GDP<br />
14%<br />
12%<br />
10%<br />
8%<br />
6%<br />
4%<br />
2%<br />
• Most readers are aware <strong>of</strong> the<br />
popularity <strong>of</strong> large sport utility<br />
vehicles and vans. In the earlier<br />
era, U.S. mo<strong>to</strong>r vehicle fuel efficiency<br />
bot<strong>to</strong>med in 1973 at 11.9 Source: EIA for energy expenditures, BEA for GDP figures<br />
0%<br />
1970<br />
1972<br />
1974<br />
1976<br />
1978<br />
1980<br />
1982<br />
1984<br />
1986<br />
1988<br />
1990<br />
1992<br />
1994<br />
1996<br />
Coal/Other Gas Electricity Oil<br />
1998