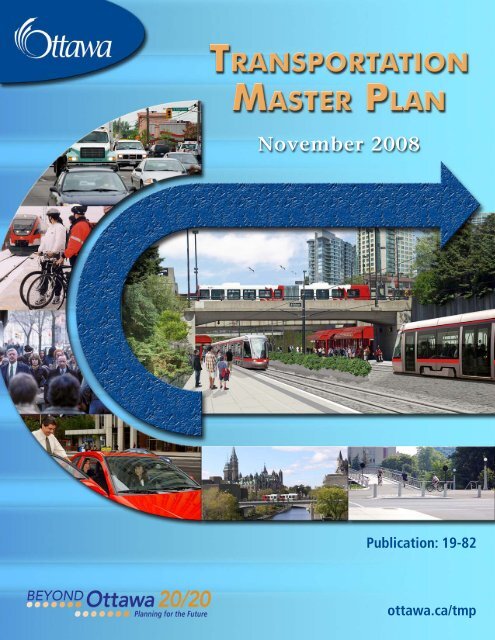
Transportation Master Plan - Ottawa Confederation Line
Transportation Master Plan - Ottawa Confederation Line
Transportation Master Plan - Ottawa Confederation Line

You also want an ePaper? Increase the reach of your titles
YUMPU automatically turns print PDFs into web optimized ePapers that Google loves.
Table of Contents<br />
EXECUTIVE SUMMARY..........................................................................................................................iii<br />
Chapter 1 – Introduction .............................................................................................................................. 1<br />
1.1 <strong>Ottawa</strong>’s Growth Management Strategy............................................................................................... 1<br />
1.2 Interpreting and Updating this <strong>Plan</strong> ...................................................................................................... 2<br />
Chapter 2 – Current and Future Conditions .............................................................................................. 4<br />
2.1 An Overview of <strong>Ottawa</strong>’s <strong>Transportation</strong> System................................................................................ 4<br />
2.2 Population and Employment Distribution ............................................................................................ 5<br />
2.3 Current Travel Patterns and Trends ...................................................................................................... 6<br />
2.4 Future Travel Patterns.......................................................................................................................... 13<br />
Chapter 3 – Strategic Directions................................................................................................................ 21<br />
3.1 <strong>Ottawa</strong>’s <strong>Transportation</strong> Vision.......................................................................................................... 21<br />
3.2 Creating Supportive Land Use............................................................................................................ 27<br />
3.3 Managing <strong>Transportation</strong> Demand ..................................................................................................... 29<br />
3.4 Managing the <strong>Transportation</strong> System ................................................................................................. 31<br />
3.5 Enhancing Safety and Security ........................................................................................................... 32<br />
3.6 Minimizing Environmental Effects..................................................................................................... 32<br />
3.7 Managing and Maintaining Assets...................................................................................................... 34<br />
3.8 Funding Implementation..................................................................................................................... 35<br />
3.9 Measuring Performance...................................................................................................................... 37<br />
Chapter 4 – Active <strong>Transportation</strong>: Walking and Cycling ..................................................................... 38<br />
4.1 Supporting Measures .......................................................................................................................... 38<br />
4.2 Walking Facilities............................................................................................................................... 40<br />
4.3 Cycling Facilities ................................................................................................................................ 41<br />
4.4 Multi-use Pathways............................................................................................................................. 42<br />
Chapter 5 – Public Transit ......................................................................................................................... 44<br />
5.1 Supporting Measures .......................................................................................................................... 45<br />
5.2 Ease of Mobility .................................................................................................................................. 46<br />
5.3 Economic Efficiency............................................................................................................................ 53<br />
5.4 Accessibility for Customers with Disabilities...................................................................................... 54<br />
5.5 Environmental Efficiency ................................................................................................................... 54<br />
Chapter 6 – Roads and Motor Vehicle Use ............................................................................................... 56<br />
6.1 City of <strong>Ottawa</strong> Roads.......................................................................................................................... 56<br />
6.2 Federal and Provincial Roads ............................................................................................................. 57<br />
6.3 Road Right-of-way Protection ............................................................................................................ 58<br />
6.4 Road Design........................................................................................................................................ 59<br />
6.5 Road Safety......................................................................................................................................... 61<br />
6.6 Road Corridor Optimization ............................................................................................................... 62<br />
6.7 Area Traffic Management................................................................................................................... 63<br />
6.8 Ridesharing ......................................................................................................................................... 64<br />
6.9 Taxis ................................................................................................................................................... 67<br />
6.10 Goods Movement.............................................................................................................................. 67<br />
6.11 Parking.............................................................................................................................................. 68<br />
Chapter 7 – Intercity Travel....................................................................................................................... 71<br />
7.1 Intercity Passenger Terminals............................................................................................................. 71<br />
7.2 General Aviation................................................................................................................................. 72<br />
TRANSPORTATION MASTER PLAN<br />
NOVEMBER 2008<br />
Page i
Chapter 8 – Implementation....................................................................................................................... 73<br />
8.1 Capital Works <strong>Plan</strong> ............................................................................................................................. 73<br />
8.2 Costs ................................................................................................................................................... 82<br />
8.3 <strong>Transportation</strong> Outlook Document ..................................................................................................... 83<br />
8.4 Environmental Assessment................................................................................................................. 84<br />
ANNEX A – <strong>Transportation</strong> Performance Objectives and Indicators................................................... 86<br />
ANNEX B – Required Infrastructure Projects......................................................................................... 90<br />
ANNEX C – Glossary................................................................................................................................ 106<br />
Maps ........................................................................................................................................................... 109<br />
MAPS 110<br />
Map 1<br />
Map 2<br />
Map 3<br />
Major Multi-Use Pathways (Urban)<br />
Primary Urban Cycling <strong>Transportation</strong> Network<br />
Rural Cycling Network and Major Multi-Use Pathways (Rural)<br />
Map 4a Rapid Transit Network - 2031<br />
Map 4b<br />
Map 4c<br />
Map 5a<br />
Map 5b<br />
Map 6<br />
Map 7<br />
Map 8<br />
Map 9<br />
Map 10a<br />
Map 10b<br />
Map 10c<br />
Rapid Transit Network - Ultimate<br />
Conceptual Interprovincial Transit Corridors<br />
Phase 1 - Transit Infrastructure Projects<br />
Phase 2 - Transit Infrastructure Projects<br />
Urban Road Network<br />
Central Area/Inner City Road Network<br />
Rural Road Network<br />
Road Network – Select Villages<br />
Phase 1 - Roads Infrastructure Projects<br />
Phase 2 - Roads Infrastructure Projects<br />
Phase 3 - Roads Infrastructure Projects<br />
TRANSPORTATION MASTER PLAN<br />
NOVEMBER 2008<br />
Page ii
EXECUTIVE SUMMARY<br />
Introduction<br />
The <strong>Transportation</strong> <strong>Master</strong> <strong>Plan</strong> identifies the transportation facilities and services that the City of<br />
<strong>Ottawa</strong> will implement to serve a projected population of 1.14 million people by 2031. It sets<br />
direction for the City’s day-to-day transportation programs, and provides a basis for budget<br />
planning. It supports the <strong>Ottawa</strong> 20/20 growth management strategy and the City’s Official <strong>Plan</strong>,<br />
which guides the City’s physical development.<br />
This plan will come to life through mechanisms such as long-range financial plans, mid-range<br />
implementation plans, annual budgets, program development, area and corridor transportation<br />
studies, design or practice guidelines, and Community Design <strong>Plan</strong>s. The need to update this plan<br />
will be reviewed in conjunction with a similar assessment of the City’s Official <strong>Plan</strong>, which is<br />
required every five years. Over the intervening time period, readers seeking a current statement of<br />
City transportation policies must consult the record of Council decisions in addition to this plan.<br />
Current and Future Conditions<br />
<strong>Transportation</strong> system overview. <strong>Ottawa</strong>’s transportation system includes walking and cycling<br />
facilities, conventional and specialized bus services, Transitway and O-Train rapid transit lines, a<br />
road network and parking facilities. City-owned transportation facilities are complemented by<br />
freeways owned by the Province of Ontario, and by roads, interprovincial bridges and multi-use<br />
pathways owned by the federal government. There are also international and general aviation<br />
airports, intercity rail and bus stations, two ferries and a freight yard.<br />
Current travel patterns. During the morning peak hour in 2005 (origin destination survey),<br />
about 62% of <strong>Ottawa</strong> residents traveled by automobile compared to about 21% by transit, 9% by<br />
walking, 2% by cycling and 6% by other modes. Transit ridership has seen continuous growth<br />
since 1996, and <strong>Ottawa</strong> residents take transit, on average, 100 times annually—more than<br />
residents in any city of comparable size in North America. While average household auto<br />
ownership increased by 10% from 1995 to 2005, the number of daily trips per person declined<br />
slightly<br />
Future travel patterns. Population and employment are expected to grow by about 30% and<br />
35% respectively by 2031, with urban communities outside the Greenbelt projected to<br />
accommodate 68% of new residents and 42% of new jobs. As a result, the overall demand for<br />
morning peak hour person-trips on <strong>Ottawa</strong>’s transportation system will grow by 38%. In view of<br />
this growth, this plan strives to minimize the future need for new and widened roads while<br />
avoiding levels of congestion that would have unacceptable implications for <strong>Ottawa</strong>’s quality of<br />
life. It sets an ambitious transit modal split objective for 2031 of carrying 30% of motorized<br />
person-trips in the morning peak hour, a rate significantly greater than the 23% figure observed in<br />
2005. Transit will carry 51% of motorized person-trips to and from <strong>Ottawa</strong>’s Inner Urban Area<br />
TRANSPORTATION MASTER PLAN<br />
NOVEMBER 2008<br />
Page iii
(up from 39% in 2005), 33% of trips across the Greenbelt (up from 23%), and 43% of trips to and<br />
from Gatineau (up from 16%) during the morning peak hour, in the peak direction.<br />
This plan also sets ambitious objectives for walking and cycling. Respectively, these modes will<br />
carry 10% and 3% of all morning peak hour person-trips in 2031, up from 9.3% and 1.7% in 2005<br />
(note these figures are averages for the fall season, and would be higher in summer and lower in<br />
winter). This represents a 33% increase in the number of walking trips, and a 139% increase in<br />
the number of cycling trips.<br />
Despite these substantial increases in the role of transit, walking and cycling, there will be<br />
significantly higher traffic volumes in every major travel corridor during the peak hour.<br />
Strategic Directions<br />
<strong>Transportation</strong> Vision. This plan identifies a vision that includes 12 elements and 39 supporting<br />
principles. The vision expresses how <strong>Ottawa</strong>’s transportation system can support the<br />
community’s social, environmental and economic sustainability, and how it should be managed to<br />
ensure accountability and responsiveness to residents and taxpayers. The plan also identifies eight<br />
strategic directions that are essential to achieving this vision, as discussed in the following<br />
paragraphs. These directions are themes that cut across the policies and programs for specific<br />
modes (e.g. active transportation, transit, motor vehicles) outlined in subsequent sections of the<br />
plan.<br />
Creating supportive land use. As detailed in the Official <strong>Plan</strong>, the City will shape development<br />
patterns by encouraging compact developments with a mix of uses, and by requiring supportive<br />
community and site design practices. Managing transportation demand. The City will develop<br />
and implement a transportation demand management (TDM) strategy that uses education,<br />
promotion and incentives, often delivered in partnership with employers and other organizations,<br />
to make alternatives to driving more attractive, build a positive public attitude towards them, and<br />
provide individuals with information and incentives that encourage responsible travel behaviours.<br />
Managing the transportation system. The City will maximize the efficiency and people-moving<br />
capacity of existing systems, in order to reduce the need for new infrastructure and services,<br />
achieve modal shift objectives, minimize the costs of congestion, and preserve public health. To<br />
this end, it will develop and implement new strategies to improve incident management and<br />
multimodal traveller information.<br />
Enhancing safety and security. The City will make walking, cycling, transit use and automobile<br />
travel safer and more secure through education, engineering and enforcement.<br />
Protecting the environment. The City will work to minimize the environmental effects of<br />
transportation infrastructure, services and activities by greening transportation corridors,<br />
designing and maintaining infrastructure to minimize impacts on water and land, encouraging<br />
cleaner fuel and vehicle technologies, and designing facilities and communities to reduce the<br />
impacts of noise.<br />
TRANSPORTATION MASTER PLAN<br />
NOVEMBER 2008<br />
Page iv
Managing and maintaining assets. The City will minimize the life-cycle costs of transportation<br />
infrastructure and sustain desired levels of service by optimizing its reinvestment and renewal<br />
strategies, and by pursuing effective and efficient maintenance through supportive infrastructure<br />
design, traffic management and landscaping.<br />
Funding implementation. The City has insufficient funding sources to support the projects and<br />
programs that this plan calls for, and it will pursue possible revenue enhancements through<br />
channels including development charges, user fees for motor vehicle use, public-private<br />
partnerships and financial transfers from senior governments.<br />
Measuring performance. The City will monitor its progress toward key objectives using a<br />
framework of transportation performance objectives and indicators to track relevant conditions,<br />
actions and impacts.<br />
Active <strong>Transportation</strong><br />
Walking, cycling and other forms of human-powered travel are key to <strong>Ottawa</strong>’s vibrancy and<br />
sustainability. They have multiple social, environmental and economic benefits, and collectively<br />
represent a priority of this plan.<br />
Supporting measures. The City’s land use and transportation demand management practices will<br />
be essential to the creation of physical, social and cultural environments where walking, cycling<br />
and other forms of human-powered travel are attractive alternatives. The City will undertake a<br />
wide range of supportive initiatives to demonstrate leadership, create walkable and bicyclefriendly<br />
communities, educate users, promote active transportation options, improve end of trip<br />
facilities and connections to public transit, and explore a possible system of public bicycles.<br />
Walking facilities. The City will emphasize the primary role of pedestrian facilities in building<br />
more walkable environments. To this end, the <strong>Ottawa</strong> Pedestrian <strong>Plan</strong> (under development) will<br />
identify an integrated pedestrian network and implementation strategy. The City will also require<br />
walking facilities to provide pedestrian access to transit nodes and between neighbourhoods, and<br />
along new and reconstructed roads. Proper design and maintenance are also a priority.<br />
Cycling facilities. The City will implement an integrated cycling network that includes the Spine<br />
route system and National Capital Pathways shown on Map 2 and Map 3, and the<br />
complementary Community route system identified in the <strong>Ottawa</strong> Cycling <strong>Plan</strong> (approved in<br />
2008). It will proactively implement a number of strategic linkages, and will pursue supportive<br />
operational and maintenance measures that make cycling a safer and more convenient option.<br />
Multi-use pathways. This plan calls for the provision of urban and rural multi-use pathways (see<br />
Map 1 and Map 3) for walking, cycling and other active modes like in-line skating, especially in,<br />
adjacent to or across rapid transit corridors, and within and between neighbourhoods. It<br />
recognizes the importance of supportive design and construction standards, and of winter<br />
maintenance to enable year-round use.<br />
TRANSPORTATION MASTER PLAN<br />
NOVEMBER 2008<br />
Page v
Public Transit<br />
This plan aims to increase the proportion of motorized person-trips carried by transit in the<br />
morning peak hour from 23% in 2005 to 30% (a level similar to many European cities) in 2031.<br />
Its multi-pronged transit strategy is outlined in the following paragraphs.<br />
Supporting measures. The City will work to make transit more competitive relative to<br />
automobile use, and to make it the first choice for as many people as possible. To do so, it will<br />
improve the form of development, reduce the supply of abundant free parking at key destinations,<br />
improve public awareness and support, level the financial playing field between transit and<br />
driving, better integrate transit with other modes, and set priorities for new infrastructure that<br />
improve transit’s service advantage wherever possible.<br />
Ease of mobility. The City will improve the mobility it offers to individuals through a variety of<br />
initiatives related to route network structure and service standards, rapid transit and transit<br />
priority networks, fleet expansion and maintenance, and safety and security:<br />
• It will make the transit system more customer-friendly by developing and strengthening a<br />
network of trunk lines and feeder routes that offers greater simplicity, reliability, efficiency<br />
and on-time performance, and by reducing uncertainty and waiting times at transfer points. It<br />
will continue to optimize interprovincial transit travel in partnership with the Société de<br />
transport de l’Outaouais, and to serve residents of villages and rural areas through direct<br />
services, Park & Ride lots and support for private or other municipal transit services.<br />
• It will create a greatly expanded network of bus rapid transit and electrified light rail<br />
corridors (see Map 4a). It will endeavour to intensify land uses around many rapid transit<br />
stations, add new Park & Ride lots where warranted, and offer superior levels of comfort and<br />
convenience at those stations that serve high volumes of transferring passengers.<br />
• It will implement a network of transit priority corridors (see Map 4a) to reduce travel times<br />
and improve the reliability of transit service in mixed traffic conditions. In some cases, transit<br />
priority measures may be used to defer the need for greater capital investments in gradeseparated<br />
rapid transit facilities.<br />
• It will improve service availability by expanding its bus and rail fleets and reducing the<br />
number of spare buses as a proportion of the total fleet.<br />
• It will make transit safer and more secure by expanding its security staff and continuing its<br />
partnership, education and outreach efforts in key areas.<br />
Economic efficiency. The City will strive to offer quality transit service at the lowest possible<br />
cost. It will endeavour to recover revenues equivalent to at least 50% of operating expenses until<br />
an expanded rail transit network is in operation, at which point it will work toward a new costrecovery<br />
target of 55%. It will develop an electronic fare system that can offer flexible transit fare<br />
structures including customized fares by user category, time and distance, and will pursue greater<br />
contributions from senior governments toward transit operating costs.<br />
Accessibility for customers with disabilities. The City will continue to make conventional<br />
transit services more accessible while it also provides door-to-door Para Transpo service. It will<br />
TRANSPORTATION MASTER PLAN<br />
NOVEMBER 2008<br />
Page vi
design new rapid transit facilities to be accessible, and will acquire only low-floor transit vehicles<br />
until its fleet is 100% low-floor by 2015. Until then, low-floor buses will be assigned to routes<br />
where they benefit the greatest number of passengers.<br />
Environmental efficiency. The City will strive to reduce transit’s greenhouse gas footprint by<br />
improving vehicle fuel efficiency. Future light rail vehicles will be electric, hybrid buses will be<br />
phased in over three years, and opportunities to adopt other bus technologies including fuel cells<br />
will be monitored.<br />
Roads and Motor Vehicle Use<br />
Roads are the backbone of <strong>Ottawa</strong>’s transportation system. They serve all modes of travel within<br />
the City, and the competing needs and interests of those modes represent a great challenge in the<br />
development of an effective and efficient road network. The following paragraphs summarize key<br />
issues pertaining to the provision and operation of roads.<br />
City of <strong>Ottawa</strong> roads. This plan establishes a comprehensive network of several different types<br />
of roads, from freeways to local roads (see Map 5 through Map 8). Requirements for new and<br />
widened roads result from projections of future automobile and truck volumes, which are<br />
expected to increase in all major corridors despite ambitious modal shift targets. The main<br />
performance target for roads is operation at 90% of capacity during the morning peak hour,<br />
except in the Urban Core where operation at 100% of capacity will be acceptable. These service<br />
targets will always be balanced against the vital requirement for public safety, and may be relaxed<br />
in corridors or areas where service levels for transit vehicles, pedestrians or cyclists have a higher<br />
priority.<br />
Federal and provincial roads. Additional crossing(s) of the <strong>Ottawa</strong> River will be required by<br />
2031 to serve the increased peak hour travel demand between <strong>Ottawa</strong> and Gatineau, and to divert<br />
heavy trucks from King Edward Avenue and the Macdonald-Cartier Bridge. The City will protect<br />
all approaches to possible crossing locations pending the completion of the environmental<br />
assessment study of interprovincial crossing being undertaken by the federal government in<br />
conjunction with both provincial governments and affected municipalities.<br />
Road right-of-way protection. The City may secure right-of-way for public roads from<br />
landowners as a condition of development approval for a subdivision, severance or site plan. The<br />
City will protect road rights-of-way through the development approval process, as outlined in the<br />
Official <strong>Plan</strong>, although there may be situations in which the City may choose to reduce its right-of<br />
way requirement.<br />
Road design. The City has developed and will apply design guidelines to ensure that all road<br />
corridors support adjacent land uses, enhance safety, offer supportive environments for walking,<br />
cycling and transit use, provide adequate lighting and maximize greening opportunities. It will<br />
review development applications to ensure that road networks offer access and connectivity for<br />
pedestrians, cyclists and transit vehicles.<br />
TRANSPORTATION MASTER PLAN<br />
NOVEMBER 2008<br />
Page vii
Road safety. The City will develop a comprehensive Road Safety <strong>Plan</strong> to enhance monitoring<br />
and management practices and programs that improve the safety of all road users through<br />
engineering, education and enforcement.<br />
Road corridor optimization. The City will conduct a program to optimize the operation of<br />
freeway and arterial corridors in an integrated manner. It will strive to eliminate bottlenecks that<br />
create delay and compromise safety for road users, while also addressing considerations related to<br />
property access, vehicular emissions and conditions for walking, cycling, transit and carpooling.<br />
Area traffic management. Area traffic management preserves quality of life in neighbourhoods<br />
by mitigating undesirable effects of motor vehicle use, including excessive volumes and speeds,<br />
aggressive driver behaviour and hostile conditions for walking and cycling. The City’s Area<br />
Traffic Management Guidelines identify an equitable and consistent process for addressing the<br />
needs of neighbourhood residents, businesses and road users through road network modifications,<br />
traffic control devices, traffic calming measures, streetscaping, enforcement, transportation<br />
demand management and public education.<br />
Ridesharing. This plan projects an average automobile occupancy during the morning peak hour<br />
of 1.20 persons per vehicle, about the same as the 2005 observed value of 1.23. By holding this<br />
value steady, the City would halt a four-decade downward trend in automobile occupancies and<br />
strengthen its ability to provide a desired quality of service on its roadway network. The City will<br />
develop an integrated ridesharing strategy to assess opportunities for TDM measures, carpool<br />
parking lots and carpool lanes to increase ridesharing in key travel markets, nodes and corridors.<br />
It will also promote its online ridematching service, enhance public awareness and understanding<br />
of ridesharing opportunities, and study the feasibility of a regional vanpooling service.<br />
Taxis. This plan acknowledges the role of taxis in the transportation system, and encourages<br />
improvements to the accessibility of the taxi fleet as well as the provision of taxi stands at a<br />
variety of locations.<br />
Goods movement. Many of <strong>Ottawa</strong>’s major roads are designated as truck routes. While the<br />
provision of a comprehensive truck route network enables efficient freight movement through and<br />
within <strong>Ottawa</strong>, trucking activities can be disruptive to communities. The City will continue<br />
efforts to protect residential areas from undesirable truck route impacts, including the<br />
preservation of alternative routes that can accommodate the loads and manoeuvres of large trucks.<br />
Parking. Steps that the City takes to manage parking in both the public and private realms will<br />
contribute to its success in achieving key transportation objectives such as transit ridership<br />
targets, land use goals such as compact development and intensification, and economic objectives<br />
such as thriving business, institutional, residential and tourism uses in the downtown core. To this<br />
end, the City will develop a parking management strategy that defines a program of regular<br />
parking assessments in key areas, and identifies strategic parking policies, programs and<br />
guidelines. It will conduct a pilot project to showcase proactive parking management strategies in<br />
Centrpointe Town Centre, and will also ensure that various key land use by-laws and policies are<br />
consistent with its parking management principles.<br />
TRANSPORTATION MASTER PLAN<br />
NOVEMBER 2008<br />
Page viii
Intercity Travel<br />
<strong>Ottawa</strong>’s connections to outside destinations contribute to the community’s economic vitality.<br />
While the plan addresses road and transit links, it also acknowledges the importance of<br />
supporting air, rail and intercity bus services. The particular importance of ensuring high-quality<br />
transit and road connections to major intercity passenger terminals is highlighted. The plan also<br />
addresses general aviation, including the City-owned Carp Airport.<br />
Implementation<br />
Capital works plan. This plan includes a phasing strategy for infrastructure projects as a basis<br />
for future budget preparation. Infrastructure needs are grouped into phases.<br />
Costs. The cost of building and operating the transportation system identified in this <strong>Plan</strong> is about<br />
$8.36 billion through 2031, including $7.24 billion for capital costs ($5.11 billion for transit and<br />
$2.11 billion for roads) and $1.12 billion for operations and maintenance ($938 million for transit<br />
and $180 million for roads).<br />
Environmental assessment. Provincially and federally legislated requirements for Environment<br />
Assessment studies will also guide the implementation of this plan. While some recommended<br />
infrastructure elements have partially completed the related requirements, most elements will be<br />
subject to further study, consultation and documentation.<br />
TRANSPORTATION MASTER PLAN<br />
NOVEMBER 2008<br />
Page ix
Chapter 1 – Introduction<br />
The City of <strong>Ottawa</strong>, shown in Figure 1.1, is one of Canada’s largest municipalities and delivers<br />
services to more than 870, 800 people (2006). By 2031, the City’s population is expected to<br />
approach 1.14 million people. This level of growth will open new opportunities for the city and<br />
its residents, but will also bring significant change and new challenges.<br />
The <strong>Transportation</strong> <strong>Master</strong> <strong>Plan</strong> will guide the City of <strong>Ottawa</strong> over the next two decades as it<br />
strives to manage growing transportation demand in ways that reinforce its residents’ values and<br />
aspirations. It identifies the transportation facilities and services that the City intends to put in<br />
place by 2031 to meet the travel needs of residents and businesses, and to support the<br />
development pattern identified in the Official <strong>Plan</strong>. Its policies will guide the operation of the<br />
City’s day-to-day transportation programs, and provide a basis for developing capital and<br />
operating budgets. It does not focus on design or operating details, but refers frequently to<br />
existing or future guideline or strategy documents that will give detailed support to policy<br />
objectives. All of these actions by the City will complement the actions required of the private<br />
sector by the Official <strong>Plan</strong>.<br />
Figure 1.1 – The City of <strong>Ottawa</strong><br />
d’<br />
1.1 <strong>Ottawa</strong>’s Growth Management Strategy<br />
This <strong>Plan</strong> is an update to <strong>Ottawa</strong>’s 2003 <strong>Transportation</strong> <strong>Master</strong> <strong>Plan</strong>, and has been prepared<br />
concurrently with an update to <strong>Ottawa</strong>’s 2003 Official <strong>Plan</strong>. The original versions of both <strong>Plan</strong>s<br />
were developed through the <strong>Ottawa</strong> 20/20 initiative, a two-year process that helped the City<br />
prepare a growth management strategy for the period to 2021. The principal goal of <strong>Ottawa</strong> 20/20<br />
was to balance social, environmental and economic issues in a way that enables the City to serve<br />
TRANSPORTATION MASTER PLAN Page 1<br />
NOVEMBER 2008
today’s residents while being responsible to future generations. As part of the <strong>Ottawa</strong> 20/20<br />
process, the City completed five growth management plans in 2003—the Official <strong>Plan</strong>, Human<br />
Services <strong>Plan</strong>, Arts and Heritage <strong>Plan</strong>, Economic Strategy and Environmental Strategy. A City<br />
Strategic <strong>Plan</strong> was also prepared in 2006 and updated in 2007. Together, these plans identify the<br />
City’s long-term strategic directions and form a comprehensive blueprint for the future of <strong>Ottawa</strong>.<br />
<strong>Ottawa</strong>’s Official <strong>Plan</strong> guides the physical development of the city through land use, community<br />
design and infrastructure policies, and is directly supported by the <strong>Transportation</strong> <strong>Master</strong> <strong>Plan</strong> as<br />
well as the Infrastructure <strong>Master</strong> <strong>Plan</strong> (for water, wastewater and stormwater services) and the<br />
Greenspace <strong>Master</strong> <strong>Plan</strong> (for the protection, acquisition and management of greenspace).<br />
Together, these three plans set out strategies, policies, programs and infrastructure elements<br />
consistent with the directions contained in the Official <strong>Plan</strong>, and are clearly referenced within it.<br />
The <strong>Ottawa</strong> 20/20 initiative defined seven guiding principles and accompanying objectives to<br />
guide the preparation of all plans related to the City’s growth management strategy. Figure 1.2<br />
identifies some ways in which the <strong>Transportation</strong> <strong>Master</strong> <strong>Plan</strong> directly supports these principles.<br />
1.2 Interpreting and Updating this <strong>Plan</strong><br />
The policies contained in the <strong>Transportation</strong> <strong>Master</strong> <strong>Plan</strong> represent Council’s stated intentions,<br />
and will guide day-to-day transportation decisions. This plan is a starting point that will come to<br />
life through mechanisms such as:<br />
• long-range financial plans, mid-range (e.g. 10-year) implementation plans and annual budgets<br />
that identify priorities and resources for a range of transportation programs<br />
• strategies and action plans for individual transportation programs that detail undertakings,<br />
timeframes and resource needs<br />
• Environmental Assessment processes to obtain provincial or federal consent for projects like<br />
rapid transit systems, major roads and bridges<br />
• Community Design <strong>Plan</strong>s for areas designated in the Official <strong>Plan</strong><br />
• guideline documents such as those setting design specifications or operational procedures.<br />
As time passes, unexpected changes to the assumptions behind this <strong>Plan</strong>’s policies and actions—<br />
such as the pace, location or magnitude of residential, commercial and institutional<br />
development—may require adjustments to the <strong>Plan</strong> and its elements, including the nature and<br />
timing of transportation facilities and services. Other possible issues of concern include the City’s<br />
ability to invest in infrastructure, changes to the City of Gatineau’s land use or transportation<br />
systems, changes to provincial or federal transportation facilities within <strong>Ottawa</strong>, or changes in<br />
national or international circumstances such as an energy crisis.<br />
The City will review the need to update this <strong>Plan</strong> when it considers the need to update its Official<br />
<strong>Plan</strong>, an event required every five years by provincial legislation. In the intervening period,<br />
Council decisions on transportation issues will have the inevitable effect of amending, deleting,<br />
replacing or complementing some of the policies in this <strong>Plan</strong>. For this reason, readers must<br />
TRANSPORTATION MASTER PLAN Page 2<br />
NOVEMBER 2008
consider this plan in conjunction with the record of subsequent Council decisions, in order to<br />
fully grasp current City transportation policy at any given point in time.<br />
Figure 1.2 – <strong>Ottawa</strong>’s Growth Management Principles and the <strong>Transportation</strong> <strong>Master</strong> <strong>Plan</strong><br />
Growth Management<br />
Principles<br />
A Caring and Inclusive City<br />
Providing public services in a<br />
way that responds to cultural<br />
needs and diversity while<br />
assisting social integration<br />
<strong>Transportation</strong> <strong>Master</strong> <strong>Plan</strong> Directions<br />
• Ensuring access to transportation options for all residents, regardless of<br />
age or ability<br />
• Providing high-quality services and facilities for walking, cycling and<br />
transit<br />
• Improving road safety<br />
A Creative City Rich in Heritage, Unique in Identity<br />
Encouraging civic pride and the • Supporting a vibrant downtown by preserving multi-modal access, with a<br />
arts, and maintaining those focus on walking, cycling and transit<br />
community elements that make • Acknowledging the different transportation needs of urban and rural areas<br />
<strong>Ottawa</strong> unique<br />
A Green and Environmentally Sensitive City<br />
Protecting natural resources<br />
through wise land use and<br />
development<br />
• Maximizing the use of walking, cycling and transit through supply and<br />
demand management<br />
• Reducing the environmental impacts of transportation on air, water and<br />
land<br />
• “Greening” major road corridors<br />
A City of Distinct, Liveable Communities<br />
Fostering identifiable<br />
• Maximizing access to community services and facilities by walking,<br />
communities that have a variety cycling and transit<br />
of housing choices,<br />
• Linking community cores and employment areas with rapid transit<br />
employment, parks, services and • Offering a range of transportation options for persons with disabilities<br />
facilities that are accessible • Managing traffic volumes and speeds in residential neighbourhoods<br />
• Creating public rights-of-way that are sensitive to adjacent land uses<br />
An Innovative City Where Prosperity Is Shared Among All<br />
Encouraging knowledge and<br />
talent to create local business<br />
and a strong economy<br />
• Enabling the efficient movement of goods and services<br />
• Helping businesses and institutions remain accessible to clients and<br />
patrons, including those from outside <strong>Ottawa</strong><br />
• Helping employers improve commuter options and eliminate mobility<br />
barriers that limit access to jobs<br />
A Responsible and Responsive City<br />
Encouraging an open and • Setting goals and monitoring their achievement<br />
participatory process, being • Reducing public and private costs by promoting efficient modes of<br />
accountable, conducting ongoing<br />
strategic monitoring and • Pursuing sustainable funding strategies such as “user pay” approaches<br />
transportation<br />
adjusting to make efficient use and public-private partnerships<br />
of its infrastructure and • Improving cost-effectiveness by partnering with public, private and<br />
resources.<br />
community organizations<br />
• Providing information that helps individuals make responsible<br />
transportation choices<br />
A Healthy and Active City<br />
Creating opportunities for<br />
healthy living through<br />
community design and<br />
recreational facilities and parks<br />
• Promoting active transportation as a component of healthy lifestyles<br />
• Providing comprehensive walking and cycling networks<br />
• Minimizing air pollution from transportation<br />
TRANSPORTATION MASTER PLAN Page 3<br />
NOVEMBER 2008
Chapter 2 – Current and Future Conditions<br />
2.1 An Overview of <strong>Ottawa</strong>’s <strong>Transportation</strong> System<br />
The City of <strong>Ottawa</strong> is home to about 870,700 people. The city covers an area of 2,760 square<br />
kilometres of which 10% is urban and 90% is agricultural land, villages, marginal and forested<br />
lands, and wetlands. The population of the City of Gatineau and its surrounding rural area, across<br />
the <strong>Ottawa</strong> River in the Province of Quebec, is about 279,200 people; together, <strong>Ottawa</strong>-Gatineau<br />
is the largest metropolitan area in Canada after Toronto, Montreal and Vancouver.<br />
<strong>Ottawa</strong>’s transportation system lies within three government jurisdictions, each of which has<br />
specific interests with respect to the planning, design, construction and maintenance of its own<br />
facilities. Most of the road, transit and pathway networks are owned and maintained by the City,<br />
but major intercity highways (namely Highways 416, 417 and 7) are the responsibility of the<br />
provincial government, and five interprovincial road bridges as well as the National Capital<br />
Commission’s roads and multi-use pathways are under federal jurisdiction. The city is also<br />
serviced by one international and three general aviation airports, two passenger railway stations,<br />
an intercity bus terminal, two ferries and a freight yard.<br />
The City is responsible for a truly multimodal transportation system with facilities and services<br />
for walking and cycling, public transit, roads and parking:<br />
• About 6,000 kilometres of roads (see Chapter 5) including 1,400 km of arterials, 4,600 km of<br />
collectors, local streets and a freeway<br />
• About 1,575 km of sidewalks and 340 km of on-road bicycle lanes<br />
• City operated off-street parking lots with 2,799 spaces, and 3,773 on-street parking meters<br />
• 990 standard and articulated buses, a Transitway system (31 km of dedicated busway, 34<br />
stations, 16 km of arterial road bus lanes, 23 km of freeway shoulder bus lanes, and 11 Park<br />
& Ride lots with 5370 parking spaces) and the O-Train light rail line (8 km long with five<br />
stations)<br />
• 91 lift-equipped vans and 37 cars providing specialized transit service for persons with<br />
disabilities<br />
TRANSPORTATION MASTER PLAN Page 4<br />
NOVEMBER 2008
2.2 Population and Employment Distribution<br />
The City of <strong>Ottawa</strong> is expecting substantial growth in population and employment by 2031, with<br />
new residents and workers placing considerable pressure on its transportation system. Figure 2.1<br />
summarizes these growth projections and shows that the city’s population is projected to grow<br />
about 30% from 2006 to 2031. Of the 265,000 new residents, 20% will live inside the Greenbelt<br />
while 68% will live in urban areas outside the Greenbelt, and 12% will live in rural areas. The<br />
number of jobs is projected to grow about 35% from 2006 to 2031. About 42% of new jobs will<br />
be located inside the Greenbelt, while 50% will be in urban areas outside the Greenbelt and about<br />
8% will be in rural areas.<br />
Figure 2.1 – Projected Population and Employment Growth<br />
Inside<br />
Greenbelt<br />
West<br />
Urban<br />
Centre<br />
South<br />
Urban<br />
Centre<br />
East<br />
Urban<br />
Centre<br />
Rural<br />
Area<br />
Population 2006 533,100 88,400 64,500 99,000 85,700 870,700<br />
2031 585,800 162,200 147,600 123,500 116,600 1,135,700<br />
Growth 52,700 73,800 83,100 24,500 30,900 265,000<br />
Distribution 20% 28% 31% 9% 12% 100%<br />
Employment 2006 428,600 43,600 9,800 17,900 21,800 521,700<br />
2031 505,500 77,000 49,300 35,000 36,200 703,000<br />
Growth 76,900 33,400 39,500 17,100 14,400 181,300<br />
Distribution 42% 18% 22% 10% 8% 100%<br />
Total<br />
TRANSPORTATION MASTER PLAN Page 5<br />
NOVEMBER 2008
2.3 Current Travel Patterns and Trends<br />
Results of the 2005 Origin-Destination (OD) survey of over 24,000 households in the National<br />
Capital Region provide a snapshot of weekday personal travel patterns by persons aged 11 years<br />
or more. These results can also be compared to those of previous surveys in 1986 and 1995 to<br />
illustrate changes in transportation activity that have occurred in <strong>Ottawa</strong>. The OD survey did not<br />
capture weekend travel, commercial trips or trips generated outside the National Capital Region.<br />
Within this section, data are for the National Capital Region unless otherwise noted.<br />
2.3.1 Individual and Household Characteristics<br />
Occupation. The 2005 survey found that (rounded figures) 74% of persons aged 11 or older were<br />
employed individuals or students, seniors accounted for a further 17%, homemakers 5% and<br />
others 5% (e.g. unemployed).<br />
Automobile ownership. In total there were 482,000 vehicles for <strong>Ottawa</strong>’s 2005 population of<br />
865,700. Each household owned an average of 1.39 vehicles, with 13% of households having no<br />
vehicle available, 79% having one or two vehicles and 8% having three or more vehicles. As<br />
shown in Figure 2.2, vehicle ownership varied considerably among different areas within<br />
<strong>Ottawa</strong>, with very low levels of multiple vehicle availability in central areas, high levels in<br />
suburban and rural areas, and more average levels in areas just inside the Greenbelt such as<br />
Beacon Hill and Bayshore. Household vehicle ownership increased by 10% over 1995, and by<br />
14% over 1986 levels.<br />
Figure 2.2 – Household Vehicle Availability (2005)<br />
Proportion of Households by<br />
Area<br />
Number of Vehicles Available<br />
0 1 2 3 or more<br />
<strong>Ottawa</strong> Central core 40% 54% 6% 0%<br />
<strong>Ottawa</strong> Inner Area 35% 50% 13% 1%<br />
<strong>Ottawa</strong> East 25% 50% 21% 4%<br />
Beacon Hill 11% 55% 29% 5%<br />
Orléans 2% 41% 48% 10%<br />
<strong>Ottawa</strong> West 19% 53% 23% 4%<br />
Bayshore 11% 49% 33% 6%<br />
Kanata-Stittsville 3% 35% 53% 10%<br />
Alta Vista 17% 54% 24% 5%<br />
Hunt Club 7% 47% 39% 7%<br />
South Gloucester / Leitrim 0% 28% 60% 12%<br />
Merivale 13% 50% 30% 7%<br />
South Nepean 2% 34% 54% 10%<br />
Rural areas 1% 18-19% 53-57% 24-26%<br />
Total City 13% 45% 34% 8%<br />
TRANSPORTATION MASTER PLAN Page 6<br />
NOVEMBER 2008
2.3.2 Overall trip making<br />
Daily trip rates. In 2005, <strong>Ottawa</strong> residents made 2.1 million trips over a 24-hour period. Each<br />
person made an average of 2.8 trips per day and each household made an average of 6.1 trips per<br />
day. From 1986 to 2005 the 33% growth in the total number of daily trips was smaller than the<br />
growth in population (42%) and households (54%). As a result, the number of trips per person<br />
dropped by 2%, from 2.83 trips in 1986 to 2.78 trips in 2005. The number of trips per household<br />
dropped by 15%, from 7.08 trips in 1986 to 6.03 trips in 2005, due mostly to a reduction in the<br />
number of persons per household.<br />
Choice of all modes—all day. Over a 24-hour period, 58% of trips were made by auto drivers,<br />
13% by auto passengers, 13% by transit, 11% by walking, and 1% by cycling.<br />
Choice of car—all day. Over a 24-hour period in 2005, 71% of all trips were made by car (58%<br />
as drivers and 13% as passengers), unchanged from 1996 (except that the breakdown was 55% as<br />
drivers and 16% as passengers). From 1986 to 2005, the average number of occupants in each car<br />
decreased from 1.32 to 1.23 persons, meaning that the average number of passengers per car<br />
(i.e. excluding the driver) decreased by about 30%. The total number of auto driver trips made in<br />
2005 was 13.5% more than in 1995, and 32% more than in 1986. The total number of singleoccupant<br />
auto trips, however, increased by about 18% since 1995.<br />
Choice of transit—peak periods. In 2005, 21% of morning peak period trips starting in <strong>Ottawa</strong><br />
and 18% of all afternoon peak period trips starting in <strong>Ottawa</strong> were made by transit. In the<br />
Outaouais, comparable figures were 17% and 14%, respectively. These figures represented a<br />
significant increase over 1996,when the survey observed figures for morning and afternoon trips<br />
of 18% and 14% for <strong>Ottawa</strong>, and 9% and 8% for the Outaouais.<br />
Choice of all modes—morning peak period. In the morning peak period, 478,400 trips were<br />
made to, from or within <strong>Ottawa</strong>. Of these, 62% were by car, 21% by public transit, 9% by<br />
walking, 2% by cycling and 6% by other modes (e.g. school bus, motorcycle). During the same<br />
period, 418,000 trips were made entirely within <strong>Ottawa</strong>. Of these, 61% were by car (and of these,<br />
82% by drivers and 18% by passengers), 20% by public transit, 10% by walking, 2% by cycling<br />
and 7% by other modes.<br />
2.3.3 Time and purpose of travel<br />
Concentration of trips during peak hours. In 2005, the proportion of daily (i.e. 24-hour) trips<br />
that occurred during the morning and afternoon peak hours was 44% for all modes, 42% for auto<br />
drivers, 38% for auto passengers and 60% for transit users (31% in the morning and 29% in the<br />
afternoon). The afternoon peak period (644,000 trips) was busier than the morning peak period<br />
(573,000 trips), with the busiest single hour being between 4:00 and 5:00 p.m., when 281,300<br />
trips were made. From 1996 to 2005, the number of morning peak hour trips increased by 13%<br />
while the number of afternoon peak hour trips increased by 10% (the same as the overall 24-hour<br />
period.<br />
TRANSPORTATION MASTER PLAN Page 7<br />
NOVEMBER 2008
Travel purpose. The reasons that people travelled during the 2005 morning and afternoon peak<br />
periods are illustrated in Figure 2.3.<br />
Figure 2.3 - Trip Purpose During Morning and Afternoon Peak Periods (2005)<br />
School<br />
24%<br />
AM Peak Period<br />
Shopping<br />
Leisure<br />
3%<br />
1%<br />
Medical<br />
1% / Pick up<br />
Drop off<br />
9%<br />
Return<br />
home<br />
4%<br />
Other<br />
2%<br />
Return<br />
home<br />
66%<br />
PM Peak Period<br />
Work or<br />
Other<br />
related<br />
School<br />
3%<br />
3%<br />
1%<br />
Shopping<br />
9%<br />
Leisure<br />
9%<br />
Medical<br />
1%<br />
Work or<br />
related<br />
56%<br />
/ Pick up<br />
Drop off<br />
8%<br />
2.3.4 Travel origins and destinations<br />
Highest volume corridors. The major travel flows between districts in the National Capital<br />
Region for weekday mornings in 2005 (where at least 3,000 persons travelled) are shown in<br />
Figure 2.4. The figure clearly shows that downtown <strong>Ottawa</strong> is a dominant destination (23% of<br />
trips shown), and that a significantly greater number of residents crossed the Greenbelt from<br />
Orléans than from Kanata-Stittsville. It also shows that 57% of trips to central <strong>Ottawa</strong> from other<br />
districts came from east of the Rideau River, versus 43% from areas to the west. The largest trip<br />
flows in directions other than to downtown occurred from Orléans to <strong>Ottawa</strong> East/Beacon Hill<br />
(8,400), Hunt Club to Alta Vista (7,500 trips), Orléans to Alta Vista (5,300 trips), and Bayshore<br />
to Merivale (5,000 trips).<br />
TRANSPORTATION MASTER PLAN Page 8<br />
NOVEMBER 2008
Figure 2.4 - Major Travel Flows, Morning Trips (2005)<br />
Trips between <strong>Ottawa</strong> and Gatineau. The volume of interprovincial trips in the 2005 weekday<br />
morning peak period are shown in Figure 2.5. Interprovincial trips account for 31% of all trips<br />
starting in the Outaouais but only 4% of all trips starting in <strong>Ottawa</strong>; these proportions were<br />
unchanged from 1995. However, the actual number of interprovincial trips in the morning peak<br />
period did increase by 18% in both directions from 1995 to 2005, resulting in an imbalance of<br />
43,200 trips crossing from Gatineau to <strong>Ottawa</strong> but only 17,200 trips crossing from <strong>Ottawa</strong> to<br />
Gatineau. In the afternoon peak period (not illustrated) the volume of interprovincial trips rose by<br />
25% from 1995 to 2005, reaching 44,200 northbound trips and 19,400 southbound trips.<br />
Figure 2.5 - Interprovincial Trips, 2005 Morning Peak Period<br />
p g p g g<br />
Outaouais<br />
<strong>Ottawa</strong><br />
31%<br />
43,200<br />
139,500<br />
435,200<br />
17,200<br />
4%<br />
TRANSPORTATION MASTER PLAN Page 9<br />
NOVEMBER 2008
Trips between rural and urban <strong>Ottawa</strong>. Travel between <strong>Ottawa</strong>’s rural and urban districts in<br />
the 2005 morning peak period is summarized in Figure 2.6. Rural-urban travel in 2005 accounted<br />
for 67% of trips starting in rural areas but only 2% of all trips starting in urban areas, with actual<br />
volumes of 25,700 rural-to-urban trips (up by 24% from 1995) and 8,300 urban-to-rural trips (up<br />
by 90% from 1995).<br />
Figure 2.6 - Morning Trips To/From Rural and Urban <strong>Ottawa</strong> 2005<br />
25,700<br />
Urban<br />
<strong>Ottawa</strong><br />
396,900<br />
38,300 67%<br />
Rural<br />
<strong>Ottawa</strong><br />
8,300<br />
2%<br />
Internal trips within communities outside the Greenbelt. More complete communities tend to<br />
have a higher degree of internal trip-making as residents have more local opportunities for<br />
employment, education, shopping and recreation. In 2005, the following observations were made<br />
for trips to, from and within the urban communities outside the Greenbelt:<br />
• Kanata-Stittsville—36% were internal, 28% came into the community, 37% left the<br />
community<br />
• South Nepean—25% were internal, 14% came into the community, 61% left the community<br />
• South Gloucester/Leitrim—5% were internal, 27% came into the community, 68% left the<br />
community<br />
• Orléans—36% were internal, 14% came into the community, 50% left the community<br />
These figures show that residents of Kanata-Stittsville and Orléans are more likely than southern<br />
communities outside the Greenbelt to make lower-impact trips that stay within their community.<br />
TRANSPORTATION MASTER PLAN Page 10<br />
NOVEMBER 2008
2.3.5 Modal choice by area<br />
Modal choice for shorter trips. The use of different modes for internal trips within 17 <strong>Ottawa</strong><br />
districts in the afternoon peak period was analyzed, with the following results:<br />
• Walking trips made up 75% of trips in the <strong>Ottawa</strong> central core, 54% within the <strong>Ottawa</strong> inner<br />
area (bounded by the Rideau River and O-Train line) and lesser amounts with increasing<br />
distance from downtown (e.g. 28% in <strong>Ottawa</strong> East, 20% in Beacon Hill, 13% in Orléans,<br />
34% in <strong>Ottawa</strong> West, 20% in Bayshore, 11% in Kanata-Stittsville, and 8% to 10% in rural<br />
areas).<br />
• Cycling trips ranged from a high of 4% in the <strong>Ottawa</strong> inner area to less than 2% in most other<br />
areas.<br />
• Transit trips varied from 28% in the <strong>Ottawa</strong> inner area to 7-13% for districts inside the<br />
Greenbelt, and 3-4% for urban communities outside the Greenbelt except South<br />
Gloucester/Leitrim which had the same rate (below 1%) as rural areas.<br />
• Car trips ranged from 17% in the <strong>Ottawa</strong> central core, 28% in the inner area, and 52-70% in<br />
other areas inside the Greenbelt, to 69-85% for urban communities outside the Greenbelt and<br />
70-80% in the rural area.<br />
• Other trips (principally school bus trips) were most significant in the rural area where they<br />
made up 11-21% of trips.<br />
Modal choice for longer trips. A similar analysis was conducted on the use of different modes<br />
for trips between districts (i.e. non-internal trips) in the afternoon peak period, with the following<br />
results:<br />
• Walking and cycling trips to or from districts varied from 1% or less in rural and urban areas<br />
outside of the Greenbelt to 2 to 4% within the Greenbelt, except for the <strong>Ottawa</strong> central core<br />
and <strong>Ottawa</strong> inner area where it was 5-17%.<br />
• Transit trips made up 23-32% of all trips to or from the <strong>Ottawa</strong> central core and <strong>Ottawa</strong> inner<br />
area, 10-27% of trips to or from other districts inside the Greenbelt, 7-21% of all trips to or<br />
from urban communities outside the greenbelt (except Orléans where they made up 35% of<br />
trips), and lower levels in rural districts (less than 1% in the west, 4-8% in the southeast and<br />
southwest and a high of 9-12% in the east).<br />
• Car trips made up 90% of trips to or from rural districts (except in the east where they ranged<br />
from 75-85%), 63-90% of trips to or from urban communities outside the Greenbelt, and 63-<br />
89% of trips to from districts inside the Greenbelt (except for the two central districts where<br />
they made up 43-60% of trips).<br />
2.3.6 Transit travel<br />
Total ridership. <strong>Ottawa</strong>’s annual transit ridership of over 100 trips per capita is greater than that<br />
of all Canadian cities other than Montreal and Toronto, and of all North American cities of its<br />
size. Over the last two decades transit ridership in <strong>Ottawa</strong> has both fallen and risen, as illustrated<br />
TRANSPORTATION MASTER PLAN Page 11<br />
NOVEMBER 2008
in Figure 2.7. Since hitting a low of 65 million annual transit trips in 1996, transit ridership grew<br />
about 3.5% annually to reach almost 96 million trips in 2007.<br />
Modal shares. Public transit’s share of 24-hour trips by all modes was 13% in 2005, compared to<br />
10% in 1995 and 15% in 1986. The total volume of transit trips was almost identical in 2005 and<br />
1986. Transit’s share of 24-hour trips by motorized modes was 15% in 2005, up from 13% in<br />
1995 and down from 18% in 1986.<br />
Figure 2.7 – Annual Transit Ridership (1990 to 2007)<br />
110<br />
100<br />
Transit ridership (millions)<br />
90<br />
80<br />
70<br />
60<br />
50<br />
40<br />
30<br />
20<br />
10<br />
-<br />
1990 1991 1992 1993 1994 1995 1996 1997 1998 1999 2000 2001 2002 2003 2004 2005 2006 2007<br />
2.3.7 Active transportation (walking and cycling)<br />
In 2005 active transportation comprised for 12% of all daily trips. In the am and pm peak periods<br />
cyclists were 2% of all commuters and walkers were 9%. Measured over a 24 hour period<br />
walkers accounted for 11% of all trips. A 2003 surveys of <strong>Ottawa</strong> residents revealed that 43% of<br />
the population are non-cyclists, 36% cycle for utilitarian reasons and 21% cycle for recreation<br />
only. Of households with bicycles, 73% have 2 or more cyclists.<br />
2.3.8 Travel times by car<br />
A survey of 2005 morning peak period travel times for automobile trips to Parliament Hill in<br />
downtown <strong>Ottawa</strong> (i.e. the intersection of Wellington and Metcalfe Streets) found the following<br />
durations, average speeds and cumulative delays due to complete stops at traffic signals or traffic<br />
congestion:<br />
• From Orléans (Trim and Highway 174, about 18 km) – 30 minutes, 40 km/h, 3 minutes<br />
• From Kanata (March Road and Terry Fox, about 25 km) – 35 minutes, 50 km/h, 3 minutes<br />
TRANSPORTATION MASTER PLAN Page 12<br />
NOVEMBER 2008
• From South Nepean (Prince of Wales and Winding Way, about 17 km) – 30 minutes, 35<br />
km/h, 7 min.<br />
A similar survey in the afternoon period, for the return trip, found the following:<br />
• To Orléans – 20 minutes, 60 km/h, 2 minutes<br />
• To Kanata – 35 minutes, 45 km/h, 3 minutes<br />
• To South Nepean – 35 minutes, 30 km/h, 9 minutes.<br />
2.3.9 Goods movement<br />
Goods movement is another component of travel demand in <strong>Ottawa</strong>. Almost all freight is moved<br />
within and through the city by truck, which in 2003 amounted amounting to 480 million tonnes<br />
annually compared to 900,000 tonnes by rail and 14,000 tonnes by air. About 4% of all freight<br />
trips in <strong>Ottawa</strong> are destined to and from Gatineau. In 2007, about 3,600 trucks crossed the <strong>Ottawa</strong><br />
River each day, making up less than 2% of overall daily bridge traffic.<br />
2.4 Future Travel Patterns<br />
Development of this plan involved the use of computer-based modeling software to project how<br />
future travel demand in the morning peak hour on a typical weekday could change as a result of<br />
population and employment growth. The principal purpose of the modeling activity was to help<br />
identify actions the City must take to serve future travel by pedestrians, cyclists, transit users,<br />
auto drivers and passengers, and commercial vehicles 1 .<br />
While many assumptions about future conditions are required to guide the transportation<br />
modeling process, significant assumptions included the following:<br />
• The likelihood of employed persons to travel to and from work is expected to decline, due to<br />
growth in home-based work and teleworking<br />
• Some shift in automobile trips from the peak hour to adjacent time periods is expected to<br />
occur<br />
• Internalization of travel in the urban communities outside the Greenbelt is expected to<br />
increase—that is, trips starting in each of the new communities are more likely to also end<br />
there—due to an improved balance of jobs with population.<br />
The demand projection process estimated future growth in passenger travel demand by all modes<br />
in <strong>Ottawa</strong>’s morning peak hour, finding that total passenger travel demand is expected to grow<br />
from 214,800 person-trips in 2005 to about 296,000 person-trips in 2031. This increase of 38% is<br />
greater than the population growth of 30% over the same period.<br />
1<br />
Commercial travel demand was not modelled explicitly in terms of trip origins and destinations; rather,<br />
the likely proportion of traffic on major roads that would be represented by commercial vehicles was<br />
estimated and applied in the system analysis.<br />
TRANSPORTATION MASTER PLAN Page 13<br />
NOVEMBER 2008
2.4.1 Transit and Automobile Travel<br />
While the demand projection process estimated future growth in passenger travel demand by all<br />
key travel modes (walking, cycling, transit and automobile), a subsequent detailed analysis was<br />
needed to determine the implications of automobile and transit demand on the capacity<br />
requirements of the road and rapid transit systems. This analysis used a number of screenlines 2<br />
and cordons 3 (see Figure 2.8) to assess travel demands in key corridors. (Note that due to their<br />
locations most screenlines are crossed by very few pedestrians and cyclists, and do not adequately<br />
reflect walking and cycling levels within our communities. Section 2.4.2 discusses how<br />
objectives for walking and cycling were set.)<br />
Figure 2.8 – Major Screenlines<br />
In order to reflect <strong>Ottawa</strong>’s growth management principles (see Section 1.2) and the<br />
<strong>Transportation</strong> Vision (see Section 3.1), this plan aims to achieve the highest reasonable level of<br />
future transit usage. For this reason, an objective of achieving a 30% transit modal split in the<br />
2031 morning peak hour was used for modeling and analysis. This means that 30% of all persontrips<br />
made using motorized modes (transit or automobile) would be by transit, and 70% by<br />
automobile. While a 30% transit modal split represents a real challenge—an increment from 2005<br />
value of 23%—it can be achieved if the required service strategies, transit priority measures,<br />
2 Travel patterns in <strong>Ottawa</strong> are highly dispersed and difficult to summarize comprehensively. One way to<br />
examine how travel will change over time is through the use of screenlines. A screenline is an imaginary<br />
line drawn across major transportation facilities in a corridor, typically following a feature such as a river<br />
or railway that has limited crossing points.<br />
3 A cordon is a screenline or group of screenlines that contains an area of interest. This analysis used<br />
cordons to examine all travel to and from the Central Area, to and from the Inner Area, and to and from<br />
lands on either side of the Greenbelt.<br />
TRANSPORTATION MASTER PLAN Page 14<br />
NOVEMBER 2008
apid transit lines and a variety of essential supporting actions are implemented in a<br />
comprehensive and coordinated fashion.<br />
Figure 2.9 compares the 2005 city-wide modal splits and person-trip volumes for transit and<br />
automobile use to projections for 2031. It shows that while peak hour transit person-trips will<br />
increase by 76%, automobile person-trips will only increase by 24%.<br />
Figure 2.9 – Projected Transit and Automobile Travel Demand — City-Wide<br />
(Morning peak hour)<br />
Modal Split<br />
Mode<br />
(Proportion of person-trips<br />
Person-Trips<br />
by motorized modes)<br />
2005 2031 2005 2031 Change<br />
Transit 23% 30% 44,500 78,300 +76% (33,800)<br />
Automobile 77% 70% 146,600 182,300 +24% (35,700)<br />
Total<br />
motorized trips<br />
100% 100% 191,100 260,600 +36% (69,500)<br />
2005 2031<br />
Morning peak hour person-trips<br />
200,000<br />
150,000<br />
100,000<br />
50,000<br />
-<br />
Transit<br />
Automobile<br />
* Include all travel originating or destine to <strong>Ottawa</strong> (i.e. excludes travel originating and destine to Gatineau/MRC<br />
Figure 2.10 illustrates the implications of these overall demands for individual screenlines,<br />
comparing simulated 2005 person-trip volumes to those projected for 2031, and leads to the<br />
following observations:<br />
<br />
<br />
<br />
Automobile and transit travel across the Greenbelt will grow 40% above today’s levels. This<br />
growth is less than the forecast population change (+68%) in the urban centres outside the<br />
Greenbelt, because of the employment growth and greater containment of work-related travel<br />
within those areas<br />
Travel demand across the Inner Area Cordon will grow about 31% above today’s levels, due<br />
to an increased concentration of jobs within the Inner Area<br />
Person-trips by automobile are projected to increase at every screenline except Green’s<br />
Creek, despite the much larger share of travel that will be carried by transit<br />
TRANSPORTATION MASTER PLAN Page 15<br />
NOVEMBER 2008
Figure 2.10 – Projected Transit and Automobile Travel Demand – Screenlines<br />
(Morning peak hour, peak direction, person-trips by motorized modes)<br />
Transit Auto Total<br />
Screenline*<br />
2005 2031 Growth 2005 2031 Growth 2005 2031 Growth<br />
Rideau River 13,150 21,300 62% 19,100 19,850 4% 32,250 41,150 28%<br />
CPR 9,200 17,500 90% 16,000 16,700 4% 25,200 34,200 44%<br />
Total: Inner Area<br />
Cordon<br />
22,350 38,800 74% 35,100 36,550 4% 57,450 75,350 31%<br />
Green’s Creek 6,000 8,400 40% 11,300 11,100 -2% 17,300 19,500 13%<br />
417 East 0 0 0% 3,600 4,900 36% 3,600 4,900 36%<br />
Leitrim 200 2,300 1050% 4,200 6,800 62% 4,400 9,100 107%<br />
Fallowfield 1,900 4,800 153% 9,400 11,600 23% 11,300 16,400 45%<br />
Eagleson 3,100 6,600 113% 9,900 13,100 32% 13,000 19,700 52%<br />
Total: Greenbelt<br />
Cordon<br />
11,200 22,100 97% 38,400 47,500 24% 49,600 69,600 40%<br />
Interprovincial 5,100 11,800 132% 14,200 15,800 11% 19,300 27,600 43%<br />
CNR West 2,900 5,900 104% 10,900 12,100 11% 13,800 18,000 30%<br />
CNR East 3,300 6,000 82% 9,000 10,100 12% 12,300 16,100 31%<br />
Western Parkway 5,200 9,800 88% 18,200 19,000 4% 23,400 28,800 23%<br />
Terry Fox 400 2,400 500% 5,600 9,300 66% 6,000 11,700 95%<br />
Rideau South 900 2,700 200% 7,100 9,200 30% 8,000 11,900 49%<br />
Bilberry Creek 3,900 5,100 31% 6,800 7,800 15% 10,700 12,900 21%<br />
Smyth / Hydro 4,300 5,700 33% 3,600 4,600 28% 7,900 10,300 30%<br />
Morning Peak hour person-trips<br />
25,000<br />
20,000<br />
15,000<br />
10,000<br />
5,000<br />
-<br />
Rideau River<br />
CPR<br />
Green's Creek<br />
Transit<br />
417 East<br />
Leitrim<br />
Fallowfield<br />
Eagleson<br />
Interprovincial<br />
CNR West<br />
CNR East<br />
Western Parkway<br />
Terry Fox<br />
Rideau South<br />
Bilberry Creek<br />
Smyth/Hydro<br />
* All 2005 data shown correspond to model simulations unless otherwise noted<br />
Automobile<br />
2005 2031<br />
Rideau River<br />
CPR<br />
Green's Creek<br />
417 East<br />
Leitrim<br />
Fallowfield<br />
Eagleson<br />
Interprovincial<br />
CNR West<br />
CNR East<br />
Western Parkway<br />
Terry Fox<br />
Rideau South<br />
Bilberry Creek<br />
Smyth/Hydro<br />
Figure 2.11 indicates the transit modal split increase across key screenlines from 2005 to 2031,<br />
based on the projections shown in Figure 2.10. It is notable that transit will be required to carry<br />
51% of motorized person-trips to and from <strong>Ottawa</strong>’s Inner Urban Area (up from 39% in 2005),<br />
and 32% of trips across the Greenbelt (up from 23% in 2005) during the morning peak hour, in<br />
the peak direction. The 2031 screenline values generally exceed the 30% city-wide objective<br />
because screenlines tend to capture radial travel demands—trips from outlying areas to the urban<br />
TRANSPORTATION MASTER PLAN Page 16<br />
NOVEMBER 2008
core —and a higher quality of transit can be provided to these trips than to those moving<br />
peripherally from suburb to suburb.<br />
Figure 2.11 – Projected Transit Modal Splits — Screenlines<br />
(Proportion of travel by motorized modes, morning peak hour, peak direction)<br />
Screenline*<br />
Transit Modal Split<br />
2005 2031<br />
Rideau River 41% 52%<br />
CPR 37% 51%<br />
Total: Inner Area Cordon 39% 51%<br />
Green’s Creek 35% 43%<br />
417 East 0% 0%<br />
Leitrim 5% 25%<br />
Fallowfield 17% 29%<br />
Eagleson 24% 34%<br />
Total: Greenbelt Cordon 23% 32%<br />
Interprovincial 26% 43%<br />
CNR West 21% 33%<br />
CNR East 27% 37%<br />
Western Parkway 22% 34%<br />
Terry Fox 7% 21%<br />
Rideau South 11 23%<br />
Bilberry Creek 35% 40%<br />
Smyth / Hydro 54% 55%<br />
60%<br />
50%<br />
40%<br />
30%<br />
20%<br />
10%<br />
0%<br />
2005 2031<br />
Rideau River<br />
CPR<br />
Green's Creek<br />
417 East<br />
Leitrim<br />
Fallowfield<br />
Eagleson<br />
Interprovincial<br />
CNR West<br />
CNR East<br />
Western Parkway<br />
Terry Fox<br />
Rideau South<br />
Bilberry Creek<br />
Smyth/Hydro<br />
* All 2005 data shown correspond to model simulations unless otherwise noted<br />
TRANSPORTATION MASTER PLAN Page 17<br />
NOVEMBER 2008
Forecasts of future morning peak hour automobile occupancies were applied to convert<br />
automobile person-trips to estimated automobile volumes across key screenlines. Projected<br />
automobile occupancies varied but averaged 1.20 persons per vehicle in 2031. This value is less<br />
than 1995 observed average of 1.25 persons per vehicle for the morning peak hour. This decrease<br />
in automobile occupancy levels runs counter to observed trends that have seen average peak hour<br />
auto occupancies decline from a typical 1960s value of 1.4 persons per vehicle, and represents an<br />
implied objective for the City of <strong>Ottawa</strong>. If the average auto occupancy falls below 1.20 persons<br />
per vehicle in 2031, then traffic volumes may exceed those projected in this plan—leading to<br />
greater congestion, delay and air pollution, and requiring more road infrastructure if quality of<br />
service objectives are to be met.<br />
2.4.2 Walking and Cycling<br />
Objectives have also been set for the roles of walking and cycling in serving future travel<br />
demands, in response the <strong>Ottawa</strong> 20/20 principles and the <strong>Transportation</strong> Vision discussed in<br />
Chapters 1 and 3 of this plan. These objectives are described in terms of morning peak hour<br />
“modal share”. They are summarized in the following points and illustrated in Figure 2.12.<br />
• The walking modal share will increase from 9.3% in 2005 to 10% in 2031. This reflects<br />
the positive impact of the Official <strong>Plan</strong>’s emphasis on compact, mixed-use development,<br />
which will be countered by significant growth in longer trips that cannot reasonably be made<br />
on foot.<br />
• The cycling modal share will increase from 1.7% in 2005 to 3% in 2031. This also<br />
reflects the effects of compact, mixed-use development, as well as the effects of continued<br />
improvement in the quality and quantity of on-road cycling facilities.<br />
These objectives are city-wide modal shares, and are very difficult to monitor. The only way to<br />
do so accurately is through expensive origin-destination surveys that are conducted every 10<br />
years or so (the most recent one occurred in 2005). So, while progress toward these objectives<br />
cannot be accurately monitored on a frequent basis, the City will monitor other indicators of<br />
walking and cycling activity, as described in Section 3.9.<br />
It is also important to note that, because origin-destination surveys are typically done during the<br />
fall season, the walking and cycling modal share objectives represent fall conditions. Summer<br />
modal shares will be higher, and winter modal shares will be lower.<br />
While the City-wide non-motorized share of travel is forecast to grow by only one percent by<br />
2031, targets were kept as 10% for walking and 3% for cycling. Implementation of the <strong>Ottawa</strong><br />
Cycling <strong>Plan</strong> and the <strong>Ottawa</strong> Pedestrian <strong>Plan</strong> (when approved), together with the Official <strong>Plan</strong><br />
direction towards increased intensification and density targets, make for a very supportive<br />
environment for maintaining these targeted rates for walking and cycling use.<br />
TRANSPORTATION MASTER PLAN Page 18<br />
NOVEMBER 2008
Figure 2.12 – Projected Walking and Cycling Demand — City-Wide (Morning peak hour)<br />
Mode<br />
Modal Share<br />
(Proportion of all person-trips)<br />
Person-Trips<br />
2005 2031 2005 2031 Change<br />
Walking 9.3% 9.1% 20,100 26,800 +33%<br />
Cycling 1.7% 2.9% 3,600 8,600 +139%<br />
2005 2031<br />
Morning peak hour person-trips<br />
30,000<br />
20,000<br />
10,000<br />
-<br />
Walking<br />
Cycling<br />
2.4.3 Modal Share versus Modal Split<br />
In the discussion about City’s transit objective it is important to note the difference between<br />
“modal share” and “modal split”. Modal share is the percentage of person-trips made by one<br />
travel mode, relative to the total number of person-trips made by all modes, whereas modal split<br />
is defined as the percentage of person-trips made by either transit or automobile, relative to the<br />
total number of person-trips made by motorized modes (i.e. transit and automobile, combined).<br />
As such, modal share relates to the whole universe of available travel modes and modal split<br />
relates to the motorized trips only. Figure 2.13 shows the estimated 2005 and 2031 city-wide<br />
person-trip volumes, modal shares and modal split.<br />
TRANSPORTATION MASTER PLAN Page 19<br />
NOVEMBER 2008
Figure 2.13 – Projected Travel Demand: All Modes — City-Wide (Morning peak hour)<br />
Travel Person-Trips Modal Share Modal Split<br />
Mode 2005 2031 2005 2031 2005 2031<br />
Walking 20,100 26,800 9.3% 9.1% -- --<br />
Cycling 3,600 8,600 1.7% 2.9% -- --<br />
Transit 44,500 78,300 21.0% 26.4% 23% 30%<br />
Automobile 146,600 182,300 68.0% 61.6% 77% 70%<br />
TOTAL –<br />
All trips<br />
214,000 296,000 100% 100% 100% 100%<br />
2005 2031<br />
Morning peak hour person-trips<br />
200,000<br />
150,000<br />
100,000<br />
50,000<br />
-<br />
Walking Cycling Transit Automobile<br />
* All 2005 data shown correspond to model simulations unless otherwise noted<br />
TRANSPORTATION MASTER PLAN Page 20<br />
NOVEMBER 2008
Chapter 3 – Strategic Directions<br />
In Section 3.1, this chapter presents a <strong>Transportation</strong> Vision for <strong>Ottawa</strong> that guides the remainder<br />
of this plan. Sections 3.2 through 3.9 discuss eight key strategic directions that are essential to<br />
achieving that vision:<br />
• Creating supportive land use – Shaping development to support transportation goals<br />
• Managing transportation demand – Influencing why, when, where and how people travel<br />
• Managing the transportation system – Maximizing the efficiency of infrastructure and<br />
services<br />
• Enhancing safety and security – Reducing the personal risks to individuals during travel<br />
• Protecting the environment – Reducing the impacts of transportation facilities and activities<br />
• Managing and maintaining assets – Minimizing life-cycle costs while providing desired<br />
levels of service<br />
• Funding implementation – Enhancing the City’s ability to pay the costs of this plan<br />
• Measuring performance – Monitoring progress toward objectives<br />
These strategic directions are themes embedded in Chapters 4 through 6, which are the core of<br />
this plan. Sections 3.2 through 3.9 include cross-cutting policies and actions that are not found<br />
elsewhere in this plan, and identify key linkages to later chapters.<br />
3.1 <strong>Ottawa</strong>’s <strong>Transportation</strong> Vision<br />
During preparation of the City’s 2003 <strong>Transportation</strong> <strong>Master</strong> <strong>Plan</strong>, a <strong>Transportation</strong> Vision was<br />
developed to express how <strong>Ottawa</strong>’s transportation system in 2021 might benefit residents. That<br />
vision has been enhanced through public consultation during the <strong>Transportation</strong> <strong>Master</strong> <strong>Plan</strong><br />
update process. The new <strong>Transportation</strong> Vision continues to recognize that transportation is a<br />
means to an end — namely, the protection and improvement of our quality of life. It is intended<br />
to be a lasting expression of critical directions and outcomes — what we wish to achieve through<br />
transportation, and why. The remainder of the <strong>Transportation</strong> <strong>Master</strong> <strong>Plan</strong> details the how, where,<br />
when and who of specific projects or services.<br />
The <strong>Transportation</strong> Vision includes a summary statement plus 12 elements, each of which<br />
includes several principles that are intended to guide the City’s future actions. Figure 3.1 presents<br />
a summary of the vision, and the pages that follow provide additional discussion of each element<br />
and its principles.<br />
TRANSPORTATION MASTER PLAN Page 21<br />
NOVEMBER 2008
Figure 3.1 – <strong>Transportation</strong> Vision: Summary and Elements<br />
Summary:<br />
IN 2031, OTTAWA’S TRANSPORTATION SYSTEM WILL ENHANCE OUR QUALITY OF LIFE<br />
BY SUPPORTING SOCIAL, ENVIRONMENTAL AND ECONOMIC SUSTAINABILITY<br />
IN AN ACCOUNTABLE AND RESPONSIVE MANNER.<br />
Elements:<br />
Support for social, environmental<br />
and economic sustainability<br />
Elements:<br />
Accountability and responsiveness<br />
1. Reduce automobile dependence<br />
2. Meet mobility needs<br />
3. Integrate transportation and land use<br />
4. Protect public health and safety<br />
5. Protect the environment<br />
6. Enhance the economy<br />
7. Deliver cost-effective services<br />
8. Measure performance<br />
9. Protect the public interest<br />
10. Provide adequate and equitable funding<br />
11. Cooperate with other governments<br />
12. Lead by example<br />
Element 1:<br />
Principles:<br />
Reduce automobile dependence<br />
a) Give priority to public transit in meeting future growth in travel demand<br />
b) Make walking and cycling more attractive than driving for short trips<br />
c) Motivate sustainable travel choices through education, promotion,<br />
incentives and disincentives<br />
d) Encourage shorter trips and travel alternatives like telework<br />
In 2031, the ability of residents to access essential opportunities will not depend on their<br />
ownership of a car. Urban residents will be able to meet daily needs by walking, cycling, taking<br />
transit or ridesharing. Rural residents will continue to rely on cars, but will have other choices.<br />
Development of more compact communities will bring homes and destinations closer together<br />
and make walking and cycling more practical. Ridesharing will be more convenient and<br />
effectively promoted. Transit, however, will remain the most affordable, accessible and all-season<br />
travel option for area residents. To this end, the City will undertake a range of measures including<br />
new rapid transit and transit priority facilities, fleet expansion, improved access to transit for<br />
pedestrians and cyclists, promotional activities and provision of user incentives. New<br />
developments and redevelopments will be carefully planned and designed to provide maximum<br />
support to transit service and transit users.<br />
TRANSPORTATION MASTER PLAN Page 22<br />
NOVEMBER 2008
Element 2:<br />
Principles:<br />
Meet mobility needs<br />
a) Provide a continuous, integrated system of multimodal facilities and<br />
services<br />
b) Aim to provide an acceptable standard of service for each mode of travel<br />
c) Give priority to public transit, walking and cycling over cars when<br />
conflicts arise<br />
d) Provide barrier free transportation facilities and services<br />
Reducing travel delays to people and goods will remain a key goal in 2031. Travel by bus, light<br />
rail and car will be reasonably direct and fast, with quality connections to walking and cycling<br />
networks. Goods will move efficiently. Persons with disabilities will not encounter barriers that<br />
restrict access to key destinations. To achieve these goals, the City will have provided new<br />
infrastructure and services that encourage desired changes in behaviour and prevent unacceptable<br />
levels of congestion and delay, neighbourhood traffic infiltration and air pollution. Transit system<br />
capacity will have increased substantially to keep pace with a rising population and growth in<br />
transit modal split. Despite a reduction the automobile’s modal share, road capacity will also have<br />
increased in an effort to preserve minimum acceptable service levels for traffic.<br />
Element 3:<br />
Principles:<br />
Integrate transportation and land use<br />
a) Build walkable communities<br />
b) Provide rapid transit and other quality transit services to community<br />
cores and employment areas<br />
c) Foster transit-oriented development in transit nodes and corridors<br />
d) Support intensification where transit, walking and cycling can be made<br />
most attractive<br />
e) Foster a vibrant downtown by improving transit, walking and cycling<br />
access<br />
f) Recognize the distinct transportation needs of rural communities<br />
By 2031, walkability will be the firmly established foundation of urban sustainability, with<br />
benefits ranging from health to equity, environment and the economy. Community design will<br />
revolve around pedestrian access to transit, especially rapid transit services that offer fast and<br />
reliable links between communities and employment centres. Transit will be supported through a<br />
consistent approach to development location, mix, density and site design that makes<br />
intensification a benefit for quality of life, rather than a burden. While transportation facilities<br />
such as sidewalks, pathways, rapid transit lines and roads will enable travel, they will also serve<br />
as public spaces and enliven communities through design that is sensitive to their surroundings.<br />
Particularly in rural areas, roads will play a balanced role between mobility provider and<br />
TRANSPORTATION MASTER PLAN Page 23<br />
NOVEMBER 2008
community asset.<br />
Element 4:<br />
Principles:<br />
Protect public health and safety<br />
a) Give priority to safety and security when planning, designing and<br />
operating transportation systems<br />
b) Promote safe walking, cycling and driving through education,<br />
engineering and enforcement<br />
c) Support active living by promoting walking, cycling and transit for daily<br />
travel<br />
d) Minimize the impacts of truck and automobile traffic on sensitive<br />
communities<br />
e) Minimize air pollution from transportation sources<br />
The people of <strong>Ottawa</strong> will enjoy sidewalks, pathways, roads and transit facilities that are planned,<br />
built and maintained to safe standards, and with an eye to providing users with security of person.<br />
<strong>Transportation</strong> choices that can improve health, like walking and cycling, will be encouraged.<br />
The City will also educate people about safe walking, cycling and driving behaviours for their<br />
own protection, and for that of their families and others. Residential areas will also be protected<br />
from the undesirable impacts of transportation activity — congestion, noise, pollution and poor<br />
driver behaviour. People want clean air to breathe, and the transportation sector’s contribution to<br />
air pollution will be minimized.<br />
Element 5:<br />
Principles:<br />
Protect the environment<br />
a) Minimize the need for new infrastructure<br />
b) Minimize transportation energy use, greenhouse gas emissions and other<br />
impacts on air, water and land<br />
c) Maximize greening within transportation rights of way<br />
The health of our natural environment — local, regional and global — will grow even more<br />
important to the people of <strong>Ottawa</strong>. Because the transportation system affects nature in many<br />
ways, awareness of environmental issues will prevail throughout planning, design, construction<br />
and operations. While the most effective way to minimize the transportation system’s<br />
environmental impacts is to reduce the scope and scale of that system, the transportation activity<br />
that does take place will be closely managed from an environmental perspective. Trees and other<br />
forms of vegetation will play a critical role, providing shade and wind protection for users, and<br />
improving aesthetics and air quality. Greening will occur wherever conditions allow sustainable<br />
plantings.<br />
TRANSPORTATION MASTER PLAN Page 24<br />
NOVEMBER 2008
Element 6:<br />
Principles:<br />
Enhance the economy<br />
a) Maximize access to businesses and institutions by employees, clients and<br />
visitors<br />
b) Support efficient freight movement to, from and within the city<br />
<strong>Transportation</strong> will continue to play a significant role in <strong>Ottawa</strong>’s economic development.<br />
Businesses and institutions that offer employment, educational, social and recreational<br />
opportunities will require effective and efficient movement for people and goods. It will also be<br />
important that out-of-town visitors and tourists can move around <strong>Ottawa</strong> with ease, particularly to<br />
and from major intercity travel hubs.<br />
Element 7:<br />
Principles:<br />
Deliver cost-effective services<br />
a) Make the best possible use of existing facilities before adding new<br />
infrastructure<br />
b) Integrate the consideration of life-cycle capital and operating costs into<br />
decision-making processes<br />
c) Support appropriate roles for the private sector in delivering<br />
infrastructure and services<br />
In 2031, <strong>Ottawa</strong>’s transportation services will return the greatest possible value to taxpayers. The<br />
City will get the most out of existing road and transit systems, maximizing efficiency through a<br />
range of transportation system management measures and maximizing reliability through<br />
effective maintenance, capital reinvestment and renewal strategies. The City will consider the<br />
long-term impacts of spending decisions, such as trade-offs between capital and operating costs.<br />
It will also explore the abilities of private sector partners and service providers to reduce costs,<br />
while protecting the public interest.<br />
Element 8:<br />
Principles:<br />
Measure performance<br />
a) Identify transportation performance objectives and indicators<br />
b) Regularly measure and evaluate performance<br />
c) Integrate performance evaluation results by adapting transportation<br />
plans and strategies<br />
By setting performance objectives and measuring key indicators, the City will be able to<br />
understand how it is progressing toward goals for transportation services, facilities and<br />
behaviours. By monitoring the transportation system closely, the City will be able to identify<br />
deficiencies, analyze alternatives and modify priorities to allocate resources where they do the<br />
most good.<br />
TRANSPORTATION MASTER PLAN Page 25<br />
NOVEMBER 2008
Element 9:<br />
Principles:<br />
Protect the public interest<br />
a) Encourage public input and informed decision making by reporting on<br />
transportation activities and results and providing opportunities for<br />
dialogue<br />
b) Consult with the public when planning budgets, programs and projects<br />
The City will succeed in reaching its transportation goals by creating a role for the public as<br />
partners, and not just clients. Joining with residents to create change, rather than subjecting them<br />
to it, will allow the City to both inform and learn. Clear and continuous communication with<br />
stakeholders – the City providing facts, figures and questions, and the public responding with<br />
desires, opinions and suggestions – will enhance the City’s understanding of needs and concerns.<br />
In this way, transportation programs will be continually rebalanced to meet public expectations.<br />
Element 10:<br />
Principles:<br />
Provide adequate and equitable funding<br />
a) Seek and/or establish funding sources that are stable and predictable<br />
b) Strengthen the "user pay" component of transportation system funding<br />
By 2031, the City will have overcome today’s funding challenges. Internal or external funding<br />
sources will ensure the City’s ability to confidently plan and deliver facilities and services to meet<br />
its long-term needs. The City will lessen its dependence on property taxes to pay for<br />
transportation facilities and services, and will get more of its transportation funding directly from<br />
users. This application of “user pay” principles will also allow the City to more effectively<br />
influence individual travel choices by managing the price of transportation.<br />
Element 11:<br />
Principles:<br />
Cooperate with other governments<br />
a) Liaise with provincial and federal governments to align plans and<br />
policies, and to attract financial, legislative and regulatory assistance<br />
b) Work with the National Capital Commission, Ontario Ministry of<br />
<strong>Transportation</strong>, Ministère des transports du Québec, City of Gatineau<br />
and other adjacent municipalities to develop balanced solutions<br />
The federal government, provincial governments of Ontario and Quebec, City of Gatineau and<br />
neighbouring Ontario municipalities are all crucial players in the development of a connected and<br />
integrated transportation system. The City will depend on their active involvement to develop and<br />
implement lasting transportation solutions, with actions ranging from policy-setting and<br />
legislation to funding partnerships and service delivery. Clear lines of communication will enable<br />
all partners to overcome shared challenges and grasp opportunities.<br />
TRANSPORTATION MASTER PLAN Page 26<br />
NOVEMBER 2008
Element 12:<br />
Principles:<br />
Lead by example<br />
a) Minimize energy use and environmental impacts of City transportation<br />
facilities, fleets, operations and services<br />
b) Foster walking, cycling and transit use by employees and visitors to City<br />
facilities<br />
c) Forge constructive partnerships with the private sector, institutions and<br />
community organizations<br />
The City will succeed, in part, through a tireless approach to leadership on key issues. It will be a<br />
role model for other governments and employers, demonstrating commitment and innovation that<br />
yield reproducible results in terms of reducing environmental impacts and influencing the travel<br />
choices of staff and visitors. Another element of the City’s leadership will be the development of<br />
close relationships with key partners. The private sector has an increasingly meaningful role to<br />
play in improving transportation choices for employees and customers, and community groups<br />
will also be involved in defining key issues and finding solutions. Each of these partners offers<br />
important knowledge, motivation and energy, and the City will rely on them to leverage its efforts<br />
and reach greater numbers of people more efficiently.<br />
3.2 Creating Supportive Land Use<br />
The Official <strong>Plan</strong> recognizes that land use and transportation systems strongly influence each<br />
other, and emphasizes the development of compact, integrated land uses to encourage a shift from<br />
automobile travel to walking, cycling and public transit use. In particular, achievement of a 30%<br />
peak hour transit modal split by 2031 will require careful coordination of land use and<br />
transportation. Transit-supportive land use strategies can be applied to the entire city, component<br />
communities, neighbourhoods and individual sites.<br />
Mixed-use development nodes are a key element of transit-supportive communities, particularly<br />
when complemented by higher densities, quality transit service and well connected walking and<br />
cycling networks. The City’s Guidelines for Transit Oriented Development provide direction on<br />
key design considerations that should be addressed in all developments within proximity to rapid<br />
transit stations.<br />
The City’s detailed land use policies are contained in sections of the Official <strong>Plan</strong> that deal with<br />
urban land use designations, rural villages and design criteria for new developments. Key aspects<br />
of those policies are summarized below.<br />
The City will:<br />
1. Encourage compact, mixed-use development at strategic locations by:<br />
a) Designating and providing policies for Mixed Use Centres, Mainstreets and the<br />
Central Area so residents can satisfy many daily needs locally.<br />
TRANSPORTATION MASTER PLAN Page 27<br />
NOVEMBER 2008
) Focusing rural development on Villages, where community services such as schools,<br />
shopping and libraries may be conveniently situated.<br />
2. Ensure that Community Design <strong>Plan</strong>s for Villages and Urban communities:<br />
a) Indicate walking and cycling requirements including linkages to greenway systems,<br />
neighbouring communities and transit facilities (if appropriate).<br />
b) Indicate transit routes, if appropriate.<br />
c) Incorporate supporting strategies such as streetscape improvement and traffic<br />
management measures.<br />
d) Ensure that developments on transit routes face the street and provide frequent<br />
pedestrian linkages into the development.<br />
3. Review development proposals to ensure that:<br />
a) Sidewalks are provided as required by Chapter 4 of this plan.<br />
b) Walking and cycling links from new developments to public areas are clearly<br />
defined.<br />
c) Individual developments include on-site bicycle parking as required by the City’s<br />
zoning by-law, as well as shower and change facilities and preferential carpool<br />
parking as warranted.<br />
d) The road network in developing communities offers direct and convenient walking<br />
and cycling routes, and enables efficient transit routes that bring all dwellings<br />
within 400 metres walking distance of a bus stop.<br />
e) Reports required by the City’s <strong>Transportation</strong> Impact Assessment Guidelines address<br />
pedestrian, cycling and transit requirements in addition to roads and parking.<br />
f) Development at transit stations meets requirements including:<br />
i) Reduced parking requirements within 600 metres of a rapid transit station.<br />
ii) Provision for minimum and maximum parking rates for main employment,<br />
institutional and medium/higher density residential uses.<br />
iii) Highest densities nearest to the station.<br />
iv) High-quality access to and between buildings, and through parking lots.<br />
v) No large parking areas between the street and building.<br />
vi) Clear and direct access to transit stops and stations.<br />
4. Encourage compact development by reducing the land area used for parking through:<br />
a) Opportunities for shared parking among land uses as provided for in the City’s<br />
Zoning By-law<br />
b) Opportunities for partnerships with the private sector to provide parking structures<br />
rather than surface parking lots.<br />
TRANSPORTATION MASTER PLAN Page 28<br />
NOVEMBER 2008
3.3 Managing <strong>Transportation</strong> Demand<br />
<strong>Transportation</strong> demand management (TDM) initiatives encourage individuals to reduce the<br />
number of trips they make, to travel more often by non-driving alternatives, to travel outside peak<br />
periods, and to reduce the length of their trips. A key goal of TDM is to minimize peak hour<br />
automobile travel and reduce the need for new or wider roads. TDM measures make alternatives<br />
to driving more attractive, build a positive public attitude towards those alternatives, and provide<br />
information and incentives that encourage responsible travel behaviours. An effective TDM<br />
program will help reduce the automobile dependence of <strong>Ottawa</strong> residents, preserve individual<br />
access to opportunity, fight congestion and pollution and maintain community livability.<br />
Through its TravelWise/SageVirage program, the City will implement comprehensive TDM<br />
efforts that involve partnerships with other governments, the private sector, public institutions,<br />
non-governmental organizations and community groups. City efforts will be complemented<br />
through advances in information technology that enable home-based work or learning and<br />
flexible employment arrangements such as telework.<br />
This section creates a policy framework for the City’s TDM program, as a complement to TDM<br />
initiatives that will make walking, cycling, transit and ridesharing more competitive, as identified<br />
in Chapter 4 – Active <strong>Transportation</strong>, Chapter 5 – Public Transit, Section 6.8 – Ridesharing, and<br />
Section 6.11 – Parking.<br />
The City will:<br />
Leadership initiatives<br />
1. Work with the Ontario Ministry of <strong>Transportation</strong>, the City of Gatineau, the Société de<br />
transport de l’Outaouais, the Ministère des transports du Québec, the National Capital<br />
Commission and other federal departments and agencies to implement and coordinate<br />
TDM initiatives across the National Capital Region.<br />
2. Integrate TDM initiatives with the City’s public health, recreation and environmental<br />
programs through the coordinated delivery of services such as cycling skills training,<br />
active lifestyle promotion, and public education on commuting options, active<br />
transportation, air quality, climate change and energy conservation.<br />
3. Establish a TravelWise Steering Committee with interdepartmental representation to<br />
help guide the City’s TDM efforts.<br />
4. Develop a comprehensive TDM strategy for City Council approval in 2009 that will<br />
establish long-term objectives, priority short-term actions and a performance<br />
measurement framework.<br />
5. Regularly survey City staff to identify opportunities for reducing automobile<br />
commuting by employees, and to measure progress.<br />
6. Implement a communications program to promote alternatives to driving for<br />
commuting and business travel for City employees.<br />
TRANSPORTATION MASTER PLAN Page 29<br />
NOVEMBER 2008
7. Review employee parking policies and practices to identify opportunities for changes to<br />
improve equity and make alternatives to driving more competitive.<br />
8. Develop guidelines for City facilities to make alternatives to driving more attractive for<br />
employees, clients and visitors.<br />
Outreach initiatives<br />
9. Work with employers and post-secondary institutions to reduce car commuting, deliver<br />
products and services such as the Ecopass and transportation fairs, and support events<br />
such as the Commuter Challenge and Rideshare Week.<br />
10. Work to reduce the number of children being driven to school by supporting Active and<br />
Safe Routes to School programs, events such as International Walk to School Day, and<br />
the delivery of cycling skills training courses.<br />
11. Conduct a pilot test of individualized household marketing to determine the<br />
applicability of results from other North American communities, and to assess the<br />
potential of an expanded program.<br />
12. Work with community organizations to minimize automobile use through measures<br />
such as a neighbourhood-based TDM toolkit and the provision of assistance to small<br />
scale TDM-related projects.<br />
13. Work with festival organizers to improve travel options for event attendees by<br />
enhancing on-site facilities such as preferential bicycle or carpool parking, and offering<br />
other services, incentives and information to support walking, cycling, transit use and<br />
ridesharing.<br />
14. Work with tourism partners to improve travel options for visitors to <strong>Ottawa</strong> by offering<br />
services, incentives and information to support walking, cycling and transit use.<br />
15. Support private-sector carsharing services by promoting the concept of carsharing and<br />
considering a role in establishing visible, convenient parking spaces for carshare<br />
vehicles.<br />
16. Regularly survey City residents to better understand commuter attitudes and<br />
behaviours, and to identify opportunities for reducing automobile commuting.<br />
TRANSPORTATION MASTER PLAN Page 30<br />
NOVEMBER 2008
3.4 Managing the <strong>Transportation</strong> System<br />
As the demand on road and transit facilities approaches their capacity, careful action is required<br />
to prevent unacceptable and often unpredictable impacts. <strong>Transportation</strong> system management<br />
(TSM) strategies optimize the efficiency and people-moving capacity of transportation facilities,<br />
thereby reducing the need for new infrastructure. They can reduce delay and emissions, reduce<br />
operating costs, and improve safety and community liveability. They also support modal shift<br />
objectives by preserving the reliability of transit service, improving safety and convenience for<br />
pedestrians and cyclists, and reducing delay for carpools. All of these outcomes are especially<br />
vital given the current demands on road and transit systems, projected increases in those<br />
demands, and the financial pressures that face the City.<br />
TSM strategies can be applied to an entire transportation system, major corridors or individual<br />
locations. They include measures like:<br />
• traffic signs, signals, pavement markings and regulations<br />
• computerized traffic signal coordination<br />
• video monitoring of road and transit operations<br />
• incident management tools to deal with weather conditions, collisions or vehicle breakdowns<br />
• traveller information systems using variable message signs or wireless communications<br />
• transit vehicle tracking using on-board computers and global positioning systems (GPS)<br />
The following policies provide an overall framework for future TSM strategies including those<br />
detailed in Section 5.2.3 - Transit Priority, Section 6.5 – Road Safety, Section 6.6 – Road<br />
Corridor Optimization, and Section 6.7 – Area Traffic Management.<br />
The City will:<br />
1. Endeavour to maintain a maximum 90% volume-to-capacity ratio for mixed traffic at<br />
signalized intersections during weekday peak hours, where feasible, except in the<br />
Central Area where a 100% ratio will be acceptable. Supporting initiatives will give due<br />
consideration to City objectives for road safety and improvements to conditions for<br />
walking, cycling and transit.<br />
2. Continue to operate a traffic signal control system that, together with video monitoring<br />
of traffic conditions, enables the optimization of traffic signal timing to enhance safety<br />
and reduce delay, fuel consumption and emissions.<br />
3. Prepare and implement an Incident Management Strategy in coordination with the<br />
Ontario Ministry of <strong>Transportation</strong> to advance the provision of incident detection and<br />
traveller advisory systems, traffic signal optimization and coordination strategies, and<br />
rapid emergency response and removal of disabled vehicles. This strategy will also<br />
consider the need for a new centralized traffic control and incident management centre.<br />
TRANSPORTATION MASTER PLAN Page 31<br />
NOVEMBER 2008
4. Prepare and implement a multimodal Traveller Information Strategy that optimizes the<br />
availability to individuals of real-time information on road and transit conditions, and<br />
guidance to optimize decision-making.<br />
3.5 Enhancing Safety and Security<br />
Safety and security are principal objectives for the City. The use of motor vehicles poses risks to<br />
both users and non-users that can be mitigated through better education, engineering and<br />
enforcement and by shifting demand to other modes. Facilities and services for walking, cycling<br />
and transit can also be made safer and more secure for users, and outreach to travelers can help<br />
them to reduce risks through their own behaviour.<br />
As mentioned in the preceding section, safety for all road users will be one of the considerations<br />
integrated into TSM initiatives. More specific strategies to improve safety and security are<br />
detailed in Chapter 4 – Active <strong>Transportation</strong>, Section 5.2.5 - Transit Safety and Security, Section<br />
6.5 – Road Safety, Section 6.6 – Road Corridor Optimization, and Section 6.7 – Area Traffic<br />
Management.<br />
3.6 Minimizing Environmental Effects<br />
<strong>Ottawa</strong>’s transportation infrastructure and operations directly influence the quality of our air and<br />
water, the integrity of our land, the vitality of our flora and fauna, and the depletion of our<br />
resources. Minimizing the environmental effects of growth will be vital to the future quality of<br />
life for <strong>Ottawa</strong>’s residents. As noted in Chapter 1 of this plan, the City’s overall growth<br />
management strategy included an Environmental Strategy and a component Air Quality and<br />
Climate Change Management <strong>Plan</strong>. Those documents provide comprehensive direction on many<br />
city-wide policies and programs, including some related to transportation. The following<br />
paragraphs discuss related areas of endeavour, some of which are also discussed elsewhere in this<br />
plan. It should also be noted that the City will conduct comprehensive environmental assessment<br />
processes as it implements the infrastructure requirements of this plan (see Section 8.4 for more<br />
detail).<br />
Air quality and climate change. The Air Quality and Climate Change Management <strong>Plan</strong><br />
recommends ways to reduce greenhouse gases and other air emissions from transportation, most<br />
importantly by minimizing private motor vehicle use. Even though population and traffic<br />
volumes may grow, a reduction in vehicle-kilometres traveled per person is achievable; together<br />
with advances in vehicle technologies and low-carbon fuel sources, this could reduce future<br />
transportation emissions below current levels.<br />
Water quality. Pavement prevents water from soaking into the ground, and surface pollutants<br />
contaminate the resulting runoff. To improve runoff quality and reduce its volume, the City will<br />
support a reduction in paved areas by reducing parking requirements, encouraging shared parking<br />
and driveway accesses, promoting permeable surfaces, and following erosion control guidelines<br />
for construction. <strong>Transportation</strong> facilities will incorporate storm water management principles<br />
TRANSPORTATION MASTER PLAN Page 32<br />
NOVEMBER 2008
and techniques, and surface water runoff will be treated using methods specified by the Ministry<br />
of the Environment before it is released into open waterways.<br />
Vegetation. Some trees and plants are removed when transportation infrastructure is built, and<br />
others are affected by road use and maintenance. Particulate matter, sulphur dioxide, nitrous<br />
oxides and volatile organic compounds emitted by vehicles can harm vegetation, and the use of<br />
road salt in winter also impacts plant health. The City is reducing road salt use and "greening" its<br />
roadways, guided by its Salt Management Strategy and Greening Guidelines. This plan’s intent to<br />
minimize automobile use will reduce the need for new infrastructure and limit air emissions.<br />
Land consumption. To minimize the consumption of valuable agricultural and natural resource<br />
lands by transportation infrastructure expansion, the City will continue to maximize the efficient<br />
operation of existing facilities before adding new ones. It will also work to increase the use of<br />
walking, cycling and transit, which use space more efficiently than motor vehicles.<br />
Noise. This plan aims to protect communities from unacceptable levels of noise from<br />
transportation services including aircraft noise, and noise from roads, transit and heavy rail<br />
facilities. The City’s Environmental Noise Control Guidelines, which are consistent with<br />
regulation and guidelines of the Provincial Ministry of the Environment, identify different noise<br />
sources and design criteria, and regulate noise control measures. Readers may also refer to the<br />
Official <strong>Plan</strong> for policies on acceptable noise levels for land uses including outdoor residential<br />
areas.<br />
The City will:<br />
1. Apply best practices for environmental impact mitigation of construction, surface<br />
operations and maintenance activities.<br />
2. Encourage a reduction in motor vehicle emissions through measures including antiidling<br />
initiatives, scrappage programs for high-polluting vehicles, and promotion of<br />
fuel-efficient vehicles, low-carbon fuels, proper driving habits and vehicle maintenance.<br />
3. Reduce carbon emissions from transit vehicles and other City vehicles.<br />
4. Educate and inform the public about climate change and local initiatives to reduce air<br />
pollution.<br />
5. Incorporate best practices for storm water management design into transportation<br />
projects.<br />
6. Implement enhanced greening guidelines for roads, rapid transit lines and multi-use<br />
pathways, including streetscaping and tree planting in the construction or<br />
reconstruction of all arterial, major collector and collector roads.<br />
7. Implement noise control measures through the planning process for new communities<br />
and transportation facilities, emphasizing the use of design and landscaping measures<br />
rather than noise attenuation barriers.<br />
TRANSPORTATION MASTER PLAN Page 33<br />
NOVEMBER 2008
8. Ensure that developments with residential or other noise-sensitive land uses near<br />
existing and proposed transportation corridors conform to the Environmental Noise<br />
Control Guidelines.<br />
9. Examine the noise impacts of major modifications to arterial or major collector roads<br />
and transit corridors, and identify attenuation requirements in accordance with the<br />
Environmental Noise Control Guidelines.<br />
10. Apply the process set out in the Environmental Noise Control Guidelines for Noise-<br />
Sensitive Developments Adjacent to Existing Roads and Rapid Transit Facilities when<br />
occupants raise concerns related to noise.<br />
3.7 Managing and Maintaining Assets<br />
The estimated replacement value of the City’s transportation infrastructure — including roads,<br />
bridges, walkways and rapid transit facilities — is 9.5 billion. These assets are continuously<br />
deteriorating, and will eventually require rehabilitation or replacement. With limited budgets and<br />
increasing demands on the transportation network, the City is challenged to manage its assets in a<br />
way that minimizes total life-cycle costs and sustains expected levels of service.<br />
Asset management services include condition management and the programming of reinvestment<br />
and renewal activities, as well as the control of activities such as road cuts (required to access<br />
underground services) to preserve the physical integrity of infrastructure. Effective asset<br />
management minimizes the cost of maintaining, repairing and replacing each asset over its entire<br />
life, while enabling infrastructure to support increased levels of use as the community grows.<br />
Infrastructure maintenance services are delivered to paved or surface-treated roads, gravel roads,<br />
sidewalks and pathways, bridges and the Transitway. They include asphalt and concrete repairs,<br />
winter snow and ice control, and sweeping and litter control. Maintenance services play an<br />
essential role in infrastructure management, helping to reduce life-cycle costs while they improve<br />
safety, sustain desired levels of service and protect the natural environment.<br />
Maintenance services must integrate the consideration of public expectations, budgetary<br />
constraints and best practices in risk management. Their effective and efficient delivery depends<br />
on the manner in which the transportation system is designed and built, and can be aided or<br />
hindered by infrastructure design, traffic management measures and landscaping features. The<br />
City’s maintenance service level standards, which define the extent and timing of related<br />
activities, are currently being harmonized and are categorized into the following groups:<br />
• “Public safety” services and standards — Those that impact the safety of pedestrians,<br />
cyclists and vehicles. Road maintenance standards for snow clearance, potholes and road<br />
cracks, regulatory signs and streetlights are required to comply with the Minimum<br />
Maintenance Standards for Municipal Highways as defined by the Municipal Act<br />
• “Infrastructure preservation” services and standards — Those that reflect the City’s need<br />
to protect capital assets, and that are financially justified by life-cycle cost impacts<br />
TRANSPORTATION MASTER PLAN Page 34<br />
NOVEMBER 2008
• “Quality of life” services and standards — Those that enhance the quality of life for<br />
<strong>Ottawa</strong> residents and visitors, and offer some flexibility with regard to performance standards<br />
The City will:<br />
1. Give priority to the management of existing infrastructure before adding new<br />
infrastructure.<br />
2. Maintain an Asset Management Strategy that protects infrastructure and minimizes<br />
the total life-cycle cost of implementation, operation and renewal while providing<br />
continuous, safe and reliable services.<br />
3. Benchmark and monitor the effectiveness of infrastructure management programs.<br />
4. <strong>Plan</strong> and implement infrastructure, including modifications, in a manner that<br />
recognizes implications for maintenance service level standards, practices and costs.<br />
5. <strong>Plan</strong> and implement infrastructure to provide adequate snow storage space and<br />
adequate green space to permit the recharging of ground water from surface water.<br />
6. Introduce right-of-way enhancements, such as street furniture and planters, in a<br />
manner that preserves a clear, unencumbered right-of-way for maintenance services,<br />
wherever possible.<br />
7. Protect and enhance urban forests within transportation corridors.<br />
3.8 Funding Implementation<br />
The City funds its transportation infrastructure and services almost entirely from property tax<br />
revenues, development charges and senior government contributions. Except for the provincial<br />
transfer of gas tax revenue for transit, federal and provincial government funding is on a projectby-project<br />
basis that can help implement projects that might otherwise be deferred, but is<br />
unreliable from a financial planning perspective and may not support the City’s priorities.<br />
This approach to transportation funding disconnects day-to-day development decisions from the<br />
travel costs that are subsequently borne by the residents, employees and customers of<br />
developments. For example, suburban “greenfield” developments are typically easier to get<br />
approved and built, and typically cost developers less than similar infill or redevelopment<br />
projects. However, they frequently do not permit effective or efficient transit servicing and lead to<br />
higher City costs, increased individual reliance on automobile use with greater personal costs, and<br />
more significant environmental impacts.<br />
Development charges collected by the City fund only a portion of its actual growth-related capital<br />
costs. As a result, property taxpayers subsidize a substantial portion of the City’s growth-related<br />
costs. For the City to move toward a cost-recovery model for growth, development charge rates<br />
must enable adequate financing for long-term projects.<br />
To the extent that current sources of funding are insufficient to support the City’s transportation<br />
programs, alternative strategies must be pursued. There are two principal options:<br />
TRANSPORTATION MASTER PLAN Page 35<br />
NOVEMBER 2008
• User pay. There is a growing international trend among municipalities to have transportation<br />
system users pay for their use of the system. User fees for transportation, which can take<br />
various forms, are analogous to commonplace fees for electricity, water or natural gas<br />
consumption. The City of <strong>Ottawa</strong>’s only such fees are for parking and public transit services<br />
— automobile drivers can make unlimited use of the road system without paying anything to<br />
the municipality. While helping to fund infrastructure and services, user pay approaches also<br />
give individuals an incentive to make responsible housing location, business location, work<br />
location and travel decisions that reduce costs to them as well as to society. Examples of user<br />
pay measures include road tolls (either cordon- or facility-based), parking surcharges, fuel<br />
surcharges and vehicle registration fees. There are some Canadian instances of these,<br />
although all involve direct administration or special enabling legislation by provincial<br />
governments.<br />
• Public-private partnerships. To date, the role of the private sector in developing <strong>Ottawa</strong>’s<br />
transportation system has largely been limited to that of entering into contracts for services<br />
like road and rapid transit construction, snow removal or paratransit operation. The federal<br />
and provincial governments are increasingly making private-sector involvement a criterion in<br />
their funding programs, and innovative partnerships can strengthen the City’s chance of<br />
obtaining such funding. Public-private partnerships may involve private investment in new or<br />
rehabilitated transportation infrastructure, in return for user fees or a similar revenue stream.<br />
This approach could help the City implement required transportation facilities earlier than it<br />
could otherwise afford.<br />
The City will:<br />
1. Move toward full recovery of eligible costs related to growth through a new<br />
development charges by-law.<br />
2. Consider development charge incentives to encourage desirable development patterns<br />
that minimize community costs and environmental impacts.<br />
3. Accept, in principle, the need to reduce its reliance on property tax-based funding in<br />
favour of user pay approaches.<br />
4. Continue to work cooperatively with other cities, municipal associations and interested<br />
organizations to urge senior governments to enable the City to secure sustainable<br />
transportation system funding from users, through:<br />
a) Provincial government legislation permitting municipalities to impose annual<br />
levies on non-residential parking spaces<br />
b) Provincial government legislation permitting municipalities to impose gasoline<br />
taxes dedicated to funding municipal transportation infrastructure and services<br />
c) Increased transfers of federal and provincial fuel taxes to municipalities in support<br />
of sustainable transportation infrastructure and services<br />
5. Encourage public-private partnership opportunities for the delivery of transportation<br />
infrastructure and services.<br />
TRANSPORTATION MASTER PLAN Page 36<br />
NOVEMBER 2008
3.9 Measuring Performance<br />
The success of long-range plans depends on the ongoing monitoring of relevant conditions,<br />
actions and impacts. The City must remain aware of its progress toward key objectives so that it<br />
can add, modify or delete priorities as needed.<br />
In developing a performance measurement strategy for this plan, the <strong>Transportation</strong> Vision<br />
identified in Section 3.1 was reconfigured into a number of functional transportation performance<br />
objectives, each of which is accompanied by one or more representative performance indicators.<br />
Together, the performance objectives and indicators paint a picture of key transportation services,<br />
facilities or behaviours and could be viewed as a “report card” on the City’s progress. The 49<br />
performance objectives are categorized under the following headings:<br />
•<br />
•<br />
•<br />
•<br />
•<br />
Limit motor vehicle traffic growth<br />
Increase transit use<br />
Increase cycling<br />
Increase walking<br />
Reduce unwanted social and<br />
environmental effects<br />
•<br />
•<br />
•<br />
•<br />
•<br />
•<br />
Optimize use of existing system<br />
Manage transportation assets<br />
Improve transportation safety<br />
Enable efficient goods movement<br />
Meet mobility needs of persons with disabilities<br />
Meet public expectations<br />
Annex A presents indicators for each objective along with a description of the period, frequency<br />
and location of monitoring activity and an estimate of the degree of influence that the City has<br />
over any change in the indicator. Target values are provided for some indicators, but in some<br />
instances there is no analytical basis to establish one. In other cases, the indicator in question is<br />
more descriptive and has no “ideal” value.<br />
Through the Ontario Municipal Benchmarking Initiative, <strong>Ottawa</strong> also works with 14 other<br />
municipalities to measure, compare and analyze performance in transit, road and parking<br />
services. Regular reports demonstrate the value that <strong>Ottawa</strong> residents receive for their tax dollars,<br />
and identify areas where improvements may be sought.<br />
The City will:<br />
1. Monitor and report on the indicators presented in Annex A, refining target values as<br />
required and developing new monitoring initiatives where information is lacking.<br />
2. Participate in the Ontario Municipal Benchmarking Initiative which reports on the<br />
City’s performance in transportation service delivery.<br />
TRANSPORTATION MASTER PLAN Page 37<br />
NOVEMBER 2008
Chapter 4 – Active <strong>Transportation</strong>: Walking and Cycling<br />
Walking and cycling are primary indicators of a vibrant, sustainable city. They, along with other<br />
forms of active transportation, conserve energy and reduce pressure on the road network while<br />
preserving the environment, improving public health and supporting economic activity. They<br />
offer speed and convenience for shorter trips, and cycling in particular is also an effective option<br />
for longer trips. Virtually all trips, regardless of their principal transportation mode, start and end<br />
with walking. All transit trips involve walking, and a growing number involve cycling too.<br />
To a considerable extent, the quality of life enjoyed by <strong>Ottawa</strong> residents will be a function of their<br />
ability to use walking, cycling and other forms of active transportation for their daily business.<br />
An aging population requires more careful consideration of accessibility, which also benefits<br />
children and other vulnerable persons.<br />
Key factors that can motivate more people to walk and cycle include:<br />
• Suitable distances from origins to destinations<br />
• Positive individual attitudes towards walking, cycling and other forms of active transportation<br />
• In the case of cycling, the possession of individual skills for safe bicycle operation<br />
• Pleasant, direct routes that offer accessibility, comfort, safety and personal security<br />
• Adequate maintenance practices for walking and cycling facilities, particularly in winter<br />
• Suitable bicycle parking, shower and change facilities at travel destinations<br />
In 2008 the <strong>Ottawa</strong> Cycling <strong>Plan</strong>, a comprehensive and detailed blueprint for expanding the role<br />
of cycling in <strong>Ottawa</strong>, was approved by City Council. Although this chapter reflects key elements<br />
of that plan, readers are referred to it for a more complete discussion of related issues.<br />
In 2009 the <strong>Ottawa</strong> Pedestrian <strong>Plan</strong>, which will play a similar role in expanding walking, will be<br />
considered by Council. It is under development at the time of writing, so this chapter does not<br />
fully reflect its contents and will need to be updated in the future.<br />
4.1 Supporting Measures<br />
Through its actions, the City can influence many of the factors that contribute to walking and<br />
cycling levels. While Sections 4.2 through 4.4 deal with travel facilities, this section presents<br />
policies related to municipal leadership, individual attitudes and knowledge, and the broader<br />
physical context for walking and cycling. Many of these policies, notably those related to<br />
information, education and promotion as well as supportive development characteristics, will be<br />
acted upon through the City’s TDM program (Section 3.3).<br />
TRANSPORTATION MASTER PLAN Page 38<br />
NOVEMBER 2008
The City will:<br />
Leadership and commitment<br />
1. Adopt a Pedestrian Charter that expresses the City’s commitment to enabling,<br />
facilitating and promoting pedestrian activity and to developing walkable communities.<br />
Land use and community development<br />
2. Promote development practices that improve the walking and cycling environment, as<br />
described in Section 3.2.<br />
3. Incorporate tools to support walkability, such as guidelines and audits, into the<br />
Community Design <strong>Plan</strong> process.<br />
4. Incorporate tools to support walkability, such as guidelines and checklists, into the<br />
development approval process at the site and neighbourhood levels.<br />
Information, education and promotion<br />
5. Conduct communications initiatives to build public awareness of the environmental,<br />
social and economic benefits of walking and cycling.<br />
6. Regularly update and distribute information tools, including the <strong>Ottawa</strong> Cycling Map,<br />
to inform and educate cyclists about routes and safe cycling practices.<br />
7. In partnership with employers and post-secondary institutions, engage potential<br />
pedestrians and cyclists at their place of work or education through measures including<br />
special events, transportation fairs, bicycle user groups and cycling skills courses.<br />
8. In partnership with schools and their stakeholders, identify and implement effective<br />
measures to expand walking and cycling by schoolchildren, including but not limited to<br />
special events, active and safe routes to school programs and cycling skills education.<br />
9. In partnership with community organizations, identify and implement effective<br />
measures to increase the availability and marketing of cycling skills courses for the<br />
general public.<br />
10. Conduct initiatives that promote safe walking with a focus on vulnerable pedestrians<br />
including children and seniors.<br />
11. Provide financial or in-kind support for walking- and cycling-related special events<br />
including the Commuter Challenge and those coordinated by charities.<br />
12. Continue and expand initiatives including the Bruce Timmermans Awards that<br />
recognize and reward contributions to active transportation by individuals, businesses<br />
and community organizations.<br />
End of trip facilities<br />
13. Encourage owners and managers of existing buildings, especially multi-unit residential<br />
buildings and workplaces, to install secure long-term bicycle parking using as a guide<br />
TRANSPORTATION MASTER PLAN Page 39<br />
NOVEMBER 2008
the Bicycle Parking Space Rates and Provisions for new buildings as contained in the<br />
City’s Zoning By-law.<br />
14. Educate developers, planners, architects, owners and managers of workplaces about the<br />
need to offer shower and change facilities for active commuters.<br />
15. Install medium security bicycle parking facilities at City facilities, as needed to meet<br />
demand.<br />
16. Install bicycle parking such as ring-and-post racks in high-use public locations such as<br />
main streets, as needed to better meet demand.<br />
17. Implement a pilot “Park and Bike” facility for long-distance bicycle commuters who<br />
wish to commute, in part, by automobile.<br />
Connections to public transit<br />
18. Include bicycle racks when purchasing new buses, and ensure that new light rail<br />
vehicles enable passengers to store their bicycles on board.<br />
19. Improve the safety and convenience of walking and cycling connections to rapid transit<br />
stations.<br />
20. Provide adequate, secure bicycle parking at rapid transit stations and major transit<br />
stops, as needed to meet demand.<br />
21. Work with public, non-profit and private-sector partners to improve personal security<br />
along walking routes to transit stops and stations.<br />
Public bicycles<br />
22. Work with key partners including the National Capital Commission and City of<br />
Gatineau to investigate the feasibility of launching a smart bike program similar to the<br />
announced Bixi public bike system in Montreal and the successful Vélib program in<br />
Paris, France.<br />
4.2 Walking Facilities<br />
The facilities that pedestrians use are primary determinants of walkability. Facilities should offer<br />
a direct connection between origins and destinations, they should be accessible, safe and secure,<br />
and they should be maintained across the seasons and in all weather conditions. Following are<br />
City policies and actions that will contribute to the role of facilities in making <strong>Ottawa</strong> more<br />
walkable. (Note that this section addresses the overall walking network and issues related to<br />
sidewalks and pedestrian crossings; Section 4.4 covers issues specific to multi-use pathways.)<br />
The City will:<br />
1. Through approval of the <strong>Ottawa</strong> Pedestrian <strong>Plan</strong> (under development), adopt an<br />
integrated pedestrian network and implementation strategy to complement the projects<br />
in Figure 8.1 of this document, and establish performance measures to complement<br />
those discussed in Section 3.9 of this document.<br />
TRANSPORTATION MASTER PLAN Page 40<br />
NOVEMBER 2008
2. Require the provision of sidewalks on new roads, and reconstructed roads where<br />
physical constraints allow, as follows:<br />
a) On both sides of arterial, major collector and collector roads in the urban area and<br />
arterials in Villages. A multi-use pathway in lieu of a sidewalk may be provided on<br />
one side for a collector in a Village or on one side of an urban arterial if determined<br />
to be appropriate by the City.<br />
b) A sidewalk or multi-use pathway on at least one side of all arterial roads passing<br />
through the Greenbelt, collector roads in villages, and roads other than arterials or<br />
collectors in the urban area that serve transit.<br />
c) Wherever the <strong>Ottawa</strong> Pedestrian <strong>Plan</strong> or a Community Design <strong>Plan</strong> has identified<br />
discontinuities in the pedestrian network.<br />
3. Require the additional provision of pedestrian facilities, as follows:<br />
a) Direct, high-quality pedestrian connections to rapid transit stations, bus stops and<br />
other major walking destinations.<br />
b) Pedestrian crossings to link neighbourhoods that are separated by roads or other<br />
physical barriers, where safety considerations permit.<br />
4. Enhance the New Sidewalk Links program by updating the criteria and weights used to<br />
assess candidate links, and establish a parallel program for non-sidewalk pedestrian<br />
facilities.<br />
5. Develop consistent and comprehensive design guidelines for walking facilities, taking<br />
into account current City standards and guidelines as well as best practices from<br />
elsewhere, with particular focus on accessibility and the needs of vulnerable users<br />
including children and elderly persons.<br />
6. Implement pedestrian countdown signals at all new and rebuilt traffic signals, and at<br />
other traffic signals as resources allow.<br />
7. Conduct snow clearance, street sweeping and plant and tree maintenance in a manner<br />
that supports walking while considering physical, operational and financial constraints.<br />
8. Continue and expand walking support programs including the Snow-Go Program that<br />
provides snow-clearance assistance to seniors and persons with disabilities, and the<br />
Yellow Grit Program that enables pedestrians to help make walking safer.<br />
4.3 Cycling Facilities<br />
Cycling facilities include streets and multi-use pathways. (Note that this section addresses the<br />
overall cycling network and issues related to on-street cycling facilities; Section 4.4 covers issues<br />
specific to multi-use pathways.) The existence of safe and direct facilities for cycling is a major<br />
factor in motivating people to ride their bicycles. It can be challenging to provide such facilities<br />
in constrained environments like downtown, and in areas like arterial road corridors where traffic<br />
TRANSPORTATION MASTER PLAN Page 41<br />
NOVEMBER 2008
speeds and volumes are high. A wide range of on-road cycling facilities may be considered, with<br />
applicability and appropriateness varying according to the specifics of each situation: signed-only<br />
routes and wide curb lanes shared with other vehicles, designated bicycle lanes and priority<br />
treatments at intersections, and paved shoulders. As with walking facilities, maintenance of<br />
cycling facilities is also a dominant concern. Following are City policies and actions that will<br />
improve cycling facilities in <strong>Ottawa</strong>, and in turn make cycling a more regular part of residents’<br />
travel habits.<br />
The City will:<br />
1. Adopt an integrated cycling network including the Spine route system and National<br />
Capital Commission Pathways shown on Map 1 and Map 3, and the complementary<br />
Community route system identified in the <strong>Ottawa</strong> Cycling <strong>Plan</strong>. An amendment to the<br />
<strong>Transportation</strong> <strong>Master</strong> <strong>Plan</strong> shall not be required to amend the network, provided that<br />
continuity is maintained in the same general location and access to key destinations is<br />
maintained.<br />
2. Apply cycling-supportive design and construction standards to all new, widened and<br />
reconstructed City roads except freeways on which cycling is prohibited.<br />
3. Proactively implement localized or linear cycling facilities, including those identified in<br />
Figure 8.2, that represent strategic linkages within the cycling network.<br />
4. Implement operational measures that support cycling, such as turn prohibition<br />
exemptions and contra-flow cycling lanes on one-way streets, where safety<br />
considerations permit. Consider the needs of cyclists when installing vehicle detection<br />
equipment at intersections.<br />
5. Conduct snow clearance, street sweeping, tree and plant maintenance, pothole repair<br />
and reinstatement of road cuts in a manner that supports cycling while considering<br />
physical, operational and financial constraints.<br />
6. Give priority to streets along the Spine route system identified on Map 2 when<br />
scheduling snow removal, street sweeping and other routine maintenance.<br />
7. When implementing bus lanes and transit priority measures, accommodate buses and<br />
cyclists in separate facilities; failing that, provide a shared-use curb lane designed to<br />
appropriate standards; failing that, prohibit cyclists from using the part of the road<br />
dedicated to transit.<br />
8. Develop quality of service indicators and objectives to evaluate cycling facilities and<br />
conditions, and to evaluate possible changes.<br />
4.4 Multi-use Pathways<br />
Multi-use pathways are dedicated off-road facilities for walking, cycling and other modes such as<br />
in-line skating. Pathways serve both utilitarian and recreational travel needs. Given the scarcity of<br />
linear corridors for such facilities, they are generally constructed in transit corridors, abandoned<br />
TRANSPORTATION MASTER PLAN Page 42<br />
NOVEMBER 2008
ail corridors, utility corridors, along rivers and in parks. Pathways may feature a range of surface<br />
treatments including asphalt and stone dust. The ongoing development of the City’s pathway<br />
system will be coordinated with the National Capital Commission’s comprehensive network of<br />
multi-use pathways.<br />
Map 1 and Map 3 illustrate a network of urban and rural multi-use pathways within the City,<br />
many of which are owned and maintained by the National Capital Commission. The eventual<br />
location of individual pathways may vary as a result of additional study or the provisions of a<br />
development agreement, although network continuity and connections among destinations will be<br />
maintained. The City may also develop other pathways, further to the following policies. Annex<br />
B identifies multi-use pathway linkages that have been identified as required infrastructure<br />
projects.<br />
The City will:<br />
1. Provide, or require others to provide, multi-use pathways within and between<br />
neighbourhoods, where physical constraints allow.<br />
2. Provide multi-use pathways in or adjacent to rapid transit corridors, where physical<br />
constraints allow, to be constructed simultaneously.<br />
3. Provide walking and cycling crossings of rapid transit corridors, where physical<br />
constraints allow, considering the level of demand and alternative crossing<br />
opportunities.<br />
4. Apply design and construction standards that minimize conflicts among all users on all<br />
new, widened and reconstructed pathways.<br />
5. Work with other agencies and interest groups to establish alignments and priorities for<br />
pathway network extensions beyond City limits.<br />
6. Develop and apply criteria to determine eligibility of pathways for winter maintenance,<br />
taking into account the transportation function of pathways such as access to rapid<br />
transit stations.<br />
7. Form a working group with representation of relevant City departments, the National<br />
Capital Commission and City of Gatineau to provide a forum for regular<br />
communication and coordination on pathway network development.<br />
TRANSPORTATION MASTER PLAN Page 43<br />
NOVEMBER 2008
Chapter 5 – Public Transit<br />
Chapter summary<br />
<strong>Ottawa</strong> has achieved greater levels of transit ridership than other North American cities of its<br />
size, but must become even more transit-oriented. The City’s growth management strategy<br />
aims to increase transit’s morning peak hour share of motorized person-trips to 30% by 2031.<br />
This is an increase from today’s level of 23%, and compares well to many large European<br />
cities. Such an ambitious objective requires the City to improve transit’s competitive position<br />
relative to the automobile.<br />
To make transit the preferred choice of even more residents, the City must make a deliberate<br />
series of improvements to the transit system as well as to the community’s broader physical,<br />
social and economic context. To achieve a peak hour transit modal split of 30% all<br />
measures identified in this chapter are required. Partial implementation will lead to lower<br />
transit ridership, greater air pollution and increased pressure for new road infrastructure to<br />
prevent unacceptable levels of congestion.<br />
The City’s transit strategy recognizes that substantial increases in ridership call for greater<br />
availability, reliability, speed and comfort of transit service. All of these will be achieved or<br />
enabled by expanding <strong>Ottawa</strong>’s rapid transit system—the cornerstone of <strong>Ottawa</strong>’s transit<br />
strategy. This chapter discusses a number of the strategy’s key elements:<br />
• Supporting measures in the areas of land use planning, parking management,<br />
transportation demand management, financial incentives for transit use, intermodal<br />
integration and infrastructure priority setting<br />
• Initiatives to provide ease of mobility related to route network structure and service<br />
standards, rapid transit and transit priority networks, fleet expansion and maintenance, and<br />
safety and security<br />
• Pursuit of economic efficiency through transit fare structures and technologies<br />
• Provision of accessibility for customers with disabilities through enhancements to<br />
conventional services as well as specialized Para Transpo services<br />
• Improvements to environmental efficiency through adoption of advanced vehicle and<br />
fuel technologies<br />
TRANSPORTATION MASTER PLAN Page 44<br />
NOVEMBER 2008
5.1 Supporting Measures<br />
A variety of measures are required to maximize transit’s competitiveness with automobile use, as<br />
described in the following paragraphs.<br />
Land use planning. Through the Province of Ontario’s <strong>Plan</strong>ning Act and its own Official <strong>Plan</strong>,<br />
the City has the authority to shape land use within its borders. It controls the land uses that are<br />
permissible in various areas, and can establish conditions on new developments including the<br />
extent, type and location of automobile parking. Section 3.2 of this plan summarizes many of the<br />
transit-supportive land use policies that are contained in the Official <strong>Plan</strong>.<br />
Parking management. The availability and price of parking are major determinants of the<br />
attractiveness of transit in reaching a destination. Sections 3.2 and 6.11 of this plan identify a<br />
number of measures through which the City can limit the challenge that abundant, free parking<br />
poses to achievement of transit ridership objectives. Examples of such measures include limiting<br />
parking supply in the vicinity of rapid transit stations, and encouraging shared and/or structured<br />
parking to enable more compact development patterns.<br />
<strong>Transportation</strong> demand management. Section 3.3 identifies a framework for the City’s<br />
transportation demand management (TDM) program. There are a number of TDM efforts that can<br />
help increase transit ridership, including partnerships with various groups to raise public<br />
awareness of transit options, build positive attitudes towards them, and promote their use.<br />
Financial incentives. Transit faces several areas of competitive disadvantage related to the price<br />
of travel. Free parking (especially at workplaces) is the most significant, since it reduces the outof-pocket<br />
costs for most automobile trips to below the cost of a transit fare. The City currently<br />
has virtually no ability to directly influence the provision of free parking on private lands, but by<br />
influencing parking supply it can foster a market for priced (rather than free) parking. The City<br />
will also urge the federal government to enforce the taxability of employer-provided parking<br />
benefits, and to make employer-provided transit benefits tax-exempt (as a complement to the<br />
current ability for individuals to claim a portion of the cost of transit passes on their income tax<br />
return).<br />
Intermodal integration. Transit users rely on connections with other modes to make their trips<br />
as convenient and comfortable as possible. City initiatives to improve intermodal integration<br />
include linking transit to walking (via pathways and sidewalks), cycling (via bike parking at rapid<br />
transit stations, and provision for transit vehicles to carry bicycles), automobile use (via Park &<br />
Ride lots and passenger drop-off zones at rapid transit stations) and intercity carriers (via service<br />
to air, rail and bus terminals).<br />
Infrastructure priority setting. The City can improve the competitive balance between transit<br />
and automobile use by placing a higher priority on providing infrastructure that improves transit<br />
service, relative to infrastructure that improves service for automobile users. This is not simply an<br />
issue of rapid transit versus roads—in fact, road projects can favour transit by giving priority to<br />
transit vehicles or otherwise improving the speed and reliability of transit operations. The phasing<br />
of new infrastructure can also influence the travel patterns of residents in new developments, and<br />
TRANSPORTATION MASTER PLAN Page 45<br />
NOVEMBER 2008
whatever infrastructure is needed to provide high-quality transit service to such areas should be a<br />
high priority. Chapter 8 describes the infrastructure priorities established by this <strong>Plan</strong>.<br />
The City will:<br />
1. Direct new developments to be transit-supportive, through measures outlined in the<br />
Official <strong>Plan</strong> including those related to parking management.<br />
2. Partner with employers, educational institutions and community groups to implement<br />
measures that encourage transit use through education, promotion and incentives.<br />
3. Urge the federal government to locate its employment centres adjacent to rapid transit<br />
stations.<br />
4. Urge other governments to address the imbalance of inequitable public subsidies of<br />
automobile travel, and provide a more level playing field for travel by public transit,<br />
through:<br />
a) Federal government enforcement of the taxability of employer-provided parking<br />
benefits<br />
b) Federal government designation of employer-provided transit benefits as<br />
non-taxable<br />
c) Provincial government adoption of enabling legislation granting municipalities the<br />
authority to impose levies on private parking spaces<br />
d) Federal government elimination of subsidized parking for its employees<br />
5. Continue to enhance the integration of transit with other travel modes, making transit<br />
services and facilities more accessible to pedestrians, cyclists, automobile drivers and<br />
passengers, and intercity travelers.<br />
6. Give priority to the enhancement of transit service when setting priorities for all<br />
infrastructure projects, and particularly for those that serve developing communities.<br />
5.2 Ease of Mobility<br />
The main strategic objective of transit service is to provide ease of mobility to individuals. To this<br />
end, the City endeavours to offer reliable and safe public transit services that satisfy the travel<br />
needs and expectations of the largest number of persons possible in various circumstances.<br />
5.2.1 Service Delivery Model and Transit Network Structure<br />
While transit services may be categorized conventionally in terms of mode (e.g. bus, light rail and<br />
so on), the City of <strong>Ottawa</strong> defines its four types of transit services according to the market<br />
segments they target and the profiles, needs and values of the passengers that make up those<br />
markets as well as their revenue potential:<br />
TRANSPORTATION MASTER PLAN Page 46<br />
NOVEMBER 2008
• Regular transit operates throughout the city on fixed schedules and at regular fares. It<br />
includes rapid transit bus routes, “mainline” bus routes, local bus routes, peak period bus<br />
routes to employment areas, and the O-Train.<br />
• Commuter transit operates on fixed schedules at premium fares. It includes express, rural<br />
express and direct-to-downtown routes that run during peak periods, along typically longer<br />
routes and faster than regular transit, and that offer trips to downtown without requiring a<br />
transfer between buses.<br />
• School transit operates on fixed, local routes anchored at secondary schools, targeting a<br />
specific client group that travels for a specific purpose at specific times—namely before the<br />
start of morning classes and after dismissal in the afternoon.<br />
• Paratransit is not operated on fixed schedules, nor along fixed routes. Instead, it responds to<br />
demand by individual registered customers. It may be offered using small buses, vans, cars or<br />
taxis.<br />
<strong>Ottawa</strong>’s transit network will continue to be structured around the City’s rapid transit facilities.<br />
Over the next two decades, the rapid transit network will expand and evolve into a multimodal<br />
facility integrating the existing O-Train, new light rail transit (LRT) lines, parts of the existing<br />
Transitway, and new sections of Transitway (see Section 5.2.2). The transit services described<br />
above will continue to be provided on this transit network through the design of bus routes and<br />
rail lines that match the kinds of trips made by transit users:<br />
• Local routes for shorter trips, such as a trip within a downtown neighbourhood or urban<br />
community outside the Greenbelt<br />
• Trunk lines for longer trips between points that are far apart along major travel corridors,<br />
such as a trip on the Transitway between Kanata and downtown or a trip along Innes Road in<br />
Orléans<br />
• Feeder routes for access trips that connect local points outside of major corridors of travel<br />
with a trunk line, such as a trip from home to a Transitway or light rail station en route to<br />
locations in the central part of the city.<br />
The City will:<br />
1. Sustain high transit ridership by identifying and pursuing transit market segments<br />
defined by parameters including socio-demographics and time or purpose of travel.<br />
2. Sustain high customer satisfaction by fostering quality service and regularly monitoring<br />
residents’ usage of and attitudes toward transit .<br />
3. Develop and strengthen a network of trunk lines and feeder routes that will make the<br />
transit system more customer-friendly by simplifying its structure, increasing reliability<br />
through greater service availability and on-time performance, and improving efficiency<br />
by making it more robust in the face of pressures on service delivery.<br />
TRANSPORTATION MASTER PLAN Page 47<br />
NOVEMBER 2008
4. Better manage customer transfers and reduce user uncertainty and waiting times by<br />
improving service scheduling and creating amenities and retail opportunities at<br />
transportation centres and main transfer points.<br />
5. Expand the transit network as the City grows to maintain appropriate levels of coverage<br />
and reach for actual and potential transit customers.<br />
6. Increase service levels on transit lines with growing ridership, in accordance with<br />
objectives for vehicle occupancy and passenger comfort.<br />
7. Provide transit service between villages and rural areas and the rest of the transit<br />
system in accordance with rural transit service and funding policies.<br />
8. Provide Park and Ride lots at the extremities of the rapid transit network for customers<br />
who live in areas without transit service or who prefer to drive their cars to the nearest<br />
major transit station, and provide smaller Park & Ride lots in rural villages served by<br />
transit routes to downtown.<br />
9. Accommodate transit services operated by other municipalities or private companies<br />
that connect the City’s transit network to towns outside of the city as well as rural<br />
sectors of the city where municipal transit service is not provided, and support the<br />
coordination of those services with the City’s.<br />
10. Work with the Société de transport de l’Outaouais to provide seamless transit services<br />
and integrated fares to transit users crossing the <strong>Ottawa</strong> River.<br />
5.2.2 Rapid Transit<br />
Network Corridors<br />
The successful implementation of an expanded rapid transit network will be a critical element in<br />
the achievement of the City’s transit objectives. The expansion of the rapid transit network to<br />
more parts of the city will significantly increase the ease of mobility and attractiveness of transit<br />
use for residents. The City has developed a strategic approach to expanding its rapid transit<br />
network in response to future transportation needs. This approach foresees the development of a<br />
network of inter-linked transit corridors comprised of three key components:<br />
• Primary rapid transit corridors—fast, frequent, high-capacity transit service using either<br />
rail or bus technology operating in an exclusive right-of-way that is generally grade separated<br />
• Transit intensive corridors—linking to the primary network, these high ridership potential<br />
corridors will have all-day, dedicated, continuous and exclusive transit facilities for use by<br />
buses or trains, operating at grade with priority at signalized intersections<br />
• Transit priority corridors—connecting corridors equipped with a set of coordinated priority<br />
measures that give transit vehicles preferential treatment over other vehicles. These priority<br />
measures may include peak-period transit only lanes, short dedicated lane segments, queuejumps<br />
and traffic signal priority.<br />
TRANSPORTATION MASTER PLAN Page 48<br />
NOVEMBER 2008
The rapid transit network identified on Map 4a. This network will be implemented over the<br />
coming two decades. Annex B identifies the rapid transit infrastructure projects that will be<br />
required. Map 4b shows an ultimate rapid transit network and Map 4c shows conceptual<br />
interprovincial transit corridors.<br />
Rapid Transit Stations<br />
Rapid transit stations serve high volumes of passengers arriving from or heading to nearby<br />
homes, workplaces, schools, stores and other destinations, and their immediate environments can<br />
either encourage or discourage the use of transit. Stations also serve as meeting points that allow<br />
passenger transfers between transit routes, between bus and rail transit modes, and between<br />
transit and other modes such as walking, cycling, taxis and private automobiles. They must make<br />
transfers as convenient, comfortable and secure as possible. Special effort will be made at heavily<br />
used LRT transfer stations to ensure a superior level of comfort and convenience for transit users.<br />
Rapid transit stations are also excellent locations for future employment opportunities. However,<br />
poor planning of surrounding land uses can limit the ability of transit passengers to get to and<br />
from the station with convenience, safety, security and comfort. As well, the provision of<br />
abundant free parking for employees near rapid transit stations will negatively affect the<br />
competitiveness of the rapid transit service. The City’s land use policies, as contained in the<br />
Official <strong>Plan</strong> and summarized in Section 3.2 of this <strong>Plan</strong>, outline strategies to encourage<br />
integrated office and commercial developments at selected rapid transit stations. The Official<br />
<strong>Plan</strong> also sets out intensification and density targets for key areas, which will occur at most rapid<br />
transit stations. Additional policies related to the planning of rapid transit stations are located in<br />
Chapter 4 (Active <strong>Transportation</strong>) and Section 6.11 (Parking). Safety and security at transit<br />
stations is addressed in Section 5.2.5.<br />
Park and Ride Lots<br />
Park and Ride lots are an important adjunct to some rapid transit stations. They serve passengers<br />
arriving by car from the rural area or adjacent municipalities, as well as passengers from the<br />
urban area who drive to and from transit in order to meet other needs en route, such as childcare,<br />
shopping or other personal business. This plan envisions several new Park & Ride lots to<br />
complete the network at the locations shown on Map 4a. The locations of these Park & Rides<br />
lots has generally been planned with the purpose of drawing in commuters so that they transfer to<br />
transit at the rural/urban edge or at the outer edge of the Greenbelt and thereby avoid auto travel<br />
across the Greenbelt and onward towards the city centre.<br />
The City will:<br />
1. Implement a seamless network of rapid transit corridors, including a downtown tunnel<br />
and incremental extensions to urban centres outside the Greenbelt, as shown on Map<br />
4a.<br />
2. Protect the opportunity to fully grade-separate all elements of the rapid transit system,<br />
as and when required, within or beyond the planning horizon.<br />
TRANSPORTATION MASTER PLAN Page 49<br />
NOVEMBER 2008
3. Defer the costs of grade-separating rapid transit elements by introducing transit<br />
priority measures that reduce delay and improve reliability, and by incrementally<br />
introducing further enhancements to isolate transit from mixed traffic.<br />
4. Implement rapid transit corridors in urban centres outside the Greenbelt in a manner<br />
that permits interim uses at early stages of development, while ensuring the earliest<br />
possible provision of high-quality transit service and the future potential to<br />
incrementally introduce grade-separated transit facilities.<br />
5. Provide multi-use pathways in or adjacent to rapid transit corridors, where physical<br />
constraints allow, to be constructed simultaneously.<br />
6. Provide walking and cycling crossings of rapid transit corridors, where physical<br />
constraints allow, considering the level of demand and alternative crossing<br />
opportunities.<br />
7. Develop a policy to help determine the suitability of use of air rights above or easement<br />
rights below rapid transit network components including corridors, stations and Park<br />
and Ride facilities.<br />
8. Purchase surplus railway rights-of-way and select utility (e.g. hydro line) corridors, as<br />
they become available, for use as future transportation corridors including rapid transit<br />
network expansions beyond the current planning horizon, including where appropriate<br />
sufficient lands for transit/transfer stations along these corridors.<br />
9. Enhance the comfort, security and convenience of rapid transit stations through<br />
measures such as improved signage, seating, heating, accessibility for people with<br />
disabilities, and convenience retail and service uses.<br />
10. Work to optimize development potential and integration at key transfer points,<br />
particularly at Baseline, Lincoln Fields, Hurdman, Blair and South Keys stations.<br />
11. Improve transfer facilities at rapid transit stations by enhancing or adding features<br />
such as taxi loading areas, passenger drop-off and pick-up facilities, bicycle parking<br />
facilities, and pedestrian walkways.<br />
12. Pursue opportunities, alone or in partnership with others, to provide and improve<br />
pedestrian connections between rapid transit stations and adjacent developments.<br />
13. Maintain adequate and appropriately located Park and Ride lots at locations shown on<br />
Map 4a.<br />
14. Monitor and adjust Park and Ride lots as the City grows and the rapid transit system<br />
expands.<br />
15. Pursue opportunities to provide or designate daily parking spaces for transit customers<br />
at existing or new developments.<br />
TRANSPORTATION MASTER PLAN Page 50<br />
NOVEMBER 2008
5.2.3 Transit Priority Measures<br />
In <strong>Ottawa</strong>, over 85% of transit service is delivered on roads. In these mixed traffic environments,<br />
traffic congestion increases delay and reduces reliability for transit services. Transit priority<br />
measures can minimize the impacts of congestion through physical, operational, and legislative<br />
means that give transit buses preferential treatment over other vehicles. Their main objective is to<br />
improve the competitiveness of transit, compared to the automobile, by reducing travel times and<br />
improving service reliability. A secondary objective is either to reduce transit operating and<br />
capital costs, or to provide more transit capacity and service with the same resources.<br />
Transit priority measures include dedicated bus lanes, transit signal priority treatments, bus queue<br />
jumps, special bus stop arrangements, and traffic management techniques such as queue<br />
relocation. Transit priority corridors, as shown on Map 4a, link to the primary rapid transit and<br />
transit intensive network, and are identified as specific projects shown in Annex B. Transit<br />
priority measures may also be implemented at other locations to improve transit service.<br />
The City will:<br />
1. Implement the transit priority network shown on Map 4a through measures that<br />
include, but are not limited to, the transit priority projects identified in Annex B.<br />
2. For those corridors shown on Map 4a that require road widening to create transit<br />
priority measures, initiate functional planning, property requirement identification<br />
and Environmental Assessment as soon as possible.<br />
3. Investigate transit priority measures and implement them, as appropriate, whenever<br />
roadway or intersection modifications are done, but especially at the following<br />
locations:<br />
a) At intersections of the Transitway and other roads<br />
b) At intersections and roadways adjacent to Transitway and LRT stations<br />
c) Along the transit priority network identified in Map 4a<br />
d) At other intersections with busy transit routes.<br />
4. Implement cost-effective, ridership-enhancing interim transit priority measures in the<br />
staging of rapid transit corridor development.<br />
5. Reduce transit travel time and improve service reliability through technologies to<br />
communicate between transit vehicles and traffic control signal infrastructure,<br />
allowing implementation of traffic management strategies that favour transit<br />
movements at intersections.<br />
6. Where required to preserve public safety or the integrity of transit operations, exclude<br />
other road users (e.g. bicycles or taxis) from bus lanes.<br />
TRANSPORTATION MASTER PLAN Page 51<br />
NOVEMBER 2008
7. Identify and mitigate any short-term negative impacts of transit priority measures,<br />
including those arising from diverted automobile traffic or changes in queuing<br />
patterns.<br />
8. Build public awareness and a positive attitude towards transit priority measures<br />
through education and promotion.<br />
5.2.4 Transit Service Availability<br />
Service availability is ensured through effective transit vehicle maintenance. By the end of 2008,<br />
the City’s fleet of conventional transit vehicles will include 742 standard buses, 275 articulated<br />
low-floor buses, three double-decker low-floor buses, one small bus and three diesel rail cars.<br />
Para Transpo services are provided with 91 lift-equipped vans and a number of taxis registered as<br />
accessible providers.<br />
The City’s goal for increasing transit ridership will require significant investment in new buses<br />
and rail vehicles to meet expansion and replacement needs, driven by five main factors:<br />
• The desire to increase fleet reliability and enable a reduction in the number of spare buses as<br />
a proportion of the total bus fleet<br />
• The need to replace all buses in the current fleet, which have an expected lifespan of 18<br />
years, over the next two decades<br />
• The need to carry more riders resulting from service improvements, complementary land use<br />
and parking management policies, and a growing population<br />
• The need to operate high-capacity (articulated or double-decker) buses to increase passenger<br />
capacity and alleviate downtown bus congestion during peak periods<br />
• The need to acquire light rail vehicles consistent with the rapid transit network<br />
recommendations of this plan<br />
The City will:<br />
1. Acquire sufficient new buses and light rail vehicles to provide desired service levels and<br />
carry desired passenger volumes.<br />
2. Maintain an average age of nine years for the bus fleet.<br />
3. Continue to acquire high-capacity buses to accommodate ridership growth.<br />
4. Improve the bus spare ratio from 17% to 10%.<br />
5.2.5 Transit Safety and Security<br />
Customer and employee input has dramatically increased the priority of transit safety and security<br />
in North American communities. This includes the City of <strong>Ottawa</strong>, which is using innovative<br />
physical, operational and outreach initiatives to make transit service safer and more secure.<br />
TRANSPORTATION MASTER PLAN Page 52<br />
NOVEMBER 2008
The City will:<br />
1. Further improve transit system security by hiring additional uniformed Transit Special<br />
Constables and enhancing their profile, image and training to help them serve more<br />
effectively and efficiently.<br />
2. Expand centrally monitored video surveillance systems to rapid transit stations and<br />
Park and Ride lots.<br />
3. Cultivate and maintain partnerships among transit staff, police, school officials and<br />
community groups, and participate in joint initiatives to address common concerns.<br />
4. Raise customer and employee awareness of safety and security through internal<br />
outreach programs and presentations to schools and community groups.<br />
5. Continue programs to prevent violence toward transit employees.<br />
6. Work with community groups and police to conduct security and safety audits of rapid<br />
transit stations and Park and Ride lots using Crime Prevention Through Environmental<br />
Design principles to identify and correct deficiencies.<br />
7. Enhance incident reporting and standardize procedures with other transit agencies.<br />
5.3 Economic Efficiency<br />
Another strategic objective of <strong>Ottawa</strong>’s transit service is to offer effective travel options at the<br />
lowest possible cost. In 2007, 50% of transit’s operating cost was recovered from passenger fares,<br />
with the remainder funded by property taxes. Some funding for transit operations is received from<br />
the provincial or federal governments through the gas tax transfer, but property taxes are the<br />
City’s only other funding source.<br />
Fares help determine transit’s economic competitiveness compared to car ownership and<br />
operation. The transit fare structure can enhance product management and help build new markets<br />
by providing incentives for loyal customers. Fare collection systems that use advanced<br />
technologies can do even more to achieve the City’s financial performance, modal shift and social<br />
objectives.<br />
The City will:<br />
1. Encourage provincial and federal governments to increase their contributions to the<br />
cost of operating transit service.<br />
2. Pursue transit revenues, including fares, that support the key service objectives<br />
described in Section 5.2.1, adjusting fares annually so transit revenue recovers at least<br />
50% of operating expenses until elements of the recommended rail transit network are<br />
implemented, after which the City will work toward a cost-recovery target of 55%.<br />
Develop an electronic fare system that uses "smart cards" to enable fare differences by user<br />
type, time of day, distance travelled or other factors, and that enable promotional measures<br />
such as value-added and cross-selling opportunities.<br />
TRANSPORTATION MASTER PLAN Page 53<br />
NOVEMBER 2008
5.4 Accessibility for Customers with Disabilities<br />
A third strategic objective of <strong>Ottawa</strong>’s transit service is to offer full accessibility to transit for<br />
residents and visitors who have permanent or temporary disabilities, through both specialized<br />
services and barrier-free conventional services in agreement with legislative requirements. Over<br />
the life of this plan, there will be an increased demand for accessible transit, as <strong>Ottawa</strong>’s<br />
population of seniors continues to rise and medical advances increasingly allow persons with<br />
disabilities to lead fully independent lives. All Transitway and O-Train stations have been built as<br />
barrier-free as possible, and all buses purchased since 1997 have been low-floor models able to<br />
carry customers who use mobility devices such as wheelchairs. All remaining high-floor buses<br />
will be replaced by about 2015.<br />
There will always be some people whose disabilities prevent them from using conventional<br />
transit services for some or all of their trips—with more in winter because cold weather, snow<br />
and ice are barriers to travel. As well, until all City buses are low-floor there will be some<br />
passengers who need accessible service but rely on routes where accessible service is not<br />
provided at all times. For these passengers, the City will continue to provide door-to-door Para<br />
Transpo service. Even though the number of persons with disabilities will increase over the next<br />
two decades, greater accessibility of conventional transit service should minimize the need to<br />
substantially expand Para Transpo services.<br />
The City will:<br />
1. Design all new rapid transit facilities to accommodate people with disabilities.<br />
2. Acquire only low-floor buses and rail vehicles, with the objective of operating low-floor<br />
buses exclusively after 2015.<br />
3. Until the fleet is 100% accessible, assign low-floor buses to routes and trips where they<br />
will be of greatest use to passengers with disabilities.<br />
4. Consider the needs of people with disabilities when providing information on transit<br />
services.<br />
5. Maintain Para Transpo service sufficient to accommodate the needs of passengers who<br />
cannot use conventional transit services.<br />
5.5 Environmental Efficiency<br />
The fourth strategic objective of <strong>Ottawa</strong>’s transit service is to achieve state-of-the-art<br />
environmental efficiency, including fuel efficiency and a reduced greenhouse gas (GHG)<br />
footprint. While diesel technology has powered almost all transit vehicles for the past several<br />
decades, new technologies are being developed. Clean diesel buses running on low-sulphur diesel<br />
fuel emit up to 90% less of several key air toxins, compared to traditional diesel engines. Hybrid<br />
diesel-electric technologies have become more reliable and affordable, and are now in general use<br />
in North America.<br />
TRANSPORTATION MASTER PLAN Page 54<br />
NOVEMBER 2008
The City will:<br />
1. Acquire electric rail vehicles.<br />
2. Acquire buses with the cleanest propulsion technology that fit intended duty cycles.<br />
3. Phase in diesel-electric hybrid buses over three years on low-speed routes with frequent<br />
stops, to maximize their environmental benefits.<br />
4. Examine the use of fuel cell technology in accordance with the City’s 2004 Fleet<br />
Emission Reduction Strategy.<br />
5. Monitor opportunities to acquire zero-emission buses when they become commercially<br />
available.<br />
TRANSPORTATION MASTER PLAN Page 55<br />
NOVEMBER 2008
Chapter 6 – Roads and Motor Vehicle Use<br />
6.1 City of <strong>Ottawa</strong> Roads<br />
Roads are the backbone of <strong>Ottawa</strong>’s transportation system and, to a significant, extent of its<br />
economy. They serve pedestrians, cyclists, public transit and emergency services in addition to<br />
trucks and private automobile drivers. Within the realm of road planning, design and operation,<br />
the needs of these various users compete for the scarce resources of time, space and money. In<br />
managing its road network for the greatest public benefit, the City frequently must make difficult<br />
trade-offs.<br />
In order to guide the protection of rights-of-way and ensure that adequate width exists to<br />
accommodate needed roadway elements, City roads are classified according to their function as<br />
outlined in Figure 6.1. Roads of a similar function may vary in terms of their physical<br />
characteristics.<br />
Figure 6.1 – City Road Classification Framework<br />
Classification Primary Function Secondary Function<br />
City freeway<br />
Arterial road<br />
Major collector<br />
road<br />
Collector road<br />
Local road<br />
Serve “through” travel between points not<br />
accessed directly from the road itself<br />
Serve travel between collector and<br />
arterial roads<br />
Serve neighbourhood travel between local<br />
and major collector or arterial roads<br />
Provide direct access to adjacent lands<br />
None — direct access to adjacent<br />
lands is prohibited<br />
Provide direct access to<br />
adjacent lands<br />
Serve neighbourhood travel to and<br />
from collector or arterial roads<br />
In Section 2.4.1 this <strong>Plan</strong> projects an increase in the number of peak hour automobile trips despite<br />
increases in levels of walking, cycling and transit use. To avoid unacceptable levels of congestion<br />
that impede <strong>Ottawa</strong>’s social, economic and environmental objectives, the City will require some<br />
new and widened roads. The process of identifying these road needs is discussed below.<br />
First, future automobile volumes across key screenlines were estimated using the projected<br />
demand for automobile travel in 2031 (see Figure 2.10) and projected automobile occupancies<br />
(see Section 2.4.1). Based on an understanding of current capacities, road modifications to<br />
preserve a maximum 90% demand-to-capacity ratio were identified. System-wide operation at<br />
100% of capacity is not desirable because even minor collisions or weather impacts could lead to<br />
TRANSPORTATION MASTER PLAN Page 56<br />
NOVEMBER 2008
network instability and gridlock; operation at 90% of capacity is more efficient and would yield<br />
acceptable peak period congestion. Only in the Urban Core (bounded by the <strong>Ottawa</strong> River,<br />
Rideau River, Queensway and O-Train line) is operation at 100% of capacity acceptable for<br />
planning purposes – a position that reflects a greater tolerance for congestion and the physical<br />
impracticality of road expansion in that area.<br />
Other objectives may conflict with these level of service targets – for example, public safety will<br />
always be more important. Also, the quality of service for transit vehicles may be a higher<br />
priority than automobile delay in key transit corridors. The quality of service for cyclists will be<br />
more critical on roads that are part of the cycling network, and pedestrian needs will be a vital<br />
consideration in areas like the Byward Market.<br />
Annex B identifies the road network projects that are required to provide an acceptable level of<br />
service in 2031. Maps 6 through 9 illustrate the resulting future road network in urban and rural<br />
areas. Chapter 8 summarizes the costs and staging of the recommended projects.<br />
The City will:<br />
1. Adopt the road network and designation of freeways, arterial roads, major collector<br />
roads and collector roads shown on Maps 6 through 9. Consideration will be given to<br />
reclassifying individual roads in response to future land use and transportation system<br />
changes. In addition, the City may also consider the study of segments of the road<br />
network in regard to ways to mitigate traffic impacts on a community.<br />
2. Implement road infrastructure projects in accordance with the priorities identified in<br />
Chapter 8.<br />
6.2 Federal and Provincial Roads<br />
Provincial highways are a major part of <strong>Ottawa</strong>’s transportation system. The future City road<br />
network discussed in Section 6.1 was developed under the assumption that currently approved<br />
changes to provincial highways will be implemented; the City may have to revisit its analysis if<br />
additional future works are approved by the Province or studies are undertaken. The City is<br />
likely to favour provincial highway changes that improve safety and reduce emissions, but not<br />
those that have substantial neighbourhood impacts or increase congestion on City streets.<br />
Federal roads under the ownership of the National Capital Commission also play an important<br />
role in <strong>Ottawa</strong>’s transportation system, both from a functional perspective and as key scenic<br />
routes and tourist attractions. Notably, the <strong>Ottawa</strong> River is spanned by five roadway bridges<br />
under federal jurisdiction. This plan projects a substantial increase in total peak hour travel<br />
demand across these bridges by 2031 and, despite higher transit ridership, traffic volume<br />
increases will warrant an additional river crossing(s) by that time. The federal government, in<br />
conjunction with both provincial governments and affected municipalities, is currently<br />
undertaking a comprehensive evaluation of possible crossing locations.<br />
A primary consideration in the planning of a new <strong>Ottawa</strong> River crossing is its effectiveness as a<br />
truck route. This is a major factor because truck restrictions on existing bridges have concentrated<br />
TRANSPORTATION MASTER PLAN Page 57<br />
NOVEMBER 2008
trucks on King Edward Avenue and the Macdonald-Cartier Bridge, leading to trucking industry<br />
inefficiencies and negative community and environmental impacts along King Edward Avenue<br />
and elsewhere in the Central Area.<br />
Until the new <strong>Ottawa</strong> River crossing is constructed, it will be increasingly important for the<br />
federal government to cooperate with the municipal and provincial governments in Ontario and<br />
Quebec in implementing transit and TDM strategies, and modifying some existing bridges and<br />
their approaches to better meet transportation needs.<br />
The City will:<br />
1. Work with provincial and federal governments to develop a transportation system that<br />
supports the City’s growth management objectives.<br />
2. Work with the federal, Ontario and Quebec governments and the City of Gatineau to<br />
complete the environment assessment study for crossing(s) of the <strong>Ottawa</strong> River. Until<br />
the environmental assessment study receives final approval, the City will continue to<br />
prohibit development that could hinder the implementation of a river crossing(s) at<br />
identified potential crossing locations.<br />
3. Explore alternative means to accommodate interprovincial truck travel to minimize<br />
impacts on the Central Area, in particular along and in the vicinity of King Edward<br />
Avenue. Upon the completion of a new interprovincial corridor to accommodate<br />
trucks in a safe and efficient manner, the City will remove Rideau Street and King<br />
Edward Avenue from the City’s identified truck route system.<br />
6.3 Road Right-of-way Protection<br />
The City’s Official <strong>Plan</strong> identifies right-of-way widths to be protected for the road network<br />
discussed in Section 6.1 of this plan. The City can secure right-of-way for new roadways or the<br />
widening of an existing right-of-way from adjacent lands as a condition of development approval<br />
for a subdivision, severance or site plan. This includes the acquisition of lands required for corner<br />
triangles at intersections and railway crossings, and for auxiliary lanes (including turn lanes)<br />
where warranted by site traffic.<br />
It is important to note that, in some road corridors, the City will protect a right-of-way wider than<br />
strictly required to accommodate the road projects identified in Annex B. In other words, rightof-way<br />
sufficient for a four-lane road may be protected when only a two-lane road is required by<br />
2031. This is because right-of-way protection should ideally address “community build-out”<br />
conditions, and by 2031 some areas within <strong>Ottawa</strong> will not have reached that status.<br />
The City may require the exclusive use of a portion of certain road rights-of-way for transit<br />
priority operations, reserved bus lanes or light rail transit. In such cases, right-of-way<br />
requirements may increase and would be identified through future study.<br />
TRANSPORTATION MASTER PLAN Page 58<br />
NOVEMBER 2008
The City will:<br />
1. As set out in Annex A of the Official <strong>Plan</strong>, require landowners to provide land to the<br />
City for road widenings as a condition of site plan approval under Section 41 of the<br />
<strong>Plan</strong>ning Act, based on the following principles:<br />
a) Land will be conveyed at no expense to the City for road widening as a result of new<br />
development, changes in use that generate significant traffic volumes, or additions<br />
that substantially increase the size or usability of buildings or structures.<br />
b) Land may be reserved for future purchase as a result of additions that do not<br />
substantially increase the size or usability of buildings or structures.<br />
c) Except where specifically indicated otherwise in Annex 1 of the Official <strong>Plan</strong>, land<br />
for widening will be taken equally from both sides of a road, measured from the<br />
centreline in existence at the time of site plan application. The centreline is a line<br />
running down the middle of a road surface, equidistant from both edges of the<br />
pavement. In determining the centreline, paved shoulders, bus lay-bys, auxiliary<br />
lanes, turning lanes and other special circumstances are not included in the road<br />
surface.<br />
d) Additional land may be required for sightlines at intersections, potential gradeseparations<br />
at railway crossings, stream crossings and auxiliary turning lanes, in<br />
conformance with City standards.<br />
2. Require landowners to provide land as a condition of subdivision or consent<br />
applications under Section 51 of the <strong>Plan</strong>ning Act to provide for roads, pedestrian<br />
pathways, bicycle pathways and public transit rights of way as required by the City.<br />
3. When required, acquire from landowners right-of-way lands for new roads or road<br />
widenings, as set out in Annex 1 of the Official <strong>Plan</strong>, where such lands have not been<br />
obtained by policies 1 or 2 above.<br />
4. Where appropriate for reasons that may include preservation of built or natural<br />
heritage features, consider waiving the requirement for land dedication from adjacent<br />
sites for road rights-of-way, or reducing the amount of land to be dedicated, in<br />
accordance with policies in the Official <strong>Plan</strong>.<br />
6.4 Road Design<br />
The design of roads should express the general values and preferences of City residents, including<br />
those related to safety, mobility and aesthetics. While some City roads function as scenic routes,<br />
parkways, or urban or village mainstreets, others pass through the Greenbelt or heritage districts.<br />
Each setting requires a road to perform different functions, and for this reason each road must be<br />
sensitive to its immediate context.<br />
TRANSPORTATION MASTER PLAN Page 59<br />
NOVEMBER 2008
Because roads should reflect their urban or rural context, the City has produced design guidelines<br />
for urban and rural arterial roads, and for collector and major collector roads. These guidelines<br />
balance the need for roads to serve as public space, to provide access to adjacent lots, and to<br />
allow the movement of services, utilities and people by various modes. The City has also adopted<br />
a right-of-way lighting policy that applies to all roads including local streets.<br />
The City will:<br />
1. Apply design guidelines for new, widened and reconstructed roads that emphasize<br />
compatibility with adjacent land uses, enhance the safety and security of all users,<br />
maximize greening opportunities and offer supportive environments for walking,<br />
cycling and transit use. The City’s Arterial Road Corridor Design Guidelines will be<br />
applied to urban arterial roads and Village mainstreets, and the Urban/Rural Collector<br />
and Rural Arterial Road Design Guidelines will be applied to rural arterial roads and to<br />
urban, rural and Village collector roads.<br />
2. Consider measures such as on-street parking, walking and cycling improvements,<br />
streetscaping, lane reductions or transit enhancements for roads identified as<br />
mainstreets or collectors in the Official <strong>Plan</strong>, particularly in Town Centres and Mixed-<br />
Use Centres.<br />
3. When reviewing development applications, Official <strong>Plan</strong> amendments or concept plans,<br />
ensure that the roadway network provides:<br />
a) Collector roads that link several adjacent developments with direct transit routes.<br />
b) A local road layout minimizing culs-de-sac and crescents that increase travel<br />
distances for pedestrians, cyclists and transit vehicles.<br />
c) A street pattern for large redevelopments compatible with surrounding street<br />
patterns.<br />
d) An arrangement whereby virtually all potential building sites are within a 400-<br />
metre walking distance of a rapid transit station or bus stop.<br />
e) Public access unimpeded by security gates or similar barriers.<br />
4. Provide access to developments in accordance with the intended function of each road<br />
as outlined in Figure 6.1, and considering the City’s road safety and system<br />
performance objectives.<br />
5. Minimize, where possible, the use of roadside noise attenuation barriers through design<br />
options such as internal single-sided roads adjacent to arterial roads.<br />
6. Ensure the collaborative design and integration of green space on both the public road<br />
allowance and private property, particularly at intersections, to create an attractive<br />
streetscape.<br />
TRANSPORTATION MASTER PLAN Page 60<br />
NOVEMBER 2008
7. Consider the use of roundabouts and similar measures when approving subdivision<br />
road networks and reconstructing intersections, where the safety and security of<br />
pedestrians and cyclists would not be compromised.<br />
8. Consider the use of “road diets” to reduce the number of traffic lanes (usually from four<br />
to two or three) and improve facilities for walking and cycling, when reconstructing<br />
collector roads.<br />
9. Apply the Right-of-Way Lighting policy for public roads and sidewalks.<br />
10. Generally not permit new accesses to Highway 174 east of Trim Road, despite that<br />
road’s arterial road classification, to preserve a safe travel environment in view of its<br />
high traffic speeds and volumes.<br />
6.5 Road Safety<br />
In developing and managing its transportation system, the City of <strong>Ottawa</strong> gives high priority to<br />
public safety. While facilities are initially built to optimize safety, it is possible for operating<br />
environments and user expectations to change over time. Without additional preventative<br />
measures, undesirable conditions and behaviours can develop that lead to damage, injury and<br />
death. It should also be recognized that perceptions related to safety can influence individuals’<br />
choice of travel modes, and safety-related initiatives can play a role in the achievement of the<br />
City’s objectives for walking, cycling and transit use. Road safety is a multidisciplinary<br />
endeavour that addresses road users, road environments and vehicles through public education<br />
and awareness, applied road safety engineering principles, enhanced enforcement, advanced<br />
technology and information systems, and communication and collaboration among road safety<br />
agencies. The City’s Integrated Road Safety Program is a proven vehicle for coordinating<br />
interagency efforts and developing community-based partnerships.<br />
In 2007, collisions in <strong>Ottawa</strong> led to 40 deaths and about 4,200 injuries, with almost 12,200<br />
collisions resulting in property damage only. The total estimated social cost of these collisions is<br />
over $1 billion according to the Ontario Ministry of <strong>Transportation</strong>’s “willingness to pay” model.<br />
The overall collision rate in <strong>Ottawa</strong> was unchanged from 1997 to 2007, at 32 collisions per 1,000<br />
registered vehicles.<br />
Road safety experts agree that most collisions are no accident, and are preventable – in fact, more<br />
than 80% of collisions result at least partly from human error. The City’s goal for road safety,<br />
which parallels a national goal set by Transport Canada, is a 30% reduction in the number of<br />
fatalities or serious injuries due to collisions for 2008 to 2010, compared to 1998 to 2002. When<br />
Transport Canada sets a new goal for beyond 2010, the City will likely adopt it.<br />
The City will:<br />
1. Prepare a Road Safety <strong>Plan</strong> that will:<br />
a) Align the City’s road safety goals with those of Transport Canada for 2010 and<br />
beyond.<br />
TRANSPORTATION MASTER PLAN Page 61<br />
NOVEMBER 2008
) Identify techniques to evaluate the need for and potential effectiveness of safety<br />
initiatives, using a systems approach.<br />
c) Coordinate road safety efforts in the areas of transportation, health and policing.<br />
d) Establish road safety partnerships with public agencies, the private sector and<br />
community groups.<br />
e) Provide safety-related input to City guidelines for road planning, design,<br />
maintenance and operation, taking into account issues such as collisions, best traffic<br />
safety practices, enforcement resources, and the needs of all road users particularly<br />
those who are vulnerable.<br />
f) Develop road safety strategies specific to rural roads.<br />
2. Report annual road safety results to demonstrate the City’s progress toward its goals.<br />
3. Establish an integrated, GIS-based collision and traffic volume database that enables<br />
advanced road safety monitoring and management initiatives, such as a road network<br />
screening program to systematically compare and rank roads based on defined safety<br />
performance criteria.<br />
4. Conduct corridor- and intersection-based road safety audits that lead to safety plans<br />
with varying time horizons.<br />
5. Conduct engineering-based programs such as the Safety Improvement Program,<br />
Roadside Safety Program and Rail Crossing Safety Program.<br />
6. Conduct programs for children such as the School Zone Traffic Safety Program, Kiss<br />
and Ride Program and Adult School Crossing Guard and Outreach Program, and<br />
support other programs such as Active and Safe Routes to School.<br />
7. Identify, evaluate and implement leading road safety technologies and methodologies,<br />
where practical, based on best practices and industry research.<br />
8. Conduct initiatives to promote public awareness and understanding of safe, courteous<br />
and lawful travel behaviour by drivers, cyclists and pedestrians, common collision<br />
causes, and the benefits gained from collision reduction.<br />
9. Coordinate with police on enforcement initiatives against unsafe behaviours by all road<br />
users<br />
6.6 Road Corridor Optimization<br />
In recognition of the transportation system management (TSM) principles discussed in<br />
Section 3.4, it is desirable to take an integrated approach to optimizing arterial road operations.<br />
While optimization efforts strive principally to eliminate bottlenecks that create delay and<br />
compromise safety for road users, they address multiple modes (e.g. pedestrians, cyclists, transit<br />
vehicles, trucks and automobiles), multiple objectives (e.g. safety, delay, emissions, aesthetics,<br />
ease of maintenance), and multiple dimensions of the corridor itself (e.g. signalized and<br />
TRANSPORTATION MASTER PLAN Page 62<br />
NOVEMBER 2008
unsignalized intersections, connecting links, driveways, signage and markings). This breadth of<br />
perspective permits trade-offs to be made explicitly and with the involvement of relevant<br />
stakeholders.<br />
Corridor optimization measures include:<br />
• Road signs, markings and regulations<br />
• Traffic signal coordination and progression<br />
• Minor roadway modifications including accessory lanes at intersections<br />
• Relocation, consolidation or elimination of driveways to reduce conflicts among motor<br />
vehicles, pedestrians and cyclists<br />
• Creation, modification or removal of taxi stands, loading zones and on-street parking<br />
• Video monitoring of road operations<br />
• Traveler information systems including variable message signs or wireless communications<br />
As discussed in Section 6.1, pursuing targeted service levels for motor vehicle traffic is not the<br />
City’s sole and primary concern. Public safety is paramount, and service to non-automobile<br />
modes may take precedence in transit priority corridors, designated cycling routes, and<br />
pedestrian-focused neighbourhoods like the Byward Market, and other locations.<br />
The City will:<br />
1. Conduct a Corridor Optimization Program that will identify, evaluate and implement<br />
actions to optimize the operation of individual freeway and arterial road corridors. This<br />
process will integrate considerations related to facility capacity, delay to passengers and<br />
freight, access to adjacent properties, vehicular emissions, safety for all road users, and<br />
conditions for walking, cycling, transit and carpooling.<br />
6.7 Area Traffic Management<br />
Area traffic management preserves quality of life in neighbourhoods by mitigating undesirable<br />
effects of motor vehicle use, including excessive volumes and speeds, aggressive driver<br />
behaviour and hostile conditions for walking and cycling. It addresses the needs of<br />
neighbourhood residents and businesses, as well as road users.<br />
The City’s Area Traffic Management Guidelines discuss the prioritization of study requests,<br />
techniques for public consultation, and approaches to analysis and monitoring. The document also<br />
offers guidance for the use of traffic calming measures, which represent one part of the City’s<br />
area traffic management “toolbox”.<br />
It is important to recognize the link between area traffic management and corridor optimization<br />
(Section 6.6.). Some neighbourhoods experience unacceptable cut-through traffic volumes as a<br />
result of congestion on arterial roads, and while area traffic management tools can mitigate the<br />
TRANSPORTATION MASTER PLAN Page 63<br />
NOVEMBER 2008
impacts of this traffic a more complete solution may involve optimizing arterial road operations<br />
and reducing the incentive for drivers to seek a short cut through neighbourhood streets.<br />
The City will:<br />
1. Conduct an Area Traffic Management program that applies the Area Traffic<br />
Management Guidelines to improve the quality of life in neighbourhoods by consistently<br />
and equitably resolving public concerns about the undesirable effects of motor vehicle<br />
travel.<br />
2. Apply a wide range of area traffic management tools, as appropriate, including road<br />
network modifications, traffic control devices, traffic calming measures, streetscaping,<br />
enforcement, transportation demand management and public education, while striving<br />
to improve conditions for walking, cycling and transit use.<br />
6.8 Ridesharing<br />
It is better for two or more people to share a ride than for each person to drive alone. However,<br />
demographic shifts and growing personal wealth have been causing North American auto<br />
occupancies to decline, and in <strong>Ottawa</strong> the average in the morning peak hour has declined from<br />
1.26 persons per vehicle in 1986 to 1.23 in 2005. In <strong>Ottawa</strong>’s morning peak period about 21% of<br />
cars have multiple occupants, but not all of these are true carpools — for example, a car driven by<br />
a parent taking their child to school is more of a “family taxi.” Looking more specifically at<br />
commuter carpools, the 2006 Canadian census found an average occupancy of 1.13 workers per<br />
car in <strong>Ottawa</strong>-Gatineau (given that 60.4% of commuters drove and 7.7% were automobile<br />
passengers).<br />
This plan’s objective of maintaining current automobile occupancies is an ambitious one. In<br />
<strong>Ottawa</strong>’s downtown and other areas that enjoy high-quality transit service, ridesharing is unlikely<br />
to compete well with transit because it does not offer carpoolers the independence of schedule<br />
that transit riders enjoy. However, there will continue to be commuters who do not have attractive<br />
transit options and who travel far enough that walking and cycling are impractical. It is preferable<br />
for these commuters to carpool rather than drive alone, and City efforts to improve and promote<br />
ridesharing should focus on attracting them. The following text discusses the City’s three main<br />
tools for doing so: TDM measures, carpool lots and carpool lanes.<br />
TDM measures. A number of measures that can effectively encourage ridesharing will be<br />
delivered through the City’s TDM program. Section 2.3 describes some of these, including<br />
working with employers and educational institutions to provide incentives such as preferential<br />
parking to their employees and students, conducting annual events including the Commuter<br />
Challenge and Rideshare Week, and testing the effectiveness of individualized household<br />
marketing. Other specific initiatives are highlighted in the following policies, including raising<br />
awareness of carpool lanes and lots in the <strong>Ottawa</strong> area, promoting the City’s online ridematching<br />
service, and studying the feasibility of a regional vanpooling service.<br />
TRANSPORTATION MASTER PLAN Page 64<br />
NOVEMBER 2008
Carpool lots. Carpool lots encourage ridesharing by letting long-distance rural commuters meet<br />
and park their extra vehicles for the day. The City operates one carpool parking lot on Carp Road<br />
south of Highway 417, and the Ontario Ministry of <strong>Transportation</strong> has several in the area:<br />
• Two along Highway 416 at Bankfield Road (<strong>Ottawa</strong> Road 8) and Rideau River Road (<strong>Ottawa</strong><br />
Road 19)<br />
• Two along Highway 7 at Cemetary Road (near Carleton Place) and Dwyer Hill Road (<strong>Ottawa</strong><br />
Road 3)<br />
• Highway 417 at Panmure Road and at <strong>Ottawa</strong> Road 5 (near Limoges)<br />
• Highway 17 at Kinburn Side Road<br />
• March Road (<strong>Ottawa</strong> Road 49) at Dwyer Hill Road (<strong>Ottawa</strong> Road 3)<br />
Greater use of these lots may be encouraged through more effective promotion, security and other<br />
incentives. It should be noted that the City’s Park & Ride lots do not permit carpool parking due<br />
to high occupancy levels.<br />
Carpool lanes. Carpool lanes are open to vehicles with a minimum number of occupants (usually<br />
two or three), buses and typically taxis. They may have limited hours of operation, and be open to<br />
all traffic at other times. They may extend the length of a freeway corridor, or (in the case of<br />
queue jump lanes) be limited to a single intersection approach. Potential challenges with carpool<br />
lanes include negative public response due to poor planning or design, and the need for effective<br />
enforcement through policing and public education. Carpool lanes also preclude the use of transit<br />
priority measures that offer exclusivity for buses.<br />
There are no carpool lanes on City roads (although there is a 2+ lane on the Champlain Bridge<br />
and a 3+ lane on the Portage Bridge between <strong>Ottawa</strong> and Gatineau, and 2+ lanes are soon to open<br />
on Highway 417 between Moodie Drive and Palladium Drive). During development of the 2003<br />
<strong>Transportation</strong> <strong>Master</strong> <strong>Plan</strong>, a preliminary assessment of the City’s arterial roads identified those<br />
where carpool lanes could support the City’s objectives, taking into consideration congestion<br />
levels, transit and carpool volumes, trip lengths, physical and operational constraints, and<br />
adjacent land uses. The assessment considered opportunities to create carpool lanes both through<br />
conversion of existing lanes and through designation of new lanes constructed for general<br />
capacity purposes. It found the greatest potential to encourage ridesharing through carpool lanes<br />
on the following roads (noting that these are preliminary results requiring much further study, and<br />
that some roads have a possibly conflicting designation as future transit priority corridors as<br />
shown on Map 4a):<br />
• <strong>Ottawa</strong> Road 174 – between Highway 417 (split) and Jeanne d’Arc<br />
• Eagleson Road — between Highway 417 and Terry Fox Drive<br />
• March Road — between Terry Fox Drive and Highway 417<br />
• Hunt Club Road — between Highway 416 and Highway 417<br />
• Innes Road — between St. Laurent Boulevard and Trim Road<br />
TRANSPORTATION MASTER PLAN Page 65<br />
NOVEMBER 2008
• Industrial Avenue — between St. Laurent Boulevard and Riverside Drive<br />
• Innes-Walkley Connection<br />
• Conroy Road/Alta Vista <strong>Transportation</strong> Corridor — between Hunt Club Road and Riverside<br />
Drive<br />
• Prince of Wales Drive — between Woodroffe Avenue and Hunt Club Road<br />
• Riverside Drive — between Hunt Club Road and Highway 417<br />
• Rideau Street/Montreal Road Corridor — between downtown and Blair Road<br />
• Richmond Road — between Moodie Drive and Carling Avenue<br />
• Bank Street — between Leitrim Road and Walkley Road<br />
The City will:<br />
1. Develop a Ridesharing Strategy that recommends specific initiatives involving TDM<br />
measures, carpool lots and carpool lanes to increase ridesharing in key travel markets,<br />
nodes and corridors. The city will invite the participation of key partners including the<br />
National Capital Commission, Ontario Ministry of <strong>Transportation</strong>, City of Gatineau<br />
and adjacent municipalities in Ontario.<br />
2. Conduct initiatives to promote positive public attitudes towards ridesharing, awareness<br />
of its personal and environmental benefits, and understanding of how to use area<br />
carpool lanes and carpool lots.<br />
3. Promote the City’s online ridematching service (<strong>Ottawa</strong>RideMatch.com) in target<br />
markets such as large employers, post-secondary institutions, rural villages and<br />
adjacent municipalities, both independently and through partnerships with other levels<br />
of government, employers and educational institutions.<br />
4. Work with provincial governments and adjacent municipalities in Ontario and Quebec<br />
to study the feasibility of a regional vanpooling service to reduce the number of lengthy<br />
interprovincial and rural-urban car commutes.<br />
5. Provide guidance and tools to employers, developers and building operators to help<br />
them provide, manage and enforce preferential carpool parking spaces.<br />
6. Routinely consider the potential to operate curb lanes on new or widened roadways as<br />
carpool lanes.<br />
7. Consider impacts on safety and quality of service for transit users and cyclists when<br />
planning and implementing carpool lanes on arterial roads.<br />
8. Ensure effective enforcement of occupancy regulations for any City carpool lanes, and<br />
encourage similar enforcement for carpool lanes under federal or provincial<br />
jurisdiction.<br />
TRANSPORTATION MASTER PLAN Page 66<br />
NOVEMBER 2008
6.9 Taxis<br />
Taxis play a unique role in <strong>Ottawa</strong>’s transportation system, and complement walking, cycling,<br />
transit and ridesharing as alternatives to driving. They are an important mobility option for<br />
business travelers and visitors to <strong>Ottawa</strong>, for seniors and persons with disabilities, and for many<br />
other residents when other choices are unavailable. The taxi industry can help achieve <strong>Ottawa</strong>’s<br />
objectives by offering a travel option linking rural and urban areas, and integrating with other<br />
travel modes.<br />
At this time, the city administers the issuance of taxi licenses and vehicle inspections.<br />
The City will:<br />
1. Enhance taxi services for persons with physical disabilities through the issuance of<br />
plates for accessible taxi cabs, and periodically monitor their priority use by such<br />
persons.<br />
2. Require large-scale commercial and office building, institutional developments and<br />
hotels to make provision for taxi stands on their private properties, where needed to<br />
avoid negative impacts from on-street taxi stands.<br />
3. Work with public and private sector partners to enhance the provision of taxi stands at<br />
strategic locations including major intermodal hubs such as rapid transit stations,<br />
airports, and rail and bus stations.<br />
4. Continue to provide direct telephone access to taxi dispatch in selected rapid transit<br />
stations and Park & Ride lots.<br />
5. Work with the taxi industry to improve connectivity with transit services, such as<br />
through the use of advanced communication technologies.<br />
6.10 Goods Movement<br />
While efficient goods movement by truck, rail and air supports <strong>Ottawa</strong>’s economic livelihood and<br />
competitiveness, trucks remain the primary mode of local freight transportation.<br />
<strong>Ottawa</strong>’s truck route system is generally represented by arterial roads that can withstand use by<br />
heavy trucks, the sizes of which are legislated by the Province of Ontario. Designation of truck<br />
routes must consider noise, vibrations, emissions and safety impacts. In general, trucking impacts<br />
on residential areas can be minimized by providing several alternative routes, so that impacts are<br />
not concentrated in one area. Because reduced routing options also increase costs, trucking<br />
restrictions on an arterial roads should be considered only where community impacts are<br />
significant, where the road in question serves exclusively non-commercial land uses, and where<br />
adequate alternative routes are available. Encouraging the use of rail, rather than trucks, to move<br />
goods, can also reduce the community impacts of trucking.<br />
Section 6.2, Federal and Provincial Roads, should also be referenced for interprovincial truck<br />
goods movement.<br />
TRANSPORTATION MASTER PLAN Page 67<br />
NOVEMBER 2008
The City will:<br />
1. Maintain a comprehensive network of designated truck routes, relying primarily on<br />
freeways, highways and arterial roads, that provide access to industrial and commercial<br />
areas while minimizing impacts on residential areas, and produce and distribute an upto-date<br />
truck route map to industry representatives in partnership with other agencies.<br />
2. Work with other governments and the private sector to explore ways that through truck<br />
traffic in the Central Area, particularly on King Edward Avenue, can be reduced while<br />
ensuring the safe and efficient movement of goods.<br />
3. Consider trucking needs in road construction and rehabilitation through appropriate<br />
design standards and the inclusion of features such as on-street loading areas.<br />
4. Monitor opportunities for road rehabilitation to enhance the truck route network by<br />
enabling adjusted or removed seasonal weight restrictions.<br />
5. Encourage industry to explore goods movement technologies and practices that can<br />
reduce community impacts, improve efficiency and enhance regional competitiveness,<br />
such as the development of intermodal terminals that enable a transfer of tonnage from<br />
road to rail.<br />
6. Ensure that noise and vibration issues are addressed by following City’s Environmental<br />
Noise Control Guidelines for land uses adjacent to roads, railway corridors and terminal<br />
facilities.<br />
7. Conduct surveys of goods movement on a regular basis to quantify demand<br />
characteristics, the use of arterial roads, and the congestion, noise and safety impacts on<br />
the community and industry.<br />
6.11 Parking<br />
Parking is a strategic tool for city-building. By effectively managing its supply and price,<br />
governments can influence how people choose to travel and promote a behavioural shift from<br />
driving to transit use and other alternatives to automobile usage. By guiding the appropriate<br />
location and design of parking in new developments, the City can also support the creation of<br />
more compact communities. However, these strategic considerations are challenged by the<br />
concerns of employers, stores service providers and tourism destinations where employees,<br />
customers and visitors arrive in automobiles, whether by need or choice. In this way, short-term<br />
economic and practical realities are brought into conflict with longer-term goals – making<br />
parking one of the more challenging issues addressed in this plan.<br />
Bearing in mind these considerations, the City’s strategic parking objectives are:<br />
• To provide short-term parking that supports the needs of local businesses, residents,<br />
institutions and tourism destinations<br />
• To limit the supply of long-term parking in a manner that balances transit ridership objectives<br />
with the needs of automobile users<br />
TRANSPORTATION MASTER PLAN Page 68<br />
NOVEMBER 2008
• To support intensification and minimize the amount of land devoted to parking through<br />
measures such as parking structures and arrangements to share parking among land uses<br />
In support of these objectives, the City of <strong>Ottawa</strong>’s parking services include on-street parking,<br />
several off-street parking lots and garages, public bicycle parking and parking enforcement. The<br />
City also influences the supply of parking in new developments, and has some regulatory control<br />
over privately run off-street public parking lots. Recent changes to the City’s new Zoning By-law<br />
included: harmonizing parking rate requirements; reducing parking rates for employment,<br />
institutional and retail uses near rapid transit stations; providing shared parking provisions for<br />
combinations of land uses with different peak periods of parking usage; introducing parking rate<br />
reduction in circumstances where bicycle change rooms and shower facilities are provided, or<br />
when underground rather than surface parking is provided; and introducing expanded and new<br />
bicycle parking provisions.<br />
The following policies address on-street and off-street parking and touch on matters discussed in<br />
Chapter 3 (land use), Chapter 4 (bicycle parking), Chapter 5 (Park & Ride lots), and Chapter 6<br />
(carpool parking).<br />
The City will:<br />
1. Develop a Municipal Parking Management Strategy in 2009 that:<br />
a) Defines a program to regularly examine public parking needs, evaluate alternatives<br />
and recommend on-street and off-street solutions in key areas including but not<br />
limited to the downtown, Business Improvement Areas and Town Centres<br />
b) Identifies parking policies and programs to support intensification and residential<br />
development in targeted areas<br />
c) Establishes guidelines for parking pricing, with key parameters including rates,<br />
hours, locations and vehicle types<br />
d) Identifies opportunities to support the parking needs of cyclists, carpoolers and<br />
private carshare companies, and examines the parking requirements of scooter,<br />
moped and motorcycle riders<br />
e) Reflects transportation demand management (TDM) principles and objectives<br />
(Section 3.3) and identifies synergies between parking and TDM initiatives<br />
f) Recommends an appropriate allocation of parking revenues to support parking<br />
programs, parking infrastructure development and TDM initiatives that defer or<br />
negate the need for new parking infrastructure<br />
g) Recommends approaches to provide transparency and clarity through<br />
communication with stakeholders about the parking program’s goals and<br />
objectives, financial status and infrastructure investment plans<br />
2. Periodically review the City’s Zoning By-law to ensure that minimum and maximum<br />
parking requirements for new developments (particularly commercial, retail and multi-<br />
TRANSPORTATION MASTER PLAN Page 69<br />
NOVEMBER 2008
unit residential uses) support municipal objectives for compact development and more<br />
sustainable transportation behaviours.<br />
3. Update the City’s Cash-in-Lieu of Parking policy to reflect the City’s growth<br />
management principles to ensure consistency with objectives and activity related to<br />
development and parking programs in the relevant areas of <strong>Ottawa</strong>.<br />
4. Support the availability of short-term parking for business (retail and service),<br />
institutional, residential and tourism uses, particularly those in the Central Area and<br />
inner city neighbourhoods, by:<br />
a) Providing on-street parking that does not compromise multimodal safety or service<br />
level targets<br />
b) Giving priority to serving short-term users in City-controlled parking facilities<br />
c) Providing City-operated short-term parking in mixed use developments<br />
5. Discourage the temporary use of vacant lands for long-term parking.<br />
6. Conduct a pilot project to showcase proactive parking management strategies in<br />
Centrepointe mixed-use centre, a transit-oriented development node where the City has<br />
considerable landholdings and an opportunity to maximize transit ridership.<br />
7. Prepare a tour bus parking strategy in partnership with other levels of government,<br />
institutions, tour operators, and tourism authorities.<br />
8. Conduct marketing initiatives that, among other objectives:<br />
a) Encourage the use of off-street parking lots rather than on-street parking<br />
b) Involve Business Improvement Areas and other partner agencies<br />
c) Measure overall marketing performance and customer satisfaction<br />
TRANSPORTATION MASTER PLAN Page 70<br />
NOVEMBER 2008
Chapter 7 – Intercity Travel<br />
The transportation linkages between <strong>Ottawa</strong> and the rest of the world support the city’s economic<br />
well-being. This plan discusses the many direct connections to other municipalities, including<br />
interprovincial transit services (Section 5.2) and the roads and bridges to neighbouring<br />
municipalities (Chapter 6). There are also two privately operated ferries to Gatineau in <strong>Ottawa</strong>’s<br />
west and east ends.<br />
This chapter discusses other important linkages provided by the aviation, rail and intercity bus<br />
industries.<br />
7.1 Intercity Passenger Terminals<br />
The air, rail and intercity bus industries are all served by major terminals in <strong>Ottawa</strong>. The City has<br />
a major interest in providing appropriate linkages between these terminals and the local<br />
transportation system, and can enhance service or reduce costs by grasping opportunities to<br />
introduce joint facilities or services with intercity carriers.<br />
This plan calls for enhancement of the existing high-quality bus rapid transit service to the<br />
<strong>Ottawa</strong> Macdonald-Cartier International Airport, through the extension of a rail rapid transit line<br />
to the airport. A new rapid transit line integrated with airport terminal facilities would offer the<br />
highest possible level of service to travelers as well as the many employees in the airport area.<br />
The two VIA Rail stations in <strong>Ottawa</strong>, including the main station on Tremblay Road and the<br />
Fallowfield station on Woodroffe Avenue, are successfully integrated with rapid transit stations.<br />
Travelers arriving in <strong>Ottawa</strong> by intercity bus lines could benefit from better integration of the<br />
Catherine Street bus terminal with rapid transit services, and any future opportunity to relocate<br />
the existing bus terminal should strive to do so. It should be noted that some intercity bus routes<br />
are permitted to travel on the Transitway for part of their journey into or out of <strong>Ottawa</strong>, and<br />
passengers can transfer from one service to the other at Transitway stations.<br />
The City will:<br />
1. Support the development of intercity passenger terminals that serve two or more travel<br />
modes, such as through the integration of intercity bus and/or rail stations with rapid<br />
transit facilities.<br />
2. Maintain high-quality roadway connections and rapid transit services to the <strong>Ottawa</strong><br />
Macdonald-Cartier International Airport.<br />
3. Support the continued use of the Transitway by intercity buses.<br />
TRANSPORTATION MASTER PLAN Page 71<br />
NOVEMBER 2008
7.2 General Aviation<br />
General aviation includes flight training operations, air taxi and charter operations, aircraft<br />
maintenance organizations and the supporting industry. It represents a majority of aircraft<br />
movements, and moves people in ways that airlines cannot. Small airports provide services such<br />
as on-demand charter, business and personal travel, flight training, medical evacuation, just-intime<br />
parts delivery, aerial police patrols, and supply lines to remote communities.<br />
In <strong>Ottawa</strong> general aviation supports commerce, government and recreation. The city’s three<br />
general aviation airports are Carp Airport, Rockcliffe Airport and the North Field of the<br />
Macdonald-Cartier Airport; in Quebec, the City of Gatineau Airport plays a similar and<br />
complementary role.<br />
As a result of policy changes in the 1990s, the federal government off-loaded Carp Airport to<br />
local government and in 2005 the City approved a master development plan for the Carp Airport<br />
that provided for retention and development of the core airport area, and development of aviation<br />
related land uses components including an aerospace business park and an accessory residential<br />
fly-in community.<br />
The City will:<br />
1. Provide adequate ground transportation routes to general aviation facilities, in<br />
recognition of their important role in the community.<br />
TRANSPORTATION MASTER PLAN Page 72<br />
NOVEMBER 2008
Chapter 8 – Implementation<br />
The <strong>Transportation</strong> <strong>Master</strong> <strong>Plan</strong> requires numerous improvements to transportation infrastructure,<br />
services and programs over the planning horizon. Implementation will involve the following key<br />
processes:<br />
<br />
<br />
<br />
<br />
Securing the funding required to build planned transportation facilities and operate an<br />
expanded transportation system<br />
Allocating funding for the delivery of identified transportation services and programs<br />
Directing strategic investments through monitoring of transportation system performance and<br />
land development<br />
Incorporating transportation solutions from corridor-level or sub-area plans.<br />
The successful implementation of the <strong>Transportation</strong> <strong>Master</strong> <strong>Plan</strong> requires that concurrent efforts<br />
be undertaken to achieve the key strategies set out in Chapter 3, such as, creating supportive land<br />
uses and managing transportation demand, and to construct the transportation infrastructure<br />
identified in this chapter. To aid in the implementation process the City intends to produce a<br />
<strong>Transportation</strong> Outlook (Section 8.3) that will help guide short-term decision-making on<br />
infrastructure priorities versus this <strong>Plan</strong>, which presents a phasing and longer-term outlook on<br />
such matters.<br />
8.1 Capital Works <strong>Plan</strong><br />
<strong>Transportation</strong> system improvements will be made based on need, as determined through<br />
monitoring of transportation system performance and land development, and the City’s ability to<br />
pay for them.<br />
Figures 8.1 to 8.4 identify the implementation phasing of the required infrastructure projects in a<br />
manner that will provide desired transportation service levels to a growing population. The<br />
phasing provides the basis for preparation of annual budgets and long range financial plans.<br />
Wherever possible, attempts will be made to shorten the timeline for delivery of these projects.<br />
While time phases have been identified for reference purposes, it is population levels that<br />
determine transportation demand rather than simply the passing of time. The indicated time<br />
horizons must therefore be considered to be approximations subject to change.<br />
As noted above, the City’s ability to pay for projects will influence its project priorities and the<br />
rate of implementing them. The current Capital Budget document has identified a substantial<br />
“funding gap” in the City’s ability to pay for new capital projects. If the City cannot tap into new<br />
revenue sources, it will have to consider a range of possible solutions including program<br />
cutbacks, adjustments in standards and service levels, deferral of infrastructure, constraints on<br />
growth, user fees or tax rate increases. The annual budget process will remain the City’s principal<br />
TRANSPORTATION MASTER PLAN Page 73<br />
NOVEMBER 2008
forum for deciding how to spend available capital funds. Funding shortfalls will require choices<br />
to be made among different projects.<br />
Figures 8.1 to 8.4 present the key transportation infrastructure projects for respectively: walking<br />
and multi-use pathways, cycling, transit and road. Annex A provides additional project details.<br />
Table 8.1<br />
Phasing of Required Walking and Multi-use<br />
Pathway Infrastructure Projects<br />
Project<br />
Algonquin / Woodroffe Avenue<br />
Pedestrian Overpass<br />
Alta Vista <strong>Transportation</strong> Corridor<br />
Bayview Station / <strong>Ottawa</strong> River<br />
Pathway link<br />
Coventry Road / Baseball Stadium<br />
Pedestrian Crossing<br />
Rural<br />
Prescott-Russell Pathway linkage<br />
Woodroffe Avenue Corridor<br />
Carp River / Terry Fox Drive<br />
Corridor<br />
Greenbank Road Corridor<br />
Jock River Corridor<br />
Prince of Wales Drive Corridor<br />
Riverside Drive / River Road<br />
Corridor<br />
Alta Vista Drive to Ogilvie Road<br />
Corridor<br />
Earl Armstrong Road Corridor<br />
Eastern Corridors<br />
Limits<br />
PHASE 1 2009-2015<br />
From Algonquin College to the Baseline Transitway Station<br />
From Hurdman Transit Station / Rideau River to Alta Vista <strong>Transportation</strong><br />
Corridor to existing trail on Conroy Road<br />
From the Bayview O-Train Station to the <strong>Ottawa</strong> River Pathway<br />
From the baseball stadium to the Train Transitway Station<br />
Along former CP (now VIARail) rail corridor between eastern border of<br />
the City and Innes Road (west of Highway 417)<br />
From Baseline Transitway Station to Fallowfield Road; Fallowfield to<br />
Greenbank via rail/transit corridor<br />
PHASE 2 2016-2022<br />
Along the Carp River and the Terry Fox Drive corridor from North Kanata<br />
to South Kanata<br />
Reconstruction of pathway through the Greenbelt; construction of new<br />
pathways from Southern Corridor to Hunt Club Road, and Fallowfield to<br />
Jock River Corridor<br />
Along Jock River from Highway 416 to Prince of Wales Drive<br />
Hogs Back Road to southern limit of the Greenbelt<br />
Hunt Club Road to southern limit of the Greenbelt<br />
PHASE 3 2023-2031<br />
From <strong>Ottawa</strong> Hospital General Campus through industrial and rail lands<br />
over the Queensway to Ogilvie Road and the Aviation Parkway<br />
River Road to Greenbelt at Bowesville Leitrim Road; parallels road<br />
corridor<br />
From Alta Vista <strong>Transportation</strong> Corridor to Southern Cross-town Corridor<br />
TRANSPORTATION MASTER PLAN Page 74<br />
NOVEMBER 2008
Project<br />
Limits<br />
Orléans South Corridor From Greenbelt at Navan Road to Cardinal Creek via Blackburn Bypass /<br />
transit and hydro corridor<br />
Sawmill Creek Corridor via Airport<br />
Parkway<br />
Following Sawmill Creek from the Rideau River to Hunt Club and to<br />
Blossom Park<br />
Trim Road / Cardinal Creek<br />
Southern Cross town Corridor<br />
From Petrie Island to Frank Kenny Drive<br />
Woodroffe Avenue to Rideau River; Rideau River to Highway 417 East<br />
Note 1: Both the phasing and listing of projects in this table are subject to update once the <strong>Ottawa</strong><br />
Pedestrian <strong>Plan</strong> is Council approved.<br />
Table 8.2<br />
Phasing of Required Cycling Infrastructure Projects<br />
Project<br />
Limits<br />
PHASE 1 2009-2015<br />
Alta Vista <strong>Transportation</strong><br />
Corridor<br />
Aero Drive<br />
Baseline Road / Heron Road<br />
Greely / Metcalfe villages link<br />
March Road<br />
Nicholas Street / Madame<br />
Curie Private<br />
North Service Road<br />
Prescott-Russell Pathway<br />
linkage<br />
Prince of Wales Drive<br />
Richmond Road<br />
Multi-use pathway between the Lees Avenue at Nicholas interchange and Conroy<br />
Road at Walkley Road, all parallel to future AVTC<br />
Short on-road connection between Holly Acres Road to east of Inkster Street<br />
Cycling lanes along these roads between Pinecrest Road (Greenbank) in the west<br />
and Walkley Road in the east<br />
On and off-road multi-use pathway connection between the villages of Greely<br />
and Metcalfe<br />
Bicycle lanes or paved shoulders between Terry Fox Road and Dunrobin Road<br />
Improvements to cycling connection at the Campus Station underpass to the<br />
Transitway and Colonel By Drive<br />
Improvements to the off-road multi-use pathway, which is part of the <strong>Ottawa</strong><br />
River pathway, between Tenth <strong>Line</strong> and Trim Roads<br />
Along former CP (now VIARail) unused rail corridor between eastern border of<br />
the City and Innes Road (west of Highway 417)<br />
Cycling Lanes between Meadowlands Drive/Hog’s Back Road and Nesbitt Place<br />
Cycling lanes and paved shoulders between Moodie Drive and Churchill Avenue<br />
TRANSPORTATION MASTER PLAN Page 75<br />
NOVEMBER 2008
Project<br />
Richmond Road<br />
Rideau Canal / Rideau River<br />
connection<br />
Scott Street / Albert Street<br />
South Keys connection<br />
Limits<br />
Paved shoulders between Stonehaven Drive and West Hunt Club Road<br />
New multi-use pathway between Campus Transit Station, Robinson Avenue and<br />
University of <strong>Ottawa</strong>’s Lees Avenue campus<br />
Bicycle lanes between Churchill Avenue and Lebreton Flats<br />
Multi-use pathway link between South Key Transitway Station and the residential<br />
community to the west of the Airport Parkway<br />
Note 1: The projects listed are Phase 1 priorities and this table is subject to change to include other cycling<br />
infrastructure projects that are needed to implement the cycling network as set out in the approved <strong>Ottawa</strong><br />
Cycling <strong>Plan</strong>.<br />
Table 8.3<br />
Phasing of Required Transit Infrastructure Projects<br />
Increment<br />
one<br />
Project<br />
LRT<br />
BRT<br />
Supplementary<br />
(transit priority)<br />
Other<br />
PHASE 1<br />
Description<br />
Downtown tunnel; conversion to LRT of the East Transitway from Blair<br />
station to downtown and the West Transitway from Tunney’s Pasture to<br />
downtown<br />
Southwest Transitway – from Fallowfield Road to Barrhaven Town Centre<br />
Southwest Transitway – from Baseline station to Norice Street<br />
West Transitway – from Bayshore to Moodie Drive<br />
Cumberland Transitway – from Blair station to Innes Road<br />
Cumberland Transitway – from Innes Road (at Blair) to Navan Road (at<br />
hydro corridor)<br />
Strandherd Drive – from Rideau River to Woodroffe Park and Ride<br />
(includes bus lanes on Strandherd/Armstrong bridge)<br />
Woodroffe Avenue – from Woodroffe Park & Ride (at Strandherd Road)<br />
to Fallowfield Park and Ride<br />
Nicholas Connection (new bridge over Rideau River and Lees Avenue)<br />
TRANSPORTATION MASTER PLAN Page 76<br />
NOVEMBER 2008
Project Description<br />
Increment<br />
two<br />
Increment<br />
three<br />
LRT<br />
LRT<br />
BRT<br />
LRT<br />
BRT<br />
Supplementary<br />
(LRT)<br />
Supplementary<br />
(transit priority)<br />
East-West LRT – conversion to LRT of West Transitway from Tunney’s<br />
Pasture to Baseline<br />
North-South LRT – twinning and conversion of O-Train route from<br />
Bayview to South Keys<br />
North-South LRT – from South Keys to Riverside South Town Centre<br />
Cumberland Transitway – from Navan Road to Trim Road (at Millennium)<br />
West Transitway – from Eagleson Road to Scotia Bank Place (south of<br />
Highway 417)<br />
PHASE 2<br />
North-South LRT Airport Spur – North-South LRT to Airport<br />
West Transitway – from Lincoln Fields to Pinecrest Road<br />
Southwest Transitway – from Norice Street to Hunt Club Road<br />
Kanata North Transitway – from Eagelson Road to Klondike Road<br />
West Transitway – from Scotia Bank Place to Fernbank Road<br />
Barrhaven-Riverside South Transitway – from Barrhaven Town Centre to<br />
Riverside South Town Centre<br />
Southwest Transitway – from Barrhaven Town Centre to Cambrian Road<br />
Hospital Link Transitway – from Southeast Transitway (at Lycée Claudel)<br />
to Blair Road (at Innes Road)<br />
East Transitway – from Place D’Orléans to Trim Road<br />
Carling Avenue LRT – from Lincoln Fields to North-South LRT at<br />
Carling/Preston<br />
Baseline Road – from Bayshore Drive to Baseline station<br />
Baseline Road – from Baseline station to <strong>Confederation</strong> station<br />
Heron-Walkley-Russell-St. Laurent – from <strong>Confederation</strong> station along<br />
this corridor to the Hospital Link Transitway (at Innes)<br />
Table 8.4<br />
Phasing of Required Major Roads Infrastructure Projects<br />
Sector Project Description<br />
PHASE 1 2009-2015<br />
EAST Belcourt Boulevard Widen from two to four lanes and new four-lane road, from Innes<br />
Road to Renaud Road<br />
TRANSPORTATION MASTER PLAN Page 77<br />
NOVEMBER 2008
Sector Project Description<br />
WEST<br />
SOUTH<br />
EAST<br />
Belcourt Boulevard / Mer<br />
Bleue Road connection<br />
Blackburn Hamlet By-pass<br />
Extension<br />
Mer Bleue Road<br />
<strong>Ottawa</strong> Road 174<br />
Portobello Boulevard<br />
Trim Road<br />
Campeau Drive<br />
Golf Club Way (Country<br />
Club) /Jinkinson Road<br />
Goulbourn Forced Road realignment<br />
Hazeldean Road<br />
Hope Side Road/ Crown<br />
Ridge Road<br />
Kanata Avenue<br />
March Road<br />
Terry Fox Drive<br />
Alta Vista <strong>Transportation</strong><br />
Corridor<br />
Earl Armstrong Road<br />
Hunt Club Road extension<br />
Limebank Road<br />
Riverside Drive<br />
New four-lane road, south of Innes Road, from Belcourt Boulevard to<br />
Mer Bleue Road<br />
New two-lane road (later four lane), two sections: Navan Road at<br />
hydro corridor to Tenth <strong>Line</strong> Road and Portobello Boulevard to Trim<br />
Road<br />
Widen from two to four lanes from Innes Road to south of Renaud<br />
Road<br />
Widen from five to six lanes from Highway 417 to Blair Road<br />
Widen from two to four lanes from Charest Way to the Blackburn<br />
Hamlet By-pass Extension<br />
Widen/re-align Trim Road from two to four lanes from North Service<br />
Road north of <strong>Ottawa</strong> Road 174 to Blackburn Hamlet By-Pass<br />
Extension<br />
Widen from two to four lanes from Didsbury Road to Kanata Road<br />
and new four-lane road from Didsbury Road to new North-South<br />
arterial in Kanata West<br />
New two-lane service road parallel to widened Highway 7 between<br />
the existing Jinkinson Road and the Country Club subdivision near<br />
Dwyer Hill Road<br />
Re-aligned and new two-lane road from Terry Fox Drive to Kanata<br />
Avenue<br />
Widen from two to four lanes from Iber Road to Terry Fox Drive<br />
New two-lane road from Richmond Road Moodie Drive, includes<br />
completion of Crown Ridge Road<br />
Upgrade existing two-lanes from Terry Fox Drive to Goulbourn<br />
Forced Road<br />
Widen from two to four lanes from Morgan’s Grant Way to Old Carp<br />
Road<br />
New two-lane road from Innovation Road / Flamborough Way to<br />
south of Richardson Side Road<br />
New four-lane road (including two bus lanes) from Riverside Drive to<br />
Hospital Ring Road<br />
Widen from two to four lanes from River Road to Limebank Road<br />
New two-lane road (later four lanes) from Hawthorne Road to connect<br />
to Highway 417, including a new interchange<br />
Widen from two to four lanes from Riverside Drive to south of Earl<br />
Armstrong Road<br />
Widen from two to four lanes from Hunt Club Road to Limebank<br />
Road<br />
TRANSPORTATION MASTER PLAN Page 78<br />
NOVEMBER 2008
Sector Project Description<br />
SOUTH<br />
WEST<br />
EAST<br />
WEST<br />
Strandherd - Earl<br />
Armstrong Rideau River<br />
Bridge<br />
Chapman Mills Drive<br />
Greenbank Road<br />
Jockvale/ Longfields Link<br />
Longfields Drive<br />
Strandherd Drive<br />
Strandherd - Earl<br />
Armstrong Rideau River<br />
Bridge<br />
Belcourt Boulevard<br />
Blackburn Hamlet By-pass<br />
Extension<br />
Frank Kenny Road<br />
extension<br />
Innes-Walkley-Hunt Club<br />
Link<br />
Mer Bleue Road<br />
Navan Road<br />
<strong>Ottawa</strong> Road 174<br />
St. Joseph Boulevard<br />
Tenth <strong>Line</strong> Road<br />
Campeau Drive<br />
Carp Road<br />
Eagleson Road<br />
Earl Grey Drive –<br />
Goulbourn Forced Road<br />
Hazeldean Road<br />
Hope Side Road<br />
New bridge crossing of Rideau River to tie into Earl Armstrong Road<br />
on east side of Rideau River<br />
New four lane road from Strandherd Road to Woodroffe Avenue<br />
Widen from two to four lanes from Malvern Drive to Strandherd Dr.<br />
New four-lane road from Strandherd Drive to Jock River<br />
New two-lane road from Woodroffe Avenue to South Pointe Business<br />
Park<br />
New four-lane road from Woodroffe Avenue to Prince of Wales Dr.<br />
New bridge crossing of Rideau River to tie into Earl Armstrong Road<br />
on east side of Rideau River<br />
PHASE 2 2016-2022<br />
New four-lane road from Renaud Road to Navan Road<br />
New four-lane road from Blackburn Hamlet By-Pass to Navan Road<br />
at hydro corridor<br />
New four-lane road from re-aligned Trim Road to south of Innes Road<br />
New two-lane road (future four-lane) from Hunt Club / new Highway<br />
417 interchange to Innes Road west of Blackburn Hamlet<br />
New four-lane re-alignment, west of existing Mer Bleue Road, from<br />
south of Renaud Road to Navan Road<br />
Widen from two to four lanes from Blackburn Hamlet By-pass<br />
Extension to Mer Bleue Road<br />
Widen from four to six lanes from Blair Road to Jeanne d’Arc Blvd.<br />
Widen from two to four lanes from east of Tenth <strong>Line</strong> Road to Dairy<br />
Road<br />
Widen from two to four lanes from south of Innes Road to north of<br />
urban boundary<br />
Widen from two to four lanes from Kanata Road to March Road<br />
Widen from two to four lanes from Highway 417 to Hazeldean Road<br />
Widen from two to four lanes from Cadence Gate to Hope Side Road<br />
Underpass of Terry Fox Drive<br />
Widen from two to four lanes from Iber Road to Stittsville Main Street<br />
Widen from two to four lanes from Eagleson Road to Richmond Road<br />
Hope Side Road New two-lane road from Moodie Drive to Highway 416<br />
TRANSPORTATION MASTER PLAN Page 79<br />
NOVEMBER 2008
Sector Project Description<br />
SOUTH<br />
EAST<br />
SOUTH<br />
WEST<br />
EAST<br />
WEST<br />
Huntmar Drive<br />
Kanata West North-South<br />
arterial<br />
Kanata West Main Street<br />
Palladium Drive<br />
Realignment<br />
Terry Fox Road<br />
Airport Parkway<br />
Alta Vista <strong>Transportation</strong><br />
Corridor<br />
Bank Street<br />
Cambrian Road<br />
Greenbank Road<br />
Jockvale Road<br />
Prince of Wales Drive<br />
Strandherd Drive<br />
Blackburn Hamlet Bypass<br />
(Innes Road)<br />
Blackburn Hamlet By-pass<br />
Extension<br />
Coventry Road<br />
Kanata West North-South<br />
arterial<br />
Katimavik Road<br />
Hazeldean Road<br />
Maple Grove Road<br />
Widen from two to four lanes, two sections: Campeau Drive extension<br />
to Cyclone Taylor Boulevard, and Palladium Drive to Maple Grove<br />
Road<br />
New two-lane road from Hazeldean Road to Fernbank Road<br />
New two-lane road from Palladium Drive to Maple Grove Road<br />
Realign in vicinity of Huntmar Road to new North-South arterial<br />
Widen from two to four lanes from Winchester Drive to Eagleson<br />
Road at Hope Side Road<br />
Widen from two to four lanes from Brookfield Drive to <strong>Ottawa</strong><br />
International Airport<br />
New four-lane road (including two bus lanes) from Nicholas Street /<br />
Highway 417 interchange to Riverside Drive<br />
Widen from two to four lanes from south of Leitrim Road to Findlay<br />
Creek Drive<br />
Widen from two to four lanes from new Greenbank Road to Jockvale<br />
Road<br />
New four lane road from near Jockvale Road to Cambrian Road,<br />
includes Jock River Bridge<br />
Widen from two to four lanes from Jock River to Prince of Wales<br />
Widen from two to four lanes from Fisher Avenue to Woodroffe<br />
Avenue<br />
Widen from two to four lanes from Fallowfield Road to Jockvale<br />
Road<br />
PHASE 3 2023-2031<br />
Widen from four to six lanes from Innes Road (west entrance to<br />
Blackburn Hamlet) to Navan Road<br />
New two-lane road from Trim Road to Frank Kenny Road<br />
Widen from two to four lanes from Belfast Road to St. Laurent Centre<br />
Widen from two lanes to four lanes from Palladium Drive to Fernbank<br />
Road<br />
Widen from two to four lanes from Terry Fox Drive to Eagleson Road<br />
Widen from two to four lanes from Carp Road to Stittsville Main St.<br />
Widen from two to four lanes from Terry Fox Drive to Huntmar Drive<br />
March Road<br />
Widen from two to four lanes from Old Carp Road to Dunrobin Road<br />
TRANSPORTATION MASTER PLAN Page 80<br />
NOVEMBER 2008
Sector Project Description<br />
SOUTH<br />
EAST<br />
Richmond Road<br />
Terry Fox Drive<br />
Alta Vista <strong>Transportation</strong><br />
Corridor<br />
Bank Street<br />
Earl Armstrong Road<br />
Hunt Club Road<br />
Leitrim Road<br />
Limebank Road<br />
Widen to four lanes from Carling Avenue to Golden Avenue<br />
Widen from two to four lanes from March Road to south of<br />
Richardson Side Road and widen from four to six lanes from<br />
Campeau Drive to Palladium Drive<br />
New four-lane road (including two bus lanes) from Hospital Ring<br />
Road to Conroy Road at Walkley Road<br />
Widen from two to four lanes from Findlay Creek Drive to Parkway<br />
Road<br />
Widen from two to four lanes from Limebank Road to High Road and<br />
new two-lane road from High Road to Bank Street<br />
Widen from four to six lanes from Riverside to Bank Street<br />
Widen from two to four lanes from River Road to east of Limebank<br />
Road and new re-aligned four-lane road from east of Limebank Road<br />
to Bowesville Road<br />
Widen from two to four lanes from south of Earl Armstrong Road to<br />
Mitch Owens Road<br />
SOUTH<br />
WEST<br />
New Rideau River Bridge<br />
Crossing<br />
Riverside Drive<br />
Barnsdale Road<br />
Fallowfield Road<br />
Additional bridge crossing across Rideau River, at a location to be<br />
determined between Hunt Club Road and future Strandherd - Earl<br />
Armstrong Bridge<br />
Widen from four to six lanes (phase 2) from Hunt Club Road to<br />
Limebank Road<br />
Widen from two to four lanes from Highway 416 to Prince of Wales<br />
Drive, including a new interchange<br />
Widen from two to four lanes from Strandherd Drive to Cedarview<br />
Road and from Woodroffe Avenue to Prince of Wales Drive<br />
Fallowfield Road New four-lane road from Strandherd Drive towards Highway 416<br />
New Rideau River Bridge<br />
Crossing<br />
Strandherd Drive<br />
West Hunt Club<br />
Additional bridge crossing across Rideau River, at a location to be<br />
determined between Hunt Club Road and future Strandherd - Earl<br />
Armstrong Bridge<br />
Widen from four to six lanes from Greenbank Road to Woodroffe<br />
Avenue<br />
Widen from four to six lanes from Highway 416 to Prince of Wales<br />
Drive<br />
In addition to the roads projects shown in Figure 8.4, other road projects are under consideration<br />
by senior levels of government. Figure 8.5 identifies these projects. While the City is consulted<br />
on the projects undertaken or initiated by senior levels of government, implementation decisions<br />
ultimately rest with the responsible agency.<br />
TRANSPORTATION MASTER PLAN Page 81<br />
NOVEMBER 2008
Federal Government (NCC) Projects<br />
Figure 8.5 – Key Federal and Provincial Road Projects<br />
<br />
Bridge crossing(s) of <strong>Ottawa</strong> River<br />
Province of Ontario Projects<br />
<br />
<br />
<br />
<br />
<br />
Note:<br />
Highway 417 (Highway 416 to Anderson Road – roadway modifications to be confirmed)<br />
Highway 417 – widening from 4 to 6 lanes plus 2 HOV lanes (Palladium Drive to Highway 416)<br />
Highway 417 – widening from 4 to 6 lanes (Highway 7/17 to Palladium Drive)<br />
Highway 7 – widening from a 2-lane highway to a 4-lane freeway (Highway 417 to Carleton Place)<br />
Highway 417 – interchange at Hunt Club Road extension<br />
Timing of implementation for these projects depends on priorities of senior levels of government.<br />
8.2 Costs<br />
The implementation of this <strong>Transportation</strong> <strong>Master</strong> <strong>Plan</strong> will cost about $8.3 billion over 22 years<br />
in new infrastructure and services, including $7.2 billion for capital costs, $1.1 billion for<br />
operations and maintenance as shown in Figure 8.6.<br />
Figure 8.6 – Total Implementation Costs of New Infrastructure and Services<br />
Type<br />
Capital Cost<br />
($ millions)<br />
Operating & Maintenance Cost<br />
($ millions, net of revenues)<br />
Total Cost<br />
($ millions)<br />
Rapid Transit 4,727 900 5,627<br />
Transit Priority 260 8 268<br />
Bus garages 120 30 150<br />
<strong>Transportation</strong><br />
25 -- 25<br />
Demand Management<br />
Roads, includes<br />
2,112 180 2,292<br />
walking and cycling<br />
facilities<br />
Total 7,244 1,118 8,362<br />
TRANSPORTATION MASTER PLAN Page 82<br />
NOVEMBER 2008
Note that the costs of walking and certain of the cycling facilities are included in the “roads”<br />
category because the vast majority of walking and cycling facilities are implemented within road<br />
rights-of-way during the course of other modifications, and are addressed during the course of<br />
normal road maintenance and operations. Projects that are solely focused on walking and cycling<br />
facilities have comparatively much smaller capital budgets.<br />
Figure 8.7 and 8.8 illustrate the distribution of capital investment over time that is required to<br />
implement the transit and road transportation projects identified in Figures 8.3 and 8.4 and<br />
Annex A.<br />
Figure 8.7 – Staged Capital Cost Requirements for Transit ($ millions)<br />
Facility Type Phase 1 Phase 2 Total<br />
Transit 3,409 1,698 5,107<br />
Figure 8.8 – Staged Capital Cost Requirements for Roads ($ millions)<br />
Facility Type Phase 1 Phase 2 Phase 3 Total<br />
Roads<br />
Includes walking and<br />
cycling facilities<br />
666 753 693 2,112<br />
8.3 <strong>Transportation</strong> Outlook Document<br />
The capital works identified in the TMP:<br />
• represent a desired infrastructure "end state" for 2031 that supports the <strong>Transportation</strong><br />
Vision in Chapter 3 and other goals and objectives identified throughout the plan<br />
• are presented in phases that reflect known priorities (e.g. Council’s approved Cycling<br />
<strong>Plan</strong> implementation schedule) and the expected progress of development<br />
• are not "affordable" in terms of the City's current financial resources<br />
The TMP does not provide adequate implementation guidance in several respects, particularly<br />
with regard to shorter time horizons. In fact, because it is updated only every five years, it would<br />
be inappropriate to use it for that purpose. The City’s annual budget process has a three-year<br />
horizon and is not a good vehicle for explaining transportation strategies. The City’s LRFP (long<br />
term financial plan) has a 10-year horizon, but is updated every three years and does not provide a<br />
level of detail suitable for planning or communicating the implementation of specific programs<br />
TRANSPORTATION MASTER PLAN Page 83<br />
NOVEMBER 2008
and projects. Therefore, the City ideally requires a new form of implementation guidance that<br />
will:<br />
• reflect the 23-year vision of the TMP and the 10-year financial expectations of the LRFP<br />
• inform and guide annual decision-making on the City’s three-year budget<br />
• effectively communicate to the public and other transportation stakeholders what they<br />
can expect the City to undertake in different areas<br />
• guide the implementation of programs and services as well as infrastructure<br />
• identify implementation opportunities and challenges that are not evident from the<br />
perspective of individual budgets, by looking across the full scope of TMP<br />
recommendations (e.g. opportunities to implement transit priority measures as part of<br />
upcoming road rehabilitation projects, coordinate road and transit projects in developing<br />
areas, or coordinate school-based TDM programs with cycling network changes or road<br />
safety initiatives)<br />
• provide Council with more focused and strategic advice regarding implementation<br />
priorities in the face of fiscal expectations -- i.e. how to maximize the value of<br />
investments when resources are limited, and what the impacts will be on performance<br />
objectives and progress toward the <strong>Transportation</strong> Vision<br />
To provide this guidance to the public and decision-makers, the City will prepare a Ten-Year<br />
<strong>Transportation</strong> Outlook document on either an annual or biannual basis. The Outlook will<br />
explain how the City’s transportation initiatives are making the best use of available resources. It<br />
will identify a ten-year implementation plan for infrastructure, programs and services that is<br />
realistic in terms of expected funding levels. It will summarize past progress and pending<br />
initiatives on key performance themes (e.g. demand management, accessibility, safety), and<br />
highlight priority actions within a three-to five-year window. In this way, the Outlook will be able<br />
to integrate long-term community objectives, mid-term fiscal expectations, and short-term needs.<br />
8.4 Environmental Assessment<br />
Environmental assessment (EA) processes require the City to identify and mitigate the impacts of<br />
large construction projects on all aspects of the environment. All projects identified in the TMP<br />
will be subject to a combination of provincial and federal EA requirements before construction.<br />
These include:<br />
<br />
<br />
<br />
Ontario Environmental Assessment and Consultation Improvement Act, 1997<br />
Municipal Engineers Association Municipal Class Environmental Assessment, June 2000<br />
(Class EA)<br />
Canadian Environmental Assessment Act, 1992 (CEAA).<br />
TRANSPORTATION MASTER PLAN Page 84<br />
NOVEMBER 2008
The National Capital Commission also has its own assessment process for projects that affect<br />
Commission lands, based on its Framework for the Harmonization of EAs, a process intended to<br />
fulfill the requirements of the CEAA and the NCC’s Environmental Assessment Policy.<br />
According to provincial legislation roadway modifications must follow the Class EA process. All<br />
EA projects remain subject to a requirement to complete a higher order Class EA or individual<br />
EA. Changes have been made to the Ea process for transit. Transit projects are now eligible to<br />
follow the new process that will allow a faster implementation for transit projects.<br />
Annex B includes a description of the EA status of all identified infrastructure projects. It is<br />
important to note that a significant number of these projects have already partly completed the<br />
appropriate EA process, through one of two different planning mechanisms:<br />
This TMP update is being carried out to fulfill the requirements for Phases I and II of the<br />
Municipal Class Environmental Assessment (EA) process for roads. This includes identification<br />
of problems and opportunities, and the selection of preferred solutions.<br />
Changes have been made to the EA Process for transit. Transit projects are now eligible to follow<br />
the new process that will allow a faster implementation for transit projects. The findings and<br />
conclusions of this TMP will become supporting documentation for future transit EA studies.<br />
Projects that have partially completed the EA process will be required to complete later phases,<br />
including required consultation with stakeholders and the general public, before final design and<br />
construction can begin.<br />
TRANSPORTATION MASTER PLAN Page 85<br />
NOVEMBER 2008
ANNEX A –<br />
<strong>Transportation</strong> Performance Objectives and Indicators<br />
Performance<br />
Objectives<br />
Performance<br />
Indicators<br />
1. Limit motor vehicle traffic growth<br />
(a) Reduce motor<br />
vehicle use per<br />
capita<br />
(b) Increase auto<br />
vehicle<br />
occupancy rates<br />
Individual automobile<br />
use (Daily vehicle-km<br />
per capita)<br />
Relative growth in<br />
automobile traffic<br />
volumes (% change<br />
in volumes / %<br />
change in population)<br />
Auto occupancy rate<br />
(persons per vehicle)<br />
Period of<br />
Measurement<br />
Location, Source and<br />
Frequency of<br />
Measurement Target City Influence<br />
Year To be determined TBD Medium<br />
Morning &<br />
Afternoon peak<br />
period<br />
Morning peak<br />
hour<br />
Aggregated key<br />
screenlines (counts,<br />
annual)<br />
a) Aggregated key<br />
screenlines (counts,<br />
annual)<br />
b) City-wide (origindestination<br />
survey,<br />
every 10 years)<br />
Less than 1.0<br />
over the planning<br />
period<br />
Not less than 1.3<br />
(both screenline<br />
and city-wide<br />
Medium<br />
Low<br />
2. Increase transit use<br />
(a) Increase transit<br />
ridership<br />
(b) Increase transit<br />
service<br />
availability<br />
(c) Increase service<br />
speed and<br />
reliability<br />
Annual Transit<br />
passenger rides<br />
(rides per capita)<br />
Transit mode split (%<br />
of motorized trips)<br />
Proximity to<br />
employment (% of<br />
jobs within 400 m<br />
walk of 10-minute<br />
headway transit<br />
service in peak<br />
periods)<br />
Transit Service level<br />
(service capacity km<br />
per capita)<br />
Intersection<br />
approaches with<br />
transit signal priority<br />
(number)<br />
Completion of transit<br />
priority network (%)<br />
Average transit<br />
vehicle speed<br />
(vehicle-km per<br />
vehicle-hr)<br />
Year City-wide (counts) 200 High<br />
Morning peak<br />
hour<br />
Morning peak<br />
period<br />
Year<br />
N/A<br />
N/A<br />
Year<br />
a) Key screenlines<br />
(counts, annual)<br />
b) City-wide (origindestination<br />
survey,<br />
every 10 years)<br />
City-wide<br />
(employment survey,<br />
every 5 years)<br />
City-wide (service<br />
statistics, annual)<br />
City-wide (inventory,<br />
annual)<br />
City-wide (inventory,<br />
annual)<br />
City-wide (service<br />
statistics, annual)<br />
On-time performance Year City-wide (service<br />
statistics, annual)<br />
Cancelled trips (% of<br />
scheduled trips)<br />
Completion of rapid<br />
transit network (%)<br />
Year<br />
N/A<br />
City-wide (service<br />
statistics, annual)<br />
City-wide (inventory,<br />
annual)<br />
a) See footnote<br />
b) 30%<br />
TBE<br />
TBE<br />
TBE<br />
High<br />
High<br />
High<br />
High<br />
100% High<br />
TBE<br />
TBD<br />
Medium<br />
Medium<br />
0.5% per annum High<br />
100% High<br />
TRANSPORTATION MASTER PLAN Page 86<br />
NOVEMBER 2008
Performance<br />
Objectives<br />
(d) Increase user<br />
comfort and<br />
convenience<br />
3. Increase cycling<br />
(a) Increase cycling l<br />
mode share<br />
Performance<br />
Indicators<br />
Shelter provision (%<br />
of stops)<br />
Cycling modal share<br />
(% of all trips)<br />
Period of<br />
Measurement<br />
N/A<br />
Morning peak<br />
hour<br />
Location, Source and<br />
Frequency of<br />
Measurement Target City Influence<br />
City-wide (inventory, TBE<br />
High<br />
annual)<br />
a) Inner Area cordon<br />
(counts, annual)<br />
b) City-wide (origindestination<br />
survey,<br />
every 10 years)<br />
TBD (cordon)<br />
a) 3%<br />
(city-wide)<br />
Medium<br />
(b) Increase<br />
availability of<br />
cycling facilities<br />
4. Increase walking<br />
(a) Increase walking<br />
mode share<br />
(b) Increase<br />
availability of<br />
walking facilities<br />
City-wide cycling<br />
activity index (cyclist<br />
per 100 motorized<br />
vehicles)<br />
Completion of Urban<br />
Cycling Network (%)<br />
Walking modal share<br />
(% of all trips)<br />
Sidewalk coverage<br />
(sidewalk provisions<br />
as a % of roadway<br />
length<br />
8 hours<br />
(morning, midday<br />
& afternoon<br />
peak periods)<br />
Urban area (counts,<br />
biannual)<br />
TBD<br />
Medium<br />
N/A City-wide (annual) 100% High<br />
Morning peak<br />
hour<br />
N/A<br />
5. Reduce unwanted social and environmental effects<br />
(a) Reduce air<br />
emissions from<br />
transportation<br />
(b) Reduce road salt<br />
use<br />
(c) Reduce road<br />
surface per<br />
capita<br />
Greenhouse gas<br />
emissions from<br />
passenger travel (kg<br />
per capita)<br />
NOx emissions from<br />
passenger travel (kg<br />
per capita)<br />
Road salt usage<br />
(tonnes)<br />
Road surface area<br />
(square metres per<br />
capita)<br />
6. Optimize use of existing system<br />
(a) Increase capacity <strong>Transportation</strong><br />
system management<br />
coverage (% of traffic<br />
signals with real-time<br />
optimization)<br />
(b) Increase transit<br />
efficiency<br />
(c) Spread peak<br />
travel demands<br />
– roads<br />
(d) Spread peak<br />
travel demands<br />
– transit<br />
Transit efficiency<br />
(passenger-km per<br />
service capacity-km)<br />
Peak period factor for<br />
roads (% of daily<br />
vehicle trips in a.m. +<br />
p.m. peak periods)<br />
Peak period factor for<br />
transit (% of daily<br />
person-trips in a.m. +<br />
p.m. peak periods)<br />
a) Central Area<br />
cordon (counts,<br />
annual)<br />
b) City-wide<br />
(OD survey, every<br />
10 years)<br />
Urban + villages<br />
(annual)<br />
b) TBD (cordon)<br />
c) 10%<br />
(city-wide)<br />
TBD<br />
Medium<br />
High<br />
Year City-wide (annual) TBD Medium<br />
Low to medium<br />
Year City-wide (annual) TBD High<br />
Year City-wide (annual) TBD High<br />
N/A City-wide (annual) TBE Medium to high<br />
N/A City-wide (annual) TBD High<br />
Year City-wide (annual) TBE Medium to high<br />
Daily, morning &<br />
afternoon peak<br />
periods<br />
Daily, morning &<br />
afternoon peak<br />
periods<br />
Aggregated key<br />
screenlines (counts,<br />
annual)<br />
Aggregated key<br />
screenlines (counts,<br />
annual)<br />
TBE<br />
TBE<br />
Low to medium<br />
Low to medium<br />
TRANSPORTATION MASTER PLAN Page 87<br />
NOVEMBER 2008
Performance<br />
Objectives<br />
Performance<br />
Indicators<br />
7. Manage transportation assets<br />
(a) Maintain<br />
adequate<br />
condition of<br />
road, Transitway<br />
and structures<br />
(b) Maintain<br />
adequate<br />
condition of<br />
walking and<br />
cycling<br />
infrastructure<br />
(c) Maintain<br />
adequate<br />
condition of<br />
transit fleet<br />
Major infrastructure<br />
condition (% of road,<br />
Transitway and<br />
structure lane-km<br />
meeting or exceeding<br />
Performance<br />
Indicator Acceptability<br />
Benchmarks)<br />
Walking and cycling<br />
infrastructure<br />
condition (% of<br />
sidewalk and cycling<br />
network meeting or<br />
exceeding<br />
Performance<br />
Indicator Acceptability<br />
Benchmarks)<br />
Average transit<br />
vehicle fleet age<br />
(years)<br />
8. Improve transportation safety<br />
(a) Reduce death<br />
and injury from<br />
collisions<br />
(b) Increase walking<br />
safety<br />
(c) Increase cycling<br />
safety<br />
Road injuries<br />
(number)<br />
Road fatalities<br />
(number)<br />
Reported pedestrian<br />
collisions (number)<br />
Reported cyclist<br />
collisions (number)<br />
9. Enable efficient goods movement<br />
(a) Minimize delay<br />
for trucks<br />
Off-peak road<br />
congestion<br />
(volume/capacity)<br />
Period of<br />
Measurement<br />
Location, Source and<br />
Frequency of<br />
Measurement Target City Influence<br />
N/A City-wide (annual) 100% High<br />
N/A City-wide (annual) 100% High<br />
N/A City-wide (annual) 9 yr High<br />
Year City-wide (annual) 30% reduction by<br />
2010 (from 2003<br />
level)<br />
Year City-wide (annual) 30% reduction by<br />
2010 (from 2003<br />
level)<br />
Year City-wide (annual) 30% reduction by<br />
2010 (from 2003<br />
level)<br />
Year City-wide (annual) 30% reduction by<br />
2010 (from 2003<br />
level)<br />
Mid-day period<br />
At aggregated key<br />
screenlines (annual,<br />
counts)<br />
10. Meet mobility needs of persons with disabilities<br />
Transit Bus<br />
accessibility (% of<br />
low-floor buses)<br />
N/A City-wide (annual) 100% by 2015 High<br />
(a) Increase<br />
accessibility of<br />
conventional<br />
transit service<br />
(b) Maintain<br />
adequate<br />
specialized<br />
transit service<br />
(c) Increase<br />
accessibility of<br />
public rights-ofway<br />
Access to information<br />
(% of transit schedule<br />
information that is<br />
accessible on Web<br />
site)<br />
Specialized transit<br />
usage (specialized<br />
transit riders per<br />
capita)<br />
Pedestrian crossing<br />
accessibility (% of<br />
traffic signals with<br />
depressed medians)<br />
Traffic signal<br />
accessibility (% of<br />
traffic signals with<br />
accessibility features)<br />
TBE<br />
Medium<br />
Medium<br />
Medium<br />
Medium<br />
Medium<br />
N/A Annual TBD High<br />
Year City-wide (annual) TBE High<br />
N/A City-wide (annual) TBE High<br />
N/A City-wide (annual) TBE High<br />
TRANSPORTATION MASTER PLAN Page 88<br />
NOVEMBER 2008
Performance<br />
Objectives<br />
Performance<br />
Indicators<br />
Traffic signage<br />
accessibility (to be<br />
determined) see<br />
footnote<br />
11. Meet public expectations<br />
(a) Increase<br />
satisfaction with<br />
transportation<br />
system<br />
(b) Ensure<br />
transportation<br />
funding that is<br />
adequate and<br />
equitable<br />
Public satisfaction<br />
with transportation<br />
system (% people<br />
rating as good or<br />
better)<br />
• Overall<br />
• Walking<br />
• Cycling<br />
• Transit<br />
• General traffic<br />
Capital investment<br />
(dollars per capita in<br />
municipal<br />
transportation<br />
projects)<br />
• Roads<br />
(multimodal)<br />
• Transit facilities<br />
and fleet<br />
• Walking facilities<br />
• Cycling facilities<br />
Operating investment<br />
(dollars per capita in<br />
municipal<br />
transportation<br />
projects)<br />
• Roads<br />
(multimodal, including<br />
walking and cycling)<br />
• Transit<br />
Reliance on property<br />
tax (% of capital<br />
investment derived<br />
from property tax<br />
rather than more<br />
equitable sources)<br />
• Roads<br />
(multimodal)<br />
• Transit facilities<br />
and fleet<br />
• Walking facilities<br />
• Cycling facilities<br />
Period of<br />
Measurement<br />
Location, Source and<br />
Frequency of<br />
Measurement Target City Influence<br />
TBD TBD TBD High<br />
N/A City-wide (annual) 100% Medium<br />
Year City-wide (annual) N/A High<br />
Year City-wide (annual) N/A Low<br />
Year City-wide (annual) TBD Low<br />
Note: All indicators measured in the <strong>Transportation</strong> Performance Objectives and Indicators (Phase I & II)<br />
were based on 2003 TMP targets. These indicators will be revised further to subsequent updates to the<br />
TMP.<br />
TRANSPORTATION MASTER PLAN Page 89<br />
NOVEMBER 2008
ANNEX B –<br />
Required Infrastructure Projects<br />
Walking and Multi-use Pathway Projects<br />
Project 1 General Description Rationale EA Status 2<br />
Algonquin /<br />
Woodroffe Ave.<br />
Pedestrian<br />
Overpass<br />
Alta Vista<br />
<strong>Transportation</strong><br />
Corridor<br />
Alta Vista Drive<br />
to Ogilvie Road<br />
Corridor<br />
Bayview Station /<br />
<strong>Ottawa</strong> River<br />
Pathway link<br />
Carp River /<br />
Terry Fox Drive<br />
Corridor<br />
Coventry Road /<br />
Baseball Stadium<br />
Pedestrian<br />
Crossing<br />
Earl Armstrong<br />
Road Corridor<br />
From Algonquin College to<br />
the Baseline Transitway<br />
Station<br />
From Hurdman Transit<br />
Station / Rideau River to Alta<br />
Vista <strong>Transportation</strong> Corridor<br />
to existing trail on Conroy<br />
Road<br />
From <strong>Ottawa</strong> Hospital<br />
General Campus through<br />
industrial and rail lands over<br />
the Queensway to Ogilvie<br />
Road and the Aviation<br />
Parkway<br />
From the Bayview O-Train<br />
Station to the <strong>Ottawa</strong> River<br />
Pathway<br />
Along the Carp River and the<br />
Terry Fox Drive corridor<br />
from North Kanata to South<br />
Kanata<br />
From the baseball stadium to<br />
the Train Transitway Station<br />
River Road to Greenbelt at<br />
Bowesville Road; parallels<br />
road corridor<br />
Provides enhanced transit accessibility for Not started<br />
Algonquin College. To be coordinated with the<br />
redevelopment plan of the area of the Baseline<br />
Transitway Station<br />
Following the Alta Vista <strong>Transportation</strong><br />
Corridor through a broad greenspace corridor,<br />
providing access to greenspace, community<br />
destinations and facilities (recreation, health<br />
educational) and to rapid transit<br />
Linking communities across Queensway and<br />
railway yard barriers; linking employment<br />
areas, sport facilities, rapid transit and<br />
passenger rail stations to communities<br />
Linking the current terminus of the O-Train<br />
line with the <strong>Ottawa</strong> River Pathway provides a<br />
new access to and from these routes<br />
North-south spine route along the Carp River<br />
linking communities to employment areas,<br />
retail, mixed use areas and significant natural<br />
areas<br />
Provides enhanced transit accessibility to the<br />
stadium and adjacent employment area<br />
Linking open spaces along Rideau River to<br />
South Gloucester community and future mixed<br />
use development<br />
Eastern Corridors From Alta Vista<br />
Traveling through a broad open space and<br />
<strong>Transportation</strong> Corridor to scenic route corridor, providing access to<br />
Southern Cross-town Corridor greenspace, community destinations<br />
(recreation, health, educational) and to rapid<br />
transit<br />
Greenbank Road<br />
Corridor<br />
Reconstruction of pathway<br />
through the Greenbelt; new<br />
pathways from Southern<br />
Existing undersized pathway may be lost with<br />
future road improvements; replacement<br />
required; coordinate with NCC<br />
Completed for<br />
road/transit<br />
portion<br />
Not started<br />
Not started<br />
Not started<br />
Not started<br />
Not started<br />
Not started<br />
Not started<br />
TRANSPORTATION MASTER PLAN Page 90<br />
NOVEMBER 2008
Walking and Multi-use Pathway Projects<br />
Project 1 General Description Rationale EA Status 2<br />
Jock River<br />
Corridor<br />
Orléans South<br />
Corridor<br />
Prescott-Russell<br />
Pathway linkage<br />
Prince of Wales<br />
Drive Corridor<br />
Riverside Drive /<br />
River Road<br />
Corridor<br />
Sawmill Creek<br />
Corridor via<br />
Airport Parkway<br />
Southern Cross<br />
town Corridor<br />
Trim Road /<br />
Cardinal Creek<br />
Woodroffe<br />
Avenue Corridor<br />
Corridor to Hunt Club Road,<br />
and Fallowfield to Jock River<br />
Corridor<br />
Along Jock River from<br />
Highway 416 to Prince of<br />
Wales Drive<br />
From Greenbelt at Navan<br />
Road to Cardinal Creek via<br />
Blackburn Bypass / transit<br />
and hydro corridor<br />
Along former CP (now<br />
VIARail) rail corridor<br />
between eastern border of the<br />
City and Innes Road (west of<br />
Highway 417)<br />
Hogs Back Road to southern<br />
limit of the Greenbelt<br />
Hunt Club Road to southern<br />
limit of the Greenbelt<br />
Following Sawmill Creek<br />
from the Rideau River to<br />
Hunt Club and to Blossom<br />
Park<br />
Woodroffe Avenue to Rideau<br />
River; Rideau River to<br />
Highway 417 East<br />
From Petrie Island to Frank<br />
Kenny Road<br />
From Baseline Transitway<br />
Station to Fallowfield Road;<br />
Fallowfield to Greenbank via<br />
rail/transit corridor<br />
Enhances accessibility of Jock River open<br />
spaces; key east-west route between business<br />
park, future town centre, and open spaces<br />
along Rideau River<br />
Crossing the entire southern area of Orléans,<br />
linking the Greenbelt and Cardinal Creek,<br />
providing access to greenspaces, parks,<br />
employment, retail, educational destinations<br />
Connects with major multi-use pathway in<br />
Prescott-Russell that leads eastward to the<br />
Montréal area<br />
Providing access along a scenic route<br />
following the Rideau River enhancing access<br />
between communities and waterfront open<br />
space and the Greenbelt<br />
Providing access along a scenic route<br />
following the Rideau River enhancing access<br />
between communities and waterfront open<br />
space and the Greenbelt<br />
Providing linkages to waterfront open spaces,<br />
transit, retail, recreational and environmental<br />
areas<br />
Not started<br />
Not started<br />
Not started<br />
Not started<br />
Not started<br />
Not started<br />
Follows a green and open setting, enhancing Not started<br />
access to community destinations, (parks,<br />
community facilities, retail) and to rapid transit<br />
Following environmentally significant creek<br />
corridor, linking communities to parks, open<br />
spaces, employment areas and the <strong>Ottawa</strong><br />
River<br />
Linking Sportsplex, education facilities, Park<br />
and Ride, rapid transit and passenger rail<br />
stations to communities and providing access<br />
to the Greenbelt<br />
Not started<br />
Not started<br />
Note 1: The projects described here will be subject to update once the <strong>Ottawa</strong> Pedestrian <strong>Plan</strong> is Council<br />
approved.<br />
Note 2: Process to meet requirements of the <strong>Plan</strong>ning Act and/or the Environmental Assessment Act is to<br />
occur or has occurred.<br />
TRANSPORTATION MASTER PLAN Page 91<br />
NOVEMBER 2008
Cycling Projects<br />
Project 1 General Description Rationale EA Status<br />
Alta Vista<br />
<strong>Transportation</strong><br />
Corridor<br />
Multi-use pathway between the Provides major north-south link between<br />
Lees Avenue at Nicholas Conroy Road, Alta Vista and downtown<br />
interchange and Conroy Road at<br />
Walkley Road, all parallel to future<br />
AVTC<br />
Completed for<br />
road/transit<br />
portion<br />
Aero Drive<br />
Short on-road connection between Improves connecting link along part of the<br />
Holly Acres Road to east of Inkster TransCanada Trail<br />
Street<br />
See Note 2<br />
Baseline Road /<br />
Heron Road<br />
Cycling lanes along these roads<br />
between Pinecrest Road<br />
(Greenbank) in the west and<br />
Walkley Road in the east<br />
Improves cycling along this major east-west<br />
cycling route<br />
See Note 2<br />
Greely /<br />
Metcalfe<br />
villages link<br />
On and off-road multi-use pathway<br />
connection between the villages of<br />
Greely and Metcalfe<br />
Community supported connection to link<br />
villages<br />
See Note 2<br />
March Road<br />
Bicycle lanes or paved shoulders<br />
between Terry Fox Road and<br />
Dunrobin Road<br />
Improves access from rural area to Kanata<br />
North and the urban area<br />
See Note 2<br />
Nicholas Street<br />
/ Madame<br />
Curie Private<br />
Improvements to cycling<br />
connection at the Campus Station<br />
underpass to the Transitway and<br />
Colonel By Drive<br />
Differentiates usage between wheelchair<br />
spiral ramp and new planned ramp in<br />
existing stairs<br />
See Note 2<br />
North Service<br />
Road<br />
Improvements to the off-road<br />
multi-use pathway, which is part of<br />
the <strong>Ottawa</strong> River pathway,<br />
between Tenth <strong>Line</strong> and Trim<br />
Roads<br />
Improves quality of pathway that leads to<br />
Petrie Island and residential communities<br />
south of St. Joseph Boulevard<br />
See Note 2<br />
Prescott-Russell<br />
Pathway<br />
linkage<br />
Along former CP (now VIARail)<br />
unused rail corridor between<br />
eastern border of the City and<br />
Innes Road (west of Highway 417)<br />
Connects with major multi-use pathway in<br />
Prescott-Russell that leads eastward to the<br />
Montréal area<br />
See Note 2<br />
Prince of Wales<br />
Drive<br />
Cycling Lanes between<br />
Meadowlands Drive/Hog’s Back<br />
Road and Nesbitt Place<br />
Improves cycling facilities through this<br />
intersection<br />
See Note 2<br />
Richmond<br />
Road<br />
Cycling lanes and paved shoulders<br />
between Moodie Drive and<br />
Major link between communities in the west<br />
end of the City, links to Byron Avenue<br />
See Note 2<br />
TRANSPORTATION MASTER PLAN Page 92<br />
NOVEMBER 2008
Cycling Projects<br />
Project 1 General Description Rationale EA Status<br />
Churchill Avenue<br />
cycling route<br />
Richmond<br />
Road<br />
Paved shoulders between<br />
Stonehaven Drive and West Hunt<br />
Club Road<br />
Improve safety for cycling through the<br />
Greenbelt to/from south Kanata<br />
See Note 2<br />
Rideau Canal /<br />
Rideau River<br />
connection<br />
New multi-use pathway between<br />
Campus Transit Station, Robinson<br />
Avenue and University of<br />
<strong>Ottawa</strong>’s Lees Avenue campus<br />
Completes an important link in the cycling<br />
network between the Rideau River former<br />
railway bridge (Overbrook & Riverview)<br />
and the downtown<br />
See Note 2<br />
Scott Street /<br />
Albert Street<br />
Bicycle lanes between Churchill<br />
Avenue and Lebreton Flats<br />
Main west-east commuter route to and from<br />
downtown<br />
See Note 2<br />
South Keys<br />
connection<br />
Multi-use pathway link between<br />
South Key Transitway Station and<br />
the residential community to the<br />
west of the Airport Parkway<br />
Safe and convenient connection between<br />
residential community and transit/shopping<br />
area<br />
Underway<br />
Note 1: The projects listed are Phase 1 priorities and this table is subject to change to include other cycling<br />
infrastructure projects that are needed to implement the cycling network as set out in the approved <strong>Ottawa</strong><br />
Cycling <strong>Plan</strong>.<br />
Note 2: Process to meet requirements of the <strong>Plan</strong>ning Act and/or the Environmental Assessment Act is to<br />
occur or has occurred.<br />
Transit Priority Projects<br />
Project<br />
Limits<br />
General Description and<br />
Rationale<br />
EA Status<br />
Alta Vista<br />
<strong>Transportation</strong><br />
Corridor<br />
Hospital segment of Transitway<br />
corridor to Walkley Road at<br />
Conroy Road<br />
Bus lanes on the Alta Vista<br />
<strong>Transportation</strong> Corridor, links to<br />
possible lane extension or transit<br />
priority measures on Conroy Road<br />
See Note 1<br />
Bank Street<br />
Wellington Street to Highway 417 Peak period bus lanes in both<br />
directions (7 to 9 a.m. and 3:30 to<br />
5:30 p.m.) by prohibiting on-street<br />
parking during those periods<br />
See Note 1<br />
TRANSPORTATION MASTER PLAN Page 93<br />
NOVEMBER 2008
Transit Priority Projects<br />
Project<br />
Limits<br />
General Description and<br />
Rationale<br />
EA Status<br />
Bank Street<br />
Highway 417 to Billings Bridge<br />
Station<br />
Set of coordinated transit priority<br />
measures as required (signal preemption,<br />
queue jumps, etc.); plus<br />
parking restrictions<br />
See Note 1<br />
Bathgate Drive<br />
Montréal Road to Ogilvie Road<br />
and Blair Station<br />
Dedicated bus lanes See Note 1<br />
Bronson Avenue<br />
Carling Avenue to Catherine<br />
Street / Chamberlain Avenue<br />
Set of co-ordinated transit priority<br />
measures as required<br />
See Note 1<br />
Carling Avenue<br />
Western Transitway at Lincoln<br />
Fields (Carling Avenue) to O-train<br />
west of Preston Street<br />
At grade LRT within dedicated lanes<br />
(median preferred)<br />
See Note 1<br />
Carling Avenue<br />
O-train west of Preston Street to<br />
Bronson Avenue<br />
- Existing bus lanes, eastbound from<br />
Preston Street to Cambridge Street &<br />
westbound from Bronson Avenue to<br />
Booth Street<br />
See Note 1<br />
- Intersection modifications required at<br />
Preston Street and Bronson Avenue<br />
(signal pre-emption, queue jumps)<br />
Carling Avenue<br />
Merivale Road to Holland Avenue Connecting transit priority link for<br />
Merivale Road to Holland Avenue; set<br />
of co-ordinated transit priority<br />
measures as required<br />
See Note 1<br />
Catherine Street /<br />
Chamberlain<br />
Avenue / Isabella<br />
Street<br />
Bronson Avenue to Lees Station<br />
Set of co-ordinated transit priority<br />
measures as required<br />
See Note 1<br />
Conroy Road<br />
Walkley Road to Hunt Club Road Possible lane extension or transit<br />
priority measures on Conroy Road,<br />
links to bus lanes on the Alta Vista<br />
<strong>Transportation</strong> Corridor<br />
See Note 1<br />
Eagleson Road<br />
Hazeldean Road to transit station<br />
at Highway 417<br />
Set of co-ordinated transit priority<br />
measures as required<br />
See Note 1<br />
Holland Avenue<br />
Carling Avenue to Scott Street<br />
(Tunney’s Pasture)<br />
Peak period bus lanes in peak direction<br />
only (7 to 9 a.m. northbound and 3:30<br />
to 5:30 p.m. southbound) by<br />
reallocating on-street parking on<br />
Holland<br />
See Note 1<br />
TRANSPORTATION MASTER PLAN Page 94<br />
NOVEMBER 2008
Transit Priority Projects<br />
Project<br />
Limits<br />
General Description and<br />
Rationale<br />
EA Status<br />
Hunt Club Road<br />
Rideau River to South Keys<br />
Station to Conroy Road<br />
Set of co-ordinated transit priority<br />
measures as required<br />
See Note 1<br />
King Edward<br />
Avenue<br />
Sussex Drive to Rideau Street<br />
Dedicated southbound bus lanes from<br />
3:00 to 5:00 p.m.<br />
See Note 1<br />
Merivale Road<br />
Carling Avenue to Baseline Road Peak period bus lanes in peak direction<br />
only (7 to 9 a.m. northbound and 3:30<br />
to 5:30 p.m. southbound) by<br />
reallocating existing traffic lanes on<br />
Merivale<br />
See Note 1<br />
Merivale Road<br />
Baseline Road to West Hunt Club<br />
Road<br />
All day bus lanes in both directions<br />
requiring localized widening<br />
See Note 1<br />
Montréal Road<br />
Montréal Road<br />
Rideau Street to St. Laurent<br />
Boulevard<br />
St. Laurent Boulevard to Bathgate<br />
Drive (leads to Blair Station)<br />
Peak period bus lanes with increased<br />
time of day coverage in both directions<br />
(6 to 9:30 a.m. and 2:30 to 6:30 p.m.)<br />
by prohibiting on-street parking during<br />
those periods<br />
Peak period bus lanes in peak direction<br />
only (7 to 9 a.m. westbound and 3:30<br />
to 5:30 p.m.) eastbound by reallocating<br />
existing traffic lanes<br />
See Note 1<br />
See Note 1<br />
Ogilvie Road Montréal Road to Blair Station Set of co-ordinated transit priority<br />
measures as required<br />
See Note 1<br />
Richmond Road /<br />
Robertson Road<br />
Western boundary of Bells<br />
Corners (Westcliffe) to Bayshore<br />
Station<br />
Set of co-ordinated transit priority<br />
measures required (signal pre-emption,<br />
queue jumps, etc.)<br />
See Note 1<br />
Richmond Road<br />
Bayshore Station to Carling<br />
Avenue (Lincoln Fields Station)<br />
Set of coordinated transit priority<br />
measures as required (signal preemption,<br />
queue jumps, etc.) plus<br />
dedicated bus lanes planned from<br />
Richmond / Carling intersection to<br />
Lincoln Fields Station, and westbound<br />
left turn lane for transit only at<br />
Richmond<br />
See Note 1<br />
Rideau Street Sussex Drive to Montréal Road Peak period bus lanes with increased<br />
time of day coverage in both directions<br />
(6 to 9:30 a.m. and 2:30 to 6:30 p.m.)<br />
by prohibiting on-street parking during<br />
those periods<br />
See Note 1<br />
TRANSPORTATION MASTER PLAN Page 95<br />
NOVEMBER 2008
Transit Priority Projects<br />
Project<br />
Limits<br />
General Description and<br />
Rationale<br />
EA Status<br />
Russell Road<br />
St Laurent Boulevard (Smyth<br />
Road) to Walkley Road<br />
Dedicated bus lanes requiring road<br />
widening<br />
See Note 1<br />
St. Laurent<br />
Boulevard<br />
Montréal Road to St. Laurent<br />
Station<br />
Set of co-ordinated transit priority<br />
measures as required<br />
See Note 1<br />
St. Laurent<br />
Boulevard<br />
Russell Road (Smyth Road) to St.<br />
Laurent Station<br />
- South of Innes: dedicated bus lanes<br />
requiring road widening<br />
See Note 1<br />
- North of Innes: Set of coordinated<br />
transit priority measures as required<br />
(signal pre-emption, queue jumps, etc.)<br />
Somerset Street<br />
West<br />
Tenth <strong>Line</strong> Road<br />
West Wellington Street to O-Train<br />
then to Bank Street<br />
Charlemagne Boulevard to Place<br />
d’Orléans Station or future<br />
Transitway station at <strong>Ottawa</strong> Road<br />
174<br />
Set of co-ordinated transit priority<br />
measures as required<br />
Set of co-ordinated transit priority<br />
measures as required<br />
See Note 1<br />
See Note 1<br />
Wellington Street Bank Street to Sussex Drive To be determined by the Interprovincial<br />
Transit Integration Study<br />
See Note 1<br />
West Wellington<br />
Street<br />
Holland Avenue to Somerset<br />
Street West, leads to O-Train<br />
Set of co-ordinated transit priority<br />
measures as required<br />
See Note 1<br />
West Hunt Club<br />
Road<br />
Woodroffe Avenue to Rideau<br />
River<br />
Set of co-ordinated transit priority<br />
measures as required<br />
See Note 1<br />
Woodroffe Avenue<br />
Fallowfield Road to Strandherd<br />
Drive<br />
Set of co-ordinated transit priority<br />
measures as required<br />
See Note 1<br />
Note 1: Process to meet requirements of the <strong>Plan</strong>ning Act and/or the Environmental Assessment Act is to<br />
occur or has occurred.<br />
TRANSPORTATION MASTER PLAN Page 96<br />
NOVEMBER 2008
Rapid Transit Projects<br />
Project General Description Rationale EA Status<br />
Light Rail Transit Projects<br />
Downtown Tunnel Tunnel under downtown from<br />
west of Bronson Avenue at<br />
Lebreton Flats to Nicholas<br />
Street in the vicinity of the<br />
University of <strong>Ottawa</strong><br />
Provides fast, reliable service through the<br />
downtown. Promotes development adjacent to<br />
or connecting with the underground stations<br />
along the route.<br />
Underway<br />
East LRT<br />
LRT between tunnel and Blair<br />
Station<br />
Provides fast, reliable service between<br />
downtown and the Hurdman to Blair Stations,<br />
with Transitway connections to east and<br />
southeast communities<br />
Not started<br />
West LRT<br />
LRT between tunnel and<br />
Baseline Station<br />
Provides fast, reliable service between<br />
downtown and communities to the west,<br />
including major employment, shopping and<br />
educational destinations at Tunney’s Pasture,<br />
Lincoln Fields and Baseline Stations<br />
Not started<br />
North-South LRT LRT between Bayview<br />
Station and Riverside South<br />
Town Centre, including<br />
airport link<br />
Provides fast, reliable service between<br />
downtown and <strong>Ottawa</strong> south areas serving<br />
residents in Hunt Club and the growing<br />
Riverside South community. Also promotes<br />
development in the corridor at <strong>Confederation</strong><br />
Heights and between Carling Avenue and<br />
Bayview Stations.<br />
Completed<br />
Carling Avenue<br />
LRT<br />
LRT in dedicated lanes<br />
between Lincoln Fields<br />
Station and the North-South<br />
LRT west of Preston Street<br />
Provides high quality citywide transit access to<br />
employment and commercial land uses<br />
adjacent to Carling Avenue, and fast, reliable<br />
service to major intersecting rapid transit lines<br />
for corridor residents. Also promotes corridor<br />
redevelopment.<br />
Not completed<br />
Bus Rapid Transit Projects<br />
East Transitway<br />
BRT between Blair Road and<br />
Trim Road<br />
Provides fast, reliable service to/from<br />
downtown for eastern Orléans residents and to<br />
the Trim Road Park & Ride lot to capture<br />
ridership from outside the urban boundary<br />
Underway<br />
Cumberland<br />
Transitway<br />
BRT between Blair station<br />
By-Pass and Trim Road<br />
Provides fast, reliable service to/from<br />
downtown for south Orléans and Blackburn<br />
Hamlet residents.<br />
Completed<br />
Hospital<br />
Transitway Link<br />
BRT between Southeast<br />
Transitway (Lycée Claudel),<br />
Provides high quality transit access to major<br />
institutions, employment and commercial land<br />
Underway<br />
TRANSPORTATION MASTER PLAN Page 97<br />
NOVEMBER 2008
Rapid Transit Projects<br />
Project General Description Rationale EA Status<br />
to Blair Road (at Innes Road) uses (e.g. <strong>Ottawa</strong> Hospital-General Campus,<br />
and Life Science Park) in the corridor.<br />
Kanata North<br />
Transitway<br />
BRT between West<br />
Transitway at Highway 417<br />
and vicinity of Old Carp Road<br />
Provides high quality transit access to major<br />
employment area in Kanata North along<br />
March Road.<br />
Not completed<br />
West Transitway<br />
BRT between Southwest<br />
Transitway (Highway 417)<br />
and Fernbank Road<br />
Provides fast, reliable service to/from<br />
downtown for Kanata, Stittsville and Bayshore<br />
area residents<br />
Not completed<br />
Barrhaven-<br />
Riverside South<br />
Transitway<br />
BRT between Southwest<br />
Transitway at Barrhaven<br />
Town Centre and the<br />
Riverside South Town Centre<br />
Provides high quality transit access between<br />
Town Centres of Barrhaven and Riverside<br />
South and connects the North-South LRT to<br />
the Southwest Transitway<br />
Not completed<br />
Southwest<br />
Transitway<br />
BRT between Baseline Road<br />
and Cambrian Road<br />
Provides fast, reliable service for South<br />
Nepean residents and Woodroffe corridor.<br />
Completed for<br />
portion<br />
Transit Intensive - Bus Projects<br />
Baseline Road /<br />
<strong>Confederation</strong><br />
(Heron Road)<br />
Dedicated bus lanes between<br />
Baseline Station and Heron<br />
Road / Southeast Transitway<br />
Provides high quality city-wide transit access<br />
to employment, commercial and institutional<br />
land uses adjacent to Baseline Road, and fast,<br />
reliable service to major rapid transit lines for<br />
corridor residents. Also, provides key link<br />
between Southwest and Southeast rapid transit<br />
network segments by avoiding downtown and<br />
promotes corridor redevelopment particularly<br />
at <strong>Confederation</strong> Heights.<br />
Not completed<br />
Baseline Road /<br />
Richmond Road<br />
Dedicated bus lanes between<br />
Baseline Station and<br />
Bayshore Station<br />
Provides high quality citywide transit access to<br />
major commercial, institutional and<br />
employment uses in the corridor.<br />
Not completed<br />
Heron Road<br />
Dedicated bus lanes between<br />
Heron Road / Southeast<br />
Transitway <strong>Confederation</strong><br />
Station and Walkley Road<br />
Provides high quality citywide transit access to<br />
Alta Vista and Heron Gate communities<br />
Not completed<br />
Walkley Road<br />
Dedicated bus lanes between<br />
Heron Road to Russell Road<br />
Provides high quality citywide transit access to<br />
Alta Vista and Heron Gate communities<br />
Not completed<br />
Russell Road / St.<br />
Laurent<br />
Boulevard BRT<br />
Dedicated bus lanes between<br />
Walkley Road to Hospital /<br />
Innes Road BRT link<br />
Provides high quality citywide transit access to<br />
Alta Vista and Sheffield Glen communities<br />
Not completed<br />
TRANSPORTATION MASTER PLAN Page 98<br />
NOVEMBER 2008
Road Projects<br />
Project General Description Rationale EA Status<br />
Airport<br />
Parkway<br />
Widen from two to four lanes<br />
from Brookfield Drive to<br />
<strong>Ottawa</strong> International Airport<br />
(6.4 km)<br />
Accommodates residual motor vehicle demands<br />
across the CNR East screenline, reflecting<br />
growth in the suburban communities of<br />
Riverside South and Leitrim, as well as the<br />
projected air travel growth at <strong>Ottawa</strong>’s<br />
International Airport<br />
Not started<br />
Alta Vista<br />
<strong>Transportation</strong><br />
Corridor<br />
New four-lane road (including<br />
two bus lanes) from Nicholas<br />
Street / Highway 417<br />
interchange to Conroy Road at<br />
Walkley Road (5.5 km)<br />
Addresses the capacity deficiency across the<br />
Smyth/Hydro screenline and relieves shortcutting<br />
through existing residential communities<br />
Completed<br />
Bank Street<br />
Widen from two to four lanes<br />
from south of Leitrim Road to<br />
Findlay Creek Drive (2.4 km)<br />
Provides capacity for growth in Leitrim<br />
Not started<br />
Widen from two to four lanes<br />
from Findlay Creek Drive to<br />
Parkway Road (5.2 km)<br />
Provides capacity for growth in Riverside South,<br />
Leitrim and Greely areas<br />
Not started<br />
Barnsdale Road Widen from two to four lanes<br />
from Highway 416 to Prince<br />
of Wales Drive, requiring a<br />
new interchange (3.2 km)<br />
Required in conjunction with recommended<br />
Barnsdale Road - Highway 416 interchange (a<br />
second Highway 416 interchange to serve<br />
growing Barrhaven / Nepean South)<br />
Not started<br />
Belcourt<br />
Boulevard<br />
Widen from two to four lanes<br />
and new four-lane road from<br />
Innes Road to Navan Road<br />
(3.2 km)<br />
Provides access to development in Orléans south<br />
of Innes Road<br />
See Note 1<br />
Belcourt<br />
Boulevard /<br />
Mer Bleue Rd.<br />
connection<br />
Blackburn<br />
Hamlet Bypass<br />
(Innes Road)<br />
New four-lane road, south of<br />
Innes Road, from Belcourt<br />
Boulevard to Mer Bleue Road<br />
(0.6 km)<br />
Widen from four to six lanes<br />
from Innes Road (west<br />
entrance to Blackburn Hamlet)<br />
to Navan Road (2.3 km)<br />
Provides access to development in Orléans south<br />
of Innes Road<br />
Addresses capacity deficiencies across the<br />
Greens Creek screenlines and provides arterial<br />
road service for the growth areas in south<br />
Orléans<br />
See Note 1<br />
Not started<br />
Blackburn<br />
Hamlet Bypass<br />
Extension<br />
New two-lane road (later four<br />
lane) from the existing<br />
Blackburn Hamlet By-pass to<br />
Frank Kenny Road (10 km)<br />
Provides access to development in Orléans south<br />
of Innes Road<br />
Completed<br />
Cambrian Road Widen from two to four lanes Provides access to development in Barrhaven<br />
Completed EA<br />
TRANSPORTATION MASTER PLAN Page 99<br />
NOVEMBER 2008
Road Projects<br />
Project General Description Rationale EA Status<br />
from new Greenbank Road to<br />
Jockvale Road (1.8 km)<br />
South phases 1 and 2<br />
in Barrhaven<br />
South CDP<br />
Campeau Drive Widen from two to four lanes<br />
from Didsbury Road to March<br />
Road (3.0 km)<br />
Provides continuity in the north Kanata area, and<br />
addresses capacity and parking needs in the<br />
Kanata Town Centre<br />
Completed<br />
New four-lane road from<br />
Didsbury Road to new North-<br />
South arterial in Kanata West<br />
(1.5 km)<br />
Accommodates Kanata West Development<br />
Completed<br />
Carp Road<br />
Widen from two to four lanes<br />
from Highway 417 to<br />
Hazeldean Road (2.0 km)<br />
Provides capacity for growth in Stittsville<br />
Not started<br />
Chapman Mills<br />
Drive<br />
New four lane road from<br />
Strandherd Road to<br />
Woodroffe Avenue (2.5 km)<br />
Serves the development of the Barrhaven Town<br />
Centre<br />
See Note 1<br />
Coventry Road Widen from two to four lanes<br />
from Belfast Road to St.<br />
Laurent Centre (0.4 km)<br />
Continuity through commercial and industrial<br />
area between four-lane sections of Coventry<br />
Road<br />
Not started<br />
Eagleson Road Widen from two to four lanes<br />
from Cadence Gate to Hope<br />
Side Road (1.4 km)<br />
Earl Armstrong<br />
Road<br />
Widen from two to four lanes<br />
from River Road to High<br />
Road (7.2 km)<br />
Provides capacity for additional travel demands<br />
from new development areas and continuity from<br />
the four-lane Eagleson Road to Hope Side Road<br />
Completed<br />
Provides capacity for growth in Riverside South Completed<br />
New two-lane road from High<br />
Road to Bank Street (2.8 km)<br />
Provides capacity for growth in Riverside South<br />
and completes linkage to Bank Street<br />
Not started<br />
Earl Grey<br />
Drive –<br />
Goulbourn<br />
Forced Road<br />
Underpass of Terry Fox Drive Relieve operational, safety and local<br />
development access to/from Kanata Centrum and<br />
Kanata West<br />
See Note 1<br />
Fallowfield<br />
Road<br />
Widen from two to four lanes<br />
from Strandherd Drive to<br />
Greenbank Road (3.1 km)<br />
Provides capacity to service growth in the<br />
Nepean South Urban Community<br />
Completed<br />
Widen from two to four lanes<br />
from Woodroffe Ave to Prince<br />
of Wales Drive (2.7 km)<br />
Provides capacity to service growth in the<br />
Nepean South Urban Community<br />
Completed<br />
TRANSPORTATION MASTER PLAN Page 100<br />
NOVEMBER 2008
Road Projects<br />
Project General Description Rationale EA Status<br />
Frank Kenny<br />
Road extension<br />
New four-lane road from realigned<br />
Trim Road to south of<br />
Innes Road (2.2 km)<br />
Provides network continuity and capacity for<br />
additional traffic generated by development<br />
growth in Orléans<br />
Completed<br />
Goulbourn<br />
Forced Road<br />
re-alignment<br />
Re-aligned and new two-lane<br />
road from Terry Fox Drive to<br />
Kanata Avenue (2.2 km)<br />
Provides capacity for growth in Kanata North See Note 1<br />
Greenbank<br />
Road<br />
Widen from two to four lanes<br />
from Malvern Drive to<br />
Strandherd (1.4 km)<br />
Accommodates growth within the Nepean South<br />
Urban Community<br />
Completed<br />
New four lane road from near<br />
Jockvale Road to Cambrian<br />
Road (1.9 km)<br />
Accommodates growth within the Nepean South<br />
Urban Community<br />
Completed<br />
Hazeldean<br />
Road<br />
Widen from two to four lanes<br />
from Carp Road to Terry Fox<br />
Drive (4.4 km)<br />
Accommodates growth in Stittsville and Kanata<br />
West<br />
Completed<br />
Hope Side Road Widen from two to four lanes<br />
from Eagleson Road to<br />
Richmond Road (2.0 km)<br />
New two-lane road from<br />
Richmond Road to Highway<br />
416 (5.7 km)<br />
Provides capacity and network continuity for<br />
growth areas in Kanata<br />
Provides capacity and network continuity for<br />
growth areas in Kanata<br />
Initiated<br />
Initiated<br />
Hunt Club<br />
Road<br />
Widen from four to six lanes<br />
from Riverside to Bank Street<br />
(4.4 km)<br />
Addresses capacity deficiencies at Rideau River<br />
South Manotick Screenlines, in conjunction with<br />
the Strandherd/Armstrong river crossing<br />
Not started<br />
Hunt Club<br />
Road extension<br />
New two-lane road (later four<br />
lanes) from Hawthorne Road<br />
to connect to Highway 417,<br />
requiring a new interchange<br />
(1.4 km)<br />
Provides arterial access to the provincial freeway<br />
network and completes link from Highway 417<br />
east to Highway 416 in the west end<br />
Completed<br />
Huntmar Drive Widen from two to four lanes<br />
from Campeau Drive<br />
extension to Cyclone Taylor<br />
Boulevard (0.6 km)<br />
Widen from two to four lanes<br />
from Palladium Drive to<br />
Maple Grove Road (0.9 km)<br />
Accommodates Kanata West Development<br />
Accommodates Kanata West Development<br />
Not started<br />
Completed<br />
Innes-Walkley- New four-lane road (initial Relieves congestion at Highway 417 Completed<br />
TRANSPORTATION MASTER PLAN Page 101<br />
NOVEMBER 2008
Road Projects<br />
Project General Description Rationale EA Status<br />
Hunt Club Link phase two-lanes) from Hunt<br />
Club / new Highway 417<br />
interchange to Innes Road<br />
west of Blackburn Hamlet<br />
(4.7 km)<br />
interchanges and services development in<br />
Orléans south<br />
Jockvale Road<br />
Widen from two to four lanes<br />
from Jock River to Prince of<br />
Wales (2.5 km)<br />
Accommodates development access and growth<br />
for development within the Nepean South Urban<br />
Community<br />
Initiated<br />
Kanata Avenue Upgrade existing two-lanes<br />
from Terry Fox Drive to<br />
Goulbourn Forced Road (1.5<br />
km)<br />
Provides capacity for development in Kanata<br />
North<br />
See Note 1<br />
Kanata West<br />
Main Street<br />
New two-lane road from<br />
Palladium Drive to Maple<br />
Grove Road (2.0 km)<br />
Provides capacity for development in Kanata<br />
West<br />
See Note 1<br />
Kanata West<br />
North-South<br />
arterial<br />
New two-lane road from<br />
Hazeldean Road to Fernbank<br />
Road (3.0 km)<br />
Provides capacity for development in Kanata<br />
West and provides a bypass for Stittsville Main<br />
Street congestion<br />
Initiated in<br />
Fernbank CDP<br />
New four-lane road from realigned<br />
Palladium Drive (at<br />
Huntmar) to Hazeldean Road<br />
(1.8 km)<br />
Provides capacity for development in Kanata<br />
West<br />
Completed<br />
Katimavik<br />
Road<br />
Widen from two to four lanes<br />
from Terry Fox Drive to<br />
Eagleson Road (2.8 km)<br />
Provides continuity between four-lane section of<br />
Palladium Drive and Eagleson Road<br />
Not started<br />
Leitrim Road<br />
Widen from two to four lanes<br />
from River Road to east of<br />
Limebank Road (1.75 km)<br />
Provides capacity for development in Riverside<br />
South<br />
Completed<br />
New four-lane re-aligned road<br />
from east of Limebank Road<br />
to Bowesville Road (2.6 km)<br />
Provides capacity for development in Riverside<br />
South<br />
See Note 1<br />
Limebank Road Widen from two to four lanes<br />
from Riverside Drive to south<br />
of Earl Armstrong Road (5.1<br />
km)<br />
Widen from two to four lanes<br />
from south of Earl Armstrong<br />
Road to Mitch Owens Road<br />
Addresses capacity deficiencies across the<br />
Leitrim screenline, in conjunction with the<br />
widening of Riverside Drive and Bank Street<br />
Addresses capacity deficiencies across the<br />
Leitrim screenline, in conjunction with the<br />
widening of Riverside Drive and Bank Street<br />
Completed<br />
Not completed<br />
TRANSPORTATION MASTER PLAN Page 102<br />
NOVEMBER 2008
Road Projects<br />
Project General Description Rationale EA Status<br />
(3.8 km)<br />
Longfields<br />
Drive<br />
New two-lane road from<br />
Woodroffe Avenue to South<br />
Pointe Business Park (1.2 km)<br />
Provides capacity to disperse additional traffic<br />
generated by development growth in South<br />
Pointe Business Park<br />
Completed<br />
New four-lane road from<br />
Strandherd Drive to Jock<br />
River (1.7 km)<br />
Accommodates development access and growth<br />
for development within the Nepean South Urban<br />
Community<br />
Completed<br />
Maple Grove<br />
Road<br />
Widen from two to four lanes<br />
from Terry Fox Drive to<br />
Huntmar Drive (1.7 km)<br />
Accommodates Kanata West Development<br />
Completed<br />
March Road<br />
Widen from two to four lanes<br />
from Morgan’s Grant Way to<br />
Dunrobin Road (3.4 km)<br />
Provides additional vehicular capacity to growth<br />
areas in north Kanata<br />
Completed<br />
McKenna<br />
Casey Road<br />
New four-lane road from<br />
Strandherd Road towards<br />
Highway 416 (2.0 km)<br />
Provides capacity to service growth in the<br />
Nepean South Urban Community<br />
See Note 1<br />
Mer Bleue<br />
Road<br />
Widen from two to four lanes<br />
from Innes Road to south of<br />
Renaud Road (2.0 km)<br />
Provide capacity for the development areas south<br />
of Innes Road<br />
Completed<br />
New four-lane re-alignment,<br />
west of existing Mer Bleue<br />
Road, from south of Renaud<br />
Road to Navan Road (1.4 km)<br />
Provide capacity for the development areas south<br />
of Innes Road<br />
Completed<br />
Navan Road<br />
Widen from two to four lanes<br />
from Blackburn Hamlet Bypass<br />
Extension to Mer Bleue<br />
Road (2.9 km)<br />
Provide capacity for the development areas south<br />
of Innes Road<br />
Not Started<br />
<strong>Ottawa</strong> Road<br />
174<br />
Widen from four to six lanes<br />
from Highway 417 to Jeanne<br />
d’Arc (7.7 km)<br />
Addresses local capacity, operational and safety<br />
issues<br />
Not started<br />
Palladium<br />
Drive<br />
Realignment<br />
Realign in vicinity of Huntmar<br />
Road to new North-South<br />
arterial (0.5 km)<br />
Accommodates Kanata West Development<br />
Completed<br />
Portobello<br />
Boulevard<br />
Widen from two to four lanes<br />
from Charest Way to the<br />
Blackburn Hamlet By-pass<br />
Services growth in south Orléans See Note 1<br />
TRANSPORTATION MASTER PLAN Page 103<br />
NOVEMBER 2008
Road Projects<br />
Project General Description Rationale EA Status<br />
Extension (1.2 km)<br />
Prince of Wales<br />
Drive<br />
Widen from two to four lanes<br />
from Fisher Avenue to<br />
Woodroffe Avenue (10.6 km)<br />
Addresses capacity deficiencies at CNR West<br />
screenline<br />
Initiated<br />
Richmond<br />
Road<br />
Widen from two to four lanes<br />
from Carling Avenue to<br />
Woodroffe Avenue (2.3 km)<br />
Addresses capacity deficiencies at the Western<br />
Parkway screenline<br />
Not started<br />
Widen from three to four lanes<br />
from Woodroffe Avenue to<br />
Golden Avenue (1.9 km)<br />
New Rideau<br />
River Bridge<br />
Crossing<br />
Additional bridge crossing<br />
across Rideau River, at a<br />
location to be determined<br />
between Hunt Club Road and<br />
future Strandherd - Earl<br />
Armstrong Bridge<br />
Addresses, towards end of planning period,<br />
capacity deficiency at the Rideau River South<br />
Manotick screenline<br />
Not started<br />
Riverside Drive Widen from two to four lanes<br />
(phase 1) and then four to six<br />
lanes (phase 2) from Hunt<br />
Club Road to Limebank Road<br />
(1.75 km)<br />
Addresses capacity deficiencies at the Leitrim<br />
screenline, in conjunction with the widening of<br />
Limebank Road and Bank Street<br />
Completed<br />
St. Joseph<br />
Boulevard<br />
Widen from two to four lanes<br />
from east of Tenth <strong>Line</strong> Road<br />
to Dairy Road (1.7 km)<br />
Provides capacity for additional traffic generated<br />
by Orléans urban growth<br />
Completed<br />
Strandherd<br />
Drive<br />
Widen from two to four lanes<br />
from Fallowfield Road to<br />
Jockvale Road (3.4 km)<br />
Widen from four to six lanes<br />
from Jockvale Road to<br />
Woodroffe Avenue (2.8 km)<br />
Addresses capacity deficiencies at the Rideau<br />
River South and Manotick screenlines, in<br />
conjunction with a Strandherd-Earl Armstrong<br />
Rideau River Bridge and Earl Armstrong Road<br />
widening<br />
Completed<br />
New four-lane road from<br />
Woodroffe Avenue to Prince<br />
of Wales (1.4 km)<br />
Strandherd -<br />
Earl Armstrong<br />
Rideau River<br />
Bridge<br />
New bridge crossing of<br />
Rideau River to tie into Earl<br />
Armstrong Road on east side<br />
of Rideau River<br />
Addresses capacity deficiencies at the Rideau<br />
River South and Manotick screenlines, in<br />
conjunction with Strandherd Road and Earl<br />
Armstrong Road widenings<br />
Completed<br />
TRANSPORTATION MASTER PLAN Page 104<br />
NOVEMBER 2008
Road Projects<br />
Project General Description Rationale EA Status<br />
Tenth <strong>Line</strong><br />
Road<br />
Widen from two to four lanes<br />
from south of Innes Road to<br />
north of urban boundary (1.6<br />
km)<br />
Services growth south of Innes Road<br />
Not started<br />
Terry Fox<br />
Drive<br />
New two-lane road from<br />
Innovation Road /<br />
Flamborough Way to south of<br />
Richardson Side Road (4.5<br />
km)<br />
Provides access to adjacent developments<br />
Completed<br />
Widen from two to four lanes<br />
from March Road to south of<br />
Richardson Side Road (4.5<br />
km)<br />
Accommodates the vehicular capacity<br />
deficiencies for growth areas in Kanata<br />
Completed<br />
Widen from four to six lanes<br />
from Campeau Drive to<br />
Palladium Drive (1.2 km)<br />
Accommodates Kanata West Development<br />
Not started<br />
Widen from two to four lanes<br />
from Winchester Drive to<br />
Eagleson Road at Hope Side<br />
Road (3.6 km)<br />
Provides access to adjacent developments<br />
Completed<br />
Trim Road<br />
Widen/re-align Trim Road<br />
from two to four lanes from<br />
North Service Road north of<br />
<strong>Ottawa</strong> Road 174 to<br />
Blackburn Hamlet By-Pass<br />
Extension (5.4 km)<br />
Provides network continuity and capacity for<br />
additional traffic generated by development<br />
growth in Orléans<br />
Completed<br />
West Hunt<br />
Club<br />
Widen from four to six lanes<br />
from Highway 416 to Prince<br />
of Wales Drive (9.0 km)<br />
Services on-going development/redevelopment<br />
along corridor and makes full use of Rideau<br />
River Bridge<br />
Not started<br />
Note 1: Process to meet requirements of the <strong>Plan</strong>ning Act and/or the Environmental Assessment Act is to<br />
occur or has occurred.<br />
TRANSPORTATION MASTER PLAN Page 105<br />
NOVEMBER 2008
ANNEX C – Glossary<br />
Area traffic management: Processes and techniques to preserve neighbourhood liveability by<br />
mitigating undesirable effects of vehicle travel including excessive volumes and speeds,<br />
aggressive driver behaviour and the creation of unfavourable conditions for walking and cycling<br />
Asset management: Measures to preserve the physical integrity of infrastructure by managing its<br />
condition and determining optimal reinvestment and renewal schedules<br />
Barrier-free: A design characteristic that maximizes accessibility for persons with disabilities<br />
Bus lane: A roadway lane dedicated for use by public transit vehicles that may be open to mixed<br />
traffic at some hours of the day or days of the week, and that may also be open to other vehicles<br />
such as carpools, taxis or bicycles<br />
Bus rapid transit (BRT): Fast, frequent, limited-stop bus service that operates within an<br />
exclusive right-of-way or with priority measures over mixed traffic in shared corridors<br />
Carpool: A vehicle with two or more occupants who are ridesharing<br />
Carpool lanes: A roadway lane dedicated for use by carpools (i.e. vehicles meeting minimum<br />
occupancy criteria, usually two or three persons) and buses, that may be open to mixed traffic at<br />
some hours of the day or days of the week, and that may also be open to other vehicles such as<br />
taxis or bicycles<br />
Carpool parking lot: A location for carpool participants to park their cars and consolidate into<br />
one vehicle, usually located at or beyond the edge of the urban area<br />
Cash-in-lieu of parking: A practice permitting developers to pay a charge in lieu of constructing<br />
the minimum parking spaces required by zoning regulations, thereby financially enabling the<br />
provision of City-owned public parking facilities<br />
Central Area: The area defined in the City’s Official <strong>Plan</strong> -- Schedule B that includes LeBreton<br />
Flats, Parliament Hill and the business district to its immediate south plus the areas around the<br />
Rideau Centre and the Byward Market<br />
Cordon: An imaginary line composed of one or more screenlines, usually enclosing a geographic<br />
area<br />
Development charges: A charge levied by the City of <strong>Ottawa</strong> on new development to help pay<br />
for growth-related infrastructure development<br />
Environmental assessment: A planning process that is mandated by provincial and federal<br />
legislation, and that requires the systematic identification and mitigation of the effects of<br />
transportation projects on all aspects of the environment<br />
Greenbelt: A band of green space 200 square kilometres in size, owned by the National Capital<br />
Commission and comprising the Macdonald-Cartier International Airport, farms, research<br />
TRANSPORTATION MASTER PLAN Page 106<br />
NOVEMBER 2008
institutes, forests and wetlands, that separates the older urban portions of <strong>Ottawa</strong> from its newer<br />
suburban communities and rural areas<br />
Growth management strategy: A comprehensive strategy identifying long-term objectives for<br />
<strong>Ottawa</strong>’s physical, social and economic development, and actions to achieve them<br />
Inner Area: The section of the City bounded by the <strong>Ottawa</strong> River, the rail line, and the Rideau<br />
River<br />
Level of service: An indicator of the quality of operating conditions that may be applied to<br />
cycling or walking facilities (to reflect connectivity, convenience and comfort), transit service (to<br />
reflect speed, reliability and frequency) or roadways (to reflect the ratio of vehicle demand to<br />
roadway capacity, and resultant delay)<br />
Light rail transit (LRT): Rail transit technology capable of operating in a variety of physical<br />
environments, ranging from exclusive right-of-way to mixed traffic environments on public<br />
streets, as single vehicles or multiple-vehicle consists<br />
Modal share: The percentage of person-trips made by one travel mode, relative to the total<br />
number of person-trips made by all modes<br />
Modal split: The percentage of person-trips made by either transit or automobile, relative to the<br />
total number of person-trips made by motorized modes (i.e. transit and automobile, combined)<br />
Multi-use pathways: Off-road facilities for travel by walking, cycling and other modes such as<br />
in-line skating, that serve both recreational and utilitarian travel needs<br />
OC Transpo: The identity of the City’s public transit system<br />
O-Train: The identity of the rail component of the City’s public transit system<br />
Para Transpo: Identity of the specialized door-to-door transit service provided for persons with<br />
disabilities<br />
Park & Ride lots: Parking lots, usually located at rapid transit stations, that allow automobile<br />
users to transfer to and from transit service in a convenient manner<br />
Peak hour: The hour of greatest person-trip demand within a given peak period<br />
Peak period: A period of high person-trip demand on weekday mornings and afternoons,<br />
generally measured as two hours long in the morning and two-and-a half hours in the afternoon<br />
Performance measurement: Monitoring of indicators that enable an understanding of<br />
conditions, actions and impacts that describe progress towards key objectives<br />
Person-trip: A trip made by one person using any mode of travel<br />
Rapid transit: Fast, frequent, high-capacity transit service provided using either bus or rail<br />
technology, operating in an exclusive right-of-way or otherwise undelayed by mixed traffic in<br />
shared corridors<br />
Ridesharing: Shared use of a motor vehicle by two or more persons to make a trip, when they<br />
would otherwise travel separately<br />
TRANSPORTATION MASTER PLAN Page 107<br />
NOVEMBER 2008
Road diet: A rehabilitation of an existing multilane roadway to reduce the number of motor<br />
vehicle travel lanes, usually from four to three or two lanes, with increased capacity for<br />
alternative travel modes such as cycling and walking while still allowing for efficient and safe<br />
movement of motor vehicles<br />
Screenline: An imaginary line that crosses all major transportation facilities in a corridor,<br />
typically drawn along a feature (such as a river or railway) having a limited number of crossing<br />
points<br />
Transit priority corridors: connecting with to rapid transit corridors, these corridors are<br />
equipped with a set of coordinated priority measures that give transit vehicles preferential<br />
treatment over other vehicles. These priority measures may include peak-period transit only<br />
lanes, short dedicated lane segments, queue-jumps and traffic signal priority<br />
Transit priority measures: Strategies to increase transit operating speeds and transit travel time<br />
reliability in mixed traffic, such as traffic signal priority or queue jumps<br />
Transitway: A rapid transit facility in the form of a roadway designed for the exclusive use of<br />
buses and other authorized vehicles<br />
<strong>Transportation</strong> demand management (TDM): A range of strategies that encourage individuals<br />
to reduce the number of trips they make, to travel more often by non-driving alternatives, to travel<br />
outside peak periods and to reduce the length of their trips<br />
<strong>Transportation</strong> system management (TSM): A range of strategies that maximize the efficient<br />
operation of the road system through operational measures and localized infrastructure<br />
modifications, for the benefit of all modes of travel<br />
<strong>Transportation</strong> vision: An expression of what a desirable future transportation system might<br />
look like, and how it can benefit residents<br />
Truck route system: A network of designated roadways that have been designed and constructed<br />
to permit and withstand use by heavy trucks<br />
Urban Area: The area defined in the City Of <strong>Ottawa</strong> Official <strong>Plan</strong> as urban which includes all<br />
lands inside the Greenbelt, the Greenbelt itself, and the three urban communities outside it<br />
TRANSPORTATION MASTER PLAN Page 108<br />
NOVEMBER 2008
Maps<br />
Map 1<br />
Map 2<br />
Map 3<br />
Major Multi-Use Pathways (Urban)<br />
Primary Urban Cycling <strong>Transportation</strong> Network<br />
Rural Cycling Network and Major Multi-Use Pathways (Rural)<br />
Map 4a Rapid Transit Network - 2031<br />
Map 4b<br />
Map 4c<br />
Map 5a<br />
Map 5b<br />
Map 6<br />
Map 7<br />
Map 8<br />
Map 9<br />
Map 10a<br />
Map 10b<br />
Map 10c<br />
Rapid Transit Network - Ultimate<br />
Conceptual Interprovincial Transit Corridors<br />
Phase 1 - Transit Infrastructure Projects<br />
Phase 2 - Transit Infrastructure Projects<br />
Urban Road Network<br />
Central Area/Inner City Road Network<br />
Rural Road Network<br />
Road Network – Select Villages<br />
Phase 1 - Roads Infrastructure Projects<br />
Phase 2 - Roads Infrastructure Projects<br />
Phase 3 - Roads Infrastructure Projects<br />
TRANSPORTATION MASTER PLAN Page 109<br />
NOVEMBER 2008