Use of Active Optical Sensors for Crops in Brazil
Use of Active Optical Sensors for Crops in Brazil
Use of Active Optical Sensors for Crops in Brazil

You also want an ePaper? Increase the reach of your titles
YUMPU automatically turns print PDFs into web optimized ePapers that Google loves.
Yield, kg/ha<br />
BRAZIL<br />
<strong>Use</strong> <strong>of</strong> <strong>Active</strong> <strong>Optical</strong> <strong>Sensors</strong><br />
<strong>for</strong> <strong>Crops</strong> <strong>in</strong> <strong>Brazil</strong><br />
By J.P. Mol<strong>in</strong><br />
<strong>Active</strong> optical sensors have been evaluated as a new approach <strong>for</strong> precision agriculture<br />
and have been successfully used on gra<strong>in</strong> crops and cotton <strong>for</strong> real-time, site-specific N<br />
management. The Precision Agriculture Research Group <strong>of</strong> the University <strong>of</strong> São Paulo<br />
has been <strong>in</strong>volved with several activities related to the major optical sensors currently<br />
on the market (GreenSeeker, CropCircle, and N-Sensor).<br />
Better <strong>Crops</strong>/Vol. 94 (2010, No. 3)<br />
18<br />
Dur<strong>in</strong>g the last 3 years, the behavior <strong>of</strong> the normalized<br />
difference vegetation <strong>in</strong>dex (NDVI) <strong>in</strong> wheat, triticale,<br />
barley, corn, cotton, and sugarcane was evaluated us<strong>in</strong>g<br />
similar procedures <strong>in</strong> a series <strong>of</strong> field plots. Experiments have<br />
shown <strong>in</strong>creas<strong>in</strong>g NDVI read<strong>in</strong>gs <strong>in</strong> response to <strong>in</strong>creas<strong>in</strong>g N<br />
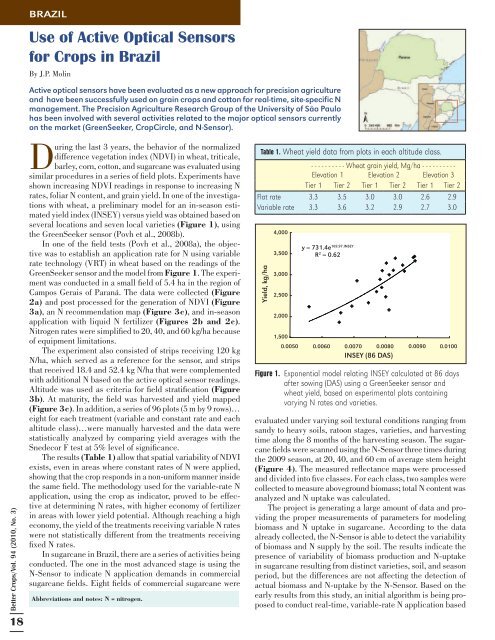
rates, foliar N content, and gra<strong>in</strong> yield. In one <strong>of</strong> the <strong>in</strong>vestigations<br />
with wheat, a prelim<strong>in</strong>ary model <strong>for</strong> an <strong>in</strong>-season estimated<br />
yield <strong>in</strong>dex (INSEY) versus yield was obta<strong>in</strong>ed based on<br />
several locations and seven local varieties (Figure 1), us<strong>in</strong>g<br />
the GreenSeeker sensor (Povh et al., 2008b).<br />
In one <strong>of</strong> the field tests (Povh et al., 2008a), the objective<br />
was to establish an application rate <strong>for</strong> N us<strong>in</strong>g variable<br />
rate technology (VRT) <strong>in</strong> wheat based on the read<strong>in</strong>gs <strong>of</strong> the<br />
GreenSeeker sensor and the model from Figure 1. The experiment<br />
was conducted <strong>in</strong> a small field <strong>of</strong> 5.4 ha <strong>in</strong> the region <strong>of</strong><br />
Campos Gerais <strong>of</strong> Paraná. The data were collected (Figure<br />
2a) and post processed <strong>for</strong> the generation <strong>of</strong> NDVI (Figure<br />
3a), an N recommendation map (Figure 3c), and <strong>in</strong>-season<br />
application with liquid N fertilizer (Figures 2b and 2c).<br />
Nitrogen rates were simplified to 20, 40, and 60 kg/ha because<br />
<strong>of</strong> equipment limitations.<br />
The experiment also consisted <strong>of</strong> strips receiv<strong>in</strong>g 120 kg<br />
N/ha, which served as a reference <strong>for</strong> the sensor, and strips<br />
that received 18.4 and 52.4 kg N/ha that were complemented<br />
with additional N based on the active optical sensor read<strong>in</strong>gs.<br />
Altitude was used as criteria <strong>for</strong> field stratification (Figure<br />
3b). At maturity, the field was harvested and yield mapped<br />
(Figure 3c). In addition, a series <strong>of</strong> 96 plots (5 m by 9 rows)…<br />
eight <strong>for</strong> each treatment (variable and constant rate and each<br />
altitude class)…were manually harvested and the data were<br />
statistically analyzed by compar<strong>in</strong>g yield averages with the<br />
Snedecor F test at 5% level <strong>of</strong> significance.<br />
The results (Table 1) allow that spatial variability <strong>of</strong> NDVI<br />
exists, even <strong>in</strong> areas where constant rates <strong>of</strong> N were applied,<br />
show<strong>in</strong>g that the crop responds <strong>in</strong> a non-uni<strong>for</strong>m manner <strong>in</strong>side<br />
the same field. The methodology used <strong>for</strong> the variable-rate N<br />
application, us<strong>in</strong>g the crop as <strong>in</strong>dicator, proved to be effective<br />
at determ<strong>in</strong><strong>in</strong>g N rates, with higher economy <strong>of</strong> fertilizer<br />
<strong>in</strong> areas with lower yield potential. Although reach<strong>in</strong>g a high<br />
economy, the yield <strong>of</strong> the treatments receiv<strong>in</strong>g variable N rates<br />
were not statistically different from the treatments receiv<strong>in</strong>g<br />
fixed N rates.<br />
In sugarcane <strong>in</strong> <strong>Brazil</strong>, there are a series <strong>of</strong> activities be<strong>in</strong>g<br />
conducted. The one <strong>in</strong> the most advanced stage is us<strong>in</strong>g the<br />
N-Sensor to <strong>in</strong>dicate N application demands <strong>in</strong> commercial<br />
sugarcane fields. Eight fields <strong>of</strong> commercial sugarcane were<br />
Abbreviations and notes: N = nitrogen.<br />
Table 1. Wheat yield data from plots <strong>in</strong> each altitude class.<br />
- - - - - - - - - - Wheat gra<strong>in</strong> yield, Mg/ha - - - - - - - - - -<br />
Elevation 1 Elevation 2 Elevation 3<br />
Tier 1 Tier 2 Tier 1 Tier 2 Tier 1 Tier 2<br />
Flat rate 3.3 3.5 3.0 3.0 2.6 2.9<br />
Variable rate 3.3 3.6 3.2 2.9 2.7 3.0<br />
4,000<br />
3,500<br />
3,000<br />
2,500<br />
2,000<br />
1,500<br />
y = 731.4e 169.97.INSEY<br />
R 2 = 0.62<br />
0.0050 0.0060 0.0070 0.0080 0.0090 0.0100<br />
INSEY (86 DAS)<br />
Figure 1. Exponential model relat<strong>in</strong>g INSEY calculated at 86 days<br />
after sow<strong>in</strong>g (DAS) us<strong>in</strong>g a GreenSeeker sensor and<br />
wheat yield, based on experimental plots conta<strong>in</strong><strong>in</strong>g<br />
vary<strong>in</strong>g N rates and varieties.<br />
evaluated under vary<strong>in</strong>g soil textural conditions rang<strong>in</strong>g from<br />
sandy to heavy soils, ratoon stages, varieties, and harvest<strong>in</strong>g<br />
time along the 8 months <strong>of</strong> the harvest<strong>in</strong>g season. The sugarcane<br />
fields were scanned us<strong>in</strong>g the N-Sensor three times dur<strong>in</strong>g<br />
the 2009 season, at 20, 40, and 60 cm <strong>of</strong> average stem height<br />
(Figure 4). The measured reflectance maps were processed<br />
and divided <strong>in</strong>to five classes. For each class, two samples were<br />
collected to measure aboveground biomass; total N content was<br />
analyzed and N uptake was calculated.<br />
The project is generat<strong>in</strong>g a large amount <strong>of</strong> data and provid<strong>in</strong>g<br />
the proper measurements <strong>of</strong> parameters <strong>for</strong> model<strong>in</strong>g<br />
biomass and N uptake <strong>in</strong> sugarcane. Accord<strong>in</strong>g to the data<br />
already collected, the N-Sensor is able to detect the variability<br />
<strong>of</strong> biomass and N supply by the soil. The results <strong>in</strong>dicate the<br />
presence <strong>of</strong> variability <strong>of</strong> biomass production and N-uptake<br />
<strong>in</strong> sugarcane result<strong>in</strong>g from dist<strong>in</strong>ct varieties, soil, and season<br />
period, but the differences are not affect<strong>in</strong>g the detection <strong>of</strong><br />
actual biomass and N-uptake by the N-Sensor. Based on the<br />
early results from this study, an <strong>in</strong>itial algorithm is be<strong>in</strong>g proposed<br />
to conduct real-time, variable-rate N application based
A. B. C.<br />
Figure 2. Scann<strong>in</strong>g the field with the sensor (A); N VRT application based on the post-processed map (B) and (C).<br />
on sensor read<strong>in</strong>gs.<br />
The use <strong>of</strong> field plots to evaluate<br />
the behavior <strong>of</strong> NDVI <strong>in</strong> sugarcane<br />
is labor <strong>in</strong>tensive because <strong>of</strong> the<br />
amount <strong>of</strong> material need<strong>in</strong>g to be<br />
manually harvested. Despite this<br />
difficulty, experiments were conducted<br />
to measure the effect on<br />
NDVI <strong>of</strong> <strong>in</strong>creas<strong>in</strong>g N rates, plant N<br />
content, and yield. In these studies,<br />
the sensor used was the CropCircle.<br />
Measurements were collected <strong>for</strong><br />
vary<strong>in</strong>g soil textures rang<strong>in</strong>g from<br />
sandy to heavy clay soils, different<br />
ratoon stages, and harvest<strong>in</strong>g<br />
times. The fertilizer treatments<br />
were N rates rang<strong>in</strong>g from 0 to 200<br />
kg/ha. The <strong>in</strong>itial results <strong>in</strong>dicated<br />
that the sensor was able to dist<strong>in</strong>guish<br />
among N rates, allow<strong>in</strong>g <strong>for</strong><br />
an algorithm capable <strong>of</strong> real-time<br />
application <strong>of</strong> N to be developed.<br />
Figure 6 shows examples <strong>of</strong> read<strong>in</strong>gs<br />
collected at 50 and 75-cm<br />
height, on four experiments vary<strong>in</strong>g<br />
<strong>in</strong> crop age and soil types. The<br />
results <strong>in</strong>dicate that the vegetation<br />
<strong>in</strong>dex behavior follows a similar<br />
pattern as the crop grows, but is<br />
still sensitive to field conditions,<br />
thus requir<strong>in</strong>g specific models <strong>for</strong><br />
different situations.<br />
In another study on sugarcane,<br />
active optical sensors were tested<br />
to evaluate the correlation between<br />
Figure 4. Sugarcane field status at the scanned stages.<br />
A. B.<br />
NDVI (79 DAS)<br />
0.620 - 0.710<br />
0.710 - 0.760<br />
0.760 - 0.800<br />
0.800 - 0.840<br />
0.840 - 0.920<br />
100 0 100 200 300 400 Meters<br />
C. D.<br />
Total area: 2.45 ha<br />
20 kg N/ha (1.22 ha)<br />
40 kg N/ha (1.09 ha)<br />
60 kg N/ha (0.14 ha)<br />
Total area: 2.87 ha<br />
20 kg N/ha (0.85 ha)<br />
40 kg N/ha (1.48 ha)<br />
60 kg N/ha (0.54 ha)<br />
Elevation 1<br />
Elevation 2<br />
Elevation (m)<br />
749 - 768<br />
768 - 782<br />
782 - 796<br />
100 0 100 200 300 400 Meters<br />
100 0 100 200 300 400 Meters<br />
Elevation 3<br />
Yield (kg/ha)<br />
1,500 - 2,500<br />
2,500 - 3,000<br />
3,000 - 3,500<br />
3,500 - 4,000<br />
4,000 - 5,500<br />
Figure 3. Map <strong>of</strong> NDVI at 79 DAS (A), three altitudes (B), N rated applied (C), wheat yield (D).<br />
20 cm 40 cm 60 cm<br />
N<br />
Better <strong>Crops</strong>/Vol. 94 (2010, No. 3)<br />
19
Real N-uptake, kg/ha<br />
120<br />
100<br />
80<br />
60<br />
40<br />
y = 0,952x + 1,648<br />
R 2 = 0.943<br />
y = 1,071x - 1,142<br />
R 2 = 0.859<br />
First field<br />
Second field<br />
L<strong>in</strong>ear (first field)<br />
L<strong>in</strong>ear (Second field)<br />
Better <strong>Crops</strong>/Vol. 94 (2010, No. 3)<br />
20<br />
20<br />
0<br />
0 20 40 60 80 100 120<br />
Predicted N-uptake, kg/ha<br />
Figure 5. Sensor-predicted N uptake plotted aga<strong>in</strong>st actual<br />
N-uptake <strong>for</strong> two fields, one on sandy soil and the second<br />
on clay soil.<br />
NDVI<br />
NDVI<br />
0.60<br />
0.58<br />
0.56<br />
0.54<br />
0.52<br />
0.50<br />
0.48<br />
0.46<br />
R 2 = 0.780 R 2 = 0.927 R 2 = 0.806 R 2 = 0.990<br />
0.44<br />
0 50 100 150 200<br />
Nitrogen rate, kg/ha<br />
0.60<br />
0.58<br />
0.56<br />
0.54<br />
0.52<br />
0.50<br />
0.48<br />
0.46<br />
A.<br />
sandy soil 2°ratoon sandy soil 3°ratoon clay soil 2°ratoon<br />
B.<br />
R = 0.728 R = 0.919 R = 0.869 R = 0.888<br />
0.44<br />
0 50 100 150 200<br />
Nitrogen rate, kg/ha<br />
sandy soil 2°ratoon sandy soil 3°ratoon clay soil 2°ratoon<br />
clay soil 4°ratoon<br />
clay soil 4°ratoon<br />
Figure 6. NDVI curves <strong>for</strong> N rates applied to four sugarcane<br />
experiments. Read<strong>in</strong>gs were collected at 50-cm (A) and<br />
75-cm height (B) (after Amaral et al., 2010).<br />
Legend<br />
Stand (1.16 ha)<br />
NDVI<br />
0.80<br />
NDVI and crop failures. Manual measurements are regularly<br />
conducted by a quality control crew between 2 and 3 months<br />
after plant<strong>in</strong>g and require significant labor. High levels <strong>of</strong><br />
failures <strong>in</strong>dicate the necessity <strong>of</strong> site-specific replant<strong>in</strong>g or <strong>in</strong><br />
some cases total replant<strong>in</strong>g <strong>of</strong> a field. The same process may<br />
be used as criteria to decide on a ratoon field, when it has to<br />
be elim<strong>in</strong>ated <strong>for</strong> replant<strong>in</strong>g, based on crop failures. Initially,<br />
plots were located <strong>in</strong>side several fields and scanned. Results<br />
show high correlations between NDVI and the percentage <strong>of</strong><br />
crop failure measured by the conventional method, <strong>in</strong>dicat<strong>in</strong>g<br />
that it may be a promis<strong>in</strong>g alternative <strong>for</strong> failure measurement<br />
on sugarcane areas. As an example, one small field (1.16 ha)<br />
was scanned every two rows and the map (Figure 7) shows<br />
the vegetation <strong>in</strong>dex levels dropp<strong>in</strong>g <strong>in</strong> some spots, <strong>in</strong>dicat<strong>in</strong>g<br />
the presence <strong>of</strong> failures that may be properly managed. BC<br />
Dr. Mol<strong>in</strong> is with Dept. <strong>of</strong> Biosystems Eng<strong>in</strong>eer<strong>in</strong>g, Luiz de Queiroz<br />
College <strong>of</strong> Agriculture, University <strong>of</strong> São Paulo, Piracicaba, SP, <strong>Brazil</strong>;<br />
e-mail: jpmol<strong>in</strong>@usp.br.<br />
References<br />
Alvares, C.A., C.F. Oliveira, F.T. Valadao, J.P. Mol<strong>in</strong>, J.V. Salvi, and C. Fortes.<br />
2008. Sensoriamento remoto no mapeamento de falhas de plantio em canade-açúcar<br />
(Remote sens<strong>in</strong>g <strong>for</strong> plant<strong>in</strong>g failures mapp<strong>in</strong>g on sugarcane)<br />
In <strong>Brazil</strong>ian Conference <strong>of</strong> Precision Agriculture 2008, CD, p. 467-481.<br />
Amaral, L.R. and J.P. Mol<strong>in</strong>. 2010. Confecção de curvas de dose/resposta ao<br />
nitrogênio em cana-se-açúcar mensuradas com sensor ótico (Generation <strong>of</strong><br />
nitrogen dose/response curves measured with optic sensor). Internal Report.<br />
Povh, F.P., L.M. Gimenez, J.V. Salvi, and J.P. Mol<strong>in</strong>. 2008a. Aplicação de nitrogênio<br />
em taxa variável em trigo (Nitrogen application with variable<br />
rate <strong>in</strong> wheat) In <strong>Brazil</strong>ian Conference <strong>of</strong> Precision Agriculture 2008, CD,<br />
p. 420-434.<br />
Povh, F.P, J.P. Mol<strong>in</strong>, L.M. Gimenez, V. Pauletti, R. Mol<strong>in</strong>, and J.V. Salvi. 2008b.<br />
Comportamento do NDVI obtido por sensor ótico ativo em cereais (Behavior<br />
<strong>of</strong> NDVI obta<strong>in</strong>ed from an active optical sensor <strong>in</strong> cereals). Pesquisa<br />
Agropecuária Brasileira, v. 43, p.1075-1083.<br />
0.0<br />
0 12.5 25 50 meters<br />
Figure 7. Map <strong>of</strong> NDVI levels obta<strong>in</strong>ed from sugarcane rows. Low<br />
<strong>in</strong>dex levels were associated with cane failures 100 days<br />
after plant<strong>in</strong>g (after Alvares et al., 2008).<br />
N