ANNUAL REPORT 2012 - TiGenix
ANNUAL REPORT 2012 - TiGenix
ANNUAL REPORT 2012 - TiGenix

Create successful ePaper yourself
Turn your PDF publications into a flip-book with our unique Google optimized e-Paper software.
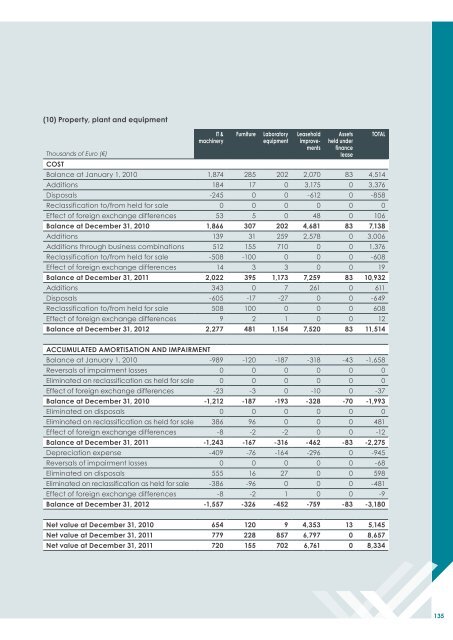
(10) Property, plant and equipment<br />
Thousands of Euro (€)<br />
IT &<br />
machinery<br />
Furniture<br />
Laboratory<br />
equipment<br />
Leasehold<br />
improvements<br />
Assets<br />
held under<br />
finance<br />
lease<br />
COST<br />
Balance at January 1, 2010 1,874 285 202 2,070 83 4,514<br />
Additions 184 17 0 3,175 0 3,376<br />
Disposals -245 0 0 -612 0 -858<br />
Reclassification to/from held for sale 0 0 0 0 0 0<br />
Effect of foreign exchange differences 53 5 0 48 0 106<br />
Balance at December 31, 2010 1,866 307 202 4,681 83 7,138<br />
Additions 139 31 259 2,578 0 3,006<br />
Additions through business combinations 512 155 710 0 0 1,376<br />
Reclassification to/from held for sale -508 -100 0 0 0 -608<br />
Effect of foreign exchange differences 14 3 3 0 0 19<br />
Balance at December 31, 2011 2,022 395 1,173 7,259 83 10,932<br />
Additions 343 0 7 261 0 611<br />
Disposals -605 -17 -27 0 0 -649<br />
Reclassification to/from held for sale 508 100 0 0 0 608<br />
Effect of foreign exchange differences 9 2 1 0 0 12<br />
Balance at December 31, <strong>2012</strong> 2,277 481 1,154 7,520 83 11,514<br />
TOTAL<br />
ACCUMULATED AMORTISATION AND IMPAIRMENT<br />
Balance at January 1, 2010 -989 -120 -187 -318 -43 -1,658<br />
Reversals of impairment losses 0 0 0 0 0 0<br />
Eliminated on reclassification as held for sale 0 0 0 0 0 0<br />
Effect of foreign exchange differences -23 -3 0 -10 0 -37<br />
Balance at December 31, 2010 -1,212 -187 -193 -328 -70 -1,993<br />
Eliminated on disposals 0 0 0 0 0 0<br />
Eliminated on reclassification as held for sale 386 96 0 0 0 481<br />
Effect of foreign exchange differences -8 -2 -2 0 0 -12<br />
Balance at December 31, 2011 -1,243 -167 -316 -462 -83 -2,275<br />
Depreciation expense -409 -76 -164 -296 0 -945<br />
Reversals of impairment losses 0 0 0 0 0 -68<br />
Eliminated on disposals 555 16 27 0 0 598<br />
Eliminated on reclassification as held for sale -386 -96 0 0 0 -481<br />
Effect of foreign exchange differences -8 -2 1 0 0 -9<br />
Balance at December 31, <strong>2012</strong> -1,557 -326 -452 -759 -83 -3,180<br />
Net value at December 31, 2010 654 120 9 4,353 13 5,145<br />
Net value at December 31, 2011 779 228 857 6,797 0 8,657<br />
Net value at December 31, 2011 720 155 702 6,761 0 8,334<br />
135