ANNUAL REPORT 2012 - TiGenix
ANNUAL REPORT 2012 - TiGenix
ANNUAL REPORT 2012 - TiGenix

You also want an ePaper? Increase the reach of your titles
YUMPU automatically turns print PDFs into web optimized ePapers that Google loves.
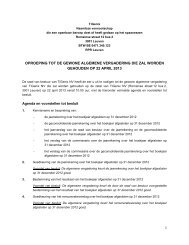
Cash flow<br />
Years ended December 31<br />
Thousands of Euro (€) <strong>2012</strong> 2011 * 2010 *<br />
CASH FLOW FROM OPERATING ACTIVITIES<br />
Operating Result (EBIT) -18,276 -21,805 -16,256<br />
Adjustments for :<br />
Depreciation, amortisation and impairment results 3,911 2,789 2,211<br />
Earnings before interest, taxes, depreciation<br />
-14,365 -19,016 -14,045<br />
and amortisation (EBITDA)<br />
Other adjustments -3,309 424 -2,514<br />
Net cash provided by/(used in) operating activities -17,674 -18,592 -16,559<br />
Net cash provided by/(used in) investing activities -722 15,109 -3,545<br />
Net cash provided by/(used in) financing activities 9,695 17,697 880<br />
Net inbrease/(decrease) in cash and cash equivalents -8,700 14,214 -19,224<br />
Cash and cash equivalents at beginning of year 19,771 5,555 24,745<br />
Effect of currency translation on cash and cash equivalents 1 2 34<br />
Cash and cash equivalents at end of period 11,072 19,771 5,555<br />
*<br />
The 2010 and 2011 consolidated financial statements have been adjusted to reflect the capitalization of the expenses incurred that<br />
were essential to bring the Dutch manufacturing facility into operations<br />
*<br />
Capitalised development costs of KEUR -1,621 that were in 2010 included in the “Net cash provided by/(used in) operating activities”<br />
have been reclassified to “Acquisition/Capitalization of intangible assets” in the “Net cash provided by /(used in) investing activities”.<br />
The net cash used in operating activities<br />
decreased to EUR -17.7 million in <strong>2012</strong> from<br />
EUR -18.6 million in 2011. Main drivers of<br />
the decrease were the decrease in the<br />
operating loss, the increase in depreciation<br />
and amortization costs (mainly driven by the<br />
incorporation of a full year of <strong>TiGenix</strong> SAU,<br />
while in 2011 only 8 months were included,<br />
and the start of the depreciation of the<br />
Dutch manufacturing facility since August<br />
<strong>2012</strong>) and the changes in working capital<br />
related mainly to the increase in sales.<br />
The net cash used in investing activities<br />
amounted to EUR -0.7 million in <strong>2012</strong>,<br />
compared to EUR 15.1 million in 2011. The<br />
main investments in <strong>2012</strong> are related to the<br />
finalization of works in the new manufacturing<br />
172 <strong>TiGenix</strong> I annual report <strong>2012</strong><br />
facility in the Netherlands and IP, while the<br />
2011 investing activities were related to the<br />
leasehold improvements of the manufacturing<br />
facility in the Netherlands, which were<br />
highly compensated by the cash and cash<br />
equivalents acquired through the business<br />
combination with <strong>TiGenix</strong> SAU in May 2011.<br />
The net cash provided by financing activities<br />
amounted to EUR 9.7 million, which mainly<br />
related to the private placement that took<br />
place in December, the proceeds from<br />
different grants and the proceeds from the<br />
ING factoring service, while 2011 financing<br />
activities of EUR 17.7 million were the result of<br />
the rights issue net of costs that took place<br />
after the business combination with <strong>TiGenix</strong><br />
SAU and EUR 3.7 million resulted from the<br />
proceeds from financial loans (obtained in<br />
substitution of grants).