ThermaGRAM Real Time Thermal Software - Thermoteknix Systems ...
ThermaGRAM Real Time Thermal Software - Thermoteknix Systems ...
ThermaGRAM Real Time Thermal Software - Thermoteknix Systems ...

You also want an ePaper? Increase the reach of your titles
YUMPU automatically turns print PDFs into web optimized ePapers that Google loves.
<strong>Real</strong>-time <strong>Thermal</strong> Analysis for Scientific and Industrial Applications
<strong>Real</strong>-time <strong>Thermal</strong> Analysis for Scientific and Industrial Applications<br />
What <strong>ThermaGRAM</strong> does...<br />
<strong>ThermaGRAM</strong> is the mature, industry-standard thermal image analysis<br />
package for real-time data streams.<br />
<strong>ThermaGRAM</strong>’s graphical user interface performs detailed analysis of live or<br />
recorded data sequences and allows you to collate your data into professionally<br />
presented, easy to read charts, data sets and reports.<br />
Multi camera vendor image format support:<br />
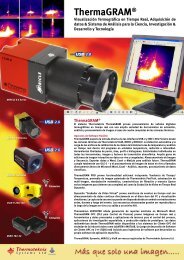
<strong>ThermaGRAM</strong> analyses static images from a wide range of cameras as well as<br />
live sequences from <strong>Thermoteknix</strong> camera models.<br />
<strong>ThermaGRAM</strong> Static image support:<br />
<strong>Thermoteknix</strong> IR50, VisIR Ti-100, VisIR Ti-200 VisIR 640<br />
FLIR<br />
P60, Flir P40, T cam, “E” Range, PM 5XX,<br />
PM 6XX, Omega<br />
NEC 7100, 7800, 9100<br />
Inframetrics<br />
AVIO TVS -600, -700<br />
Mikron<br />
6xx, 7XX, PM2XX, PM3XX, SC1000<br />
7600, 7604, 78XX<br />
<strong>ThermaGRAM</strong> Live image support:<br />
<strong>Thermoteknix</strong> VisIR Ti 200, VisIR 640, Miricle 110K. 307K<br />
Export data in standard ASCII or JPEG formats:<br />
Users very often need to get measurements made in <strong>ThermaGRAM</strong> into third<br />
party packages such as Mathcad for more detailed mathematical analysis<br />
of data. <strong>ThermaGRAM</strong> offers a number of ways in which data can be freely<br />
exported.<br />
Data from measurement tools can be live linked to other packages that support<br />
windows OLE to allow data formatting and reporting in third party software<br />
such as Microsoft Excel. In addition, user defined area tools can be exported<br />
as ASCII tables from static frames in sequence files.<br />
Live image feed<br />
<strong>ThermaGRAM</strong> can receive live radiometric or non-radiometric feeds via the following input sources:<br />
Input format<br />
IEEE 1394 firewire<br />
Cameras supported<br />
FLIR Omega, <strong>Thermoteknix</strong> VisIR Ti200<br />
USB 2 <strong>Thermoteknix</strong> Miricle 110K & 307K,<br />
<strong>Thermoteknix</strong> VisIR 640<br />
GiGE (Pleora Iport)<br />
Miricle 110K, 307K*, VisIR Ti200**<br />
* Use of Miricle cameras with Pleora Iport requires purchase of optional LVDS<br />
de-multiplexer hardware.<br />
** Use of VisIR Ti 200 with Pleora Iport requires purchase of Omega LVDS to Pleora<br />
interface device.
Image Analysis...<br />
Static & real-time images can be processed from a wide range of thermal imaging cameras.<br />
Analysis tools:<br />
Tool type Description Outputs<br />
Spot tool<br />
Line tool<br />
Line Profile<br />
Rectangular area<br />
tool<br />
Elipse Area tool<br />
Polygon area tool<br />
Difference tool<br />
Provides measurement of pixel under the tool. An unlimited<br />
number of spot tools can be used on an image.<br />
Two point (Single) or multipoint (Poly-line) tool with freehand<br />
Line tool option. An unlimited number of line tools can be<br />
used on an image.<br />
An overlay on the thermal image showing a graphical<br />
representation of the temperatures under the single line<br />
between two points in the image. Includes Max, Average and<br />
Min line options as well as a moving cursor for on-screen<br />
temperature measurement. A single line profile can be used<br />
on an image.<br />
User definable rectangular area tool. All pixels within the<br />
area are processed to calculate Max, Ave and Min Values<br />
User definable elipsoidal area tool. All pixels within the area<br />
are processed to calculate Max, Ave and Min Values<br />
User definable polygon area tool, drawn between descrete<br />
points or as a “freehand” line. All pixels within the area are<br />
processed to calculate Max, Ave and Min Values<br />
User can select any two measurement tools and the<br />
difference tool will output the value. User can select one or<br />
more variable (Max, Avg, Min) from multi-output tools.<br />
• Single value<br />
• Line length<br />
• Max, Avg, Min Value<br />
• Input to line chart tool<br />
• Line length<br />
• Max, Avg, Min Value<br />
• Area<br />
• Max, Avg, Min value<br />
• Data within area saved as ASCII<br />
• Area<br />
• Max, Avg, Min value<br />
• Data within area saved as ASCII<br />
• Area<br />
• Max, Avg, Min value<br />
• Data within area saved as ASCII<br />
• Difference value (spot)<br />
• Difference for Max, Avg, Min<br />
(multi-output tools)<br />
Text label Ability to add text labels to images • Text in display output<br />
Isotherm tool<br />
User defined Isotherms (10-off) with individual upper and<br />
lower temperature limits. Individual Isotherms can be false<br />
coloured with single or Palletised range of colours<br />
• Isotherms appear in display<br />
output.
Connect...<br />
The <strong>ThermaGRAM</strong> Work Flow<br />
Output AVI videos<br />
USB<br />
Output reports<br />
Output time/temperature plots<br />
Report generation<br />
The <strong>ThermaGRAM</strong> package can also be used in association with<br />
the “Reporter” software module to facilitate quick report generation<br />
via Microsoft Word templates. Users can select one or more images<br />
for inclusion in reports based on pre-defined templates or templates<br />
designed to the user specification. Both visible and thermal images<br />
are incorporated in report<br />
templates along with optional<br />
features such as charts and<br />
graphs.<br />
Flexible Pipeline Configuration<br />
The image processing pipeline in the <strong>ThermaGRAM</strong> software can be configured to<br />
suit the user application and latency needs or requirements.<br />
Pipeline process Type Description<br />
TDW source Input source Recalled live sequence from *.tdw file<br />
Direct Show Source Input source Used when the input source is from a USB2 device (Used with Miricle and<br />
VisIR 640)<br />
Firewire Source Input source Used when the input is via IEEE 1394 firewire device (Used with VisIR Ti 200<br />
or FLIR Omega)<br />
Iport Source Input source Used when the input source is from a GiGE Device (Used with Miricle cameras<br />
in conjunction with LVDS De-multiplexer)<br />
Frame buffer Timing buffer Used at the end of pipeline to ensure whole frame is available<br />
Dynamite IR Storage Enables frames to be spooled to disk in real-time.<br />
Live Plot Plotting Enables “Plot” to generate a time Vs temperature chart from incoming frames.<br />
Averaging Frame average Allows multi-frame averaging for noise reduction in low dynamic scenes.<br />
Image rotation Rotation Allows rotation of the output display<br />
Miricle control Interface Allows Radiometric data to be accessed, for use with Miricle and VisIR 640<br />
camera types.
<strong>Real</strong>-time <strong>Thermal</strong> Analysis for Scientific and Industrial Applications<br />
<strong>Real</strong>-time image sequence storage and recall<br />
<strong>ThermaGRAM</strong> has an integrated real-time sequence recording and replay system. Image<br />
sequences (Video) is recorded into a proprietary file format which retains radiometric data (TDW).<br />
The storage facility can be initiated by a keyboard or mouse click, or by data within the video<br />
reaching trigger events.<br />
During recall the user can select the playback speed and crop the video to show only the most<br />
important sections of the video. A sequence information display window also shows information<br />
such as, <strong>Real</strong>-time sequence start & Finish, plus sequence duration and current position within<br />
the sequence. Users can step through a sequence one frame at a time if so desired. The playback<br />
can also be used in conjunction with the <strong>Real</strong>-time tools such as areas, spots and the PLOT facility. This ensures that time<br />
critical events can be post-processed at the user’s convenience.<br />
Integral charting and graph generation (Live data)<br />
There are a number of integral graphical charting tools within the <strong>ThermaGRAM</strong> package:<br />
Histogram Line Profile Chart Plot Chart<br />
Histogram - This chart generates a live histogram of the pixels contained within any of the three (Rectangular, Ellipsoidal<br />
and Polygon) area tools. Graphs of live or static data can be exported to third party software supporting Microsoft’s OLE<br />
(Object Linking and Embedding). Compliant packages include, Excel, Word and Open office.<br />
Line Profile Chart - This chart Generates a live display of the pixel values for a line tool in a new window. Graphs of live or<br />
static data can be exported to third party software supporting Microsoft’s OLE (Object Linking and Embedding). Compliant<br />
packages include, Excel, Word and Openoffice.<br />
Plot Chart - This chart generates a time / temperature chart for one or more tool variables. The chart can be generated<br />
from a number of idividual static images or “On the fly” from a live data source such as VisIR 640.<br />
Image filters - <strong>ThermaGRAM</strong> can also be used to apply industry standard and unique Convolution filter techniques to the<br />
incoming images.<br />
Multi-image averaging, trending, peak pick, valley pick - Process frames of information and pick maximum (Peak),<br />
Minimum (Valley) or Average values in a sequence.<br />
Export live data via OPC: (Optional) - In addition to the OLE (Object linking and Embedding) Facility within <strong>ThermaGRAM</strong><br />
there is a secondary option to add an OPC server to the ThermGRAM package. OPC allows data from tools or whole<br />
areas of an image to be output from <strong>ThermaGRAM</strong> using the platform independent OPC interface over any available local<br />
network connection.
<strong>Real</strong>-time <strong>Thermal</strong> Analysis for Scientific & Industrial Applications<br />
<strong>ThermaGRAM</strong> is a real time data acquisition, storage and analysis solution for thermal<br />
imaging systems.<br />
UK Head Office<br />
Teknix House, 2 Pembroke Avenue<br />
Waterbeach, Cambridge, CB25 9QR, UK<br />
Tel: +44 (0)1223 204000 Fax: +44 (0)1223 204010<br />
USA Sales Office<br />
14457 NE 16th Place<br />
Bellevue Washington 98007 USA<br />
Tel: +1 425 746 6080 Fax: +1 425 746 4536<br />
Web: www.thermoteknix.com<br />
Email: sales@thermoteknix.com<br />
Authorised <strong>Thermoteknix</strong> Agent<br />
Specification subject to change.<br />
<strong>ThermaGRAM</strong> ® , Dynamite ® , MIRICLE ® and VisIR ® are registered trademarks of <strong>Thermoteknix</strong> <strong>Systems</strong> Ltd.