Determinants of Unemployment in Limpopo Province in South Africa ...
Determinants of Unemployment in Limpopo Province in South Africa ...
Determinants of Unemployment in Limpopo Province in South Africa ...

You also want an ePaper? Increase the reach of your titles
YUMPU automatically turns print PDFs into web optimized ePapers that Google loves.
Journal <strong>of</strong> Emerg<strong>in</strong>g Trends <strong>in</strong> Economics and Management Sciences (JETEMS) 2(1):54-61 (ISSN:2141-7024)<br />
and “illiterate youth”; where the race comprised<br />
white and coloured; and the “illiterate youth”<br />
comprised no school<strong>in</strong>g, primary, <strong>in</strong>complete<br />
secondary school, youth and old age. Thus the seven<br />
reduced variables were: white, coloured, no<br />
school<strong>in</strong>g, primary, <strong>in</strong>complete secondary school,<br />
youth and old age.<br />
Table 5: Communalities<br />
Initial Extraction<br />
White 1.000 .932<br />
Coloured 1.000 .942<br />
No_school<strong>in</strong>g 1.000 .963<br />
Primary 1.000 .958<br />
Incomplete_secondary 1.000 .989<br />
Youth 1.000 .984<br />
old_age 1.000 .966<br />
Extraction Method: Pr<strong>in</strong>cipal Component Analysis<br />
Source: Global Insight Census, 2008<br />
Table 6: Pr<strong>in</strong>cipal components with variance<br />
expla<strong>in</strong>ed<br />
% <strong>of</strong><br />
Variance<br />
Total<br />
Rotated<br />
Component<br />
1<br />
Rotated<br />
Component<br />
2<br />
Comp<br />
onent Total<br />
1 5.394 77.054 5.394 .208 .943<br />
2 1.340 19.146 1.340 .249 .938<br />
3 .134 1.911 .980 -.045<br />
4 .071 1.019 .916 .344<br />
5 .037 .532 .922 .373<br />
6 .022 .311 .932 .341<br />
7 .002 .027 .892 .414<br />
Source: Global Insight Census, 2008<br />
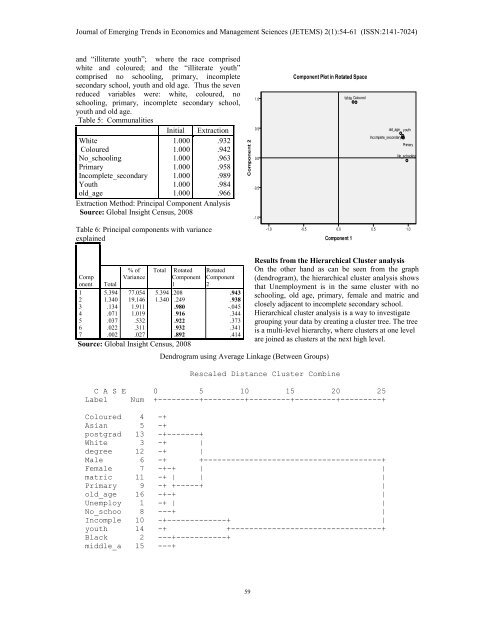
Dendrogram us<strong>in</strong>g Average L<strong>in</strong>kage (Between Groups)<br />
Results from the Hierarchical Cluster analysis<br />
On the other hand as can be seen from the graph<br />
(dendrogram), the hierarchical cluster analysis shows<br />
that <strong>Unemployment</strong> is <strong>in</strong> the same cluster with no<br />
school<strong>in</strong>g, old age, primary, female and matric and<br />
closely adjacent to <strong>in</strong>complete secondary school.<br />
Hierarchical cluster analysis is a way to <strong>in</strong>vestigate<br />
group<strong>in</strong>g your data by creat<strong>in</strong>g a cluster tree. The tree<br />
is a multi-level hierarchy, where clusters at one level<br />
are jo<strong>in</strong>ed as clusters at the next high level.<br />
Rescaled Distance Cluster Comb<strong>in</strong>e<br />
C A S E 0 5 10 15 20 25<br />
Label Num +---------+---------+---------+---------+---------+<br />
Coloured 4 -+<br />
Asian 5 -+<br />
postgrad 13 -+-------+<br />
White 3 -+ |<br />
degree 12 -+ |<br />
Male 6 -+ +---------------------------------------+<br />
Female 7 -+-+ | |<br />
matric 11 -+ | | |<br />
Primary 9 -+ +-----+ |<br />
old_age 16 -+-+ |<br />
Unemploy 1 -+ | |<br />
No_schoo 8 ---+ |<br />
Incomple 10 -+-------------+ |<br />
youth 14 -+ +---------------------------------+<br />
Black 2 ---+-----------+<br />
middle_a 15 ---+<br />
59