annual report 2009 - Fiskars Corporation
annual report 2009 - Fiskars Corporation
annual report 2009 - Fiskars Corporation

You also want an ePaper? Increase the reach of your titles
YUMPU automatically turns print PDFs into web optimized ePapers that Google loves.
<strong>annual</strong> <strong>report</strong> <strong>2009</strong>
2 FISKARS Annual Report <strong>2009</strong><br />
2 –15<br />
Company<br />
<strong>2009</strong> in brief 2<br />
President's review 4<br />
<strong>Fiskars</strong> worldwide 6<br />
Strategy 8<br />
Responsibility 12<br />
Personnel 14<br />
16 – 33<br />
Businesses<br />
Home 18<br />
Garden 22<br />
Outdoor 26<br />
Real Estate 30<br />
Associated company Wärtsilä 33<br />
34 – 43<br />
Governance<br />
Corporate Governance Statement 36<br />
Board of Directors 40<br />
Corporate Management Team 42<br />
Business Area Management 43<br />
44 –101<br />
Financial Statements<br />
Report by the Board of Directors 46<br />
Consolidated Financial Statements, IFRS 50<br />
Financial indicators 82<br />
Parent Company Financial<br />
Statements, FAS 85<br />
Board's proposal to the Annual<br />
General Meeting 98<br />
Auditor's <strong>report</strong> 99<br />
Shares and shareholders 100<br />
102 –103<br />
Investors<br />
Annual review of stock exchange<br />
releases 102<br />
For shareholders 103
Businesses<br />
1<br />
Innovative<br />
products<br />
for the home,<br />
garden, and<br />
outdoors
2 FISKARS Annual Report <strong>2009</strong><br />
Home<br />
Net sales in <strong>2009</strong><br />
€300 mill.<br />
garden<br />
Net sales in <strong>2009</strong><br />
€231 mill.<br />
<strong>2009</strong> in brief<br />
Strong cash flow<br />
in a challenging<br />
market<br />
<strong>Fiskars</strong> continued its strategic transformation into<br />
an integrated consumer products company in <strong>2009</strong>.<br />
The organizational structure was streamlined and numerous<br />
development projects initiated to enhance efficiency.<br />
The company’s two share series were also combined.<br />
Net sales decreased slightly in a challenging market<br />
situation. Operations in North America, in particular,<br />
developed well, and cash flow from operations was<br />
strong across all of <strong>Fiskars</strong>’ businesses.
Company<br />
3<br />
outdoor<br />
Net sales in <strong>2009</strong><br />
€128 mill.<br />
Group key figures <strong>2009</strong> 2008<br />
Net sales, € million 662.9 697.0<br />
Operating profit excl. non-recurring<br />
items, € million<br />
40.0 40.9<br />
Operating profit (EBIT), € million 39.5 6.0<br />
Share of profit from associate<br />
66.5 70.5<br />
Wärtsilä, € million<br />
Profit for the period, € million 83.5 49.2<br />
Balance Sheet total, € million 973.3 969.7<br />
Equity ratio, % 52 46<br />
Net gearing, % 47 69<br />
Cash flow from operating activities*, 95.7 29.8<br />
€ million<br />
Earnings per share, € 1.05 0.64<br />
Equity per share, € 6.16 5.77<br />
Dividend per share, € 0.52**<br />
0.50***<br />
Personnel, end of year 3,623 4,119<br />
663<br />
Net sales totaled<br />
€663 million in<br />
<strong>2009</strong>, and the Group<br />
strengthened<br />
its position in<br />
many markets.<br />
40<br />
Operating profit<br />
excluding nonrecurring<br />
items was<br />
€40 million. Relative<br />
profitability remained<br />
at 2008 levels and<br />
was 6% of net sales.<br />
M€<br />
510<br />
05<br />
M€<br />
34.2<br />
05<br />
530<br />
06<br />
32.8<br />
06<br />
647<br />
07<br />
52.2<br />
07<br />
697<br />
08<br />
40.9<br />
08<br />
663<br />
09<br />
40.0<br />
09<br />
* Without dividends from associate Wärtsilä<br />
** Board’s proposal *** Dividend per series A share
4 FISKARS Annual Report <strong>2009</strong><br />
President’s Review<br />
Towards a new,<br />
more integrated<br />
<strong>Fiskars</strong><br />
<strong>Fiskars</strong> celebrated its 360 th<br />
anniversary in <strong>2009</strong> as Finland’s<br />
oldest company. While<br />
we are very proud of our heritage,<br />
we are also very aware of the<br />
fact that we need to work hard every<br />
day to secure our future success.<br />
This is one reason why we refocused<br />
<strong>Fiskars</strong>’ strategy in <strong>2009</strong> and have<br />
started a change process designed<br />
to achieve a more integrated and efficient<br />
operating model. We believe this<br />
will enable us to become the numberone<br />
company in consumer products<br />
for the home, garden, and outdoors.<br />
Our goal is to focus on international<br />
brands and our most profitable<br />
product categories. We are building<br />
common processes and systems to<br />
secure overall efficiency and provide<br />
a solid foundation for our strong<br />
business areas.<br />
Solid profit performance continued<br />
The market situation in <strong>2009</strong> was<br />
exceptionally challenging, both in<br />
Europe and the Americas. <strong>Fiskars</strong>’<br />
net sales fell by 5% to €663 million<br />
(2008: 697 million). Our relative<br />
profitability remained at 2008 levels,<br />
however, and our operating profit<br />
excluding non-recurring items was<br />
€40 million (41 million). Our earnings<br />
per share improved to €1.05 (0.64).<br />
The structural changes we made<br />
during the year, which clarified our<br />
organizational structure and reduced<br />
our fixed costs, were the major reason<br />
behind our improved profitability in<br />
many areas. A strong cash flow from<br />
our operating activities was also an<br />
excellent achievement and the result<br />
of reduced costs and inventory levels.<br />
This was the case in all of our business<br />
areas in Europe and America.<br />
In addition to a more streamlined<br />
organization, we also simplified<br />
our share structure when we combined<br />
<strong>Fiskars</strong>’ two share series in<br />
the summer. This has brought additional<br />
transparency to our ownership<br />
structure and can better meet the<br />
demands of the modern securities<br />
markets. The overall goal is to<br />
increase investor interest in <strong>Fiskars</strong>’<br />
share and generate greater liquidity.<br />
A new operating model for<br />
greater competitiveness<br />
The Home business area has been<br />
responsible for <strong>Fiskars</strong>-branded<br />
scissors and kitchen products in<br />
Europe since the beginning of<br />
<strong>2009</strong>, in addition to Iittala, Arabia,<br />
Hackman, and our other highly<br />
respected brands in this area.<br />
The organization of <strong>Fiskars</strong> Home<br />
was streamlined during the year to<br />
clarify responsibilities and decisionmaking<br />
and speed up the product<br />
development process. This should<br />
enable us to generate more commercially<br />
successful new products and<br />
strengthen our position as a leading<br />
company in the home products area.<br />
Iittala stores will continue to drive<br />
international expansion and will also<br />
help open up wider distribution channels<br />
and strengthen the Iittala brand.<br />
Focusing on our brands and<br />
product development<br />
The Garden business area put increasing<br />
focus on the <strong>Fiskars</strong> brand<br />
during <strong>2009</strong> and strengthened its<br />
visibility by increasing marketing<br />
efforts in Germany. In Britain, we<br />
replaced the local licensed brand with<br />
the <strong>Fiskars</strong> brand. Investments have<br />
also been made to develop and extend<br />
the product range in Europe and<br />
America. We believe that con sumerdriven<br />
innovations will enable us to<br />
achieve growth in both our current<br />
product categories and new ones.<br />
Our renewed organization has also<br />
brought greater efficiency. The merger<br />
of the garden and craft units in the<br />
US proved a success, and the fixed
Company<br />
5<br />
costs of the merged business have<br />
decreased appreciably. In Europe,<br />
we transferred the management of<br />
the Garden business to Finland at the<br />
beginning of <strong>2009</strong> and shifted the focus<br />
of operations from a locally-driven<br />
one to a business area driven one.<br />
In the Outdoor business in America,<br />
we have decided to concentrate<br />
on the Gerber brand, which performed<br />
very well during <strong>2009</strong>, despite<br />
the challenging market situation. We<br />
believe that Gerber has the potential<br />
to grow into a strong international<br />
outdoor brand. As part of this shift,<br />
we divested the Brunton brand.<br />
The boat market suffered from<br />
the poor economic situation in <strong>2009</strong>,<br />
although the Buster brand and its<br />
market share continue to be strong.<br />
growth. We need to secure higher<br />
sales even in a weaker market.<br />
Achieving this goal will take time,<br />
and we expect our net sales in 2010<br />
to remain at a similar level to those<br />
we recorded in <strong>2009</strong>.<br />
In conclusion, I would like to thank<br />
our customers, our employees, our<br />
partners, and our shareholders for<br />
<strong>Fiskars</strong>’ 360 th year of operations. We<br />
look forward to continuing to earn<br />
your confidence in the future.<br />
Helsinki, February 2010<br />
Kari Kauniskangas<br />
President & CEO<br />
Targeting new growth<br />
opportunities<br />
<strong>Fiskars</strong> remains faced with an uncertain<br />
market situation. Unemployment<br />
is high in our main markets and consumer<br />
demand has not yet returned<br />
to pre-recession levels. As a result,<br />
we will continue efforts to improve<br />
our profitability in 2010.<br />
In terms of our strategy, however,<br />
our focus is increasingly shifting<br />
to identifying new opportunities for
6 FISKARS Annual Report <strong>2009</strong><br />
Canada<br />
<strong>Fiskars</strong>’ garden business<br />
has developed strongly in<br />
Canada, where its weeders<br />
have been particularly<br />
successful. Their sales<br />
rose by 48% in <strong>2009</strong>.<br />
4 8<br />
<strong>Fiskars</strong><br />
worldwide<br />
<strong>Fiskars</strong> operates<br />
internationally. Its products<br />
are sold in over 60 countries<br />
around the world today,<br />
and <strong>Fiskars</strong> has its own<br />
sales company in 20<br />
countries. The Group’s EMEA<br />
organization covers Europe,<br />
Asia, and Australia; while its<br />
Americas organization focuses<br />
on the US and Canada.<br />
Outdoor<br />
America<br />
(Portland)<br />
Garden<br />
America<br />
(Madison)<br />
United States<br />
A batch of knives produced<br />
by Joseph Gerber, the owner<br />
of an advertising agency,<br />
as a gift for his customers<br />
in 1939 became an immediate<br />
success, giving birth to<br />
Gerber Legendary Blades<br />
70 years ago.<br />
1939<br />
M€<br />
216<br />
+1%<br />
M€<br />
218<br />
■<br />
■<br />
AMERIcAs<br />
EMEA Europe, Middle East, Asia-Pacific<br />
Sales company<br />
Net sales in the<br />
EMEA segment<br />
accounted for 67%<br />
of consolidated<br />
net sales.<br />
491<br />
08<br />
-8%<br />
454<br />
09
Company<br />
7<br />
Finland<br />
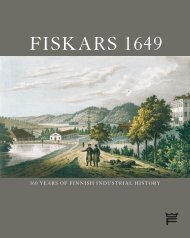
The <strong>Fiskars</strong> ironworks was founded<br />
360 years ago in southern Finland.<br />
Today, <strong>Fiskars</strong>’ plants in Finland<br />
produce homeware and garden<br />
products and boats.<br />
1649<br />
Group headquarters,<br />
Home and Garden EMEA<br />
(Helsinki)<br />
Outdoor EMEA<br />
(Stockholm)<br />
Japan<br />
Iittala’s international<br />
expansion is being<br />
driven by its store<br />
chain. Two new<br />
Iittala stores were<br />
opened in Japan in<br />
<strong>2009</strong>, bringing the<br />
number of Iittala<br />
stores and shopin-shops<br />
worldwide<br />
to over 100.<br />
2<br />
Germany<br />
Sales of garden tools in Germany<br />
rose by nearly 60% in <strong>2009</strong>, thanks<br />
in large part to a successful<br />
marketing campaign designed<br />
to make the <strong>Fiskars</strong> brand betterknown<br />
among German consumers.<br />
6 0<br />
Operating profit<br />
excluding nonrecurring<br />
items<br />
rose in America.<br />
M€<br />
15.5<br />
31.0<br />
08<br />
+54%<br />
-14%<br />
M€<br />
23.9<br />
26.7<br />
09<br />
Personnel numbers<br />
decreased<br />
as a result of<br />
reorganization<br />
measures.<br />
792<br />
3,276<br />
08<br />
-16%<br />
-12%<br />
667<br />
2,899<br />
09
8 FISKARS Annual Report <strong>2009</strong><br />
Transformation into an integrated<br />
branded consumer products company<br />
Holding company<br />
structure<br />
• Conglomerate of<br />
independent companies<br />
• Locally optimized<br />
Integrated<br />
company strategy<br />
• New group structure<br />
and management<br />
• Combination of<br />
share series<br />
• Group-wide integration<br />
program started<br />
Implementation of<br />
the new strategy<br />
–2007 2008–<strong>2009</strong> 2010–2012<br />
• Refined, focused business<br />
area and brand strategies<br />
• Integration of business<br />
processes and systems<br />
• Commercial innovations<br />
and platforms for growth<br />
• Continuous improvement<br />
Strategy<br />
SPECIALIST<br />
BRANDS<br />
in focus<br />
<strong>Fiskars</strong> refocused its strategy during 2008<br />
and <strong>2009</strong> to accelerate its transformation<br />
into an integrated branded consumer<br />
goods company. Our transformation<br />
strives for focus, efficiency, and growth.
Company<br />
9<br />
fiskars’ vision<br />
Our vision is to become the number-one<br />
specialist company for the home, garden,<br />
and outdoors – through premium brands<br />
that lead the field in functionality,<br />
innovation, and design.<br />
<strong>Fiskars</strong>’ strategy is aimed at<br />
making the company the<br />
number-one specialist in<br />
its selected business areas<br />
– Home, Garden, and Outdoor –<br />
through premium brands that lead<br />
the field in functionality, innovation,<br />
and design. The overall goal is to<br />
become an agile and more integrated<br />
company with a portfolio of growing,<br />
profitable businesses.<br />
Focusing on retailers and<br />
consumers<br />
<strong>Fiskars</strong>’ success will be based on<br />
the ability of its business areas to<br />
create must-have products for<br />
both consumers and retailers. We<br />
believe that an increasing number of<br />
consumers prefer strong specialty<br />
brand products and are willing<br />
to pay a premium for such offerings.<br />
Retailers also need specialist<br />
brands that enable them to offer<br />
their customers greater choice and<br />
variety and are capable of offering<br />
them a high return.<br />
<strong>Fiskars</strong> is committed to being<br />
an innovative pioneer in its chosen<br />
business areas. Strong design and<br />
consumer-focused thinking form<br />
the basis for product development.<br />
In addition to unique esthetics,<br />
the Group’s products are renowned<br />
for their excellent functionality<br />
and quality.<br />
Better results through common<br />
ways of working<br />
Internally, <strong>Fiskars</strong> wants to promote<br />
a result-driven organization, where<br />
people have a global mindset and<br />
share best practices across functions<br />
and regions. We also want to help<br />
people grow in their jobs and develop<br />
their competences, to motivate them,<br />
attract new talent, and ensure that<br />
<strong>Fiskars</strong> is a great place to work.
10 FISKARS Annual Report <strong>2009</strong><br />
Focus on specialized<br />
expertise<br />
Strong business areas specialized<br />
in the home, garden, and outdoor<br />
segments form the core of <strong>Fiskars</strong>’<br />
operations. A clear focus is also key<br />
to developing brand strategies. We<br />
have a clearly defined brand hierarchy,<br />
in which every brand has a<br />
specific role to play. Our key brands<br />
are <strong>Fiskars</strong>, Gerber, and Iittala, which<br />
we see as having the most potential<br />
internationally. Arabia, Buster, Hackman,<br />
and Silva are leading brands<br />
in several Nordic countries, and we<br />
will invest in developing these brands<br />
to strengthen their presence.<br />
Our other brands are either leaders<br />
in one country, or have a more tactical<br />
role, such as extending the Group’s<br />
market share or serving a different<br />
price point.<br />
As part of this focus, we will divest<br />
non-core businesses and brands,<br />
such as consumables product lines<br />
in the craft business and the related<br />
brands Heidi Grace and Cloud9,<br />
which were divested in July <strong>2009</strong>.<br />
The Brunton brand, focusing on<br />
camping stoves, portable power,<br />
and other camping gear was sold<br />
in December <strong>2009</strong>.<br />
Our aim is to have a wider harmonization<br />
of our offerings and product<br />
ranges across countries within our<br />
focused business areas and brands.<br />
With more unified, global offerings,<br />
<strong>Fiskars</strong> will be able to achieve the<br />
scale needed to ensure competitiveness<br />
in today's marketplace.<br />
Using common approaches<br />
to drive greater efficiency<br />
In the past, <strong>Fiskars</strong> used to be organized<br />
as a group of independent<br />
companies, with the parent company<br />
acting essentially as a holding<br />
company. The new strategy is based<br />
on active Group-level management<br />
committed to making <strong>Fiskars</strong> a more<br />
integrated company with strong business<br />
areas sharing an integrated<br />
operating model. To drive this<br />
change, we are defining common<br />
business processes, building integrated<br />
systems, and implementing<br />
a global IT infrastructure, to bring<br />
efficiency to our operations. Common<br />
IT systems are also a prerequisite for<br />
making the company’s supply chain<br />
more productive and demand-driven.<br />
Implementing the new operating<br />
model has started with simplifying the<br />
Group’s organizational structure. As<br />
of the beginning of <strong>2009</strong>, the Group<br />
has been divided into two main<br />
operating segments, EMEA and the<br />
Americas, and three key business<br />
areas. Home covers homeware and<br />
school, office, and craft (SOC) products;<br />
Garden concentrates on the<br />
garden and construction tools; and<br />
Three key elements lie at the heart<br />
of <strong>Fiskars</strong>’ strategy and its success.<br />
FOcUS<br />
EFFICIENCY<br />
GROWTH<br />
Focus<br />
• Strong business area focus<br />
• Specialty premium brand portfolio<br />
• Optimized product range<br />
in selected categories<br />
Efficiency<br />
• Simplified structure<br />
• Integrated business processes<br />
to achieve scale and synergies<br />
• Demand-driven supply chain<br />
(sourcing, in-house manufacturing,<br />
logistics)<br />
Growth<br />
• Consumer-focused product<br />
development<br />
• Innovative R&D<br />
• Commercial expansion: New<br />
categories, customers, markets
Company<br />
11<br />
Innovative product<br />
development<br />
will be central to<br />
accelerating growth<br />
new customers and markets in its business<br />
areas. In the Garden business,<br />
for example, <strong>Fiskars</strong> is now entering<br />
lawn care with its new reel mower;<br />
while homeware brand Iittala has<br />
extended its reach into interior decoration<br />
with its Ambient Light concept.<br />
Acquisitions also form part of<br />
<strong>Fiskars</strong>’ strategy, if the businesses in<br />
question represent a good fit in terms<br />
of their products and business focus.<br />
Outdoor focuses on outdoor gear and<br />
boats. The Group’s internal <strong>Fiskars</strong><br />
360° Integration Program initiated in<br />
<strong>2009</strong> has already reached several<br />
milestones in defining common processes<br />
and IT systems, for example.<br />
Growth through innovations<br />
We believe that innovative product<br />
development will be central to<br />
accelerating our growth and build -<br />
ing greater commercial success.<br />
The product creation process draws<br />
inspiration from consumer insight<br />
and customer feedback, is backed<br />
by extensive R&D, and evaluates the<br />
commercial potential of new ideas and<br />
concepts carefully. <strong>Fiskars</strong>’ operations<br />
in over 20 countries provide a valuable<br />
source of consumer insight and other<br />
input for developing new products.<br />
<strong>Fiskars</strong> is constantly looking for<br />
opportunities to expand into new<br />
product categories and embrace<br />
Long-term assets give strength<br />
<strong>Fiskars</strong> has a strong financial<br />
position, partly due to its long-term<br />
forest and real estate assets as well<br />
as its major share ownership in associated<br />
company, Wärtsilä <strong>Corporation</strong>,<br />
which generates dividend-based<br />
cash flow. The real estate and forests<br />
around birthplace in <strong>Fiskars</strong> Village<br />
highlights our 360-year heritage and<br />
creates a solid foundation for building<br />
all our businesses.<br />
The Group’s brand portfolio is based<br />
on a clearly defined brand hierarchy.<br />
Key international brands<br />
Leading global brand for<br />
scissors and garden tools<br />
Internationally renowned<br />
design brand<br />
Essential equipment<br />
for outdoor activities<br />
Leading regional brands<br />
Finland’s most popular<br />
motor boats<br />
Products for outdoor<br />
and wellness<br />
Finnish design for the<br />
home for over 135 years<br />
Nordic expert in<br />
cookware & cutlery<br />
Local and tactical brands<br />
BodaNova<br />
Ebert<br />
Gingher<br />
Höganäs Keramik<br />
Høyang-Polaris<br />
Kaimano<br />
Kitchen Devils<br />
Leborgne<br />
Montana<br />
Raadvad<br />
Rörstrand<br />
Sankey<br />
Zinck-Lysbro
12 FISKARS Annual Report <strong>2009</strong><br />
Responsibility<br />
Products that last<br />
from generation<br />
to generation<br />
Sustainable development<br />
represents a key foundation<br />
of <strong>Fiskars</strong>’ operations and is<br />
very much part of the company’s<br />
360-year heritage. Good economic<br />
performance and a financial<br />
responsibility are central to sustainability,<br />
and enable environmental issues,<br />
social responsibility for personnel,<br />
and cooperation with society as<br />
a whole to be given the attention they<br />
deserve. <strong>Fiskars</strong> also has a special responsibility<br />
to safeguard and develop<br />
the cultural heritage associated with<br />
its birthplace, <strong>Fiskars</strong> Village, and the<br />
numerous iconic design products in<br />
its product portfolio. <strong>Fiskars</strong> sees the<br />
entire life cycle of its products and<br />
their durable nature as fundamental<br />
to its approach to sustainability. The<br />
company’s mission – lasting everyday<br />
design, since 1649 – is part of the<br />
same continuum.<br />
The principles underlying <strong>Fiskars</strong>’<br />
approach to business responsibility<br />
are defined in the company’s Code<br />
of Conduct, which was approved by<br />
the Board of Directors at the end of<br />
2008. During spring <strong>2009</strong>, employees<br />
in all units took part in training based<br />
around these principles. Under its<br />
Code of Conduct, <strong>Fiskars</strong> not only<br />
abides by the laws and regulations<br />
of the countries in which it operates,<br />
but is committed to being a good and<br />
ethically responsible corporate citizen.<br />
Quality production<br />
<strong>Fiskars</strong>’ supply chain, which extends<br />
from in-house manufacturing to<br />
procurement, logistics, and distribution,<br />
is based on sustainable principles.<br />
The company’s own plants,<br />
which total close to 20 units, focus on<br />
their own special areas of expertise.<br />
Manufacturing processes have been<br />
developed to minimize the use of<br />
raw materials and the emissions<br />
and waste they generate.<br />
Supply chain management processes,<br />
together with work on further<br />
developing them, are designed to<br />
ensure that sales needs can be predicted<br />
accurately and production can<br />
respond flexibly to demand. When<br />
production capacity meets demand<br />
as closely as possible, surplus production<br />
can be avoided. Streamlined<br />
logistics also play an important part<br />
in reducing <strong>Fiskars</strong>’ environmental<br />
footprint, and the aim is to eliminate<br />
unnecessary intermediate stages<br />
throughout the overall logistics chain.<br />
Extended responsibility<br />
As a company that operates on<br />
global markets, <strong>Fiskars</strong> interacts with<br />
suppliers and partners from a wide<br />
range of backgrounds and societies.<br />
<strong>Fiskars</strong> expects all its partners<br />
to commit to the human rights set<br />
out in the Universal Declaration of<br />
Human Rights approved by the United<br />
<strong>Fiskars</strong>’ principles of<br />
corporate responsibility<br />
are included in<br />
its Code of Conduct<br />
Nations. An audit of the company’s<br />
supplier network in Asia and Europe<br />
was carried out in <strong>2009</strong>, and monitoring<br />
production conditions at the plants<br />
operated by its partners represents<br />
a tangible example of how <strong>Fiskars</strong><br />
approaches responsibility in practice.<br />
Auditing is designed to monitor<br />
that local laws and regulations are<br />
observed and that occupational safety,<br />
human rights, and environmental issues<br />
are given due attention. The auditing<br />
process in <strong>2009</strong> reviewed a checklist<br />
of 80 items covering areas such as fire<br />
safety, waste and chemical handling,<br />
and employees’ age and pay.<br />
Caring for personnel<br />
<strong>Fiskars</strong>’ social responsibility for<br />
its personnel is particularly under -<br />
lined during economically difficult<br />
times in the communities where the<br />
company is a major employer. The<br />
company is committed to treating all<br />
its people fairly and equally. A safe<br />
workplace is also very much part<br />
of this commitment.<br />
<strong>Fiskars</strong> continued to cooperate<br />
with cancer foundations in <strong>2009</strong> by<br />
donating part of the sales revenue<br />
from its pink garden and home products<br />
to the Pink Ribbon campaign; and<br />
extended its involvement by joining<br />
the Silver Fund dedicated to promoting<br />
research on prostrate cancer.<br />
<strong>Fiskars</strong> also supports local organizations<br />
in the communities where its<br />
plants are located, together with a<br />
small number of carefully selected<br />
national charities, through donations.<br />
Cooperation with the Finnish Design<br />
Museum, the Arabia Art Department<br />
Society, as well as The Cooperative<br />
of Artisans, Designers and Artists<br />
in <strong>Fiskars</strong> forms an important part<br />
of <strong>Fiskars</strong>’ cultural responsibility.
Company<br />
13<br />
Designed for life. Good<br />
design means products that<br />
are timeless, offer true quality,<br />
and are multifunctional<br />
– and represent sustainable<br />
development at its best.<br />
Designed back in 1960,<br />
Iittala’s classic Sarpeneva<br />
cast iron cooking pot is as<br />
practical in the kitchen as<br />
it is beautiful on the table.<br />
Prioritizing<br />
the environment<br />
and quality<br />
The <strong>Fiskars</strong> Group’s products are renowned among consumers<br />
for the excellence of their design and manufacture. In today’s<br />
demanding markets, a reputation for quality like this has to<br />
be earned every day. <strong>Fiskars</strong>’ homeware plants have quality<br />
and environmental systems in place designed to ensure that<br />
operations are continuously developed to reduce the company’s<br />
footprint in terms of resource and energy usage.<br />
Operations at the plants are audited in accordance with ISO<br />
(Inter national Organization for Standardization) standards. The<br />
Sorsa koski cookware plant was the first unit in the Group to receive<br />
both ISO 9001 quality and ISO 14001 environmental certification.<br />
The environmental<br />
and quality<br />
systems at the<br />
Iittala glassworks<br />
are audited in<br />
accordance with<br />
international ISO<br />
standards.<br />
During <strong>2009</strong>, all the environmental and quality systems used in<br />
homeware production, logistics, and procurement in Finland were<br />
audited to ISO 9001:2008 and ISO 14001:2004 standards.<br />
Working for a better environment<br />
Sustainability must always be seen in terms of the big picture,<br />
from raw materials to product usage and recycling. Using raw<br />
materials as cost-effectively as possible and minimizing waste<br />
are central to <strong>Fiskars</strong>’ manufacturing processes.<br />
Personnel play a key role in environmental work, particularly in<br />
areas such as handling hazardous materials, which is why all new<br />
plant employees receive thorough training in environmental matters.<br />
In addition to a proactive approach to the environment, <strong>Fiskars</strong><br />
also expects high quality of its suppliers. <strong>Fiskars</strong> requires subcontractors<br />
to have clear environmental programs in place to<br />
ensure that no products are manufactured in a way that damages<br />
the environment or harms human health.<br />
Helping improve energy efficiency<br />
<strong>Fiskars</strong> is committed to reducing CO 2<br />
emissions at its plants and<br />
throughout its logistics chain. The company works closely with<br />
suppliers and retailers to cut logistics-related emissions, and is<br />
aiming to reduce the amount of energy used in its homeware<br />
manufacturing by 10% by 2016.
14 FISKARS Annual Report <strong>2009</strong><br />
PERSONNEL<br />
Strength<br />
through<br />
diversity<br />
W<br />
ith operations in more<br />
than 20 countries across<br />
multiple business areas,<br />
<strong>Fiskars</strong> has a diverse<br />
employee base. Together with a history<br />
stretching back 360 years and<br />
contributions from people from many<br />
different cultures and backgrounds,<br />
this gives <strong>Fiskars</strong> a very unique asset.<br />
Today the company is beginning to<br />
make even more use of the dynamism<br />
that this diversity offers.<br />
<strong>Fiskars</strong> believes that greater collaboration<br />
will lead to better results<br />
across its global operations and has<br />
launched a number of programs to<br />
enhance collaboration within the<br />
organization. Employee rotation<br />
between different business areas<br />
and regions, for example, brings new<br />
perspective and promotes innovation.<br />
Encouraging personnel to rotate<br />
between different responsibilities can<br />
also help give people a more complete<br />
picture of the business and the<br />
opportunity to explore their potential<br />
and develop new skills.<br />
Aiming for superior<br />
leadership skills<br />
<strong>Fiskars</strong>’ people strategy, approved in<br />
December <strong>2009</strong>, sets a new baseline<br />
for the company’s approach to leadership.<br />
The goal is to make <strong>Fiskars</strong><br />
a company that is recognized for its<br />
leadership capabilities and the way<br />
that it engages and motivates personnel<br />
to deliver exceptional business results.<br />
This ambitious vision, together<br />
with recently introduced development<br />
programs, is designed to enhance<br />
the value and efficiency of the company’s<br />
HR processes and practices.<br />
The new strategy is also designed to<br />
support the implementation of <strong>Fiskars</strong>’<br />
integrated company initiatives.<br />
To ensure that <strong>Fiskars</strong>’ workforce is<br />
driven by the company’s strategic targets,<br />
a program has been launched to<br />
align target-setting across the Group<br />
and highlight employees’ goals and<br />
reward them for good performance.<br />
Enhanced employee review processes<br />
are also been introduced to help<br />
<strong>Fiskars</strong> understand the capabilities<br />
of its employees more effectively and<br />
promote their career development.<br />
<strong>Fiskars</strong> values its employees’ opinions,<br />
and most business units conduct<br />
employee surveys on commitment,<br />
trust, and engagement regularly.<br />
The results of these studies provide<br />
valuable insight on the issues that employees<br />
value the highest, and enable<br />
us to take action to build our strengths<br />
and tackle areas that call for further<br />
development. The Outdoor business<br />
in the Americas, for example, has<br />
been measuring employee satisfaction<br />
and other key areas, such as<br />
people‘s commitment to high product<br />
and ethical standards, for some years.<br />
<strong>Fiskars</strong> celebrated its<br />
360 th anniversary worldwide<br />
<strong>Fiskars</strong> turned 360 on October 31, <strong>2009</strong>. The anniversary<br />
was celebrated in its offices worldwide, including at<br />
the sourcing unit in Shanghai, China, seen here.<br />
An updated identity for<br />
the <strong>Fiskars</strong> brand was<br />
launched on October 31.<br />
<strong>Fiskars</strong>’ orange-handled scissors are produced at its Billnäs<br />
plant in Finland, close to where the company was born and<br />
a very apt location for celebrating 360 years of operation.
Company<br />
15<br />
<strong>Fiskars</strong>’<br />
people<br />
strategy<br />
sets a new<br />
baseline<br />
for the<br />
company’s<br />
approach to<br />
leadership<br />
Appreciating expertise<br />
A commitment to craftsmanship,<br />
together with artisan skills, has been<br />
at the core of <strong>Fiskars</strong>’ operations<br />
throughout the company’s history<br />
– and <strong>2009</strong> was no different. Development<br />
programs combining artisan<br />
skills, design, and industrial manufacturing<br />
have continued to help<br />
our employees develop their unique<br />
skills, ensuring that our heritage is<br />
passed on to future generations.<br />
<strong>Fiskars</strong>’ centuries-long industrial<br />
heritage includes a long-standing<br />
commitment to promoting the health<br />
and safety of employees. Recent<br />
initiatives include the occupational<br />
health program at the Arabia ceramics<br />
plant in Finland, started in 2008,<br />
which has decreased sick leaves<br />
significantly, contributing to a better<br />
quality of life for personnel and<br />
improving production efficiency.<br />
<strong>Fiskars</strong>’ business areas have also<br />
found creative ways to combine<br />
promoting the wellbeing of their employees<br />
with that of their customers.<br />
In the Outdoor EMEA business area,<br />
for example, employees at Silva<br />
in Sweden challenged one of the<br />
company’s largest customers to a<br />
competition to see how close they<br />
could get to the recommended<br />
10,000 steps in their everyday life.<br />
Personnel in <strong>2009</strong><br />
<strong>Fiskars</strong> employed 3,623 people as of<br />
the end of <strong>2009</strong> (2008: 4,119): 2,899<br />
(3,276) in EMEA, 667 (792) in the<br />
Americas, and 57 (51) in Real Estate<br />
and at corporate headquarters.<br />
Reorganization continued to result<br />
in reductions in personnel, in particular<br />
in production plants in Europe.<br />
The merger of the Garden and SOC<br />
units, together with the sale of the<br />
Brunton business, reduced personnel<br />
levels in the Americas.<br />
The Outdoor business area in America is<br />
managed from Portland, Oregon, home to<br />
Gerber Legendary Blades.<br />
<strong>Fiskars</strong>’ active hobbyists,<br />
the Fiskateers, celebrated the big<br />
day at Disney World in Florida.<br />
<strong>Fiskars</strong>’ Italian sales company is based<br />
in Civate, close to the company’s specialist<br />
knife manufacturing plant.
IITTALA.<br />
DESIGNED TO<br />
BE COMBINED.<br />
Long ago, designer Kaj Franck said that<br />
“objects should always be appropriate, durable<br />
and functional”. Objects that can be endlessly<br />
combined in new ways, refreshing everyday<br />
life. At Iittala, we believe that lasting design is<br />
eternally relevant and made to outlive time.
16 – 33<br />
Businesses<br />
Home 18<br />
Garden 22<br />
Outdoor 26<br />
Real Estate 30<br />
Associated company Wärtsilä 33
18 FISKARS Annual Report <strong>2009</strong><br />
Home<br />
A broad<br />
offering<br />
T<br />
he <strong>Fiskars</strong> Group is the market<br />
leader in homeware products<br />
in the Nordic region with a<br />
broad portfolio of respected<br />
brands such as Iittala, <strong>Fiskars</strong>,<br />
Arabia, and Hackman. The Iittala<br />
and <strong>Fiskars</strong> brands are spear -<br />
heading international growth. Iittala<br />
has expanded its offering into interior<br />
design in recent years and strengthened<br />
its brand profile through its retail<br />
concept. Responsibility for developing<br />
<strong>Fiskars</strong>’ scissors and kitchenware<br />
was transferred to the Home business<br />
area at the beginning of <strong>2009</strong>.<br />
Net sales at the Home business<br />
area in <strong>2009</strong>, at €300 million, were 5%<br />
down on 2008. The sales of homeware<br />
products remained close to 2008
Businesses<br />
19<br />
business area<br />
home<br />
Modern design products for the kitchen,<br />
table, crafts, and interior design<br />
Main products: tableware, glassware, cutlery,<br />
scissors, sauce- and frying pans, kitchen knives<br />
and other kitchen utensils, crafts, and interior<br />
design products<br />
€300<br />
45%<br />
1,612<br />
million of net sales in <strong>2009</strong><br />
(2008: €317 million)<br />
of consolidated<br />
net sales<br />
people as of the end of <strong>2009</strong><br />
(2008: 1,824)<br />
Brands
20 FISKARS Annual Report <strong>2009</strong><br />
The<br />
MyIittala<br />
community<br />
now has<br />
over 200,000<br />
members<br />
levels, but sales of school, office, and<br />
craft (SOC) products fell significantly,<br />
partly as a result of the divestment<br />
of two specialist craft brands, Heidi<br />
Grace and Cloud9, in the US in July<br />
<strong>2009</strong>. The goal is to concentrate on<br />
scissors and other cutting tools for<br />
school, office, and craft use.<br />
Streamlining of the organization<br />
has brought major cost savings both<br />
in the US and in Europe. The goal in<br />
the reorganization has also been to<br />
clarify decision-making and speed<br />
up the product development process.<br />
Jaakko Autere took over as President<br />
of the Home business area at the<br />
beginning of 2010.<br />
A growing network of stores<br />
<strong>Fiskars</strong>’ homeware products in the<br />
Nordic countries are sold through<br />
major retail chains, department<br />
stores, specialist shops, and a growing<br />
network of the company’s own<br />
stores. International development<br />
efforts have concentrated on Iittala<br />
stores and selected retailers. As of<br />
the end of the year, the number of<br />
Iittala stores and outlets stood at 75.<br />
Several new stores were opened during<br />
the year, two of them in Japan.<br />
In addition to new stores, investments<br />
were also made in strengthening<br />
other aspects of Iittala’s consumer<br />
interface. The MyIiitala online network<br />
was launched in the spring <strong>2009</strong> to<br />
provide an international community<br />
for loyal customers, and attracted<br />
over 200,000 members during its<br />
first year of operation.<br />
The Finnish homeware distribution<br />
centre moved to larger and more modern<br />
premises at Hämeenlinna in the<br />
spring, and now serves even online<br />
and international sales more efficiently.<br />
Intriguing new<br />
products and classics<br />
The Home business area has set<br />
itself the target of generating a stream<br />
of stronger commercial innovations<br />
to strengthen the presence of its<br />
brands. Iittala’s Ambient Light range<br />
is a reflection of this, and is extending<br />
the reach of the brand into interior<br />
design. August, a novel new light<br />
combining the nostalgia of oil lamps<br />
from centuries past with modern LED<br />
technology, received the Design Plus<br />
award in February <strong>2009</strong>.<br />
In addition to new products like<br />
August, <strong>Fiskars</strong>’ brands in the Home<br />
<strong>Fiskars</strong>’ scissors<br />
selected for<br />
basketball honor<br />
<strong>Fiskars</strong>’ signature orange-handled scissors have been used<br />
to cut the ribbon at numerous openings and other events over<br />
the years. The scissors scored another win in spring <strong>2009</strong> when<br />
they were selected as the official scissors to cut down the nets<br />
at the National Collegiate Athletic Association’s (NCAA ® ) Men’s<br />
and Women’s Basketball Championships in the US.<br />
The specially commissioned scissors, featuring the iconic<br />
ergonomic orange handles and gold titanium blades etched<br />
with the NCAA ® event logo, were used by the winning teams<br />
in the post game net-cutting ceremonies.<br />
Following the championship games, each of the winning<br />
institutions kept one pair of the commemorative scissors<br />
for permanent display on campus.<br />
Paul Tonnesen, President of <strong>Fiskars</strong> Garden Americas,<br />
was particularly proud of the honor: “We hope the special, commemorative<br />
scissors will always serve the champion schools as<br />
a memento of their victory. The choice of <strong>Fiskars</strong> scissors for such<br />
a prestigious role at the NCAA ® basketball championships came<br />
as a very welcome accolade during our 360 th anniversary year.”<br />
Men’s and women’s basketball championships, organized by<br />
the NCAA ® , a non-profit association of colleges and universities<br />
across the US, are watched by millions of TV viewers every year.
Businesses<br />
21<br />
business area also encompass many<br />
much-loved classics. Arabia’s Paratii si<br />
range of tableware celebrated its 40 th<br />
birthday in <strong>2009</strong>, and Iittala’s Origo<br />
tableware celebrated 10 years in production.<br />
Rörstrand’s Mon Amie range<br />
of tableware, designed in the 1950s,<br />
was reintroduced. The Swedish homeware<br />
brand Höganäs Keramik turned<br />
100 in <strong>2009</strong>. Oiva Toikka, the man<br />
behind Iittala’s world-famous glass<br />
birds, will celebrate a career stretching<br />
over 50 years in 2010.<br />
Versatile design.<br />
Argentinean-born designer<br />
Alfredo Häberli has worked<br />
with Iittala for over 10 years.<br />
His designs include the<br />
award-winning Origo range<br />
of tableware and the popular<br />
Essence range of glassware,<br />
which was extended in <strong>2009</strong><br />
with the glass shown here.<br />
Future design<br />
classics<br />
Glorious decoration.<br />
Arabia launched<br />
the Runo range of<br />
tableware, with decoration<br />
inspired by the changing<br />
seasons, in April <strong>2009</strong>.<br />
Each piece offers a different<br />
take on the theme, creating<br />
rich tableware poetry.<br />
An espresso is bound to<br />
taste special from a cup<br />
like this, don’t you think?<br />
New level of endurance.<br />
Hackman’s Rotisser frying pans<br />
combine timeless elegance with<br />
the very best in durability. Their<br />
non-stick Ceratec coating can<br />
take even the hottest temperatures<br />
and flambéing, making them<br />
an ideal choice for both home<br />
cooks and professional chefs.<br />
Sharpness is all. <strong>Fiskars</strong>’ new Takumi range<br />
of premium-quality knives brings a breathe of<br />
Japanese cuisine into the kitchen. They feature<br />
non-slip handles and blades that have been<br />
specially sharpened at an oblique angle on<br />
one side with Japanese precision.<br />
Hobbyist’s helper. <strong>Fiskars</strong>’ new Professional<br />
Grade Stem Cutter is the perfect tool for floral<br />
arranging, and is capable of easily cutting through<br />
even thick wire stems. The convenient tabletop<br />
design frees one hand to hold stems steady while<br />
the other is pressing down to cut.
22 FISKARS Annual Report <strong>2009</strong><br />
Garden<br />
Fruitful<br />
growth<br />
continues<br />
<strong>Fiskars</strong> is the world’s leading<br />
garden cutting tool brand and<br />
its products are sold widely<br />
across Europe, North America,<br />
and Australia. Despite a challenging<br />
market situation, the business developed<br />
positively in <strong>2009</strong>, in part due to<br />
the fact that gardening often becomes<br />
an increasingly popular leisure time<br />
activity during difficult economic times.<br />
In addition to the positive consumer demand<br />
for its products, <strong>Fiskars</strong>’ market<br />
position has been further reinforced by<br />
the company’s commitment to product<br />
innovation. <strong>Fiskars</strong> has a long track<br />
record of introducing functional, easyto-use<br />
tools that gardeners appreciate.<br />
Net sales in the Garden business<br />
area were at 2008 levels at €231
Businesses<br />
23<br />
business area<br />
garden<br />
Ergonomically designed tools for the garden<br />
Main products: pruners, loppers, shears,<br />
axes, weeders, spades and shovels, planters,<br />
rainwater collectors, and construction tools<br />
€231<br />
35%<br />
1,377<br />
million net sales in <strong>2009</strong><br />
(2008: €231 million)<br />
of consolidated<br />
net sales<br />
people as of the end<br />
of <strong>2009</strong> (2008: 1,537)<br />
Brands
24 FISKARS Annual Report <strong>2009</strong><br />
million in <strong>2009</strong>. Sales in the EMEA<br />
region grew in local currencies<br />
but were offset by weaker exchange<br />
rates with Euro. Sales of <strong>Fiskars</strong>branded<br />
products developed well<br />
in European markets, while those<br />
of local brands remained at 2008<br />
levels. A difficult market was reflected<br />
in lower sales of construction tools.<br />
Sales in North America were at the<br />
same level as in 2008.<br />
A number of organizational<br />
changes were introduced in the<br />
Garden area towards the end of<br />
2008, including the transfer of EMEA<br />
management from Belgium to Finland<br />
and combining Garden business<br />
operations in North America with<br />
those of the SOC (School, Office<br />
and Craft) business. These changes<br />
have proven successful and have<br />
Investing in<br />
innovations is<br />
a central part of<br />
<strong>Fiskars</strong>’ strategy<br />
resulted in lower fixed costs. The<br />
more streamlined organization has<br />
helped improve <strong>Fiskars</strong>’ interface<br />
with major distri butors and retailers.<br />
Distinctive black and<br />
orange products<br />
In line with its strategy, the Garden<br />
business is giving increased focus<br />
to developing the <strong>Fiskars</strong> brand. In<br />
Britain, for example, the Wilkinson-<br />
Sword brand was replaced in garden<br />
tools with the <strong>Fiskars</strong> brand in fall<br />
<strong>2009</strong>. Retailers have responded well<br />
to the change, which filtered down to<br />
consumers at the beginning of 2010<br />
when <strong>Fiskars</strong>’ orange and black tools<br />
arrived on store shelves.<br />
As part of the focus on the <strong>Fiskars</strong><br />
brand, a major marketing investment<br />
was made in Germany in <strong>2009</strong> when<br />
a national TV campaign was success-<br />
Getting parks in shape<br />
with the help of Project<br />
Orange Thumb<br />
The Project Orange Thumb initiative was launched<br />
in the US in 2003 as part of <strong>Fiskars</strong>’ commitment to<br />
the environment and the community. Through an<br />
<strong>annual</strong> grant program and scheduled community<br />
garden makeovers, <strong>Fiskars</strong> donates tools and materials<br />
to Project Orange Thumb to revitalize green spaces such<br />
as parks and school grounds that are often seen as<br />
making a valuable contribution to the local quality of life.<br />
Projects are volunteer-driven and are very effective at<br />
bringing local people closer together.<br />
The Project Orange Thumb initiative has spread from<br />
the US to Canada, Australia, New Zealand, and most recently<br />
to Europe in <strong>2009</strong>. The first Project Orange Thumb event in<br />
Britain was organized in April <strong>2009</strong> in the grounds of the Avon<br />
Rugby Club in Bath.<br />
A dash of red and orange to the Park<br />
Finland saw its first Orange Thumb project in October <strong>2009</strong> in<br />
the garden makeover of Katajanokka Park in central Helsinki.<br />
Fourth-graders at the local elementary school were among<br />
the most enthusiastic volunteers and refused to let the chilly<br />
fall weather dampen their spirits. In addition to sweeping up<br />
all the fall leaves, the project planted 5,000 tulip bulbs in camp<br />
fire-style patterns, which should result in a very attractive burst<br />
of orange color when they flower in spring 2010.<br />
The project also added a northern red oak to the park,<br />
jointly planted by <strong>Fiskars</strong>’ CEO Kari Kauniskangas and the CEO<br />
of the major Finnish retail company Kesko, Matti Halmesmäki,<br />
and the Mayor of Helsinki, Jussi Pajunen. The sapling was<br />
specially selected from the forest at <strong>Fiskars</strong> Village to add<br />
a dash of rich red to the park.<br />
The Mayor of Helsinki,<br />
<strong>Fiskars</strong>’ CEO, and<br />
President and CEO<br />
of the retail company<br />
Kesko participated in<br />
Finland’s first Project<br />
Orange Thumb event.
Businesses<br />
25<br />
fully launched to improve <strong>Fiskars</strong>’<br />
visibility among local consumers.<br />
Innovations driven by key<br />
consumer trends open up new<br />
opportunities, which <strong>Fiskars</strong> is keen<br />
to take advantage of. Environmental<br />
awareness is one such trend, as is<br />
people’s desire for more efficient,<br />
sustainable, and easier-to-use tools.<br />
The <strong>Fiskars</strong> Rain water Collection<br />
System, introduced first in the US,<br />
has become a fast-growing success,<br />
and offers people a handy and<br />
eco-friendly way of collecting and<br />
storing rainwater for their watering<br />
needs. The new Momentum reel<br />
mower will be launched in early<br />
2010 in the US. This innovative new<br />
platform is designed to leverage<br />
<strong>Fiskars</strong>’ strengths in cutting, gardening,<br />
and eco-friendly products.<br />
New innovations<br />
for the garden<br />
A smart choice. The <strong>Fiskars</strong> ® Momentum,<br />
a new human powered reel mower launched in<br />
the US is good for your lawn and helps keep<br />
users fit, lawn care costs down, and is great<br />
for the environment as well. The Momentum<br />
mower combines advanced design, patent<br />
pending technology, and superior ergonomics<br />
to deliver a reel mower with best in class cutting<br />
performance. The powerful Inertia Drive reel<br />
is easy to push and leaves a very clean cut<br />
for healthier grass. With minimal noise, no<br />
fuel, and no emissions, the environment<br />
benefits in many ways.<br />
Award-winning design.<br />
<strong>Fiskars</strong>’ new PowerStep<br />
products adjust the number<br />
of cuts needed to prune a branch<br />
automatically depending on<br />
its thickness, helping make<br />
gardening that much easier.<br />
PowerStep pruners and loppers<br />
were named Best of the Best in<br />
the <strong>2009</strong> red dot design awards.<br />
A cleaner chop. The helix<br />
shape of the SAFE-T splitting<br />
wedge reduces shock transmitted<br />
to the arm and the likelihood<br />
of long-term muscle fatigue.<br />
Originally launched under the<br />
Leborge brand, the SAFE-T<br />
received an honorary mention in<br />
the product design category of<br />
the red dot design award in <strong>2009</strong>.<br />
Excellent ergonomics.<br />
Environmentally friendly weeders are<br />
becoming an increasingly popular,<br />
herbicide-free way of keeping weeds<br />
under control. <strong>Fiskars</strong>’ new weeder<br />
makes it even easier to remove thistles,<br />
dandelions, and other invasive weeds.<br />
Thanks to a telescopic handle that<br />
matches users’ height and an easy<br />
eject feature this tool eliminates<br />
the need for stressful bending.
26 FISKARS Annual Report <strong>2009</strong><br />
Outdoor<br />
for<br />
an active<br />
lifestyle<br />
<strong>Fiskars</strong>’ Outdoor business<br />
area is divided into two main<br />
market areas: North America<br />
and the Nordic countries.<br />
Renowned for its knives and multifunction<br />
tools, Gerber has continued<br />
to strengthen its position on the North<br />
American market and numbers<br />
a wide range of end-users among its<br />
customers, from hunters and hikers<br />
enjoying the great outdoors in their<br />
leisure time to soldiers, police and<br />
firemen, who expect only the best<br />
of their tools and equipment. In the<br />
Nordic region, Silva’s everyday exercise<br />
products and Buster boats<br />
enjoy a strong reputation.<br />
Net sales at the Outdoor business<br />
area in <strong>2009</strong>, at €128 million, were
Businesses<br />
27<br />
business area<br />
Outdoor<br />
Innovative, essential outdoor gear and durable<br />
leisure boats<br />
Main products: multi-function tools, sporting<br />
and tactical knives, flashlights and headlamps,<br />
pedo meters, compasses, and aluminum boats<br />
€128<br />
19%<br />
577<br />
million of net sales in <strong>2009</strong><br />
(2008: €145 million)<br />
of consolidated<br />
net sales<br />
people as of the end of <strong>2009</strong><br />
(2008: 707)<br />
12% down on 2008. The business<br />
performed well in the Americas, and<br />
sales to institutional customers in particular<br />
rose. Performance in Europe<br />
was unsatisfactory, however, as boat<br />
sales were poor in a weak market.<br />
Sales of Silva products were also<br />
below 2008 levels, partly as a result<br />
of the weaker Swedish crown.<br />
Streamlining operations<br />
As part of ongoing efforts to focus<br />
its businesses, <strong>Fiskars</strong> sold the<br />
US-based Brunton brand and its<br />
business in December <strong>2009</strong>, as<br />
Brunton’s camping stoves, binoculars,<br />
and other camping equipment<br />
were not seen as forming part of<br />
the Group’s core activities.<br />
Brands
28 FISKARS Annual Report <strong>2009</strong><br />
Various measures were taken to<br />
enhance the efficiency of operations<br />
at the European units in the Outdoor<br />
business during <strong>2009</strong>. Inha Works has<br />
focused on boats to an increasing<br />
extent. The company has outsourced<br />
some areas of production, such as<br />
surface finishing. Juha Lehtola took<br />
over as President of the business<br />
in April <strong>2009</strong>.<br />
A tight business focus<br />
makes it possible<br />
to concentrate<br />
on users’ needs<br />
Strong product development<br />
Gerber’s tight focus on its core<br />
products has enabled it to concentrate<br />
on understanding the needs of its<br />
customers and developing products<br />
to match these needs, something that<br />
has played an important part in its<br />
success in North America. Good cooperation<br />
with major retail chains has<br />
also made an important contribution.<br />
In the boat business, a greater<br />
focus has been given to product<br />
development. Buster launched a new<br />
version of its most popular boat in fall<br />
<strong>2009</strong> at boat shows across the Nordic<br />
region. Despite a weak market, Buster<br />
boats retained a strong market share.<br />
Buster continues to be Finland’s most<br />
popular leisure boat brand and the<br />
biggest-selling aluminum boat brand<br />
in the Nordic countries.<br />
With a product range that goes far<br />
beyond its heritage in compasses,<br />
Silva has systematically expanded its<br />
headlamp offering for active users, and<br />
the advanced functionality and stylish<br />
appearance of its range of headlamps<br />
have won acclaim in numerous reviews,<br />
tests, and design awards.<br />
Listen and learn<br />
Tapping into what consumers really think about your<br />
products and what kind of products they would like can<br />
provide very valuable information for both product and<br />
Category Manager<br />
Laura Niessner<br />
develops Gerber’s<br />
lightning product<br />
range.<br />
business development. That has certainly been the<br />
experience of Gerber Legendary Blades, according to<br />
Category Manager, Lighting Laura Niessner.<br />
“We use customer feedback and input from things like<br />
focus groups to help us understand what needs people<br />
feel are not being met with existing products, for example,<br />
or whether a concept we’re developing is likely to get<br />
consumers’ attention,” says Laura.<br />
Gerber looks ahead between three and five years<br />
when it assesses what kind of market position it wants<br />
to be in when it comes to particular product categories,<br />
and reviews the trends in these with a mixture of focus<br />
groups, interviews, and surveys.<br />
“We seek out representative consumers in these<br />
areas, lighting in my case, to help determine what kind<br />
of products offer the most potential, and then share these
Businesses<br />
29<br />
New equipment for<br />
people on the move<br />
An updated favorite.<br />
The latest generation of the<br />
Nordic region’s most popular<br />
motorboat, the Buster L, was<br />
launched in fall <strong>2009</strong>. The boat<br />
features a completely new<br />
hull and interior that set a new<br />
standard in ergonomics and<br />
materials. Thanks to very<br />
thorough testing, it also offers<br />
improved driving performance.<br />
For serious exercising.<br />
Weatherproof Silva Trail Runner<br />
headlamps provide an efficient<br />
source of light whatever<br />
the conditions. The Trail Runner<br />
received the OutDoor Industry<br />
Award at the iF Design Awards<br />
in summer <strong>2009</strong> for its design<br />
and quality.<br />
insights with our design team to create what we call<br />
‘problem statements’ to focus our design resources on<br />
solving specific consumer needs.”<br />
Consumer panels are consulted again during prototyping<br />
to ensure that a design is on the right track, before moving<br />
into production and the launch phase.<br />
Interacting with consumers in this way plays an important<br />
part in ending up with well-designed products that are likely<br />
to be capable of winning new customers and consolidating<br />
the existing customer base, according to Laura.<br />
“It’s certainly been very useful in developing our lights<br />
range. We initially introduced the range in 2004, and it now<br />
features flashlights, hands-free units, and micro-illumination<br />
products. Most of these use LEDs, which have proved<br />
popular with users, because they’re not only highly efficient,<br />
but also very durable and never need to be replaced.”<br />
Easy-to-use sportsman’s knife. Light and designed<br />
for safety, the Gerber Descent folding knife is both practical<br />
and very easy to slip into your pocket. Users can sharpen<br />
its patented blade easily in the field, making it even handier.<br />
Weighting only 77 grams, it is ideal for climbers, hikers,<br />
and others out and about in nature.<br />
Light it with LEDs. The new Gerber TX4 is a weatherproof,<br />
tough flashlight. Featuring sleek design, the TX4 offers<br />
up to eight hours of light, thanks to its battery-saving LEDs.<br />
Whether used to provide a steady source of light or as<br />
a signal, the TX4 could be the only flashlight you need.
30 FISKARS Annual Report <strong>2009</strong><br />
REAL ESTATE<br />
Developing<br />
our land<br />
assets
Businesses<br />
31<br />
Business Area<br />
Other<br />
Covers <strong>Fiskars</strong>’ Real Estate and corporate<br />
headquarter functions<br />
Real Estate is responsible for managing and<br />
leasing properties in <strong>Fiskars</strong> Village and the<br />
company’s other locations, forestry, farming,<br />
and developing <strong>Fiskars</strong> Village as a travel<br />
and conference destination<br />
€6.1<br />
1%<br />
57<br />
million of net sales in <strong>2009</strong><br />
(2008: €5.9 million)<br />
of consolidated<br />
net sales<br />
people as of the end of <strong>2009</strong><br />
(2008: 51)<br />
<strong>Fiskars</strong>’ Real Estate is<br />
re spon sible for managing<br />
and developing the company’s<br />
15,000 hectares of<br />
land and 3,700 hectares of water, the<br />
majority of which are located in and<br />
around <strong>Fiskars</strong> Village and on the<br />
Hanko niemi peninsula in Southern<br />
Finland. Real Estate also manages<br />
the leasing of <strong>Fiskars</strong>’ properties,<br />
which include residential and business<br />
premises and the Group’s<br />
production sites in Finland.<br />
Net sales at the Real Estate business<br />
remained largely unchanged<br />
in <strong>2009</strong> compared to 2008, at €6<br />
million. The business is <strong>report</strong>ed<br />
as part of the segment Other which<br />
covers also corporate headquarters.<br />
Sustainable forestry<br />
<strong>Fiskars</strong>’ Real Estate is responsible<br />
for managing the Group’s forestland,<br />
which includes both productive<br />
stands of timber and various pro -<br />
tected habitats. Forest management<br />
practices are based on a long-term,<br />
sustainable approach. All forestland<br />
is certified under the PEFC system,<br />
and some forest areas and shorelines<br />
are included in voluntary nature<br />
conservancy programs.<br />
Timber from productive stands is<br />
sold standing or delivered to a variety<br />
of partners. Some is sold as bio-energy<br />
fuel to heating utilities in the surrounding<br />
area. Timber is also processed<br />
at the company’s own Laatupuu<br />
sawmill, which produces specialty<br />
wood for furniture and similar uses.<br />
Changes in the fair value of the<br />
company’s standing timber are based<br />
on stumpage prices, and these have<br />
a major impact on Real Estate’s result.<br />
Since the beginning of <strong>2009</strong>, <strong>Fiskars</strong><br />
has presented changes in the value<br />
of its standing timber as a separate<br />
entry in the income statement under the<br />
operating profit. Accounting estimates<br />
are based on three-year rolling average<br />
of stumpage prices, which reflects<br />
the asset’s stable nature. Agricultural<br />
activities, hunting, and fishing are also<br />
managed by <strong>Fiskars</strong>’ Real Estate.<br />
Developing initiatives under way<br />
<strong>Fiskars</strong> Village is easily the most wellknown<br />
part of the Real Estate portfolio
32 FISKARS Annual Report <strong>2009</strong><br />
and has become an internationally<br />
renowned center of Finnish design<br />
and art, attracting around 150,000<br />
visitors a year to its exhibitions, shops,<br />
galleries, workshops, and restaurants.<br />
Real Estate is actively involved in<br />
the development of the Raasepori<br />
area, where one of the most important<br />
projects has been a new land use<br />
plan for <strong>Fiskars</strong> Village, which has<br />
been developed together with the<br />
local municipality. The plan, which<br />
is due to be completed in 2010, will<br />
release new plots of land for leasing<br />
and sale in <strong>Fiskars</strong> Village, and<br />
should ensure the basis for positive<br />
further growth and development<br />
in the area, which has become<br />
a dynamic community and source<br />
of employment for local people.<br />
<strong>Fiskars</strong><br />
Village<br />
attracts<br />
150,000<br />
visitors<br />
a year<br />
Industry and the arts<br />
meet at <strong>Fiskars</strong> Village<br />
<strong>2009</strong> marked not only the 360th anniversary of <strong>Fiskars</strong> as a<br />
company, but also that of <strong>Fiskars</strong> Village. An integral part of<br />
Finland’s industrial and economic history, <strong>Fiskars</strong> Village has<br />
played an important role in the country’s cultural development.<br />
Located in a beautiful municipality of Raasepori in the western<br />
part of the province of Uusimaa, modern-day <strong>Fiskars</strong> is home to<br />
a wide range of arts and crafts. The secret behind the dynamism<br />
of <strong>Fiskars</strong> Village is very much the same as that behind <strong>Fiskars</strong><br />
as a company: an ability to reinvent itself, act boldly, engage<br />
in international dialogue, while retaining a strong and unique<br />
identity all its own.<br />
A pioneer in good working conditions<br />
Western Uusimaa emerged as a center of iron-making during<br />
the period when Finland was still part of Sweden. It was wellendowed<br />
with what the industry needed: thick forest, proximity<br />
to a natural harbor, and rapids that could be harnessed to<br />
generate energy. A number of ironworks were established<br />
in the area in the seventeenth century, when the area’s first<br />
iron -works owners also settled locally.<br />
<strong>Fiskars</strong> Village has the bad luck of one such owner to thank<br />
in part for its birth. After falling on hard times, Jacob Wolle,<br />
a prosperous merchant from Turku, was forced to lease his ironworks<br />
at Antskog and Mustio to the Dutchman, Peter Thorwöste.<br />
The latter was able to expand his business in 1649 when he was<br />
granted permission to found an ironworks at <strong>Fiskars</strong> and build<br />
a blast furnace and a tilt hammer to produce cast and forged<br />
iron products with the exception of cannons.<br />
The <strong>Fiskars</strong> ironworks was an international workplace from<br />
the very start. Iron ore came from the island of Utö in the outer<br />
Stockholm archipelago, and nails, knives, mattocks, and other<br />
products produced at <strong>Fiskars</strong> were sold in Stockholm and Tallinn.<br />
Thorwöste brought employees from abroad as well, and Germans,<br />
Dutchmen, and Swedes all lived at <strong>Fiskars</strong>.<br />
During the centuries that followed, <strong>Fiskars</strong> often took the lead<br />
in many areas of development in Finland. The country’s first<br />
engineering workshop and grinding works were set up at <strong>Fiskars</strong>,<br />
and many progressive new forms of agriculture, including crop<br />
rotation, were introduced under Johan von Julin.<br />
<strong>Fiskars</strong>’ owners were also committed to looking after the welfare<br />
of their workers. A school was opened for employees’ children with<br />
a very progressive curriculum for the time, and a works doctor<br />
appointed and a hospital built in the nineteenth century. The fact<br />
that employees received part of their pay during the early years<br />
in the form of grain, proved a lifesaver – literally – during famine<br />
years. Workers were also allowed to build their own fishing lodges<br />
on the works’ land.<br />
Promoting and developing the arts<br />
Iron is still<br />
being forged<br />
today in<br />
the artisan<br />
workshops at<br />
<strong>Fiskars</strong> Village.<br />
<strong>Fiskars</strong>’ long history is also reflected in the unique milieu that has<br />
grown up around the original ironworks. The buildings that have<br />
been built there over the years are part of Finnish architectural<br />
history, and anyone visiting <strong>Fiskars</strong> Village today can see a unique<br />
blend of stone mansions alongside wooden peasant homes and<br />
historical industrial buildings.<br />
Good design is part of the <strong>Fiskars</strong> heritage. The cutlery and other<br />
everyday items produced by the artisans at <strong>Fiskars</strong> in the nineteenth<br />
century reflected high standards of craftsmanship, and their work underpins<br />
that of the crafts people and designers working there today.<br />
Today’s <strong>Fiskars</strong> is known as a center of creativity. Over 100<br />
crafts people, designers, and artists live and work in <strong>Fiskars</strong><br />
Village, and the exhibitions and events they organize attract visitors<br />
from near and far. <strong>Fiskars</strong> Village has become one of southern<br />
Finland’s most popular and distinctive travel destinations, and has<br />
been presented with the international Royal Award for Sustainable<br />
Tourism. <strong>Fiskars</strong> Village has also become a popular venue for<br />
conferences and seminars through <strong>Fiskars</strong>Forum.<br />
The reputation of <strong>Fiskars</strong> Village has attracted many people<br />
to live locally and made it much sought after. A new land use plan<br />
and various construction projects will enable the Village to grow<br />
and flourish into the future, and breathe new life into the community<br />
and its 360 years of history.
Businesses<br />
33<br />
Associated company<br />
Wärtsilä<br />
Wärtsilä <strong>Corporation</strong> is a global supplier of<br />
marine and energy systems, solutions, and<br />
services, and is listed on NASDAQ OMX<br />
Helsinki (HEX: WRT1V).<br />
Wärtsilä<br />
STRONG<br />
presence<br />
Wärtsilä recorded net sales of €5,260 million in<br />
<strong>2009</strong> (2008: €4,612 million). Its operating profit<br />
was €592 million (525) and earnings per share<br />
€3.94 (3.88). It employed 18,541 people as of<br />
the end of the year.<br />
17.1%<br />
€66.5<br />
€25.3<br />
fiskars’ share of Wärtsilä shares<br />
million was <strong>Fiskars</strong>’ share of<br />
profit in <strong>2009</strong> (2008: 70.5 million)<br />
million paid in dividends to Fis kars<br />
in <strong>2009</strong> (2008: 67.2 million)<br />
Associated company, Wärtsilä<br />
<strong>Corporation</strong>, represents part<br />
of the <strong>Fiskars</strong>’ port folio. As<br />
of the end of <strong>2009</strong>, <strong>Fiskars</strong><br />
owned 17.1% of Wärtsilä's shares and<br />
votes and is the company’s largest<br />
single shareholder, through <strong>Fiskars</strong>’<br />
wholly owned subsidiary, Avlis AB.<br />
Wärtsilä is treated as an associated<br />
company, as <strong>Fiskars</strong> considers<br />
that it continues to have a significant<br />
influence in the company under the<br />
provisions of IAS 28, despite the<br />
fact that its holding fell below 20% in<br />
spring 2008. Wärtsilä’s performance<br />
has a major impact on <strong>Fiskars</strong>’ result,<br />
and this is expected to continue in<br />
the future. The Chairman of <strong>Fiskars</strong>’<br />
Board of Directors, Kaj-Gustaf Bergh,<br />
and its President and CEO, Kari<br />
Kauniskangas, are both members<br />
of Wärtsilä’s Board of Directors.<br />
Wärtsilä forms one of <strong>Fiskars</strong>'<br />
<strong>report</strong>ed operating segments. Since<br />
the beginning of <strong>2009</strong>, <strong>Fiskars</strong>’ share<br />
of Wärtsilä’s profit has been <strong>report</strong>ed<br />
as a separate item below the consolidated<br />
operating profit. The share of<br />
Wärtsilä’s profit for <strong>2009</strong> totaled €66.5<br />
million (2008: 70.5 million).<br />
Wärtsilä paid a dividend of €1.50<br />
per share on its 2008 result in March<br />
<strong>2009</strong>, which gave <strong>Fiskars</strong> dividend<br />
revenue totaling €25.3 million (67.2<br />
million). This dividend revenue is<br />
<strong>report</strong>ed in the Consolidated Statement<br />
of Cash Flows as part of cash<br />
flow from operating activities.<br />
Wärtsilä’s Board of Directors has<br />
proposed paying a dividend of<br />
€1.75 per share on its <strong>2009</strong> result.<br />
<strong>Fiskars</strong> did not sell or buy any Wärtsilä<br />
shares during <strong>2009</strong>, and the balance<br />
sheet value of <strong>Fiskars</strong>’ holding<br />
stood at €316.8 million (263.5 million)<br />
as of the end of the year, including<br />
goodwill of €61.2 million. The market<br />
value of <strong>Fiskars</strong>’ shares in Wärtsilä<br />
as of the end of the year was €472.9<br />
million (353.9 million) when Wärtsilä’s<br />
stock was valued at €28.07 a share.
GERBER.<br />
FEND FOR<br />
YOURSELF. ®<br />
You are a problem solver, a fixer, a doer.<br />
You do not depend on others. Others depend<br />
on you. Gerber creates knives, tools, lights<br />
and gear essential to defending this principle<br />
of self-reliance. This is our charge.
34 – 43<br />
Governance<br />
Corporate Governance Statement 36<br />
Board of Directors 40<br />
Corporate Management Team 42<br />
Business Area Management 43
36 FISKARS Annual Report <strong>2009</strong><br />
Corporate<br />
Governance<br />
Statement<br />
C<br />
orporate governance at <strong>Fiskars</strong><br />
<strong>Corporation</strong> is based on the Company’s<br />
Articles of Association,<br />
Finland’s Companies Act, and the<br />
rules and regulations concerning listed<br />
companies of NASDAQ OMX Helsinki Ltd.<br />
<strong>Fiskars</strong> also complies with the Finnish<br />
Corporate Governance Code approved by<br />
the Securities Market Association, which<br />
came into force on January 1, <strong>2009</strong> and<br />
can be consulted at www.cgfinland.fi.<br />
Ultimate decision-making power is vested<br />
in <strong>Fiskars</strong> <strong>Corporation</strong>’s shareholders<br />
at the General Meeting of Shareholders.<br />
<strong>Fiskars</strong>’ Board of Directors is responsible<br />
for the management and proper arrangement<br />
of the operations of the Company.<br />
The Managing Director is responsible<br />
for the day-to-day management of the<br />
Company under the instructions and<br />
orders of the Board of Directors.<br />
General Meeting<br />
An Annual General Meeting of Shareholders<br />
shall be held <strong>annual</strong>ly before the end<br />
of June, either in Raasepori or Helsinki.<br />
The Annual General Meeting decides on<br />
matters stipulated in the Companies Act<br />
and the Articles of Association, such as<br />
the approval of the financial statements,<br />
the distribution of profits, discharging the<br />
members of the Board of Directors and<br />
the CEO from liability, and the election<br />
of the members of the Board of Directors<br />
and the Company’s Auditors and their<br />
remuneration.<br />
Under the Articles of Association, a notice<br />
convening an Annual General Meeting<br />
must be published in at least three general<br />
newspapers selected by the Board of<br />
Directors. <strong>Fiskars</strong> also publishes invitations<br />
on its website.<br />
Annual General Meeting <strong>2009</strong><br />
<strong>Fiskars</strong> held its Annual General Meeting<br />
for <strong>2009</strong> on March 16, <strong>2009</strong>. The Meeting<br />
approved the financial statements,<br />
discharged the members of the Board and<br />
the CEO from liability, and decided the<br />
dividend to be paid for 2008. The Meeting<br />
also decided the remuneration to be paid<br />
to the Board and elected the members<br />
to sit until the end of the Annual General<br />
Meeting in 2010. The Company’s Auditors<br />
were also decided, together with their<br />
remuneration. The Meeting authorized<br />
the Board to acquire <strong>Fiskars</strong> shares and<br />
decide on conveying them in accordance<br />
with separately agreed conditions.<br />
Extraordinary General<br />
Meeting <strong>2009</strong><br />
<strong>Fiskars</strong> <strong>Corporation</strong> held an Extraordinary<br />
General Meeting on June 5, <strong>2009</strong>, which<br />
approved a proposal by the Board of<br />
Directors concerning the combination of<br />
series A and series K shares, a directed<br />
free share issue to the holders of series K<br />
shares, and Amendments to the Articles<br />
of Association, as well as the merger plan<br />
between the Company and Agrofin Oy Ab.<br />
The meeting also decided to authorize the<br />
Board to acquire Company shares and<br />
decide on conveying them in accordance<br />
with separately agreed conditions.<br />
Board of Directors<br />
Under the Articles of Association, the<br />
Board of Directors shall consist of a<br />
minimum of five and a maximum of nine<br />
members. The terms of office of all members<br />
will run from their election to the end<br />
of the following Annual General Meeting.<br />
The Board is responsible for electing<br />
a Chairman from among its members.<br />
Responsibilities and Charter<br />
of the Board<br />
<strong>Fiskars</strong>' Board of Directors is responsible<br />
for managing the Company in accordance<br />
with the law, official regulations,<br />
the Articles of Association, and decisions<br />
taken by the Annual General Meeting of<br />
Shareholders.<br />
Under the Charter approved by the<br />
Board of Directors, the Board is responsible<br />
for the management and appropriate<br />
arrangement of the Company’s operations<br />
and for confirming the Company’s business<br />
strategy and budget. In addition, the<br />
Board oversees the solidity, profitability,<br />
and liquidity of the Company, as well as<br />
Company management. The Board is responsible<br />
for approving the risk management<br />
principles followed by the Company,<br />
drafting financial statements, confirming<br />
financial policy, and deciding on measures<br />
that are exceptional or far-reaching, taking<br />
the scope and nature of the Company’s<br />
operations into account, unless these<br />
matters come within the responsibilities<br />
of the General Meeting of Shareholders.<br />
The Board shall appoint the CEO and<br />
confirm the terms of his employment and<br />
other compensation. The Board is also<br />
responsible for appointing the members<br />
of the Corporate Management Team,<br />
other senior managers, and the internal<br />
audit manager, approving their terms of<br />
employment and other compensation, and<br />
deciding the principles for the Group’s<br />
compensation systems and other longterm<br />
personnel issues. The Board also<br />
considers matters related to the appointment<br />
of the members of the Boards of<br />
Directors of subsidiaries. The Board is also<br />
responsible for appointing Board Committees<br />
and their members. These Committees<br />
are responsible for preparing matters<br />
within their specific area of competence to<br />
be put before the Board. The Board shall<br />
evaluate its work and cooperation with<br />
management on a regular basis.<br />
Board of Directors in <strong>2009</strong><br />
The Annual General Meeting held on<br />
March 16, <strong>2009</strong> appointed nine members.<br />
Mr. Kaj-Gustaf Bergh was appointed<br />
Chairman of the Board and Mr. Alexander<br />
Ehrnrooth and Mr. Paul Ehrnrooth as<br />
Vice Chairmen. The other members of the<br />
Board are Mr. Ralf Böer, Ms. Ilona Ervasti-<br />
Vaintola, Mr. Gustaf Gripenberg, Mr. Karl<br />
Grotenfelt, Mr. Karsten Slotte, and<br />
Mr. Jukka Suominen. None of the members<br />
are employed by the Company.<br />
Details of the current Board of Directors<br />
are presented as part of this statement<br />
on Pages 40–41 of the Annual Report.<br />
The Board of Directors convened 16<br />
times during <strong>2009</strong>. The average attendance<br />
at Board meetings was 90%.<br />
No members of the Board have any<br />
affiliations with the Company. Mr. Kaj-<br />
Gustaf Bergh, Mr. Ralf Böer, Ms. Ilona<br />
Ervasti- Vaintola, Mr. Gustaf Gripenberg,<br />
Mr. Karl Grotenfelt, Mr. Karsten Slotte,<br />
and Mr. Jukka Suominen are also independent<br />
of shareholders.<br />
Board Committees<br />
The Board of Directors appointed three<br />
committees in <strong>2009</strong>: an Audit Committee,<br />
a Compensation Committee, and a Nomination<br />
Committee.
Governance<br />
37<br />
1. The Audit Committee is responsible<br />
for monitoring the <strong>report</strong>ing process<br />
used for the Company’s financial statements,<br />
supervising the financial <strong>report</strong>ing<br />
process, monitoring the efficacy of the<br />
Company’s internal controls, internal auditing,<br />
and risk management, reviewing the<br />
description of the main features of the internal<br />
controls and risk management associated<br />
with the financial <strong>report</strong>ing process<br />
provided by the Company’s administration<br />
and control system, monitoring the statutory<br />
auditing of the Company’s financial<br />
statements and consolidated financial<br />
statements, evaluating the independence<br />
of the Company’s statutory Auditors and<br />
the additional services provided by the<br />
latter, and drafting the proposal covering<br />
the selection of the Company’s Auditors<br />
to the Nomination Committee.<br />
The Chairman is Mr. Gustaf Gripenberg,<br />
and the members are Mr. Alexander<br />
Ehrnrooth, Mr. Paul Ehrnrooth, Ms. Ilona<br />
Ervasti-Vaintola, and Mr. Karsten Slotte.<br />
The Audit Committee convened 4 times<br />
in <strong>2009</strong> and the members attended all<br />
meetings.<br />
2. The Compensation Committee is<br />
responsible for preparing matters related<br />
to the appointment and remuneration of<br />
the President & CEO and Group directors<br />
as well as issues related to the Company’s<br />
remuneration system.<br />
The Chairman is Mr. Kaj-Gustaf Bergh,<br />
and the members are Mr. Ralf Böer,<br />
Mr. Karl Grotenfelt, and Mr. Jukka Suominen.<br />
The Compensation Committee convened<br />
4 times in <strong>2009</strong> and the members<br />
attended all meetings.<br />
3. The Nomination Committee is responsible<br />
for preparing proposals related to the<br />
composition of the Board for the General<br />
Meeting of Shareholders after consulting<br />
major shareholders, preparing proposals<br />
regarding the remuneration of Board members<br />
and the proposal on the selection<br />
of the Company’s Auditors based on the<br />
proposal of the Audit Committee, preparing<br />
proposals regarding the composition<br />
of the Board’s committees and confirming<br />
the criteria and processes to be used for<br />
evaluating the Board’s work.<br />
The Chairman is Mr. Kaj-Gustaf Bergh,<br />
and the members are Mr. Alexander<br />
Ehrnrooth and Mr. Paul Ehrnrooth. The<br />
Nomination Committee convened 3 times<br />
in <strong>2009</strong> and the members attended all<br />
meetings.<br />
Managing Director<br />
The Board of Directors is responsible for<br />
appointing and dismissing, if appropriate,<br />
the Managing Director, who also acts<br />
as the Group’s Chief Executive Officer.<br />
The CEO is responsible for running the<br />
Group’s operations and is in charge of<br />
its administration in accordance with<br />
the Company’s Articles of Association,<br />
legislation, official regulations, and the<br />
instructions and orders of the Board.<br />
The CEO is also responsible for ensuring<br />
that the Company’s accounting is in<br />
accordance with legal requirements<br />
and that assets are managed reliably.<br />
The CEO is assisted in these duties by<br />
the Corporate Management Team.<br />
The current President & CEO is<br />
Mr. Kari Kauniskangas. The Company<br />
does not have an Executive Vice President<br />
responsible for acting as the CEO’s<br />
deputy. Details of the CEO are presented<br />
as part of this statement on Page 42.<br />
Other executives<br />
Corporate Management Team<br />
The management team of <strong>Fiskars</strong> <strong>Corporation</strong><br />
consists of the managers responsible<br />
for corporate and Group-wide functions.<br />
Under the leadership of the CEO, the<br />
Corporate Management Team prepares<br />
proposals for the Board and discusses<br />
the Group’s strategy, and issues related<br />
to Group-wide and corporate functions<br />
and their development. The Corporate<br />
Management Team’s duties also include<br />
stakeholder relations.<br />
The details of the members of the Corporate<br />
Management Team are presented<br />
as part of this statement on Page 42.<br />
Business Area Management<br />
The Presidents of <strong>Fiskars</strong>’ business areas<br />
are responsible for the development of<br />
their business areas and for ensuring that<br />
their businesses comply with the requirements<br />
of local laws and regulations and<br />
<strong>Fiskars</strong>’ Code of Conduct principles. They<br />
are also responsible for ensuring that the<br />
subsidiaries associated with their businesses<br />
have the appropriate resources<br />
needed for their business.<br />
The Presidents of <strong>Fiskars</strong>’ business<br />
areas and the Corporate Management<br />
Team form together the Executive Team<br />
of the Company.<br />
Details on the Presidents and their areas<br />
of responsibility are presented as part of<br />
this statement on Page 43.<br />
Remuneration<br />
The Annual General Meeting determines<br />
the remuneration of the Board of<br />
Directors. In <strong>2009</strong>, the Annual General<br />
Meeting decided to keep remuneration<br />
unchanged, with the Chairman of the<br />
Board paid €65,000 per annum, the Vice<br />
Chairman €50,000 per annum, and members<br />
€35,000 per annum. In addition, the<br />
Annual General Meeting determined that<br />
Board members will be paid a fee of €550<br />
per Board and Committee meeting, the<br />
Chairman of the Board €1,100 per Board<br />
and Committee meeting, and the Chairman<br />
of the Audit Committee €1,100 per<br />
Audit Committee meeting. In addition,<br />
all members are reimbursed for their<br />
travel and other expenses incurred as<br />
a result of their activities on behalf of<br />
the Company.<br />
In addition to his basic salary, the<br />
CEO is paid an <strong>annual</strong> bonus designed<br />
to provide a target bonus equivalent<br />
to 60% of his <strong>annual</strong> salary. The bonus<br />
paid is determined in accordance with<br />
the financial targets set by the Board<br />
of Directors. The CEO is also included<br />
in a long-term incentive scheme, which<br />
corresponds to the <strong>annual</strong> bonus in size.<br />
The earning criteria for this are based on<br />
financial targets and change in the value<br />
of the Company’s share. The CEO and<br />
the Company shall have a notice period<br />
of six months. Remuneration on dismissal<br />
by the Company shall be 12 months’<br />
basic salary, together with salary for the<br />
six-month notice period. The Managing<br />
Director’s agreement shall end when the<br />
CEO reaches the age of 60. In addition to<br />
his statutory pension, he is provided with<br />
a voluntary supplementary contributionbased<br />
pension, similar to the one of the<br />
Corporate Management Team, under<br />
which the Company pays 20% of his<br />
<strong>annual</strong> salary.<br />
The salary, benefits, and bonuses of<br />
CEO Kari Kauniskangas in <strong>2009</strong> totaled<br />
€468,681.87.<br />
The members of the Corporate Management<br />
Team have an <strong>annual</strong> bonus scheme,<br />
which is designed to generate a bonus<br />
equivalent to 20–40% of their <strong>annual</strong><br />
salary. Earning criteria are primarily tied<br />
to financial targets and secondarily to personal<br />
targets. In addition, key members of<br />
personnel selected <strong>annual</strong>ly by the Board<br />
of Directors are included in a long-term<br />
incentive scheme, with earning criteria<br />
based on financial targets and change<br />
in the value of the Company’s share. The<br />
Board of Directors is responsible for deciding<br />
the earning criteria for both incentive<br />
schemes <strong>annual</strong>ly. The members of<br />
the Group’s Corporate Management Team<br />
also have voluntary, contribution-based<br />
additional pension insurance.<br />
In <strong>2009</strong>, the salaries, benefits, and<br />
bonuses paid to the members of the<br />
Corporate Management Team totaled<br />
€764,541.83.<br />
<strong>Fiskars</strong> <strong>Corporation</strong> has no share<br />
option programs in use.<br />
Internal Control,<br />
Risk Management,<br />
and Internal Audit<br />
The Board of Directors is responsible for<br />
the appropriate management and organization<br />
of operations. In practice, it is the<br />
responsibility of the CEO, together with<br />
management, to put in place and administer<br />
accounting and control mechanisms
38 FISKARS Annual Report <strong>2009</strong><br />
and other similar mechanisms.<br />
The Group’s financial performance is<br />
reviewed monthly through a <strong>report</strong>ing system<br />
that covers all units and operations.<br />
Business areas are run by and through<br />
their own management teams. With the<br />
support of the <strong>Corporation</strong>, business<br />
areas are responsible for the day-to-day<br />
risk management associated with business<br />
operations.<br />
Risk Management is responsible for<br />
identifying, evaluating, and managing<br />
risks that may threaten the achievement<br />
of <strong>Fiskars</strong>’ business goals. The targets<br />
and principles used in risk management,<br />
together with the major risks and uncertainties<br />
facing <strong>Fiskars</strong>, are presented<br />
in this statement on Page 39.<br />
Internal Audit is responsible for auditing<br />
and reviewing how well internal control<br />
systems function, the appropriateness<br />
and efficacy of functions, and how well<br />
guidelines are observed. Internal Audit<br />
also strives to promote the development of<br />
risk management practices in the Group’s<br />
business units. The Parent Company has<br />
an internal auditor manager, who is administratively<br />
subordinate to the President &<br />
CEO, but <strong>report</strong>s to the Audit Committee.<br />
Insider administration<br />
<strong>Fiskars</strong> applies the insider regulations of<br />
NASDAQ OMX Helsinki that came into<br />
force on October 9, <strong>2009</strong>. In addition, the<br />
Company has its own insider regulations<br />
that were last updated on November 3,<br />
<strong>2009</strong>. The Company’s Public Insiders<br />
include the members of the Board, the<br />
President & CEO, and the Company’s<br />
Auditors. Other Public Insiders include the<br />
members of the Corporate Management<br />
Team and business area presidents.<br />
<strong>Fiskars</strong> has also a company-specific<br />
insider register as well as a separate<br />
project-based register which is kept for<br />
projects that, on completion, may have<br />
an impact on the Company’s share value.<br />
<strong>Fiskars</strong> <strong>Corporation</strong>’s Legal Department<br />
maintains lists of insiders on the basis of<br />
information they provide. The holdings of<br />
Public Insiders can be consulted at Euroclear<br />
Finland Ltd. (Urho Kekkosen katu 5<br />
C, 00100 Helsinki, tel. +358 20 770 6000)<br />
and the Company’s website.<br />
Audit<br />
The Company’s Auditor is KPMG Oy Ab,<br />
Authorized Public Accountants, with<br />
Mr. Mauri Palvi, APA, as auditor with<br />
main responsibility.<br />
A total of €0.8 million was paid in fees<br />
to the auditors employed by Group companies<br />
in <strong>2009</strong>. The Auditor was also paid<br />
€0.2 million for non-audit services. The<br />
latter fees were related to the combination<br />
of the Company’s share series, tax matters,<br />
and other matters.<br />
Communications<br />
<strong>Fiskars</strong>’ aim is to provide all market<br />
parties with accurate, up-to-date, and<br />
sufficient information on the Company.<br />
Details on the Company’s administration<br />
and control system can be consulted at<br />
the Company’s website, where stock exchange<br />
releases are published immediately<br />
after they are announced, and other<br />
key investor material is also available.<br />
The main features<br />
of the internal<br />
control and<br />
risk management<br />
systems related<br />
to the financial<br />
<strong>report</strong>ing process<br />
The financial <strong>report</strong>ing process refers to<br />
activities that generate financial information<br />
used in managing the Company and<br />
the financial information published in<br />
accordance with the requirements of legislation,<br />
standards, and other regulations<br />
covering the Company’s operations.<br />
Internal control related to<br />
the financial <strong>report</strong>ing process<br />
The role of internal control is to ensure<br />
that the Company’s management has<br />
access to up-to-date, sufficient, and<br />
essentially accurate information needed<br />
for managing the Company and that the<br />
financial <strong>report</strong>s published by the Company<br />
provide an essentially accurate<br />
view of the Company’s financial position.<br />
Structure<br />
<strong>Fiskars</strong> has four operational segments<br />
and four business areas. The business<br />
units that operate under the Group’s four<br />
business areas comprise the base level<br />
of financial <strong>report</strong>ing. Business units<br />
are responsible for organizing their own<br />
financial management and for the accuracy<br />
of their financial <strong>report</strong>ing. Finance<br />
and financial risk management are centralized<br />
in the Group Treasury function<br />
under the Chief Financial Officer (CFO).<br />
All business areas have their own<br />
financial management. The Parent<br />
Company also has a Group-level<br />
financial management organization<br />
that operates under the leadership of<br />
the CFO. The financial management<br />
of business areas and the Group as<br />
a whole are responsible for monitoring<br />
the operations of the finance departments<br />
of individual business units.<br />
Internal Audit also audits and monitors<br />
the efficacy of the <strong>report</strong>ing process<br />
and the reliability of financial <strong>report</strong>ing.<br />
Management<br />
Setting and monitoring financial targets<br />
represent an integral part of <strong>Fiskars</strong>’<br />
management responsibilities. Short-term<br />
financial targets are set as part of the<br />
<strong>annual</strong> planning cycle, and progress in<br />
achieving these targets is monitored on<br />
a monthly basis. Business units <strong>report</strong><br />
actual financial data monthly and file<br />
a projection of how financial performance<br />
is expected to develop over the remainder<br />
of the <strong>report</strong>ing period.<br />
Information from business units is<br />
consolidated and validated by the<br />
Group’s financial organization and the<br />
data used to prepare a monthly <strong>report</strong><br />
for senior management. Monthly <strong>report</strong>s<br />
contain condensed income statements<br />
for <strong>Fiskars</strong>’ operational segments and<br />
business areas, key indicators, and an<br />
overview of the major events affecting<br />
their businesses. Reports also include a<br />
consolidated income statement, balance<br />
sheet data, cash flows, and a projection<br />
of the likely development of the financial<br />
situation covering the remainder of the<br />
<strong>report</strong>ing period. The Group’s Board<br />
of Directors, Corporate Management<br />
Team, and business area management<br />
teams monitor the development of<br />
the financial situation and progress<br />
on targets on a monthly basis.<br />
Financial IT systems<br />
Business units make use of a number<br />
of different accounting and financial<br />
<strong>report</strong>ing software systems. Group-level<br />
financial <strong>report</strong>ing is handled through<br />
one, centrally managed system. Business<br />
units and business areas are responsible<br />
for providing data for the Group’s<br />
<strong>report</strong>ing system. The Group’s financial<br />
management is responsible for maintaining<br />
the Group’s <strong>report</strong>ing system and<br />
for monitoring that agreed data is fed<br />
into the system.<br />
Guidelines<br />
Financial <strong>report</strong>ing is governed by a set<br />
of common principles. The Group applies<br />
the international IFRS accounting standards<br />
approved within the EU and has<br />
a common Group list of accounts. The<br />
Group’s financial management has drawn<br />
up guidelines for units covering the content<br />
of financial <strong>report</strong>ing and the dates<br />
within which <strong>report</strong>ing must take place.<br />
Risk management related to<br />
the financial <strong>report</strong>ing process<br />
The task of risk management is to identify<br />
potential threats affecting the financial<br />
<strong>report</strong>ing process that, if they were to<br />
become reality, could lead to a situation<br />
in which management lacked up-to-date,<br />
sufficient, and essentially accurate information<br />
needed to manage the company
Governance<br />
39<br />
and in which financial <strong>report</strong>s published<br />
by the company did not provide an<br />
essentially accurate picture of the<br />
Company’s financial position.<br />
<strong>Fiskars</strong> manages the risks associated<br />
with its financial <strong>report</strong>ing process by a<br />
number of means including the following:<br />
maintaining and resourcing an appropriate<br />
financial management organization,<br />
limiting the rights and responsibilities<br />
of individual members of staff appropriately,<br />
managing the user rights that give<br />
access to the Group’s <strong>report</strong>ing system<br />
centrally, issuing guidelines on accounting<br />
and <strong>report</strong>ing, maintaining a common<br />
Group list of accounts, making effective<br />
use of IT tools, providing ongoing<br />
training for personnel, and validating the<br />
accuracy of information that is <strong>report</strong>ed<br />
as part of the <strong>report</strong>ing process.<br />
Developing the financial<br />
<strong>report</strong>ing process<br />
<strong>Fiskars</strong> develops all aspects of its operations<br />
on an ongoing basis. A project<br />
to streamline the financial <strong>report</strong>ing<br />
process is now under way that will standardize<br />
and update various stages of the<br />
process and strengthen internal controls.<br />
Risk management<br />
<strong>Fiskars</strong>’ risk management function is<br />
responsible for identifying, evaluating,<br />
and managing risks that may threaten<br />
the achievement of the company’s business<br />
goals. The aim is to secure personnel,<br />
assets, and products intended for<br />
customers and protect the company’s<br />
reputation, brands, and shareholder<br />
value from developments or damage that<br />
may undermine the company’s profitability<br />
or adversely affect its assets.<br />
The principles observed in risk<br />
management are included in the risk<br />
management policy approved by the<br />
Board of Directors. The latter’s Audit<br />
Committee oversees the efficacy of risk<br />
management systems. Responsibility for<br />
identifying, evaluating, and also managing<br />
a large proportion of <strong>Fiskars</strong>’ risks is<br />
delegated to business units and support<br />
functions. Group Treasury is responsible<br />
for developing and maintaining the<br />
methods, tools, and <strong>report</strong>ing associated<br />
with risk management. In addition, it<br />
carries out risk assessments together<br />
with business units and support functions<br />
and assists in the preparation of<br />
action plans based on the results of<br />
these assessments.<br />
<strong>Fiskars</strong> has taken out extensive insurance<br />
for corporate companies to provide<br />
cover for the Group’s main assets, possible<br />
business interruption, transportation,<br />
and liabilities. Insurance matters,<br />
with the exception of local personal<br />
insurance, are managed centrally by<br />
Group Treasury.<br />
Group Treasury administers financial<br />
risks in accordance with principles<br />
approved by the Board of Directors.<br />
A description of how financial risks are<br />
managed is included as part of the Financial<br />
Statements in the Annual Report.<br />
Principal uncertainties<br />
Customer relationships<br />
and distribution<br />
<strong>Fiskars</strong> produces and sells consumer<br />
products; therefore general market conditions<br />
and a decline in consumer demand<br />
in key market areas in Europe and North<br />
America could have a material adverse<br />
effect on the <strong>Corporation</strong>’s net sales and<br />
profitability.<br />
<strong>Fiskars</strong>’ products are sold through its<br />
sales force, agents, and distributors to<br />
wholesalers, retailers, and directly to consumers<br />
through its stores. Sales to large<br />
individual customers are significant in<br />
some businesses. As some major customers<br />
decide their product range and suppliers<br />
only once <strong>annual</strong>ly, the loss of a small<br />
number of major customers or disruption<br />
in the activities of a specialized distribution<br />
channel could have an adverse effect<br />
on <strong>Fiskars</strong>’ business and profits. None of<br />
<strong>Fiskars</strong>’ customers accounted for more<br />
than 10% of sales in <strong>2009</strong>.<br />
Supply chain<br />
<strong>Fiskars</strong> is making increasing use of<br />
outsourcing and working with a growing<br />
number of contract manufacturers<br />
and partners. The proportion of in-house<br />
production has declined, and the dependency<br />
on the supply chain increased.<br />
Supply chain management has become<br />
a management and availability risk, as<br />
a considerable proportion of sales in<br />
respect of some products is of a seasonal<br />
nature and an increasing proportion of<br />
total corporate purchases will be made in<br />
countries distant from the company’s main<br />
operations. Risk management associated<br />
with outsourced production and ensuring<br />
product availability is being developed<br />
on a continuous basis.<br />
Price and supply of raw materials<br />
and commodities contracts<br />
<strong>Fiskars</strong> products are manufactured from<br />
a wide range of materials, primarily steel,<br />
aluminum, and plastic. Sudden fluctuations<br />
in raw material and energy prices<br />
can have an impact on the company’s<br />
operational result. <strong>Fiskars</strong> employs longterm<br />
contracts with its raw material suppliers<br />
to minimize this; and production<br />
plants in Finland that use large amounts<br />
of electricity employ collective purchasing<br />
to hedge their operations against fluctuations<br />
in electricity prices.<br />
Innovation<br />
The growth of <strong>Fiskars</strong>’ business depends<br />
to a significant extent on its ability to generate<br />
and commercialize a stream of new<br />
products and product enhancements that<br />
meet consumer expectations. The ability<br />
to combine design and innovation with<br />
technical R&D capabilities forms a solid<br />
basis for rolling out products successfully<br />
in a timely manner.<br />
Brands and corporate reputation<br />
<strong>Fiskars</strong> has a number of global and local<br />
brands in its portfolio. Any adverse event<br />
affecting consumer confidence or continuity<br />
of supply affecting these brands<br />
could have a detrimental impact on its<br />
business. <strong>Fiskars</strong> monitors the performance<br />
of its leading brands closely, and<br />
is committed to taking appropriate action<br />
to mitigate any threat to brand value.<br />
Weather and seasonal<br />
dependence<br />
Some product groups, particularly garden<br />
tools during the spring, can be affected<br />
by the weather. Unexpected weather<br />
conditions can have a negative impact<br />
on sales of these products. Sales of<br />
homeware products are heavily geared<br />
towards the last quarter of the year, and<br />
any negative issues related to product<br />
availability or demand during this quarter<br />
could affect the full-year result of this<br />
business significantly.<br />
Environment<br />
Most of <strong>Fiskars</strong>’ industrial operations<br />
involve no significant environmental risks.<br />
Production facilities have up-to-date<br />
environmental permits that set clear limits<br />
on their operations. Changes in environmental<br />
directives can affect existing<br />
environmental permits. Adapting to such<br />
directives may require changes in existing<br />
production methods or investments<br />
in new equipment. Changes in production<br />
capacity or structure at some older<br />
facilities may result in additional costs<br />
as environmental requirements change.<br />
Pensions and similar obligations<br />
Movements in equity markets, interest<br />
rates, and the life expectancy of participants<br />
in some pension plans could affect<br />
the pension liabilities <strong>report</strong>ed by the<br />
company. These liabilities are regarded<br />
as small, however, and the risk considered<br />
immaterial.<br />
Associated company<br />
<strong>Fiskars</strong> has a substantial investment<br />
in an associated company, Wärtsilä<br />
<strong>Corporation</strong>. Major changes in Wärtsilä’s<br />
share price, profitability, or ability to<br />
pay a dividend would have a material<br />
impact on <strong>Fiskars</strong>.
40 FISKARS Annual Report <strong>2009</strong><br />
Board of Directors<br />
Kaj-Gustaf Bergh (1955)<br />
Chairman, elected to the Board in 2005.<br />
B.Sc., LL.M. Managing Director of<br />
Föreningen Konstsamfundet r.f. 2006–.<br />
Skandinaviska Enskilda Banken,<br />
Member of management 2000–2001; SEB<br />
Asset Management, Director 1998–2000;<br />
Ane Gyllenberg Ab, Chief Executive<br />
Officer 1986–1998.<br />
Chairman of the Board of Finaref Group<br />
Ab and KSF Media Holding Ab. Member<br />
of the Board of Stockmann Oyj Abp,<br />
Ramirent Group, Julius Tallberg Oy Ab<br />
and Wärtsilä <strong>Corporation</strong>.<br />
Independent of the company and<br />
significant shareholders.<br />
Alexander Ehrnrooth (1974)<br />
Vice Chairman, elected to the Board<br />
in 2000. M.Sc. (Econ.), MBA. CEO of<br />
Virala Ltd. 1995–.<br />
Chairman of the Board of Turvatiimi<br />
<strong>Corporation</strong>.<br />
Independent of the company and<br />
dependent on significant shareholders.<br />
Paul Ehrnrooth (1965)<br />
Vice Chairman, elected to the Board<br />
in 2000. M.Sc. (Econ.). Managing<br />
Director & Chairman of the Board of<br />
Turret Oy Ab 2005–.<br />
Chairman of the Board of Savox Ltd.<br />
and Finance Link Ltd.<br />
Independent of the company and<br />
dependent on significant shareholders.<br />
Ralf R. Böer (1948)<br />
Elected to the Board in 2007. Juris Doctor.<br />
Chairman, CEO and Partner in Foley &<br />
Lardner LLP 2002–.<br />
Foley & Lardner LLP since 1974,<br />
Partner since 1981. Member of the Board<br />
of Directors of Plexus Corp.<br />
Independent of the company and<br />
significant shareholders.<br />
Ilona Ervasti-Vaintola (1951)<br />
Elected to the Board in 2004. LL.M. Group<br />
Chief Counsel of Sampo Group, Principal<br />
Attorney and Member of the Group<br />
Executive Committee 2001–.<br />
Mandatum Bank plc, Chief Counsel and<br />
Board Member 1998–2001; Mandatum &<br />
Co Ltd, Director, Partner 1992–1998.<br />
Member of the Board of Fortum <strong>Corporation</strong><br />
and the Finnish Literature Society.<br />
Chairman of the Legal Committee at the<br />
Central Chamber of Commerce of Finland.<br />
Independent of the company and<br />
significant shareholders.
Governance<br />
41<br />
In the picture from left to right:<br />
Kaj-Gustaf Bergh, Paul Ehrnrooth,<br />
Alexander Ehrnrooth, Gustaf Gripenberg,<br />
Jukka Suominen, Ilona Ervasti-Vaintola,<br />
Ralf R. Böer, Karl Grotenfelt, and<br />
Karsten Slotte.<br />
Gustaf Gripenberg (1952)<br />
Elected to the Board in 1986. D. (Eng.).<br />
Professor, Helsinki University of<br />
Technology.<br />
Extensive experience at the Helsinki<br />
University of Technology and University<br />
of Helsinki.<br />
Independent of the company and<br />
significant shareholders.<br />
Karl Grotenfelt (1944)<br />
Elected to the Board in 2005. LL.M.<br />
Chairman of the Board in Famigro Oy.<br />
A. Ahlström Oy, lawyer, General<br />
Counsel, Administrative Director of Paper<br />
Industry, member of the Executive Board<br />
with responsibility for the Paper Industry,<br />
1970–1986.<br />
Member of the Board of UPM-Kymmene<br />
<strong>Corporation</strong> and Ahlström Capital Limited.<br />
Independent of the company and<br />
significant shareholders.<br />
Karsten Slotte (1953)<br />
Elected to the Board in 2008. B.Sc.<br />
(Econ.). President and CEO of Fazer<br />
Group 2007–.<br />
Cloetta Fazer AB (publ.), President<br />
2002–2006; Cloetta Fazer Konfektyr AB,<br />
Managing Director 2000–2002; Fazer<br />
Confectionery, Managing Director<br />
1997–2000.<br />
Member of the Board of Onninen Oy,<br />
Varma Mutual Pension Insurance<br />
Company, and Finnish-Swedish Chamber<br />
of Commerce.<br />
Independent of the company and<br />
significant shareholders.<br />
Jukka Suominen (1947)<br />
Elected to the Board in 2008. M.Sc. (Eng.),<br />
B.Sc. (Econ.).<br />
Group CEO of Silja Oyj Abp 1995–2000.<br />
Member of the Board of Huhtamäki Oyj<br />
and Arctia Shipping Ltd, Chairman of<br />
the Board of Rederi AB Eckerö and<br />
Merivaara Oy.<br />
Independent of the company and<br />
significant shareholders.<br />
Details as of December 31, <strong>2009</strong>.<br />
Holdings of <strong>Fiskars</strong>’ shares on Page 79.
42 FISKARS Annual Report <strong>2009</strong><br />
Corporate<br />
Management Team<br />
In the picture from left to right: Hille Korhonen,<br />
Kari Kauniskangas, Teemu Kangas-Kärki,<br />
Jutta Karlsson, and Max Alfthan.<br />
Kari Kauniskangas (1962)<br />
President and CEO, employed 2008.<br />
M.Sc. (Econ.).<br />
Amer Sports <strong>Corporation</strong>, Head of<br />
Winter & Outdoor division 2007, SVP,<br />
Sales & Distribution 2004–2007; Amer<br />
Sports Europe GmbH, President & GM<br />
1999–2004.<br />
Member of the Board of Wärtsilä<br />
<strong>Corporation</strong>.<br />
Max Alfthan (1961)<br />
Chief Strategy Officer (CSO),<br />
employed 2008. M.Sc. (Econ.).<br />
Amer Sports <strong>Corporation</strong>, SVP<br />
Communications 2001–2008; Lowe &<br />
Partners, Managing Director 1998–2001;<br />
Oy Sinebrychoff Ab, Marketing Director<br />
1989–1998.<br />
Member of the Board of Suomen<br />
Lähikauppa Oy and Nokian Panimo Oy.<br />
Teemu Kangas-Kärki (1966)<br />
Chief Financial Officer (CFO),<br />
employed 2008. M.Sc. (Econ.).<br />
Alma Media <strong>Corporation</strong>, CFO 2003–<br />
2008; Kesko Group, Vice President,<br />
Corporate Controller 2002–2003,<br />
Corporate Business Controller 2000–2001;<br />
Suomen Nestlé Oy, Finance Director<br />
1999–2000.<br />
Jutta Karlsson (1963)<br />
General Counsel, employed 2006. LL.M.<br />
LMR Attorneys-at-law, Legal Counsel<br />
2004–2006; Council of the Baltic Sea<br />
States (Stockholm), Legal Advisor<br />
2002–2004.<br />
Hille Korhonen (1961)<br />
Vice President, Operations,<br />
employed 2007. Lic. Tech.<br />
Iittala Group, Group Director,<br />
Operations 2003–2007; Nokia<br />
<strong>Corporation</strong>, management duties<br />
for logistics 1996–2003.<br />
Member of the Board of Lassila &<br />
Tikanoja plc, Nokian Tyres Plc and<br />
Mint of Finland Ltd.<br />
Details as of December 31, <strong>2009</strong>.<br />
Holdings of <strong>Fiskars</strong>’ shares on Page 79.
Governance<br />
43<br />
Business Area<br />
Management<br />
In the picture from left to right:<br />
Thomas Enckell, Paul Tonnesen,<br />
Jaakko Autere, Lars Gullikson,<br />
Jason R. Landmark, Juha Lehtola,<br />
and Tomas Landers.<br />
Jaakko Autere (1963)<br />
President, Home,<br />
employed 2010. M.Sc. (Econ.).<br />
Thomas Enckell (1963)<br />
President, Garden, EMEA,<br />
employed 2007. M.Sc. (Econ.).<br />
Lars Gullikson (1963)<br />
President, Outdoor, EMEA,<br />
employed 2006. B.Sc. (Econ.).<br />
Tomas Landers (1977)<br />
Vice President, Real Estate,<br />
employed 2008. M.Sc. (Forestry).<br />
Jason R. Landmark (1967)<br />
President, Outdoor, Americas,<br />
employed 2001. B.Sc.<br />
Juha Lehtola (1966)<br />
President, Boats,<br />
employed <strong>2009</strong>. M.Sc. (Econ.).<br />
Paul Tonnesen (1964)<br />
President, Garden & SOC, Americas,<br />
employed 2007. MBA, B.Sc. (Marketing).<br />
Composition as of January 1, 2010.
FISKARS.<br />
INGENIOUSLY<br />
FUNCTIONAL.<br />
Driven by our natural curiosity and the power<br />
of continuous improvement, <strong>Fiskars</strong> solves<br />
problems and empowers its users through<br />
unique solutions that enhance their abilities.<br />
Our belief is that all things, even the simplest,<br />
can be made better and smarter.
44 –101<br />
Financial<br />
statementS <strong>2009</strong><br />
Report by the Board of Directors 46<br />
Consolidated Financial Statements, IFRS 50<br />
• Consolidated Income Statement 50<br />
• Consolidated Balance Sheet 51<br />
• Consolidated Statement of Cash Flows 52<br />
• Statement of Changes in Consolidated Equity 53<br />
• Notes to the Consolidated Financial Statements 54<br />
1. Accounting principles 54<br />
2. Segment information 58<br />
3. Non-recurring and restructuring costs 60<br />
4. Acquisitions and divestments 60<br />
5. Notes to the Income Statement 60<br />
6. Notes to the Balance Sheet, Assets 62<br />
7. Deferred tax assets and liabilities 66<br />
8. Notes to the Balance Sheet, Equity<br />
and Liabilities 68<br />
9. Finance 72<br />
10. Financial risk management 77<br />
11. Related party transactions 78<br />
12. Subsidiaries and other participations 80<br />
Financial indicators 82<br />
• Five years in figures 82<br />
• Share-related figures 83<br />
• Calculation of financial indicators 84<br />
Parent Company Financial Statements, FAS 85<br />
• Parent Company Income Statement 85<br />
• Parent Company Balance Sheet 86<br />
• Parent Company Statement of Cash Flows 88<br />
• Statement of Changes in Parent Company<br />
Shareholders' Equity 89<br />
• Parent Company accounting principles 90<br />
• Notes to the Financial Statements of Parent<br />
Company 91<br />
Board's proposal to the Annual General<br />
Meeting 98<br />
Auditors' <strong>report</strong> 99<br />
Shares and shareholders 100<br />
The Consolidated Financial Statements in this Annual<br />
Report have been prepared in accordance with International<br />
Financial Reporting Standards (IFRS) adopted by<br />
the European Union. All figures in the Annual Report<br />
are rounded, and consequently the sum of individual<br />
figures may differ from the presented total sum.
46 FISKARS Financial statements <strong>2009</strong><br />
REPORT BY THE BOARD<br />
OF DIRECTORS <strong>2009</strong><br />
<strong>2009</strong> in brief<br />
The challenging market situation and<br />
cautious purchasing by retailers and consumers<br />
lead to lower net sales of €662.9<br />
million in <strong>2009</strong> (2008: €697.0 million)<br />
Operating profit totaled €39.5 million<br />
(6.0), and €40.0 million (40.9) excluding<br />
non-recurring items. Improvements in the<br />
company’s cost structure resulted in better<br />
relative profitability in the Americas. Lower<br />
raw materials costs also contributed to<br />
improved performance.<br />
Cash flow from operations improved to<br />
€121.0 million (97.0), despite a drop in<br />
dividend revenue from <strong>Fiskars</strong>’ holding in<br />
Wärtsilä <strong>Corporation</strong> to €25.3 million (67.2).<br />
The company’s series A and K shares<br />
were combined in July <strong>2009</strong> in accordance<br />
with a decision taken by an Extraordinary<br />
General Meeting. Earnings per<br />
share for the year were €1.05 (0.64).<br />
The Group employed 3,623 people as of<br />
the end of the year (4,119).<br />
The Group’s financial<br />
performance<br />
<strong>Fiskars</strong>’ net sales decreased by 5% to<br />
€662.9 million (697.0) in <strong>2009</strong>. At comparable<br />
currency rates, the sales decreased<br />
by 4%. The operating profit increased<br />
to €39.5 million (6.0), and includes €0.5<br />
million of non-recurring costs (34.9).<br />
Operating profit excluding non-recurring<br />
items was €40.0 million (40.9) or 6% of net<br />
sales (6%).<br />
<strong>Fiskars</strong>’ <strong>report</strong>ing structure was<br />
changed as of January 1, <strong>2009</strong>. Its share<br />
of the profit of associated company<br />
Wärtsilä and the change in the fair value of<br />
its biological assets (i.e. standing timber)<br />
are presented as separate lines below<br />
EBIT in the income statement. The share<br />
of profit from associate was €66.5 million<br />
(70.5), and the change in the fair value of<br />
standing timber was €-0.4 million (-5.6).<br />
Net financial costs were €-14.2 million<br />
(-19.4). Profit before taxes was €91.4 million<br />
(51.5). The income taxes for the year<br />
totaled €-7.9 million (-2.3).<br />
The profit for the period increased to<br />
€83.5 million (49.2), and earnings per<br />
share were €1.05 (0.64).<br />
Organizational structure<br />
<strong>Fiskars</strong>’ operating segments are EMEA<br />
(Europe, Middle East, and Asia-Pacific),<br />
Americas, Wärtsilä (associated company),<br />
and Other. The Inha Works business,<br />
which mainly consists of boat production,<br />
Key operating segments<br />
M€<br />
<strong>2009</strong> 2008 Change,<br />
%<br />
EMEA,<br />
net sales 454.2 491.3 -8<br />
EMEA,<br />
operating profit 26.7 21.7 * )<br />
Americas,<br />
net sales 218.2 216.5 1<br />
Americas,<br />
operating profit 23.9 -4.0 ** )<br />
* ) Incl. non-recurring costs of €9.3 million.<br />
** ) Incl. non-recurring costs of €19.5 million.<br />
has been moved from Other to EMEA as of<br />
January 1, <strong>2009</strong>.<br />
The business areas as of the beginning<br />
of <strong>2009</strong> are Home, Garden, Outdoor, and<br />
Other. The Home business area includes<br />
Homeware as well as School, Office, and<br />
Craft (SOC). Boats are included in the<br />
Outdoor business area. Other covers<br />
Real Estate and corporate headquarter<br />
functions.<br />
EMEA<br />
Net sales in the EMEA segment fell 8% to<br />
€454.2 million (491.3). Using comparable<br />
exchange rates, the decline was 5%.<br />
Operating profit totaled €26.7 million (21.7,<br />
including -9.3 in non-recurring items).<br />
Personnel as of the end of the year totaled<br />
2,899 (3,276).<br />
The market situation remained challenging<br />
throughout the year. Consumer<br />
Key business areas<br />
M€<br />
<strong>2009</strong> 2008 Change,<br />
%<br />
Home,<br />
net sales 299.9 316.8 -5<br />
Garden,<br />
net sales 230.9 231.2 0<br />
Outdoor,<br />
net sales 128.4 145.2 -12<br />
Net sales, M€<br />
Operating profit, M€<br />
Capital expenditure and<br />
depreciation, M€<br />
647<br />
697<br />
663<br />
53.6<br />
221<br />
510<br />
530<br />
39.5<br />
22.2<br />
05 06 07 08 09<br />
-5.5<br />
05<br />
06<br />
07<br />
6.0<br />
08<br />
09<br />
61 59<br />
41<br />
29 30 33<br />
23<br />
28<br />
15<br />
05 06 07 08 09<br />
Capital expenditure<br />
Depreciation
REPORT BY THE BOARD OF DIRECTORS<br />
47<br />
demand and retailer purchasing failed<br />
to return to pre-recessions levels. The<br />
weaker performance of currencies such as<br />
the British pound and the Swedish krona<br />
compared to the euro also contributed to<br />
lower net sales.<br />
Net sales in the Home business area fell<br />
slightly. Sales in the business’ largest markets<br />
in Finland and Sweden as well as in<br />
Norway continued to develop well, particularly<br />
with respect to the Arabia and Iittala<br />
brands. Weaker exchange rates and sales<br />
in other markets, however, had a negative<br />
impact on net sales. More efficient<br />
production and procurement improved<br />
the operating profit in the EMEA segment.<br />
Sales of craft products were lower, but this<br />
was compensated for by lower costs.<br />
In the Garden business area, sales of<br />
<strong>Fiskars</strong>-brand garden tools grew significantly,<br />
particularly in Germany. Low levels<br />
of sales in construction tools and forged<br />
products, together with weaker exchange<br />
rates, kept net sales lower than in 2008.<br />
The improved profitability of the product<br />
range, resulting from factors such as lower<br />
raw material costs and more efficient production,<br />
together with other cost savings,<br />
contributed positively to the segment’s<br />
operating profit, although marketing<br />
expenditure increased.<br />
Net sales in the Outdoor business area<br />
fell in a challenging market situation. Net<br />
sales of outdoor gear in France and Sweden<br />
in particular were lower, as a result of<br />
the weaker Swedish krona and lower sales<br />
of corporate gifts and everyday exercise<br />
products. <strong>2009</strong> was a difficult year on the<br />
boat market, and the Group’s boat-related<br />
net sales were significantly down. Lower<br />
sales volumes, together with development<br />
costs related to new boat models, had a<br />
negative effect on the operating profit of<br />
the EMEA segment.<br />
Americas<br />
Net sales in the Americas segment rose<br />
by 1% to €218.2 million (216.5). In USD<br />
terms, net sales fell by 4%, however, to<br />
USD 302.5 million (319.1). Operating profit<br />
totaled €23.9 million (-4.0, including -19.5<br />
in non-recurring items). Personnel as of<br />
the end of year totaled 667 (792).<br />
The recession in the US economy<br />
impacted purchases made by retailers,<br />
but also reduced the prices of raw materials,<br />
particularly plastics, during <strong>2009</strong>.<br />
Operating profit in the Americas improved<br />
strongly, driven by lower fixed costs, in<br />
particular.<br />
Net sales in the Garden business area<br />
remained at 2008 levels. Although some<br />
retailers continued to reduce their inventories<br />
during the year, these lost sales were<br />
replaced by sales of new garden products<br />
launched during <strong>2009</strong>.<br />
Net sales of school, office, and craft<br />
(SOC) products in the Home business<br />
fell significantly, partly as a result of the<br />
divestment of consumables product lines<br />
and brands in craft business in July <strong>2009</strong>.<br />
Lower sales were compensated for by<br />
lower fixed costs.<br />
Net sales in the Outdoor business area<br />
rose in <strong>2009</strong>, driven in particular by institutional<br />
sales, which developed well. Higher<br />
sales volumes contributed positively to the<br />
operating profit of the Americas segment.<br />
The Brunton brand and its business were<br />
sold in December <strong>2009</strong>, which will impact<br />
net sales in 2010.<br />
Other<br />
<strong>Fiskars</strong>’ Other segment comprises Real<br />
Estate, which is responsible for managing<br />
the Group’s forests and other land and for<br />
the internal and external leasing of <strong>Fiskars</strong>’<br />
property in Finland, and the corporate<br />
headquarter functions.<br />
The segment recorded net sales of<br />
€6.1 million (5.9), of which the majority<br />
comprised revenue from timber sales<br />
and rental income from properties. The<br />
segment’s operating profit, including €-0.5<br />
million non-recurring items, was €-11.1 million<br />
(-11.7, including -6.1 in non-recurring<br />
items). The change in the value of standing<br />
timber, <strong>report</strong>ed below EBIT, was €-0.4<br />
million (-5.6). Personnel as of the end of<br />
year totaled 57 (51).<br />
Wärtsilä<br />
Wärtsilä <strong>Corporation</strong>, a leading provider of<br />
marine and power solutions, is included in<br />
<strong>Fiskars</strong>’ consolidated financial statements<br />
as an associated company. <strong>Fiskars</strong> owns<br />
in total 17.1% of the shares and votes of<br />
Wärtsilä.<br />
<strong>Fiskars</strong>’ share of Wärtsilä’s profit totaled<br />
€66.5 million (70.5) in <strong>2009</strong>.<br />
The Annual General Meeting of<br />
Wärtsilä was held on March 11, <strong>2009</strong>.<br />
The Chairman of the Board of <strong>Fiskars</strong>, Mr.<br />
Kaj-Gustaf Bergh, and the President and<br />
Net gearing, %<br />
Equity ratio, %<br />
Earnings per share and<br />
dividend per share, €<br />
35<br />
24<br />
67<br />
69<br />
47<br />
57<br />
60<br />
46 46<br />
52<br />
0.60<br />
1.06<br />
0.75<br />
0.80<br />
0.50<br />
0.64<br />
0.80<br />
1.40<br />
0.52<br />
1.05<br />
05 06 07 08 09<br />
05 06 07 08 09<br />
05 06 07 08 09<br />
Earnings<br />
Dividend
48 FISKARS Financial statements <strong>2009</strong><br />
CEO of <strong>Fiskars</strong>, Mr. Kari Kauniskangas,<br />
were re-elected to Wärtsilä’s Board of<br />
Directors. The Meeting decided to pay a<br />
dividend of €1.50 per share (4.25). <strong>Fiskars</strong><br />
received a total of €25.3 million (67.2) in<br />
dividends.<br />
The market value of <strong>Fiskars</strong>’ Wärtsilä<br />
shares was €472.9 million (353.9) or €5.76<br />
(4.57) per <strong>Fiskars</strong>’ share at the end of the<br />
year, with a closing price €28.07 (21.01)<br />
per Wärtsilä share. The book value of the<br />
shares was €316.8 million (263.5).<br />
Financing<br />
<strong>Fiskars</strong>’ cash flow from operations totaled<br />
€121.0 million (97.0) in <strong>2009</strong>, an improvement<br />
that was largely driven by significantly<br />
lower inventory levels. The cash flow includes<br />
dividends paid by associated company<br />
Wärtsilä totaling €25.3 million (67.2).<br />
Cash flow from investing activities was<br />
€-8.7 million (-25.8) and cash flow after<br />
investing activities was €112.2 million<br />
(71.2) in the year.<br />
Net working capital was €102.6 million<br />
(€149.4) at the end of the year. The equity<br />
ratio was 52% (46%) and net gearing 47%<br />
(69%).<br />
Cash and deposits at the end of the<br />
period were €38.6 million (11.3). <strong>Fiskars</strong><br />
hedges exchange rate risks associated<br />
with future cash flow using currency<br />
derivatives. The value of these derivatives<br />
increased financing expenses in <strong>2009</strong> by<br />
€4.5 million (2008: decreased expenses<br />
by 3.7 million), as the company does not<br />
apply hedge accounting as defined under<br />
IAS 39 to its derivatives.<br />
Net interest-bearing debt amounted<br />
to €235.7 million (309.9). Short-term<br />
borrowings totaled €199.7 million (183.7)<br />
and long-term borrowings €74.9 million<br />
(137.5). Short-term borrowings are mainly<br />
commercial papers issued by <strong>Fiskars</strong><br />
<strong>Corporation</strong>. In addition, <strong>Fiskars</strong> had<br />
€425.0 million (405.0) in unused, binding<br />
long-term credit facilities, mainly with<br />
major Nordic banks.<br />
Investments and product<br />
development<br />
Investments during the <strong>2009</strong> financial year<br />
totaled €14.6 million (29.8). The EMEA<br />
segment accounted for 10.7 million (23.7)<br />
of the total, the Americas €2.8 million (3.0),<br />
and Other 1.1 million (3.1).<br />
Investments were largely related to<br />
production and product development.<br />
The Home business area also invested in<br />
revamping retail stores and in its customer<br />
loyalty system. Investments at Real Estate<br />
were largely concentrated in building<br />
repair and renovation projects.<br />
The Group’s product development expenditure<br />
totaled €8.9 million (8.4 million),<br />
equivalent to 1% (1%) of net sales. Major<br />
R&D projects in <strong>2009</strong> covered, for example,<br />
a rainwater collector product range, a<br />
new ax concept, and new boat models.<br />
Personnel<br />
The Group employed an average of 3,867<br />
people (4,325) in <strong>2009</strong>. The number of<br />
personnel was 3,623 (4,119) as of the end<br />
of the year, of which 2,899 (3,276) were<br />
employed in the EMEA region, 667 (792)<br />
in the Americas, and 57 (51) by segment<br />
Other. <strong>Fiskars</strong> employed 1,512 (1,722)<br />
people in Finland.<br />
The reduction of personnel in EMEA<br />
was largely the result of reorganizations of<br />
production plant operations. The merger of<br />
the Garden and SOC units, together with<br />
the sale of the Brunton business, reduced<br />
personnel levels in the Americas.<br />
The wages and salaries for the year<br />
totaled €113.4 million (126.4).<br />
Changes in management<br />
Juha Lehtola, M.Sc. (Econ), was appointed<br />
President of the Boats business<br />
and Managing Director of Inha Works<br />
Ltd. in March <strong>2009</strong>. Jaakko Autere, M.Sc.<br />
(Econ), was appointed President of<br />
<strong>Fiskars</strong>’ Home business area and CEO of<br />
Iittala Group Oy Ab in August <strong>2009</strong> and<br />
took over his duties in January 2010. Both<br />
Lehtola and Autere <strong>report</strong> to <strong>Fiskars</strong>’ President<br />
& CEO, Kari Kauniskangas.<br />
Corporate Governance<br />
<strong>Fiskars</strong> complies with the Finnish Corporate<br />
Governance Code issued by the<br />
Securities Market Association, which came<br />
into force on January 1, <strong>2009</strong>. <strong>Fiskars</strong>’<br />
Corporate Governance Statement for <strong>2009</strong><br />
in accordance with Recommendation 51<br />
of the Code was issued on February 11,<br />
2010 as a separate <strong>report</strong>.<br />
<strong>Fiskars</strong> also complies with the insider<br />
regulations of NASDAQ OMX Helsinki<br />
latest updated on October 9, <strong>2009</strong>, and<br />
the company’s internal insider guidelines<br />
latest updated on November 3, <strong>2009</strong>.<br />
Risks and business<br />
uncertainties<br />
<strong>Fiskars</strong>’ business, net sales and financial<br />
performance may be affected by several<br />
uncertainties. The principal uncertainties<br />
are related to:<br />
• General market conditions and a<br />
potential decline in consumer demand<br />
in <strong>Fiskars</strong>’ significant market areas in<br />
Europe and North America<br />
• Loss of or reduced sales of major retail<br />
customers, retailers’ financial difficulties,<br />
and disruptions in the activities of a<br />
distribution channel<br />
• Availability of products due to supply<br />
chain issues<br />
• Unexpected weather conditions in the<br />
Garden business area and seasonal<br />
variations, especially in the Home<br />
business area which is heavily geared<br />
towards the end of the year<br />
• Sudden fluctuations in raw material and<br />
energy prices; the most important raw<br />
materials being steel, aluminum, and<br />
plastic<br />
• Major changes in profitability or ability<br />
to pay dividends of the associated<br />
company Wärtsilä.<br />
Environment<br />
In line with its Code of Conduct, <strong>Fiskars</strong><br />
aims to ensure that its products, services,<br />
and production promote sustainable development.<br />
The company does not monitor<br />
environmental costs separately, as they<br />
are an integral part of its normal business<br />
operations and business development.<br />
No major environmental investments were<br />
made in <strong>2009</strong>.<br />
Most of <strong>Fiskars</strong>’ industrial operations<br />
involve no significant environmental risks.<br />
Production facilities have up-to-date<br />
environmental permits that set clear limits<br />
on their operations. Changes in environmental<br />
directives can affect existing<br />
environmental permits. Adapting to such<br />
directives may require changes in existing<br />
production methods or investments in new<br />
equipment.<br />
Production in the Home business area<br />
uses more energy than other <strong>Fiskars</strong>’<br />
production units. All of the business area’s<br />
production plants in Finland have environmental<br />
and quality systems audited in<br />
accordance with ISO standards.<br />
Share<br />
<strong>Fiskars</strong> <strong>Corporation</strong> has one series of<br />
shares, following the combination of the<br />
company’s series A and K shares in July<br />
<strong>2009</strong>. The new single class shares (FIS1V)<br />
became subject to public trading as of<br />
July 31, <strong>2009</strong>. All shares carry one vote<br />
each and equal rights.<br />
With reference to the decisions of the<br />
Extraordinary General Meeting on June 5,<br />
<strong>2009</strong>, the combination of the share series,<br />
the directed free share issue to the holders<br />
of series K shares, and the amendments to<br />
the articles of association were registered<br />
with the Finnish Trade Register on July 30,<br />
<strong>2009</strong>. In the directed free share issue, the<br />
holders of series K shares received one<br />
share free of charge for each five series K<br />
shares.<br />
The execution of the merger of Agrofin<br />
Oy Ab into <strong>Fiskars</strong> and the share issue for<br />
the payment of the merger consideration<br />
were registered with the Finnish Trade
REPORT BY THE BOARD OF DIRECTORS<br />
49<br />
Register on July 31. The new shares issued<br />
as merger consideration became<br />
subject to public trading as of August<br />
3, <strong>2009</strong>. The cancellation of 11,863,964<br />
shares that were transferred to <strong>Fiskars</strong> as<br />
a result of the execution of merger was<br />
registered on August 3, <strong>2009</strong>.<br />
The total number of shares at the end<br />
of the period was 82,023,341, including<br />
112,619 treasury shares. The share capital<br />
remained unchanged at €77,510,200.<br />
<strong>Fiskars</strong>’ shares are traded in the Large<br />
Cap segment of NASDAQ OMX Helsinki<br />
Ltd. At the end of the year, the closing<br />
price was €10.62 per share (A-share<br />
6.96; K-share 11.15). The market value<br />
of <strong>Fiskars</strong>, excluding treasury shares,<br />
was €869.9 million (633.2). The number<br />
of shares traded during the year was 4.4<br />
million (5.1).<br />
Treasury shares<br />
The Board of Directors had authorizations<br />
to acquire and dispose treasury shares<br />
during the year. At the end of the period,<br />
the authorizations concerned a maximum<br />
of 4,020,000 shares. The Board may decide<br />
on the disposal of the shares otherwise<br />
than in proportion to the shareholders’<br />
pre-emptive subscription rights. The<br />
authorizations will remain in force until the<br />
end of the next Annual General Meeting.<br />
The authorizations were not used during<br />
the year.<br />
As of the end of the year, <strong>Fiskars</strong> owned<br />
112,619 treasury shares, corresponding<br />
to 0.14% of the <strong>Corporation</strong>’s shares and<br />
votes.<br />
Shareholders<br />
<strong>Fiskars</strong> <strong>Corporation</strong> had 11,915 (9,899)<br />
shareholders as of the end of the year.<br />
During the year <strong>Fiskars</strong> was informed on<br />
the following changes among the largest<br />
shareholders of the Company:<br />
• The voting rights of Robert G. Ehrnrooth<br />
fell below the 1/10 threshold on June15,<br />
<strong>2009</strong> when his controlling interest ended<br />
at Turret Oy Ab.<br />
• The voting rights of Virala Oy Ab fell<br />
below the 3/20 threshold, holdings of<br />
Elsa Fromond together with the company<br />
Holdix Oy Ab in which she has a<br />
controlling interest exceeded the 1/10<br />
threshold, and the voting rights of Oy<br />
Julius Tallberg Ab fell below the 1/20<br />
threshold, following the combination of<br />
share series on July 30, <strong>2009</strong> and the<br />
merger of Agrofin and <strong>Fiskars</strong> on July<br />
31, <strong>2009</strong>.<br />
• Elsa Fromond together with the company<br />
Holdix Oy Ab in which she has a<br />
controlling interest fell below the 1/10<br />
threshold on October 5, <strong>2009</strong>.<br />
Annual General Meeting <strong>2009</strong><br />
<strong>Fiskars</strong> <strong>Corporation</strong>’s Annual General<br />
Meeting on March 16, <strong>2009</strong> approved<br />
the financial statements for 2008 and<br />
discharged the members of the Board and<br />
the CEO from liability for the 2008 financial<br />
year. It was decided to pay a dividend<br />
of €0.50 per share for series A shares<br />
and €0.48 per share for series K shares,<br />
totaling €38,247,526.74. The dividend was<br />
paid on March 26, <strong>2009</strong>.<br />
The number of Board members was<br />
decided to be nine. Mr. Kaj-Gustaf Bergh,<br />
Mr. Ralf Böer, Mr. Alexander Ehrnrooth,<br />
Mr. Paul Ehrnrooth, Ms. Ilona Ervasti-<br />
Vaintola, Mr. Gustaf Gripenberg, Mr. Karl<br />
Grotenfelt, Mr. Karsten Slotte, and Mr.<br />
Jukka suominen were re-elected as Board<br />
members. The term of Board members will<br />
expire at the end of the Annual General<br />
Meeting in 2010.<br />
KPMG Oy Ab was elected auditor<br />
and they nominated Authorized Public<br />
Accountant Mr. Mauri Palvi as responsible<br />
auditor.<br />
The Meeting authorized the Board to<br />
acquire and dispose <strong>Fiskars</strong> shares, a maximum<br />
of 2,700,000 of Series A shares and a<br />
maximum of 1,100,000 of Series K shares.<br />
Constitutive meeting of<br />
the Board of Directors<br />
Convening after the Annual General<br />
Meeting on March 16, <strong>2009</strong>, the Board<br />
elected Kaj-Gustaf Bergh to be its<br />
Chairman and Alexander Ehrnrooth and<br />
Paul Ehrnrooth its Vice Chairmen.<br />
The Board appointed Gustaf Gripenberg<br />
to be chairman of the Audit Committee,<br />
and its other members to be<br />
Alexander Ehrnrooth, Paul Ehrnrooth, Ilona<br />
Ervasti-Vaintola and Karsten Slotte. The<br />
Board appointed Kaj-Gustaf Bergh to be<br />
chairman of the Compensation Committee,<br />
and its other members to be Ralf Böer,<br />
Karl Grotenfelt, and Jukka Suominen. The<br />
Board appointed Kaj-Gustaf Bergh to be<br />
chairman of the Nomination Committee,<br />
and its other members to be Alexander<br />
Ehrnrooth and Paul Ehrnrooth.<br />
Extraordinary<br />
General Meeting <strong>2009</strong><br />
<strong>Fiskars</strong> <strong>Corporation</strong>’s Extraordinary<br />
General Meeting on June 5, <strong>2009</strong> approved<br />
a proposal by the Board of Directors<br />
to combine the Company’s A and K series<br />
of shares, make a complimentary issue<br />
of shares to holders of K series shares,<br />
amend the Company’s Articles of Association,<br />
and approve a plan to merge the<br />
Company and Agrofin Oy Ab.<br />
The Meeting also decided to authorize<br />
the Board to acquire and dispose <strong>Fiskars</strong><br />
shares in accordance, a maximum of<br />
4,020,000 shares, with separately agreed<br />
conditions.<br />
Annual General Meeting 2010<br />
<strong>Fiskars</strong> <strong>Corporation</strong>’s Annual General<br />
Meeting will be held on Tuesday, March<br />
16, 2010 starting at 3 p.m. in the Helsinki<br />
Fair Centre. The invitation to the meeting<br />
will be published separately.<br />
Board’s proposal to the<br />
Annual General Meeting<br />
The distributable equity of the Parent<br />
Company at the end of the <strong>2009</strong> fiscal<br />
year was €429.9 million (460.5).<br />
The Board of Directors proposes to the<br />
Annual General Meeting of Shareholders<br />
that a dividend of €0.52 per share would<br />
be paid for <strong>2009</strong>.<br />
The number of shares entitling to a dividend<br />
totaled 81,910,722. The proposed<br />
distribution of dividend would thus be<br />
€42,593,575.44. This would leave €387.3<br />
million of unused profit funds at the Parent<br />
Company.<br />
No material changes have taken place<br />
in the financial position of the Company<br />
after the end of the fiscal year. The financial<br />
standing of the Company is good and<br />
according to the Board of Directors’ assessment<br />
the proposed distribution of dividend<br />
will not compromise the Company’s<br />
solvency.<br />
Outlook for 2010<br />
The market situation is expected to remain<br />
uncertain, which will continue to make<br />
predicting developments difficult in 2010.<br />
High unemployment in North America and<br />
Europe in particular could result in weaker<br />
consumer demand. Retailer purchasing<br />
is also expected to remain cautious. All<br />
these factors could have an impact on the<br />
development of <strong>Fiskars</strong>’ net sales.<br />
<strong>Fiskars</strong> will continue implementing<br />
measures designed to improve its<br />
profitability and competitiveness in 2010.<br />
Investments in brands and product development<br />
will be increased, as the Group’s<br />
capabilities in these areas are central to its<br />
success in a challenging market situation.<br />
<strong>Fiskars</strong>’ net sales in 2010 are expected<br />
to remain at <strong>2009</strong> levels. Full-year operating<br />
profit excluding non-recurring items is<br />
expected to increase compared to <strong>2009</strong>.<br />
Associated company Wärtsilä will continue<br />
to have a major impact on <strong>Fiskars</strong>’<br />
profit and cash flow in 2010.<br />
Helsinki, Finland, February 10, 2010<br />
<strong>Fiskars</strong> <strong>Corporation</strong><br />
Board of Directors
50 FISKARS Financial statements <strong>2009</strong><br />
Consolidated financial<br />
statements, ifrs<br />
Consolidated Income Statement<br />
M€ Note <strong>2009</strong> 2008<br />
Net sales 662.9 697.0<br />
Cost of goods sold -436.3 -483.5<br />
Gross profit 226.6 34.2% 213.5 30.6%<br />
Other operating income 5.1 1.8 2.9<br />
Sales and marketing expenses -119.4 -129.8<br />
Administration expenses -58.8 -54.4<br />
Research and development costs -8.9 -8.4<br />
Other operating expenses 5.3 -1.9 -17.8<br />
Operating profit 39.5 6.0% 6.0 0.9%<br />
Change in fair value of biological assets 6.4 -0.4 -5.6<br />
Share of profit from associate 6.6 66.5 70.5<br />
Financial income and expenses 5.9 -14.2 -19.4<br />
Profit before taxes 91.4 13.8% 51.5 7.4%<br />
Income taxes 5.10 -7.9 -2.3<br />
Profit for the period 83.5 12.6% 49.2 7.1%<br />
Attributable to:<br />
Equity holders of the Parent Company 83.5 49.3<br />
Non-controlling interest 0.0 -0.1<br />
83.5 49.2<br />
Earnings for equity holders of the Parent Company<br />
per share, euro (basic and diluted) 5.11 1.05 0.64<br />
Statement of comprehensive income<br />
M€ Note <strong>2009</strong> 2008<br />
Profit for the period 83.5 49.2<br />
Other comprehensive income<br />
Translation differences -1.9 -1.9<br />
Share of other comprehensive income in associate 6.6 12.7 -18.1<br />
Equity net investment hedges after tax 1.3 0.7<br />
Defined benefit plan actuarial gains (losses), net of tax 0.7 -0.2<br />
Other changes 0.0 0.2<br />
Other comprehensive income for the period, net of tax 12.8 -19.3<br />
Total comprehensive income for the period 96.3 29.9<br />
Attributable to:<br />
Equity holders of the Parent Company 96.3 30.0<br />
Non-controlling interest 0.0 -0.1<br />
96.3 29.9<br />
The notes are an integral part of these consolidated financial statements.
Consolidated Financial Statements, IFRS<br />
51<br />
Consolidated Balance Sheet<br />
M€ Note Dec 31, <strong>2009</strong> Dec 31, 2008<br />
ASSETS<br />
Non-current assets<br />
Goodwill 6.1 99.4 99.2<br />
Other intangible assets 6.2 124.9 131.0<br />
Property, plant & equipment 6.3 99.5 113.2<br />
Biological assets 6.4 38.9 39.3<br />
Investment property 6.5 8.5 7.7<br />
Investments in associates 6.6 316.8 263.5<br />
Financial assets 6.7, 6.8 5.1 5.1<br />
Deferred tax assets 7 17.8 21.7<br />
Non-current assets total 710.9 73% 680.6 70%<br />
Current assets<br />
Inventories 6.9 119.0 159.8<br />
Trade and other receivables 6.10 101.9 109.6<br />
Income tax receivables 2.9 8.4<br />
Cash and cash equivalents 6.11 38.6 11.3<br />
Current assets total 262.4 27% 289.0 30%<br />
Assets total 973.3 100% 969.7 100%<br />
EQUITY AND LIABILITIES<br />
Equity<br />
Equity attributable to the equity holders of the Parent Company 504.8 446.7<br />
Non-controlling interest 0.0<br />
Equity total 504.8 52% 446.7 46%<br />
Non-current liabilities<br />
Interest bearing debt 9.2 74.9 137.5<br />
Other liabilities 0.9 1.4<br />
Deferred tax liabilities 7 47.2 49.3<br />
Pension liability 8.4 9.4 9.2<br />
Provisions 8.2 9.1 13.4<br />
Non-current liabilities total 141.5 15% 210.8 22%<br />
Current liabilities<br />
Interest bearing debt 9.3 199.7 183.7<br />
Trade and other payables 8.3 121.3 121.9<br />
Income tax payable 6.1 6.6<br />
Current liabilities total 327.1 34% 312.2 32%<br />
Equity and liabilities total 973.3 100% 969.7 100%<br />
The notes are an integral part of these consolidated financial statements.
52 FISKARS Financial statements <strong>2009</strong><br />
Consolidated Statement of Cash Flows<br />
M€ <strong>2009</strong> 2008<br />
Cash flow from operating activities<br />
Profit before taxes 91.4 51.5<br />
Adjustments for<br />
Depreciation, amortization and impairment 28.1 32.9<br />
Share of profit from associate -66.5 -70.5<br />
Investment income 0.3 -1.0<br />
Interest expenses 14.2 20.4<br />
Change in fair value of biological assets 0.4 5.6<br />
Change in provisions and other non-cash items -12.4 0.0<br />
Cash flow before changes in working capital 55.6 39.0<br />
Changes in working capital<br />
Change in current assets, non-interest bearing -0.7 10.9<br />
Change in inventories 50.3 10.6<br />
Change in current liabilities, non-interest bearing 4.1 -7.5<br />
Cash flow from operating activities before financial items and taxes 109.3 53.0<br />
Dividends received from associate 25.3 67.2<br />
Financial items paid / received (net) -13.8 -18.0<br />
Taxes paid 0.2 -5.2<br />
Cash flow from operating activities (A) 121.0 97.0<br />
Cash flow from investing activities<br />
Acquisitions -0.2 -3.1<br />
Investments in plant, property & equipment -14.5 -25.4<br />
Proceeds from sale of plant, property & equipment and other investments 1.6 4.1<br />
Cash flow from other investments 4.2 -1.4<br />
Cash flow from investing activities (B) -8.7 -25.8<br />
Cash flow from financing activities<br />
Sale of treasury shares 0.0 0.2<br />
Borrowings of non-current debt 40.0 62.2<br />
Repayment of non-current debt -86.5 -0.1<br />
Change in current debt 2.0 -85.6<br />
Payment of finance lease liabilities -2.5 -3.4<br />
Cash flow from other financing items -0.1 -3.5<br />
Dividends paid -38.2 -61.5<br />
Cash flow from financing activities (C) -85.4 -91.7<br />
Change in cash and cash equivalents (A+B+C) 26.9 -20.5<br />
Cash and cash equivalents at beginning of period 11.3 34.5<br />
Translation difference 0.5 -2.8<br />
Cash and cash equivalents at end of period 38.6 11.3<br />
The notes are an integral part of these consolidated financial statements.
Consolidated Financial Statements, IFRS<br />
53<br />
Statement of Changes in Consolidated Equity<br />
M€<br />
Equity attributable to shareholders of the Parent Company:<br />
Share<br />
capital<br />
Treasury<br />
shares<br />
Cumulative<br />
translation<br />
difference<br />
Retained<br />
earnings<br />
Noncontrolling<br />
interest<br />
Dec 31, 2007 77.5 -0.9 -9.3 410.5 0.5 478.3<br />
Total<br />
Translation differences -1.9 0.0 -1.9<br />
Change in associate recognized directly in<br />
other comprehensive income -5.9 -12.2 -18.1<br />
Equity net investment hedges after tax 0.7 0.7<br />
Defined benefit plan, actuarial gains (losses), net of tax -0.2 -0.2<br />
Other changes 0.1 0.5 -0.5 0.2<br />
Other comprehensive income for the period, net of tax, in total 0.1 -7.1 -11.8 -0.4 -19.3<br />
Profit for the period 49.3 -0.1 49.2<br />
Total comprehensive income for the period 0.1 -7.1 37.4 -0.5 29.9<br />
Dividends paid -61.5 -61.5<br />
Dec 31, 2008 77.5 -0.8 -16.5 386.5 0.0 446.7<br />
Translation differences -1.9 -1.9<br />
Change in associate recognized directly in<br />
other comprehensive income 4.3 8.4 12.7<br />
Equity net investment hedges after tax 1.3 1.3<br />
Defined benefit plan, actuarial gains (losses), net of tax 0.7 0.7<br />
Other comprehensive income for the period, net of tax, in total 0.0 3.7 9.1 0.0 12.8<br />
Profit for the period 83.5 0.0 83.5<br />
Total comprehensive income for the period 0.0 3.7 92.6 0.0 96.3<br />
Dividends paid -38.2 -38.2<br />
Acquisition of non-controlling interest 0.1 0.1<br />
Dec 31, <strong>2009</strong> 77.5 -0.8 -12.8 440.9 0.0 504.8<br />
The notes are an integral part of these consolidated financial statements.
54 FISKARS Financial statements <strong>2009</strong><br />
Notes to the Consolidated<br />
Financial Statements<br />
1. Accounting principles for<br />
the consolidated financial<br />
statements, IFRS<br />
<strong>Fiskars</strong> <strong>Corporation</strong> is a Finnish public limited<br />
liability company listed on NASDAQ<br />
OMX Helsinki and domiciled in Raasepori,<br />
Finland. The registered address of <strong>Fiskars</strong><br />
<strong>Corporation</strong> is Mannerheimintie 14 A,<br />
00100 Helsinki, Finland. <strong>Fiskars</strong> <strong>Corporation</strong><br />
is the parent company of the Group.<br />
The Group manufactures and markets<br />
branded consumer products globally.<br />
<strong>Fiskars</strong>’ operating segments are EMEA<br />
(Europe, Middle East, and Asia-Pacific),<br />
Americas, the associated company Wärtsilä<br />
and Other. The operations are divided<br />
to Business Areas Home, Garden and<br />
Outdoor. In addition the Group has Real<br />
Estate operations and a strategic shareholding<br />
in Wärtsilä Oyj Abp qualifying as<br />
an investment in an associate. The Group<br />
holds international brands such as <strong>Fiskars</strong>,<br />
Iittala, Gerber, Silva and Buster.<br />
The financial statements are authorized<br />
for issue by the Board of Directors<br />
of <strong>Fiskars</strong> <strong>Corporation</strong>. According to the<br />
Finnish Limited Liability Companies’ Act,<br />
the shareholders have a possibility to<br />
approve or reject or make a decision on<br />
altering the financial statements in an Annual<br />
General Meeting to be held after the<br />
publication of the financial statements.<br />
Basis of preparation<br />
The consolidated financial statements<br />
of <strong>Fiskars</strong> <strong>Corporation</strong> (“<strong>Fiskars</strong>” or “the<br />
Group”) are prepared in accordance<br />
with International Financial Reporting<br />
Standards (IFRS) in force at 31 December<br />
<strong>2009</strong> as adopted by the European Union.<br />
International Financial Reporting Standards,<br />
referred to in the Finnish Accounting<br />
Act and in ordinances issued based on<br />
the provisions of this Act, are standards<br />
and their interpretations adopted in accordance<br />
with the procedure laid down<br />
in regulation (EC) No 1606/2002 of the<br />
European Parliament and of the Council.<br />
The notes to the consolidated financial<br />
statements also comply with the Finnish<br />
accounting and corporate legislation.<br />
The consolidated financial statements<br />
are prepared on historical cost basis<br />
except for financial assets and financial<br />
liabilities which are presented at fair value<br />
through profit or loss, and biological assets<br />
as well as assets and liabilities related<br />
to defined benefit pension plans that are<br />
measured at fair value.<br />
Items included in the financial statements<br />
of each of the Group’s entity are<br />
measured using the currency of the primary<br />
economic environment in which the<br />
entity operates (‘the functional currency’).<br />
The consolidated financial statements<br />
are presented in euros, which is the parent<br />
company’s functional currency. The<br />
presentation is in millions of euro with one<br />
decimal.<br />
Use of estimates<br />
The preparation of financial statements in<br />
conformity with IFRS requires the management<br />
to make judgments and assumptions<br />
that affect the recognition and measurement<br />
of financial statement items. These<br />
estimates and associated assumptions are<br />
based on historical experience and other<br />
justified assumptions that are believed to<br />
be reasonable under the circumstances<br />
at the end of the <strong>report</strong>ing period. These<br />
estimates form the basis for judgments<br />
of the items in the financial statements.<br />
Development of markets and general<br />
economic situation may affect the variables<br />
underlying the estimates and actual<br />
results may differ significantly from these<br />
estimates. Such estimates mainly relate<br />
to the assumptions made in impairment<br />
testing, amount of obsolete inventory,<br />
recognition of impairment losses on trade<br />
receivables, restructuring provisions,<br />
determination of defined benefit pension<br />
obligations and the probability of deferred<br />
tax assets being recovered against future<br />
taxable profits.<br />
Consolidated financial statements<br />
The consolidated financial statements<br />
include the parent company, <strong>Fiskars</strong> <strong>Corporation</strong>,<br />
and all the subsidiaries in which<br />
it holds, directly or indirectly, over 50% of<br />
the voting rights or over which it otherwise<br />
has control. Acquired or established subsidiaries<br />
are included in the consolidated<br />
financial statements from the date control<br />
commences until the date that control<br />
ceases.<br />
Subsidiaries are consolidated using the<br />
purchase method of accounting. Intragroup<br />
transactions, profit distribution, receivables,<br />
liabilities and unrealized gains<br />
between Group companies are eliminated<br />
in consolidation. The profit or loss for the<br />
financial year attributable to the owners<br />
and minority is presented in the income<br />
statement and the total comprehensive<br />
income for the financial year attributable<br />
to the owners and minority is presented in<br />
the statement of comprehensive income.<br />
The minority’s interest in equity is presented<br />
within equity, separately from the<br />
equity of the owners of the parent.<br />
Investments in associates in which<br />
<strong>Fiskars</strong> has a significant influence but not<br />
control are accounted for using the equity<br />
method. Significant influence usually<br />
exists when the Group holds over 20% of<br />
the voting power of the entity or when the<br />
Group otherwise has significant influence<br />
but not control. <strong>Fiskars</strong>’ most important<br />
associate is Wärtsilä <strong>Corporation</strong>. <strong>Fiskars</strong>’<br />
ownership in Wärtsilä was 17.1% of the<br />
shares and the votes. The shares are<br />
owned by <strong>Fiskars</strong>’ wholly owned subsidiary<br />
Avlis AB. <strong>Fiskars</strong> is the largest single<br />
shareholder with a share of 17.1% and<br />
<strong>Fiskars</strong> has significant influence through<br />
the number of members in the Board of Directors<br />
of Wärtsilä. Thus, <strong>Fiskars</strong> consolidates<br />
Wärtsilä as an associated company<br />
in accordance with IAS 28.<br />
Translation of foreign currency items<br />
t r a n s a c t i o n s in f o r e i g n c u r re n c i e s<br />
Foreign currency transactions are translated<br />
using the exchange rates prevailing<br />
at the dates of the transactions. At the end<br />
of the <strong>report</strong>ing period monetary assets<br />
and liabilities are translated using the<br />
exchange rate prevailing at the end of the<br />
<strong>report</strong>ing period. Exchange differences<br />
arising from translation of monetary assets<br />
and liabilities are recognized in the income<br />
statement and presented under financial<br />
items. Non-monetary items denominated<br />
in foreign currencies are translated using<br />
the exchange rate at the date of the<br />
transaction, except for those items carried<br />
at fair value that are translated using at<br />
the rates prevailing at the date when the<br />
fair value was determined. Exchange<br />
differences from non-monetary operating<br />
assets and liabilities are recorded in the<br />
income statement accounts within operating<br />
profit.<br />
t r a n s l a t i o n o f f i n a n c i a l statements<br />
o f f o r e i g n s u b s i d i a r i e s<br />
In the consolidated financial statements<br />
income statements, statements of comprehensive<br />
income and cash flows of foreign<br />
subsidiaries are translated into parent
Consolidated Financial Statements, IFRS<br />
55<br />
company’s currency at the average exchange<br />
rates for the period. Their balance<br />
sheet items are translated at exchange<br />
rates prevailing at the end of the <strong>report</strong>ing<br />
period. The resulting exchange differences<br />
are recognized in other comprehensive<br />
income and presented under translation<br />
differences in equity. Exchange differences<br />
resulting from the translation of profit<br />
or loss and comprehensive income at<br />
the average rate in the income statement<br />
and in the statement of comprehensive<br />
income, and at the closing rate in the balance<br />
sheet, are recognized in other comprehensive<br />
income and they are included<br />
under translation differences in equity. The<br />
effective portions of the gains or losses<br />
on those financial instruments hedging<br />
net investments in foreign operations are<br />
recognized similarly. When the Group<br />
disposes of all, or part of, that subsidiary,<br />
the translation differences accumulated in<br />
equity are transferred to profit or loss as<br />
part of the gain or loss on disposal.<br />
Net sales and revenue<br />
recognition principles<br />
Net sales are shown net of indirect taxes,<br />
rebates, and exchange differences on<br />
trade receivables denominated in foreign<br />
currencies. Revenue from the sale of<br />
goods is recognized when all significant<br />
risks and rewards of ownership have<br />
been transferred to the buyer, i.e. when a<br />
product has been delivered to the client<br />
in accordance with the terms of delivery.<br />
There are no such long-term projects in<br />
the Group for which the revenue would<br />
be recognized using the percentage-ofcompletion<br />
(POC) method.<br />
Pension obligations<br />
Group companies have various pension<br />
plans in accordance with local conditions<br />
and practices in the countries in which<br />
they operate. The plans are classified<br />
as either defined contribution plans or<br />
defined benefit plans. Under a defined<br />
contribution plan the Group pays fixed<br />
contributions into a separate entity. If the<br />
entity does not hold sufficient assets to<br />
pay all employees the benefits in question,<br />
the Group will have no legal or constructive<br />
obligation to pay further contributions.<br />
All other plans not meeting the above criteria<br />
are classified as defined benefit plans.<br />
Most of plans Group companies have are<br />
classified as defined contribution plans<br />
and related contributions are charged to<br />
the income statement in the year in which<br />
the payment obligation has arisen.<br />
The costs for defined benefit pension<br />
plans are calculated and recognized<br />
under the terms of the plan based on actuarial<br />
calculations. Pension costs are recognized<br />
as expenses over the employees’<br />
service period. The pension obligation<br />
is measured as the present value of the<br />
estimated future contributions deducted<br />
by the fair value of plan assets at the end<br />
of the <strong>report</strong>ing period. Changes in the<br />
estimates in the actuarial calculations may<br />
influence the <strong>report</strong>ed pension obligations<br />
and pension costs.<br />
Until the end of the third quarter of 2008<br />
<strong>Fiskars</strong> recognized actuarial gains and<br />
losses in the income statement in full.<br />
Since the fourth quarter 2008 <strong>Fiskars</strong> applies<br />
the alternative accounting treatment<br />
under IAS 19 for the recognition of actuarial<br />
gains and losses that allows an entity to<br />
record actuarial gains and losses in other<br />
comprehensive income. The comparative<br />
figures were adjusted accordingly.<br />
Operating profit<br />
IAS 1 Presentation of Financial Statements<br />
does not give a definition for operating<br />
profit. In <strong>Fiskars</strong> the operating profit (EBIT)<br />
includes the operating results of <strong>Fiskars</strong>’<br />
operating segments EMEA, Americas,<br />
and Others. The share of the profit or loss<br />
of the associate Wärtsilä and the change<br />
in the fair value of biological assets are<br />
presented as separate line items below<br />
the EBIT in the income statement.<br />
The definition for operating profit (EBIT)<br />
was changed as of January 1, <strong>2009</strong>. The<br />
comparison figures for 2008 have been<br />
restated accordingly.<br />
Intangible assets<br />
An intangible asset is initially capitalized<br />
in the balance sheet at cost if the cost can<br />
be measured reliably and it is probable<br />
that the expected future economic benefits<br />
that are attributable to the asset will flow to<br />
the Group.<br />
g o o d w i l l<br />
Goodwill represents the Group’s share of<br />
difference between the cost of the acquisition<br />
and the fair value of the net identifiable<br />
assets, liabilities, and contingent liabilities<br />
acquired measured at the acquisition date.<br />
Goodwill is stated at historical cost less any<br />
accumulated impairment losses. Goodwill<br />
is not amortized but is tested for impairment<br />
at least <strong>annual</strong>ly. For this purpose<br />
goodwill has been allocated to cashgenerating<br />
units or, in case of an associate,<br />
the goodwill is included within the carrying<br />
amount of the associate in question. The<br />
recoverable amount of the unit is compared<br />
<strong>annual</strong>ly, or more often if there are<br />
indications of impairment, with its carrying<br />
amount to determine potential impairment.<br />
research a n d development c o s t s<br />
Research and development costs are<br />
expensed as they are incurred, except<br />
for those development costs that are<br />
capitalized if the Group can reliably demonstrate<br />
that they will generate probable<br />
future economic benefits for the Group<br />
and also other criteria in IAS 38 are met<br />
as the product is regarded technically<br />
and commercially feasible. Capitalized<br />
development costs consisting of mainly<br />
direct labor costs and external services<br />
are recognized as intangible rights.<br />
Intangible assets not yet available for<br />
use are tested <strong>annual</strong>ly for impairment.<br />
Subsequent to initial recognition capitalized<br />
development costs are measured at<br />
cost less accumulated amortization and<br />
accumulated impairment losses. They are<br />
amortized on a straight-line basis over<br />
their useful lives, from 3 to 6 years.<br />
o t h e r i n t a n g i b l e assets<br />
Other intangible assets include among<br />
other patents, capitalized development<br />
costs, software, as well as trademarks and<br />
customer relationships acquired in business<br />
combinations. Intangible assets are<br />
stated at cost less accumulated amortization<br />
and any accumulated impairment. Intangible<br />
assets in this class are amortized<br />
on a straight-line basis over their known or<br />
expected useful lives as follows:<br />
• Software<br />
3–6 years<br />
• Customer relationships 5–15 years<br />
• Other<br />
3–10 years<br />
Intangible assets with an indefinite useful<br />
life such as trademarks or brand names<br />
acquired in business combinations are<br />
not amortized but they are tested at least<br />
<strong>annual</strong>ly for impairment.<br />
Property, plant, and equipment<br />
Property, plant, and equipment are<br />
stated at historical cost less accumulated<br />
depreciation and any accumulated<br />
impairment losses, if applicable. Those<br />
borrowing costs directly attributable to the<br />
acquisition, construction or production of a<br />
qualifying asset are capitalized as part of<br />
the cost of that asset.<br />
Depreciation is charged to the income<br />
statement on a straight-line basis over the<br />
estimated useful lives of the assets. Residual<br />
values and expected useful lives and<br />
are reassessed at least at each financial<br />
year-end and, if necessary, are adjusted<br />
to reflect changes in the expected future<br />
economic benefits. The estimated useful<br />
lives are as follows:<br />
• Buildings<br />
20–40 years<br />
• Machinery and equipment 3–10 years<br />
• Land and water No depreciation<br />
Gains and losses on sales and disposals<br />
of items of property, plant, and equipment<br />
are presented under other operating<br />
income and other operating expenses.<br />
Leases<br />
Leases in terms of which the Group<br />
substantially takes over from the lessor
56 FISKARS Financial statements <strong>2009</strong><br />
all the risks and rewards of ownership<br />
are classified as finance leases. Assets<br />
leased under finance leases are recognized<br />
under property, plant, and equipment<br />
at amounts equal to the fair value of<br />
the leased assets or, if lower, the present<br />
value of the minimum lease payments at<br />
the commencement of the lease term. The<br />
associated obligations are recognized in<br />
interest-bearing financial liabilities. The<br />
lease payments are divided into finance<br />
cost and amortization of the lease liability.<br />
Leases in which a significant portion of<br />
the risks and rewards of ownership are retained<br />
by the lessor are accounted for as<br />
operating leases. Lease payments made<br />
under an operating lease are recognized<br />
as an expense on a straight-line basis<br />
over the lease term.<br />
Investment property<br />
The properties that are not used in the<br />
Group’s operations or which are held to<br />
earn rental revenue or increase in value<br />
are classified as investment property.<br />
These properties are measured at cost<br />
less accumulated depreciation and impairment.<br />
Investment property is depreciated<br />
over 20–40 years.<br />
Impairment of property, plant and<br />
equipment and intangible assets<br />
The Group operations have been divided<br />
into cash-generating units (CGU) that are<br />
smaller than operating segments. The<br />
carrying amounts of the assets relating to<br />
these CGUs are reviewed at the end of<br />
each <strong>report</strong>ing period. The recoverable<br />
amounts of the following assets are also estimated<br />
<strong>annual</strong>ly irrespective whether there<br />
is any indication for impairment: goodwill,<br />
intangible assets with indefinite useful lives<br />
and unfinished intangible assets.<br />
To determine a potential impairment the<br />
carrying amount of the asset is compared<br />
or the carrying amounts of the CGU’s net<br />
assets are compared against the recoverable<br />
amount of that asset or CGU. The<br />
recoverable amount is the higher of the<br />
present value of the discounted future<br />
cash flows expected to be derived (value<br />
in use) and the fair value less costs to sell.<br />
An impairment loss is recognized for an<br />
asset when its carrying amount exceeds<br />
its recoverable amount. An impairment<br />
loss previously recognized for items of<br />
property, plant, and equipment as well as<br />
for intangible assets other than goodwill is<br />
reversed subsequently, if there has been a<br />
change in the estimates used to determine<br />
the asset's recoverable amount. An impairment<br />
loss is reversed only to the extent<br />
that the asset’s carrying amount does not<br />
exceed the carrying amount that would<br />
have been determined, net of amortization<br />
or depreciation, if no impairment loss<br />
had been recognized for the asset in prior<br />
years. An impairment loss recognized for<br />
goodwill is not reversed.<br />
Biological assets<br />
Biological assets consist of standing timber<br />
in Finland. These assets are measured at<br />
fair value less estimated point-of-sale costs.<br />
The fair value resulting from both net growth<br />
and change in the market value of standing<br />
timber is presented as a separate line item<br />
in the income statement after operating<br />
profit (EBIT). The revenue from the sale of<br />
standing timber is presented in the income<br />
statement within the operating profit.<br />
Since the fourth quarter of 2008 <strong>Fiskars</strong><br />
applies a three-year rolling average price<br />
for measuring the fair value of standing<br />
timber.<br />
Non-current assets held<br />
for sale and discontinued<br />
operations<br />
A non-current asset (or a disposal group)<br />
as well as assets and liabilities associated<br />
with a discontinued operation are<br />
classified as held for sale if their carrying<br />
amount will be recovered principally<br />
through a sale transaction rather than<br />
through continuing use. The recognition<br />
criteria are regarded to be met when: a<br />
sale is highly probable, the asset (or a<br />
disposal group) is available for immediate<br />
sale in its present condition subject only<br />
to terms that are usual and customary, the<br />
management is committed to the plan to<br />
sell the asset and the sale is expected to<br />
take place within one year from the date of<br />
classification.<br />
As from classification date a non-current<br />
asset (or a disposal group) held for sale is<br />
generally measured at the lower of its carrying<br />
amount and fair value less costs to<br />
sell, and it is not depreciated or amortized<br />
any more. Assets classified as held for<br />
sale, disposal groups, items recognized<br />
in other comprehensive income associated<br />
with the assets classified as held for<br />
sale as well as liabilities included in the<br />
disposal group are presented separately<br />
in the balance sheet.<br />
A discontinued operation is a component<br />
of the Group’s business that has been<br />
disposed of or will be disposed of in accordance<br />
with a coordinated plan. It represents<br />
a separate major line of business<br />
or geographical area of operations. The<br />
profit or loss of a discontinued operation<br />
is <strong>report</strong>ed separately from the continuing<br />
operations in the consolidated statement<br />
of comprehensive income.<br />
<strong>Fiskars</strong> had no non-current assets held<br />
for sale or discontinued operations in the<br />
financial years <strong>2009</strong> or 2008.<br />
Inventories<br />
Inventories are carried at the lower of cost<br />
and net realizable value. Cost is determined<br />
using primarily the first-in first-out<br />
(FIFO) method. The cost of finished goods<br />
and work-in-progress comprise direct<br />
purchase and manufacturing cost, other<br />
direct costs and a proportion of the related<br />
production overheads based on normal<br />
operating capacity. Net realizable value is<br />
the estimated amount that can be realized<br />
from the sale in normal course of business<br />
less the estimated costs of completion and<br />
the estimated costs necessary to make<br />
the sale. Inventories are shown net of an<br />
impairment loss recognized for obsolete<br />
and slow-moving inventories.<br />
Financial instruments<br />
f i n a n c i a l assets<br />
<strong>Fiskars</strong> classifies its financial assets in the<br />
following categories: financial assets at<br />
fair value through profit or loss, loans and<br />
receivables and available-for-sale financial<br />
assets. Financial assets are classified at<br />
initial recognition based on their purpose<br />
of use. In the case of investments not at<br />
fair value through profit or loss, directly<br />
attributable transaction costs are included<br />
in the original costs of the financial assets.<br />
All purchases or sales of financial assets<br />
are recognized or derecognized using<br />
trade date accounting. The Group derecognizes<br />
financial assets when it has lost<br />
its right to receive the cash flows or when<br />
it has transferred substantially all the risks<br />
and rewards to an external party.<br />
f i n a n c i a l assets a t f a i r v a l u e<br />
t h r o u g h p r o f i t o r l o s s<br />
In this category are classified such financial<br />
assets that are held for trading or are<br />
designated as financial assets at fair value<br />
through profit or loss upon initial recognition<br />
(the fair value option). In <strong>Fiskars</strong><br />
this category comprises the investments<br />
in listed securities and those derivative<br />
instruments that do not meet the hedge<br />
accounting criteria.<br />
These financial assets are measured<br />
at fair value both at initial recognition and<br />
subsequently. The fair values of the listed<br />
securities are based on quoted rates at<br />
the end of the <strong>report</strong>ing period. Fair value<br />
changes, both realized and unrealized<br />
gains and losses are recognized in the<br />
income statement under financial items.<br />
The fair value measurement principles<br />
of the derivative instruments that do not<br />
meet the hedge accounting criteria are<br />
described below under Derivatives and<br />
hedge accounting.<br />
l o a n s a n d receivables<br />
Loans and receivables are non-derivative<br />
financial assets with fixed or determinable<br />
payments that are not quoted in an active<br />
market. The Group does not hold them for<br />
trading or designate them as available for<br />
sale upon initial recognition. This category
Consolidated Financial Statements, IFRS<br />
57<br />
comprises trade receivables and other<br />
receivables under current receivables as<br />
well as non-current loan receivables that<br />
are presented under the item Other investments<br />
in the consolidated balance sheet.<br />
Loans and receivables are measured<br />
at amortized cost. The estimate made for<br />
doubtful receivables is based on the risks of<br />
individual items. Resulting from this assessment<br />
the carrying amounts of receivables<br />
are adjusted to measure their probable<br />
value at highest. Loans and receivables are<br />
included in current or non-current assets<br />
based on their nature; in the latter class for<br />
maturities greater than 12 months after the<br />
end of the <strong>report</strong>ing period.<br />
a v a i l a b l e-f o r-s a l e f i n a n c i a l assets<br />
Available-for-sale financial assets are<br />
non-derivative financial assets that are<br />
designated as available-for-sale and that<br />
are not classified in any of the categories.<br />
In <strong>Fiskars</strong> this category comprises the<br />
investments in unlisted securities. As their<br />
fair values cannot be determined reliably,<br />
they are measured at cost. Available-forsale<br />
financial assets are included in noncurrent<br />
assets unless the Group intends<br />
to dispose of them within 12 months of the<br />
end of the <strong>report</strong>ing period in which case<br />
they are included in current assets.<br />
c a s h a n d c a s h equivalents<br />
The balance sheet item Cash and cash<br />
equivalents includes cash, i.e. cash in<br />
hand and deposits held at call with banks,<br />
and cash equivalents. Cash equivalents<br />
comprise highly liquid investments that are<br />
readily convertible to a known amount of<br />
cash and subject to an insignificant risk of<br />
changes in value. The items included in<br />
cash equivalents have original maturities<br />
of maximum three months from the date of<br />
acquisition. Bank overdrafts are included<br />
within current interest-bearing financial<br />
liabilities.<br />
f i n a n c i a l liabilities<br />
<strong>Fiskars</strong> classifies its financial liabilities in<br />
the following categories: financial liabilities<br />
at fair value through profit or loss (includes<br />
derivative liabilities) and financial liabilities<br />
measured at amortized cost. A financial<br />
liability is recognized initially at fair value.<br />
In the case of a financial liability measured<br />
at amortized cost, directly attributable<br />
transaction costs are included in the original<br />
cost. Subsequently financial liabilities<br />
are carried at amortized cost using the<br />
effective interest method, except for<br />
derivative liabilities that are measured at<br />
fair value. Financial liabilities are classified<br />
as non-current or current; the latter group<br />
comprises all those financial liabilities<br />
for which the Group does not have an<br />
unconditional right to defer settlement of<br />
the liability for at least 12 months after the<br />
end of the <strong>report</strong>ing period. The Group<br />
removes a financial liability (or a part of it)<br />
from its balance sheet only when it is extinguished,<br />
i.e. when the obligation specified<br />
in the contract is discharged or cancelled<br />
or expires.<br />
derivatives a n d h e d g e a c c o u n t i n g<br />
Derivative financial instruments are classified<br />
as financial instruments at fair value<br />
through profit and loss. Derivatives are<br />
recognized initially at cost and subsequently<br />
at fair value determined at the end<br />
of each <strong>report</strong>ing period. The fair value of<br />
derivatives is based on prevailing market<br />
rates or rates derived from the prevailing<br />
market rates at the end of the <strong>report</strong>ing<br />
period. Realized gains and losses as well<br />
as fair value changes are recognized as<br />
adjustments to sales and purchases or in<br />
financial items in depending on the nature<br />
of the hedged item.<br />
Hedge accounting is applied to hedges<br />
of net investments in foreign operations.<br />
<strong>Fiskars</strong> has been hedging the most significant<br />
net investments in the subsidiaries<br />
situated outside the Euro zone against<br />
foreign currency exchange rate fluctuations<br />
through foreign currency loans and<br />
derivatives. However, the hedging was<br />
discontinued during <strong>2009</strong> and there were<br />
no net investment hedges outstanding at<br />
the end of <strong>2009</strong>.<br />
Provisions and contingent liabilities<br />
A provision is recognized when the Group<br />
as a result of a past event has a present<br />
legal or constructive obligation, it is probable<br />
that the obligation will be realized<br />
and a reliable estimate can be made of<br />
the amount of the obligation. A provision<br />
for restructuring is recognized when a detailed<br />
formal plan has been prepared and<br />
when there is a valid expectation relating<br />
those affected that the plan will be carried<br />
out. The amount recognized as a provision<br />
is the best estimate of the expenditure<br />
required to settle the present obligation<br />
at the end of the <strong>report</strong>ing period. If it is<br />
possible to receive compensation for part<br />
of the obligation from a third party, the<br />
compensation is recognized as a separate<br />
asset, but only when receipt of the compensation<br />
is virtually certain.<br />
The Group is party to lawsuits and legal<br />
processes concerning Group’s business<br />
operations. A related provision is recognized<br />
in the financial statements when<br />
the amount of the expenditure can be<br />
estimated reliably and it is more likely than<br />
not that they will be realized. Otherwise<br />
these contingent liabilities are disclosed in<br />
the notes.<br />
Income Taxes<br />
The Group’s tax expense comprises current<br />
tax based on Group companies’ taxable<br />
profit for the period and the change<br />
of deferred taxes. The current tax charge<br />
is calculated using the tax rate enacted<br />
or substantively enacted at the end of the<br />
<strong>report</strong>ing period. Deferred tax liabilities<br />
or deferred tax assets are provided for<br />
temporary differences between the carrying<br />
amounts of assets and liabilities<br />
for financial <strong>report</strong>ing purposes and the<br />
amounts used for taxation purposes<br />
using tax rates enacted or substantively<br />
enacted at the end of the <strong>report</strong>ing period.<br />
Temporary differences arise, inter alia,<br />
from tax loss carry-forwards, depreciation<br />
differences, provisions, defined benefit<br />
pension plans, fair value measurement of<br />
derivative financial instruments, biological<br />
assets, eliminated intra-group inventory<br />
margins as well as from the fair value<br />
adjustments made to assets and liabilities<br />
in business combinations. A deferred tax<br />
liability is recognized on the undistributed<br />
profits of subsidiaries and associates if the<br />
distribution of profit is probable and it will<br />
result in tax consequences. A deferred tax<br />
liability is recorded to its full amount and<br />
a deferred tax asset is recognized at the<br />
amount of the estimated probable tax benefit.<br />
Income tax is recognized in profit or<br />
loss, unless it relates to items recognized<br />
either in other comprehensive income or<br />
directly in equity. In such case any related<br />
tax effects are also recognized similarly.<br />
Dividends<br />
Dividends proposed by the Board of<br />
Directors are not recorded in the financial<br />
statements until they have been approved<br />
by the shareholders at the Annual General<br />
Meeting.<br />
Adopted IFRS standards<br />
and interpretations <strong>2009</strong><br />
As from 1 January <strong>2009</strong> the Group has<br />
applied the following standards, interpretations<br />
and their amendments:<br />
• Amendments to IFRS 7 Financial Instruments:<br />
Disclosures – Improving Disclosures<br />
About Financial Instruments.<br />
The amendments have expanded the<br />
disclosures to be provided on fair value<br />
measurement of financial assets and<br />
financial liabilities and on liquidity risk.<br />
• Improvements to IFRSs, May 2008<br />
(Annual Improvements). The amendments<br />
deal with 34 standards. Under<br />
this procedure minor and non-urgent<br />
amendments are grouped together and<br />
carried out through a single document<br />
<strong>annual</strong>ly.<br />
• Revised IAS 1 Presentation of Financial<br />
Statements. Due to the adoption of the<br />
revised IAS 1 there are changes in the<br />
terminology from the 2008 <strong>report</strong>ing.<br />
• IFRIC 13 Customer Loyalty Programmes.<br />
The interpretation requires<br />
customer loyalty credits be accounted
58 FISKARS Financial statements <strong>2009</strong><br />
for as a separate component of the<br />
sales transaction in which they are<br />
granted.<br />
• IAS 23 (revised) Borrowing costs.<br />
The adoption of the other new and amended<br />
standards had no impact on <strong>Fiskars</strong>’<br />
<strong>2009</strong> consolidated financial statements.<br />
<strong>Fiskars</strong> has adopted IFRS 8 Operating<br />
Segments already in 2008.<br />
Adoption of new IFRS<br />
standards and interpretations<br />
The standards, interpretations and their<br />
amendments described below have been<br />
issued but the Group has not applied<br />
these regulations before their effective<br />
dates. The Group will adopt them as of<br />
the effective date or, if the date is other<br />
than the first day of the financial year, from<br />
the beginning of the subsequent financial<br />
year.<br />
<strong>Fiskars</strong> is assessing the impacts on the<br />
consolidated financial statements of the<br />
following standards:<br />
• Revised IFRS 3 Business Combinations<br />
(effective for financial years beginning<br />
on or after 1 July <strong>2009</strong>).<br />
The amendments broaden the scope of<br />
IFRS 3 and impact, among other things,<br />
the amount of goodwill recognised on<br />
business combinations and sales results<br />
of businesses. Contingent consideration<br />
will be measured at fair value and subsequently<br />
re-measured through profit<br />
or loss. All acquisition-related costs,<br />
such as experts’ fees, will be expensed<br />
instead of capitalization. There is a<br />
choice on an acquisition-by-acquisition<br />
basis to measure the non-controlling<br />
interest (previously called minority) in<br />
the acquiree either at fair value or at the<br />
non-controlling interest’s proportionate<br />
share of the acquiree’s net assets.<br />
• Amended IAS 27 Consolidated and<br />
Separate Financial Statements (effective<br />
for financial years beginning on or after<br />
1 July <strong>2009</strong>).<br />
The amendments affect the accounting<br />
treatment of acquisitions and<br />
sales achieved in stages. If the parent<br />
company retains control, impacts from<br />
changes in ownership in a subsidiary<br />
are recognized directly in Group’s<br />
equity. When control is lost, any remaining<br />
interest is measured at fair value<br />
through profit or loss. A similar accounting<br />
treatment is also applied to investments<br />
in associates and interests in joint<br />
ventures. In future losses of a subsidiary<br />
may be allocated to non-controlling interest<br />
also when they exceed the value<br />
of the minority shareholders’ investment.<br />
• IFRS 9* Financial Instruments (effective<br />
for financial years beginning on or<br />
after 1 January 2013). IFRS 9 is part<br />
of the IASB’s project to replace IAS<br />
39 Financial Instruments: Recognition<br />
and Measurement. The new standard<br />
deals with measurement categories for<br />
financial assets. The guidance in IAS 39<br />
on impairment of financial assets and on<br />
hedge accounting continues to apply.<br />
<strong>Fiskars</strong> does not expect the adoption of<br />
the following standards, interpretations<br />
and their amendments to have a significant<br />
effect on the consolidated financial<br />
statements:<br />
• Amendment to IAS 39 Financial Instruments:<br />
Recognition and Measurement<br />
– Eligible Hedged Items (effective for<br />
financial years beginning on or after 1<br />
July <strong>2009</strong>).<br />
• IFRIC 17 Distributions of Non-cash<br />
Assets to Owners (effective for financial<br />
years beginning on or after 1 July <strong>2009</strong>).<br />
• IFRIC 18 Transfers of Assets from<br />
Customers (effective on financial years<br />
beginning on or after 1 July <strong>2009</strong>).<br />
• Improvements to IFRSs* (April <strong>2009</strong>) (effective<br />
mainly on financial years beginning<br />
on or after 1 January 2010).<br />
• Amendments to IFRS 2 Share-based<br />
Payment – Group Cash-settled Sharebased<br />
Payment Transactions* (effective<br />
on financial years beginning on or after<br />
1 January 2010).<br />
• Amendment to IAS 32 Financial Instruments:<br />
Presentation – Classification of<br />
Rights Issues* (effective on financial<br />
years beginning on or after 1 February<br />
2010).<br />
• Revised IAS 24 Related Party Disclosures<br />
(effective for financial years<br />
beginning on or after 1 January 2011).<br />
• Amendments to IFRIC 14 IAS 19 – The<br />
Limit on a Defined Benefit Asset, Minimum<br />
Funding Requirements and their<br />
Interaction – Prepayments of a Minimum<br />
Funding Requirement* (effective for<br />
financial years beginning on or after<br />
1 January 2011).<br />
• IFRIC 19 Extinguishing Financial Liabilities<br />
with Equity Instruments* (effective<br />
for financial years beginning on or after<br />
1 July 2010).<br />
* The standard or its amendment is still<br />
subject to endorsement by the EU.<br />
2. Segment Information<br />
<strong>Fiskars</strong>’ operating segments are EMEA<br />
(Europe, Middle East, and Asia-Pacific),<br />
Americas, the associated company Wärtsilä<br />
and Other. The operating segments<br />
are indentified on the basis of management<br />
<strong>report</strong>ing, which is organized by<br />
geographical areas. The operations are<br />
further divided to business areas.<br />
Operating segments<br />
• EMEA: The revenues comprise of sales<br />
of Home, Garden and Outdoor products<br />
to retailers in Europe, Middle-East and<br />
Asia-Pacific. Homeware products are<br />
even sold directly to consumers via own<br />
stores and outlets.<br />
• Americas: The revenues comprise of<br />
sales of Home, Garden and Outdoor<br />
products to retailers in USA, Canada<br />
and Latin America.<br />
• Other: The revenues consist mainly<br />
of rent income from Real Estate and<br />
timber sales in Finland. Other covers<br />
Real Estate and corporate headquarters<br />
functions.<br />
• Associate Wärtsilä: Income from the<br />
associate is <strong>report</strong>ed as one operating<br />
segment.<br />
Business activities between the segments<br />
are limited. Inter-segment sales are<br />
made on arms length basis. Real Estate<br />
owns real estate in Finland and leases it<br />
to subsidiaries in Finland e.g. for use as<br />
production facilities.<br />
Management monitors the operating<br />
results of the segments separately for the<br />
purpose of making decisions. Segment<br />
assets and liabilities are based on geographical<br />
location of the assets. Financial<br />
income and costs and income taxes are<br />
managed on group basis and accordingly<br />
not allocated to operating segments.<br />
In the Americas the <strong>Fiskars</strong> branded<br />
products’ distribution, logistics and consumer<br />
preferences are managed centrally<br />
for the business areas. In the EMEA area<br />
the markets and distribution are more<br />
diversified, but from the customer point of<br />
view the business areas operate in a common<br />
environment.<br />
Business areas<br />
Business areas are Home, Garden and<br />
Outdoor. Net sales for the business areas<br />
are <strong>report</strong>ed based on the nature of the<br />
sales of the products sold to customers.<br />
Sales between the business areas are<br />
insignificant.
Consolidated Financial Statements, IFRS<br />
59<br />
Unallocated items<br />
The unallocated items of the Income<br />
Statement contain corporate level costs<br />
and income. Unallocated assets comprise<br />
items related to corporate administration,<br />
tax receivables, loan receivables and<br />
equity instruments. Unallocated liabilities<br />
comprise non-current and current debt<br />
and tax liabilities. Also part of the restructuring<br />
costs are unallocated.<br />
Changes in segment<br />
<strong>report</strong>ing in <strong>2009</strong><br />
<strong>Fiskars</strong>’ operating segment and business<br />
area structure was changed as of January<br />
1, <strong>2009</strong>. The Inha Works business, which<br />
mainly consists of boat production, has<br />
been moved from Other to EMEA.<br />
School, office and craft (SOC) is included<br />
in the business area Home. Previously<br />
SOC was <strong>report</strong>ed as a separate business<br />
area as well as Boats (Inha Works) that is<br />
now included in Outdoor.<br />
2.1 Operating segments<br />
<strong>2009</strong><br />
Unallocated<br />
M€ EMEA Americas Other<br />
Associate<br />
Wärtsilä<br />
and<br />
eliminations<br />
Corporate<br />
total<br />
Net sales, external 446.3 213.0 3.7 0.0 662.9<br />
Net sales, inter-segment 7.9 5.2 2.4 -15.5 0.0<br />
Net sales 454.2 218.2 6.1 -15.5 662.9<br />
Operating profit 26.7 23.9 -11.1* ) 0.0 39.5<br />
Change in fair value of biological assets -0.4 -0.4<br />
Share of profit from associate 66.5 66.5<br />
Financial income and expenses -14.2 -14.2<br />
Profit before taxes 91.4<br />
Income taxes -7.9 -7.9<br />
Profit for the period 83.5<br />
Assets 539.3 154.1 425.8 316.8 -462.5 973.3<br />
Liabilities 425.9 62.1 424.3 -443.8 468.5<br />
Capital expenditure 10.7 2.8 1.1 0.0 14.6<br />
Depreciations, amortizations and impairment 20.5 7.8 -0.2 0.0 28.1<br />
* ) Includes non-recurrings items €-0.5 million.<br />
2008<br />
Unallocated<br />
M€ EMEA Americas Other<br />
Associate<br />
Wärtsilä<br />
and<br />
eliminations<br />
Corporate<br />
total<br />
Net sales, external 481.0 211.4 4.5 0.0 697.0<br />
Net sales, inter-segment 10.3 5.1 1.4 -16.7 0.0<br />
Net sales 491.3 216.5 5.9 0.0 -16.7 697.0<br />
Operating profit excluding restructuring 29.1 15.4 -11.7 0.0 5.0 37.8<br />
Restructuring costs -7.4 -19.4 -5.0 -31.8<br />
Operating profit 21.7 -4.0 -11.7 0.0 0.0 6.0<br />
Change in fair value of biological assets -5.6 -5.6<br />
Share of profit from associate 70.5 70.5<br />
Financial income and expenses -19.4 -19.4<br />
Profit before taxes 51.5<br />
Income taxes -2.3 -2.3<br />
Profit for the period 49.2<br />
Assets 574.4 149.2 581.5 263.5 -599.0 969.7<br />
Liabilities 464.0 66.4 428.3 -435.8 523.0<br />
Capital expenditure 23.7 3.0 3.1 0.0 29.8<br />
Depreciations, amortizations and impairment 18.3 12.8 1.8 0.0 32.9
60 FISKARS Financial statements <strong>2009</strong><br />
2.2 Net sales by business area<br />
M€ <strong>2009</strong> 2008<br />
Home 299.9 316.8<br />
Garden 230.9 231.2<br />
Outdoor 128.4 145.2<br />
Other 3.7 3.9<br />
Total 662.9 697.0<br />
2.3 Information about geographical areas<br />
M€ <strong>2009</strong> 2008<br />
Net sales from Finland 141.6 151.5<br />
Net sales from foreign countries 521.4 545.5<br />
Total 662.9 697.0<br />
Assets in Finland * ) 535.4 513.9<br />
Assets in foreign countries * ) 157.8 145.0<br />
Total 693.2 659.0<br />
* ) Non-current assets other than financial instruments, deferred<br />
tax assets and post-employment benefit assets.<br />
3. Non-recurring and Restructuring Costs<br />
<strong>2009</strong><br />
<strong>Fiskars</strong> has continued restructuring measures to improve the<br />
profitability of the business in <strong>2009</strong>. However, there were no material<br />
restructuring costs in <strong>2009</strong>. The restructuring provisions recorded<br />
in 2008 were utilized according to the plan. Other non-recurring<br />
costs recorded in <strong>2009</strong> amounted to €0.5 million.<br />
2008<br />
In 2008 the restructuring costs totaled €31.8 million. The restructuring<br />
costs recorded in cost of goods sold amounted to €13.7<br />
million, whereof €12.6 million resulted from the change in the inventory<br />
valuation policy. The rest of the restructuring costs was<br />
recorded in sales and marketing, administration and other operating<br />
expenses. Other non-recurring costs recorded in 2008<br />
amounted to €3.1 million.<br />
4. Acquisitions and Divestments<br />
<strong>2009</strong><br />
• Acquisition of Silva Far East<br />
<strong>Fiskars</strong> acquired a 30% minority share of Silva Far East Ltd in<br />
June <strong>2009</strong>. The holding was acquired from Kasinda Holding<br />
Limited for €0.2 million. After the minority share acquisition, the<br />
manufacturing company in China became a wholly owned subsidiary<br />
of Silva Sweden AB.<br />
Brunton’s net sales in <strong>2009</strong> were €8.8 million, the operating<br />
loss was €2.1 million and the cash flow from operations was<br />
€0.4 million.<br />
The portion of the disposal consideration that is cash and cash<br />
equivalents is <strong>report</strong>ed in the Consolidated Statement of Cash<br />
Flows on line "Cash flow from other investments".<br />
• Divestment of craft consumables<br />
<strong>Fiskars</strong> divested its craft consumables product lines and the related<br />
brands Heidi Grace and Cloud9 to Colorbök, Inc in the U.S.<br />
in July <strong>2009</strong>. Net sales of the business for January–June <strong>2009</strong><br />
amounted to €2.4 million.<br />
2008<br />
• Acquisition of Iittala Group's minority share<br />
<strong>Fiskars</strong> acquired a 2.3% minority share of Iittala Group on June<br />
30, 2008. Purchase price of the minority share was €3.1 million<br />
and was paid fully in cash. The price of the purchase has been<br />
allocated to assets, liabilities and contingent liabilities already<br />
at the 2007 acquisition. After minority share acquisition <strong>Fiskars</strong><br />
owns all shares of Iittala Group.<br />
5. Notes to the Income Statement<br />
5.1 Other operating income<br />
M€ <strong>2009</strong> 2008<br />
Net gain on disposal of fixed assets 0.4<br />
Rental income 0.4 0.4<br />
Other 1.4 2.0<br />
Total 1.8 2.9<br />
5.2 Total expenses by nature<br />
M€ <strong>2009</strong> 2008<br />
Materials and supplies 334.1 300.7<br />
Change in inventory 40.7 13.0<br />
Employee benefits 165.3 186.8<br />
Depreciation and amortization 28.1 32.9<br />
External services 25.7 21.4<br />
Other 31.4 139.1<br />
Total 625.2 693.9<br />
5.3 Other operating expenses<br />
M€ <strong>2009</strong> 2008<br />
Impairment of property,<br />
plant and equipment 1.2 5.6<br />
Other 0.7 12.2<br />
Total 1.9 17.8<br />
• Divestment of Brunton<br />
<strong>Fiskars</strong> sold the Brunton business in Wyoming, USA in December<br />
<strong>2009</strong> to Fenix Outdoor AB (publ) of Sweden. The transaction<br />
did not have a material impact on <strong>Fiskars</strong>’ net sales or operating<br />
profit <strong>2009</strong>. Brunton was <strong>report</strong>ed as a part of <strong>Fiskars</strong>’ Outdoor<br />
business.
Consolidated Financial Statements, IFRS<br />
61<br />
5.4 Employee benefits<br />
M€ <strong>2009</strong> 2008<br />
Wages and salaries 113.4 126.4<br />
Other compulsary personnel costs 36.8 40.7<br />
Pension costs,<br />
defined contribution plans 13.4 13.4<br />
Pension costs, defined benefit plans 0.3 0.1<br />
Other post employment benefits 0.4<br />
Termination benefits 1.4 5.8<br />
Total 165.3 186.8<br />
5.5 Average number of employees<br />
<strong>2009</strong> 2008<br />
Finland 1,598 1,787<br />
Other Europe 1,293 1,431<br />
USA 740 861<br />
Other 236 246<br />
Total 3,867 4,325<br />
5.6 Number of employees, end-of-period<br />
<strong>2009</strong> 2008<br />
Blue collar 2,089 2,473<br />
White collar 1,534 1,646<br />
Total 3,623 4,119<br />
5.7 Fees paid to Companies’ Auditors<br />
M€ <strong>2009</strong> 2008<br />
Audit fees 0.9 0.9<br />
Audit related fees 0.0 0.1<br />
Tax consultation 0.1 0.2<br />
Other non-audit fees 0.1 0.1<br />
Total 1.2 1.4<br />
The appointed auditor was KPMG for the financial years<br />
2008–<strong>2009</strong>.<br />
5.8 Depreciation, amortization and impairment by<br />
asset class<br />
M€ <strong>2009</strong> 2008<br />
Buildings 3.8 7.5<br />
Machinery and equipment 18.3 19.4<br />
Intangible assets 6.0 6.0<br />
Total 28.1 32.9<br />
5.9 Financial income and expenses<br />
M€ <strong>2009</strong> 2008<br />
Interest income on cash and bank 0.5 0.8<br />
Exchange gains and losses, net -3.2 0.1<br />
Financial income total -2.7 1.0<br />
Write-down of non-current investments -0.1<br />
Interest expenses on debt at<br />
amortized cost -9.6 -17.4<br />
Interest cost on financial leasing at<br />
amortized cost -0.8 -0.9<br />
Derivative revaluation gains (losses),<br />
at fair value through profit and loss 0.0 -0.1<br />
Net gain (loss) from sale of investments<br />
at fair value through profit and loss 0.0 -0.3<br />
Fair value of other shares at fair value<br />
through profit and loss 0.0 -0.8<br />
Other financial expenses -1.0 -0.8<br />
Financial expense total -11.5 -20.4<br />
Financial income and expenses total -14.2 -19.4<br />
5.10 Income taxes<br />
M€ <strong>2009</strong> 2008<br />
Current year income taxes -4.4 -4.0<br />
Prior year income taxes -0.4 -1.1<br />
Change in deferred taxes -3.1 2.7<br />
Income taxes total -7.9 -2.3<br />
Reconciliation of income taxes<br />
M€ <strong>2009</strong> 2008<br />
Tax rate for the Parent Company 26% 26%<br />
Profit before taxes 91.4 51.5<br />
Income tax using the domestic<br />
corporation tax rate -23.8 -13.4<br />
Impact of associate 17.3 18.3<br />
Fair value adjustments and other<br />
tax exempt items 0.6 4.5<br />
Non-deductible expenses -2.0 -7.3<br />
Effect of tax rates in foreign jurisdictions -0.8 -0.9<br />
Change in valuation of tax assets 1.4 -3.2<br />
Income tax for prior years -0.4 -1.1<br />
Tax booked against unbooked<br />
tax assets 0.8 1.0<br />
Deferred tax from equity hedge 0.0 0.2<br />
Other items -1.0 -0.6<br />
Income taxes recognized in<br />
profit and loss -7.9 -2.3
62 FISKARS Financial statements <strong>2009</strong><br />
Taxes in other comprehensive income<br />
<strong>2009</strong><br />
M€ Total Tax Net<br />
Translation differences -1.9 -1.9<br />
Change in associate recognized<br />
directly in other comprehensive<br />
income 12.7 12.7<br />
Equity net investment hedges 1.6 -0.3 1.3<br />
Defined benefit plan, actuarial<br />
gains (losses) 1.0 -0.3 0.7<br />
Other comprehensive income for<br />
the period, total 13.4 -0.6 12.8<br />
2008<br />
M€ Total Tax Net<br />
Translation differences -1.9 -1.9<br />
Change in associate recognized<br />
directly in other comprehensive<br />
income -18.1 -18.1<br />
Equity net investment hedges 0.9 -0.2 0.7<br />
Defined benefit plan, actuarial<br />
gains (losses) -0.3 0.1 -0.2<br />
Other changes 0.2 0.2<br />
Other comprehensive income for<br />
the period, total -19.2 -0.1 -19.3<br />
5.11 Earnings per share<br />
The basic earnings per share is the <strong>annual</strong> net profit attributable<br />
to ordinary shareholders of the Parent Company divided by the<br />
weighted average number of shares outstanding during the year.<br />
<strong>Fiskars</strong> <strong>Corporation</strong> does not have any current share option programs<br />
or other diluting financial instruments, so the diluted earnings<br />
per share is the same as the undiluted.<br />
<strong>2009</strong> 2008<br />
Net profit attributable to<br />
the ordinary shareholders<br />
of the Parent Company, M€ 83.5 49.3<br />
Number of shares 82,023,341 77,510,200<br />
Weighted average number<br />
of shares outstanding 79,289,391 77,397,665<br />
Earnings per share,<br />
euro (basic) 1.05 0.64<br />
Earnings per share,<br />
euro (diluted) 1.05 0.64<br />
6. Notes to the Balance Sheet, Assets<br />
6.1 Goodwill<br />
M€ <strong>2009</strong> 2008<br />
Historical cost, Jan 1 117.9 117.5<br />
Translation differences -0.6 0.4<br />
Acquisitions and divestments 0.2<br />
Historical cost, Dec 31 117.5 117.9<br />
Accumulated impairment, Jan 1 18.7 17.7<br />
Translation differences -0.6 1.0<br />
Accumulated impairment, Dec 31 18.1 18.7<br />
Net book value, Dec 31 99.4 99.2<br />
Goodwill is not amortized but is tested at least <strong>annual</strong>ly for<br />
impairment.<br />
Goodwill impairment test in cash-generating units<br />
Goodwill allocated to cash-generating units:<br />
M€ <strong>2009</strong> 2008<br />
Home 73.7 73.6<br />
Garden 14.5 14.2<br />
Outdoor 11.3 11.5<br />
Total 99.4 99.2<br />
Goodwill from acquisitions is allocated to Cash Generating Units<br />
(CGU). The classification of the CGUs is changed from 2008 to<br />
meet <strong>Fiskars</strong>’ new <strong>report</strong>ing structure. Under the new <strong>report</strong>ing<br />
structure, the business areas, which form the CGUs, are Home,<br />
Garden, and Outdoor.<br />
The recoverable amounts from CGUs are determined on a discounted<br />
cash flow method basis, derived from five-year cash flow<br />
projections, based on strategic plans approved by management.<br />
Cash flows for the period extending over the planning period are<br />
calculated using the terminal value method. A steady growth rate<br />
of 2.5% (2008: 1.5%) on sales is applied for the terminal value<br />
to all CGUs. The change in the steady growth rate corresponds<br />
the strategic plans approved by the management.The discount<br />
rate is the weighted average post-tax cost of capital (WACC) as<br />
defined by <strong>Fiskars</strong>. The components of the WACC are risk-free<br />
rate, market risk premium, company-specific risk premium, industry<br />
specific equity beta, cost of debt and debt to equity ratio.<br />
The pre-tax WACC used in the calculations was 7.3% (9.8%). The<br />
change in WACC mainly results from the decrease in cost of debt.<br />
On the basis of the impairment calculations made, there has<br />
been no need for impairment of goodwill for any CGU for the periods<br />
ended 31 December <strong>2009</strong> and 2008.<br />
Sensitivity analysis<br />
Sensitivity analyses have been carried out for the valuation of<br />
each CGU by making downside scenarios. These downside scenarios<br />
were created by changing the underlying assumptions in<br />
the valuations such as:<br />
1) Applying EBIT-% that are 1–2% lower<br />
2) Applying 0% steady growth rate in projecting the terminal value<br />
3) Applying a WACC that is 1–2% higher
Consolidated Financial Statements, IFRS<br />
63<br />
In the management’s opinion changes in the basic assumptions<br />
provided in these theoretical downside scenarios shall not<br />
be seen as an indication that these factors are likely to materialize.<br />
Two percentage points increase in WACC would not have<br />
resulted in any goodwill impairment (relative increase in 2008<br />
would have resulted in a goodwill impairment of €12 million).<br />
Two percentage points decrease in EBIT-% would not result in<br />
any goodwill impairment (relative decrease in 2008 would have<br />
resulted in a goodwill impairment of €0.7 million). Also, applying<br />
a steady growth rate of 0% would not result in any impairment in<br />
<strong>2009</strong> nor in 2008.<br />
6.2 Other intangible assets<br />
M€ <strong>2009</strong> 2008<br />
Historical cost, Jan 1 158.1 157.1<br />
Translation differences -0.3 -0.3<br />
Acquisitions and disinvestmnets -0.7<br />
Additions 1.0 1.4<br />
Decreases -1.2 -1.9<br />
Transfers between asset groups 0.3 1.6<br />
Historical cost, Dec 31 157.2 158.1<br />
Accumulated amortization, Jan 1 27.1 23.2<br />
Translation differences -0.1 -0.6<br />
Amortization for the period 6.0 6.0<br />
Decreases -0.7 -1.5<br />
Transfers between asset groups 0.0<br />
Accumulated amortization, Dec 31 32.3 27.1<br />
Net book value, Dec 31 124.9 131.0<br />
6.3 Property, plant & equipment<br />
M€ <strong>2009</strong> 2008<br />
Trademarks included in intangible assets 106.1 107.7<br />
Trademarks are not amortized but are tested at least <strong>annual</strong>ly<br />
for impairment using a relief from royalty method. Cash flows<br />
attributable to trademarks are derived by indentifying revenues<br />
from sales of products belonging to each trademark. The carrying<br />
amounts of trademarks are determined on a discounted cash<br />
flow method basis, derived from eight-year cash flow projections,<br />
based on strategic plans approved by the management. Cash<br />
flows for the period extending over the planning period are calculated<br />
using the terminal value method. The discount rate is the<br />
weighted average post-tax cost of capital (WACC) as defined by<br />
<strong>Fiskars</strong> added with one percentage point risk premium. The pretax<br />
WACC used in the calculations was 8.3% (10.8%). A steady<br />
growth rate of 3% (2%) on sales is applied for the terminal value<br />
to all trademarks. The change in the steady growth rate corresponds<br />
the strategic plans approved by the management. On<br />
the basis of the impairment calculations made, there has been<br />
no need for impairment of trademarks for the periods ended 31<br />
December <strong>2009</strong> and 2008.<br />
Sensitivity analysis<br />
Sensitivity analyses have been carried out for the valuation of<br />
each trademark by making downside scenarios. These downside<br />
scenarios were created by changing the underlying assumptions<br />
in the valuations such as:<br />
• Applying a steady growth rate of 0% in projecting the terminal<br />
value<br />
• Applying a discount rate that is 1–2% higher<br />
In the management's opinion changes in the basic assumptions<br />
provided in these theoretical downside scenarios shall not be<br />
seen as an indication that these factors are likely to materialize.<br />
Applying of 0% steady growth rate would not result to any impairment<br />
in <strong>2009</strong> or 2008. Also, two percentage points increase in<br />
discount rate would not result to any trademark impairment either<br />
in <strong>2009</strong> or 2008.<br />
<strong>2009</strong><br />
Land<br />
Machinery<br />
M€<br />
and<br />
water Buildings<br />
Leased<br />
real estate<br />
and<br />
equipment<br />
Construction<br />
in progress<br />
Total<br />
Historical cost, Jan 1 16.4 53.9 12.8 191.9 5.5 280.5<br />
Translation differences 0.0 0.0 -0.4 -0.4 0.0 -0.7<br />
Acquisitions and divestments -0.2 -0.5 -0.8 -0.1 -1.6<br />
Additions 0.2 0.5 5.1 7.4 13.2<br />
Decreases -0.2 -0.6 0.0 -11.6 -0.1 -12.4<br />
Transfers between asset groups 0.0 -2.0 0.7 5.0 -10.2 -6.5<br />
Historical cost, Dec 31 16.3 51.3 13.1 189.2 2.5 272.4<br />
Accumulated depreciation, Jan 1 26.9 7.8 132.7 167.3<br />
Translation differences -0.1 -0.3 -0.5 -0.8<br />
Depreciation for the period 2.1 1.6 18.3 22.0<br />
Decreases -0.4 0.0 -10.1 -10.5<br />
Transfers between asset groups -3.6 1.1 -2.7 -5.1<br />
Accumulated depreciation, Dec 31 24.9 10.3 137.7 172.9<br />
Net book value, Dec 31 16.3 26.4 2.8 51.5 2.5 99.5
64 FISKARS Financial statements <strong>2009</strong><br />
2008<br />
Land<br />
Machinery<br />
M€<br />
and<br />
water Buildings<br />
Leased<br />
real estate<br />
and<br />
equipment<br />
Construction<br />
in progress<br />
Total<br />
Historical cost, Jan 1 16.0 56.2 15.0 180.8 6.7 274.6<br />
Translation differences 0.0 -2.5 0.9 -2.6 -0.2 -4.5<br />
Additions 0.6 0.4 9.0 13.8 23.8<br />
Decreases -0.1 -1.3 -6.7 -0.4 -8.6<br />
Transfers between asset groups 1.1 -3.0 11.6 -14.4 -4.7<br />
Historical cost, Dec 31 16.4 53.9 12.8 191.9 5.5 280.5<br />
Accumulated depreciation, Jan 1 26.4 6.3 120.0 152.8<br />
Translation differences -1.9 0.4 -1.7 -3.2<br />
Depreciation for the period 2.4 1.1 19.1 22.5<br />
Decreases 0.0 -4.7 -4.8<br />
Transfers between asset groups 0.0 -0.1 -0.1<br />
Accumulated depreciation, Dec 31 26.9 7.8 132.7 167.3<br />
Net book value, Dec 31 16.4 27.0 5.1 59.3 5.5 113.2<br />
6.4 Biological assets<br />
M€ <strong>2009</strong> 2008<br />
Fair value, Jan 1 39.3 44.9<br />
Increase due to growth 1.5 1.7<br />
Change in fair value less estimated<br />
point-of-sale costs -0.5 -5.8<br />
Harvested timber -1.4 -1.5<br />
Fair value, Dec 31 38.9 39.3<br />
<strong>Fiskars</strong> has some 15,000 hectares of real estate and forests in<br />
Finland, including the key landholding at <strong>Fiskars</strong> Village. The accounting<br />
estimate used for valuing biological assets (standing<br />
timber) was changed in 2008. The new estimate uses a threeyear<br />
rolling average price of standing timber.<br />
6.5 Investment property<br />
M€ <strong>2009</strong> 2008<br />
Historical cost, Jan 1 19.7 16.2<br />
Translation differences -0.3 0.4<br />
Additions 0.3 0.2<br />
Decreases -1.1 -0.1<br />
Transfers between asset groups 1.9 3.0<br />
Historical cost, Dec 31 20.4 19.7<br />
Accumulated depreciation, Jan 1 12.0 7.8<br />
Translation differences -0.3 0.2<br />
Depreciation and impairment<br />
for the period 0.0 4.0<br />
Decreases 0.1 -0.1<br />
Transfers between asset groups 0.1 0.0<br />
Accumulated depreciation and<br />
impairment, Dec 31 11.9 12.0<br />
Net book value, Dec 31 8.5 7.7
Consolidated Financial Statements, IFRS<br />
65<br />
Fair value<br />
Investment Property comprises the Parent company properties<br />
in <strong>Fiskars</strong> Village, Finland, and the leasing properties of <strong>Fiskars</strong><br />
Brands, Inc in the US that are not in Group´s operational use.<br />
Properties in <strong>Fiskars</strong> Village are unique in their cultural and historical<br />
values. Therefore it is not possible to determine a comparable<br />
market value on the properties.<br />
M€ <strong>2009</strong> 2008<br />
Finland 6.1 6.1<br />
USA 2.4 1.6<br />
Total 8.5 7.7<br />
6.6 Investments in associates<br />
M€ <strong>2009</strong> 2008<br />
Net book value, Jan 1 263.5 278.3<br />
Share of profit 66.5 70.5<br />
Dividends received -25.3 -67.2<br />
Share of other comprehensive income 12.7 -18.1<br />
Other changes -0.7 0.0<br />
Net book value, Dec 31 316.8 263.5<br />
Goodwill included in the net book value 61.2 61.2<br />
Share of profit comprises the share of net profit in associate reduced<br />
with the €25.3 million (67.2) dividends received. Share of<br />
other comprehensive income comprises changes in associated<br />
company's equity. The market value of Wärtsilä shares owned<br />
by <strong>Fiskars</strong> as at December 31, <strong>2009</strong> amounted to €472.9 million<br />
(353.9).<br />
Summary of financial information on associates<br />
Wärtsilä <strong>Corporation</strong><br />
<strong>2009</strong> 2008<br />
Ownership-% 17.1 17.1<br />
Assets, M€ 4,655 4,743<br />
Liabilities, M€ 3,143 3,544<br />
Equity, M€ 1,512 1,199<br />
Net sales, M€ 5,260 4,612<br />
Net profit, M€ 396 389<br />
6.7 Shares at fair value through profit and loss<br />
M€ <strong>2009</strong> 2008<br />
Historical cost, Jan 1 2.9 3.0<br />
Additions 1.3<br />
Decreases -0.5<br />
Change in fair value through<br />
profit and loss 0.0 -0.8<br />
Book value, Dec 31 3.0 2.9<br />
The shares comprise listed shares and unlisted shares. Listed<br />
shares have been recognized at their fair value based on quotation<br />
at the end of the <strong>report</strong>ing period and changes in the fair<br />
value are booked in the income statement. Unlisted shares are<br />
measured at cost since their fair value cannot be determined reliably.<br />
6.8 Other investments<br />
M€ <strong>2009</strong> 2008<br />
Historical cost, Jan 1 2.2 2.3<br />
Translation differences 0.0 -0.1<br />
Additions 0.5 0.2<br />
Decreases -0.5 -0.1<br />
Other changes -0.1 -0.2<br />
Book value, Dec 31 2.1 2.2<br />
Other investments comprise non-current receivables and they<br />
are measured at the lower of cost and fair value.<br />
6.9 Inventories<br />
M€ <strong>2009</strong> 2008<br />
Raw materials and consumables 18.5 28.8<br />
Work in progress 12.3 17.6<br />
Finished goods 87.5 112.6<br />
Advance payments 0.7 0.8<br />
Total, Dec 31 119.0 159.8<br />
Write-down to the carrying value<br />
of inventories to reflect the net<br />
realizable value -16.2 -25.3<br />
<strong>Fiskars</strong>' share in the votes of the associate was 17.1% (17.1%).
66 FISKARS Financial statements <strong>2009</strong><br />
6.10 Trade and other receivables<br />
M€ <strong>2009</strong> 2008<br />
Trade receivables 89.2 90.7<br />
Advances paid 0.1 0.2<br />
Derivatives 0.4 3.6<br />
Other receivables 5.2 6.1<br />
Prepaid expenses and accrued income 6.9 9.1<br />
Total, Dec 31 101.9 109.6<br />
Trade receivables, aging classification<br />
M€ <strong>2009</strong> 2008<br />
Aging class, not fallen due 76.3 72.2<br />
Aging class, 0–30 days overdue 10.5 12.4<br />
Aging class, 31–60 days overdue 2.2 2.8<br />
Aging class, 61–90 days overdue 0.6 1.7<br />
Aging class, 91–120 days overdue 0.3 0.7<br />
Aging class, over 120 days overdue 2.6 3.7<br />
Less provision for bad debts, Dec 31 -3.2 -2.9<br />
Total, Dec 31 89.2 90.7<br />
Trade receivables in currencies<br />
M€ <strong>2009</strong> 2008<br />
Danish Krones (DKK) 7.6 7.2<br />
Euros (EUR) 32.4 33.8<br />
Norwegian Krones (NOK) 6.0 3.7<br />
Swedish Kronas (SEK) 6.7 8.0<br />
Great Britain Pounds (GBP) 5.8 8.0<br />
US Dollars (USD) 23.2 23.6<br />
Other currencies 7.6 6.3<br />
Total, Dec 31 89.2 90.7<br />
Trade receivables are widely spread geographically. The biggest<br />
customers are major retailers with solid credit ratings. Credit loss<br />
risks are estimated to be moderate. The maximum exposure to<br />
credit risk is the carrying amount of the trade receivables.<br />
6.11 Cash and cash equivalents<br />
M€ <strong>2009</strong> 2008<br />
Cash at bank 38.6 9.4<br />
Money market investments 1.9<br />
Other current investments 0.0 0.0<br />
Total, Dec 31 38.6 11.3<br />
7. Deferred tax assets and liabilities<br />
<strong>2009</strong><br />
Deferred tax assets<br />
M€ Jan 1, <strong>2009</strong><br />
Recognized<br />
in income<br />
statement<br />
Recognized<br />
in other<br />
comprehensive<br />
income<br />
Translation<br />
difference Dec 31, <strong>2009</strong><br />
Retirement benefit 0.7 1.4 -0.3 0.1 1.9<br />
Provisions 12.7 -3.1 0.4 10.1<br />
Effects on consolidation and eliminations 3.0 -1.1 1.9<br />
Property, plant & equipment 3.6 -2.9 0.7<br />
Tax losses and tax credits carried forward 19.3 0.7 0.7 20.7<br />
Valuation allowance of deferred tax assets -19.3 -1.6 -0.1 -21.1<br />
Other temporary differences 5.9 -1.6 -0.3 0.0 4.0<br />
Total deferred tax assets 25.9 -8.2 -0.6 1.1 18.3<br />
Offset against deferred tax liabilities -4.3 3.8 -0.5<br />
Net deferred tax assets 21.7 -4.4 -0.6 1.1 17.8
Consolidated Financial Statements, IFRS<br />
67<br />
Deferred tax liability<br />
M€ Jan 1, <strong>2009</strong><br />
Recognized<br />
in income<br />
statement<br />
Recognized<br />
in other<br />
comprehensive<br />
income<br />
Translation<br />
difference Dec 31, <strong>2009</strong><br />
Property, plant & equipment 8.5 -4.1 -0.3 4.2<br />
Fair value adjustments 11.8 0.4 -0.4 11.8<br />
Effects on consolidation and eliminations * ) 32.1 -0.8 0.0 31.3<br />
Other temporary differences 1.1 -0.6 -0.1 0.3<br />
Total deferred tax liabilities 53.5 -5.1 0.0 -0.8 47.6<br />
Offset against deferred tax assets -4.3 3.8 -0.5<br />
Net deferred tax liabilities 49.3 -1.3 0.0 -0.8 47.2<br />
Deferred tax assets (+) / liabilities (–), net -27.6 -29.4<br />
* ) Consist mainly of adjustments to fair value in acquisitions.<br />
2008<br />
Deferred tax assets<br />
M€ Jan 1, 2008<br />
Recognized<br />
in income<br />
statement<br />
Recognized<br />
in other<br />
comprehensive<br />
income<br />
Translation<br />
difference Dec 31, 2008<br />
Retirement benefit 2.2 -1.7 0.2 0.0 0.7<br />
Provisions 1.7 11.0 12.7<br />
Effects on consolidation and eliminations 3.7 -0.8 0.1 3.0<br />
Property, plant & equipment 9.3 -5.6 0.0 3.6<br />
Tax losses and tax credits carried forward 25.1 -5.6 -0.2 19.3<br />
Valuation allowance of deferred tax assets -24.6 5.6 -0.3 -19.3<br />
Other temporary differences 3.0 2.2 0.8 5.9<br />
Total deferred tax assets 20.3 5.0 0.2 0.4 25.9<br />
Offset against deferred tax liabilities -4.3 -4.3<br />
Net deferred tax assets 20.3 0.7 0.2 0.4 21.7<br />
Deferred tax liability<br />
M€ Jan 1, 2008<br />
Recognized<br />
in income<br />
statement<br />
Recognized<br />
in other<br />
comprehensive<br />
income<br />
Translation<br />
difference Dec 31, 2008<br />
Property, plant & equipment 4.7 3.2 0.5 0.1 8.5<br />
Fair value adjustments 13.8 -2.0 11.8<br />
Effects on consolidation and eliminations 33.0 -0.8 0.0 32.1<br />
Other temporary differences 0.4 0.6 0.0 0.0 1.1<br />
Total deferred tax liabilities 51.8 1.1 0.5 0.1 53.5<br />
Offset against deferred tax assets -4.3 -4.3<br />
Net deferred tax liabilities 51.8 -3.2 0.5 0.1 49.3<br />
Deferred tax assets (+) / liabilities (–), net -30.7 -27.6<br />
Deferred tax assets and liabilities are offset when there is a legally enforceable right to offset current tax assets against current tax liabilities<br />
and when the deferred taxes relate to the same fiscal authority. The Group has full control of dividend distribution and therefore<br />
no deferred tax liability has been recorded. Associate Wärtsilä is a public company and its distribution of profit is tax exempt for<br />
<strong>Fiskars</strong>. Taxes relating to equity net investment hedge and actuarial gains and losses have been recorded into other comprehensive<br />
income. The deferred tax on tax losses carried forward amounted to €20.7 million (€19.3 million) at the end of financial year. Deferred<br />
tax allowance is recorded to offset deferred tax assets in order to recognize the deferred tax assets only to the extent that it is probable<br />
that future taxable profits will be available. The tax losses carried forward, net of allowance will not expire in the following five years. Income<br />
taxes recorded in the income statement and in other comprehensive income are specified in Note 5.10.
68 FISKARS Financial statements <strong>2009</strong><br />
8. NOTES TO THE BALANCE SHEET, EQUITY AND LIABILITIES<br />
8.1 Share capital<br />
<strong>2009</strong><br />
pcs 1,000<br />
2008<br />
pcs 1,000<br />
A Shares<br />
Jan 1 54,944 54,944 54.9 54.9<br />
Change * ) -54,944 -54.9<br />
Dec 31 0 54,944 0.0 54.9<br />
K Shares<br />
Jan 1 22,566 22,566 22.6 22.6<br />
Change * ) -22,566 -22.6<br />
Dec 31 0 22,566 0.0 22.6<br />
<strong>2009</strong><br />
M€<br />
2008<br />
M€<br />
New shares<br />
Jan 1<br />
Change * ) 82,023 77.5<br />
Dec 31 82,023 0 77.5 0.0<br />
Share capital, Dec 31 82,023 77,510 77.5 77.5<br />
Treasury shares<br />
<strong>2009</strong><br />
pcs 1,000<br />
2008<br />
pcs 1,000<br />
A Shares<br />
Jan 1 112.1 127.5 -0.8 -0.9<br />
Change * ) -112.1 -15.4 0.8 0.1<br />
Dec 31 0.0 112.1 0.0 -0.8<br />
K Shares<br />
Jan 1 0.4 0.4 0.0 0.0<br />
Dec 31 -0.4 0.0<br />
Dec 31 0.0 0.4 0.0 0.0<br />
New shares<br />
Jan 1<br />
Change * ) 112.6 -0.8<br />
Dec 31 112.6 -0.8<br />
<strong>2009</strong><br />
M€<br />
2008<br />
M€<br />
Treasury shares, Dec 31 112.6 112.5 -0.8 -0.8
Consolidated Financial Statements, IFRS<br />
69<br />
Number of shares, votes and share capital * )<br />
Number of<br />
shares<br />
Dec 31, <strong>2009</strong><br />
Number of<br />
votes<br />
Share capital<br />
€<br />
Number of<br />
shares<br />
Dec 31, 2008<br />
Number of<br />
votes<br />
Share capital<br />
€<br />
A shares (1 vote/share) 54,944,492 54,944,492 54,944,492<br />
K shares (20 votes/share) 22,565,708 451,314,160 22,565,708<br />
New shares (1 vote/share) 82,023,341 82,023,341 77,510,200<br />
Total 82,023,341 82,023,341 77,510,200 77,510,200 506,258,652 77,510,200<br />
* ) <strong>Fiskars</strong> <strong>Corporation</strong> has one series of shares following the combination of the company´s series A and K shares based on the decision<br />
by the Extraordinary General Meeting. Holders of series K shares received one share free for each five series K shares. The new<br />
single class shares (FIS1V) became subject to public trading as of July 31, <strong>2009</strong>. All shares carry one vote each and equal rights.<br />
8.2 Provisions<br />
Onerous<br />
<strong>2009</strong><br />
contracts<br />
M€<br />
Warranty<br />
provision<br />
Restructuring<br />
provision<br />
and other<br />
provisions<br />
Total<br />
Provisions, Jan 1 1.7 8.8 2.9 13.4<br />
Translation differences -0.4 -0.1 -1.2 -1.7<br />
Additions 0.4 0.6 1.0 2.0<br />
Used provisions -4.6 -4.6<br />
Reversals -0.2 0.2 -0.1<br />
Provisions, Dec 31 1.7 4.6 2.8 9.1<br />
Onerous<br />
2008<br />
contracts<br />
M€<br />
Warranty<br />
provision<br />
Restructuring<br />
provision<br />
and other<br />
provisions<br />
Total<br />
Provisions, Jan 1 1.3 2.5 2.3 6.2<br />
Translation differences 0.0 -0.3 0.0 -0.3<br />
Additions 0.4 10.3 0.7 11.4<br />
Used provisions -3.3 -3.3<br />
Change in estimates 0.0 -0.1 -0.1<br />
Reversals -0.5 -0.1 -0.5<br />
Provisions, Dec 31 1.7 8.8 2.9 13.4<br />
8.3 Trade and other payables<br />
M€ <strong>2009</strong> 2008<br />
Trade payables 38.7 42.6<br />
Advances received 0.4 0.3<br />
Other debt 8.5 7.9<br />
Accrued expenses and deferred income<br />
Interest payable 2.5 7.3<br />
Wages, salaries and social costs 31.6 30.8<br />
Customer rebates and commissions 15.3 13.2<br />
Other 24.4 19.7<br />
Total, Dec 31 121.3 121.9<br />
Other accrued expenses and deferred income comprise periodization of bought materials and supplies, <strong>annual</strong> rebates for clients and<br />
other accrued items.
70 FISKARS Financial statements <strong>2009</strong><br />
8.4 Employee benefit obligations<br />
Most of the <strong>Fiskars</strong> Group’s pension plans are defined contribution plans. The defined benefit plans in the US, Great Britain and<br />
Germany are closed plans, and future pay increases will not impact the valuation. The defined benefit plans in Norway and Holland are<br />
not closed. The Group also has supplementary pension plans in Finland which are classified as defined benefit plans. Authorized actuaries<br />
have performed the actuarial calculations for the defined benefit plans. The Group is responsible for some post-employment benefits<br />
in Italy, but the liabilities recorded are final and as such they are classified as defined contribution plans.<br />
M€ <strong>2009</strong> 2008<br />
Liabilities for post-employment benefits 2.3 2.3<br />
Defined benefit pension liabilities 7.1 6.9<br />
Pension liability total 9.4 9.2<br />
Amounts as of December 31:<br />
M€ <strong>2009</strong> 2008 2007 2006 2005<br />
Defined Benefit Obligation 27.1 23.9 32.4 27.6 28.1<br />
Plan assets 20.0 17.0 25.4 17.1 14.8<br />
Deficit/(Surplus) in the plan 7.1 6.9 7.1 10.5 13.2<br />
Experience adjustments on plan liabilities 0.8 2.3 0.4 0.3 0.0<br />
Experience adjustments on plan assets 1.5 -4.9 -0.3 -0.2 -0.7<br />
Amounts recognized in the Balance Sheet<br />
M€ <strong>2009</strong> 2008<br />
Change in defined benefit obligation:<br />
Defined benefit obligation at the<br />
beginning of the year 23.9 32.4<br />
Translation difference 1.8 -4.7<br />
Service cost 0.6 0.8<br />
Interest cost 1.4 1.5<br />
Actuarial (gain) or loss 2.9 -4.8<br />
Settlements -2.0<br />
Benefits paid -1.4 -1.3<br />
Defined benefit obligation, Dec 31 27.1 23.9<br />
Changes in plan assets:<br />
Fair value of plan assets at the<br />
beginning of the year 17.0 25.4<br />
Translation difference 1.6 -4.8<br />
Expected return on plan assets 1.1 1.2<br />
Actuarial gain or (loss) 1.7 -5.2<br />
Benefits paid -1.3 -1.3<br />
Employer contributions 1.0 1.7<br />
Settlements -1.2<br />
Fair value of plan assets, Dec 31 20.0 17.0<br />
Amounts recognized in the Income Statement<br />
M€ <strong>2009</strong> 2008<br />
Current service cost 0.6 0.8<br />
Interest cost 1.4 1.5<br />
Effect of settlement and curtailments -0.7<br />
Expected return on plan assets -1.1 -1.3<br />
Total 0.1 1.1<br />
Amounts recognized directly in<br />
other comprehensive income<br />
M€ <strong>2009</strong> 2008<br />
Actuarial gain or (loss) 0.7 -0.3<br />
Deferred tax -0.2 0.1<br />
Total 0.5 -0.2<br />
Actual gain for defined benefit<br />
plan funds 2.9 -4.1<br />
Plans in US and Germany are non-funded. Plans in Finland, Norway<br />
and the Netherlands are taken care of by local pension insurance<br />
companies. The plans in Great Britain are funded by investments<br />
in equities and bonds totaling €12.7 million of which<br />
€ 6.8 million are investments in equities. The Group estimates its<br />
contributions to the plans during 2010 to be €1.5 million.<br />
Net defined pension benefit<br />
liability at Dec 31 7.1 6.9
Consolidated Financial Statements, IFRS<br />
71<br />
Plan assets by asset group<br />
% <strong>2009</strong> 2008<br />
Equity securities 37 34<br />
Debt securities 4 3<br />
Real Estate 8 7<br />
Bonds 40 40<br />
Other 11 16<br />
Principal actuarial assumptions at the balance-sheet date<br />
Discount rate<br />
% <strong>2009</strong> 2008<br />
Great Britain 5.30–5.60 6.5–6.65<br />
Germany 5.3 6.5<br />
Finland 5.3 6.5<br />
United States 5.4 6.0<br />
Expected return on plan assets<br />
% <strong>2009</strong> 2008<br />
Great Britain 3.10–5.90 3.9–7.2<br />
Germany n/a n/a<br />
Finland 5.25 5.57<br />
United States n/a n/a<br />
Future salary increases<br />
% <strong>2009</strong> 2008<br />
Great Britain 4.5 n/a<br />
Germany n/a n/a<br />
Finland 1.85 2.5<br />
United States n/a n/a<br />
Future pension increases<br />
% <strong>2009</strong> 2008<br />
Great Britain 3.0–3.6 3.0–3.3<br />
Germany 1.5 1.0<br />
Finland n/a n/a<br />
United States 0.0 0.0
72 FISKARS Financial statements <strong>2009</strong><br />
9. Finance<br />
9.1 Maturity of liabilities<br />
As of December 31, <strong>2009</strong> the Group has unused credit facilities €425 million (405) at its disposal to guarantee its liquidity.<br />
The average maturity of the credit limit agreements as of December 31, <strong>2009</strong> was 4.4 years (5.4 years).<br />
<strong>2009</strong><br />
M€ 2010 2011 2012 2013 2014<br />
Later<br />
years Total<br />
Bank overdrafts 1.5 1.5<br />
Commercial papers 136.4 136.4<br />
interests 0.6 0.6<br />
Other debt 0.2 0.0 0.1 0.3<br />
Capital loan 45.1 45.1<br />
interests 2.8 2.8<br />
Loans from credit institutions 15.0 0.1 10.4 52.6 78.1<br />
interests 1.2 0.9 0.9 0.9 0.9 1.8 6.6<br />
Financial leasing 1.5 2.5 1.4 1.5 1.6 4.7 13.1<br />
interests 0.7 0.6 0.5 0.4 0.3 1.1 3.6<br />
Trade payables 116.4 116.4<br />
Derivative liabilities 0.1 0.1<br />
Total, Dec 31 321.4 4.0 2.8 2.8 13.2 60.4 404.6<br />
79.4% 1.0% 0.7% 0.7% 3.3% 14.9% 100.0%<br />
2008<br />
M€ <strong>2009</strong> 2010 2011 2012 2013<br />
Later<br />
years Total<br />
Bank overdrafts 6.9 6.9<br />
Commercial papers 123.2 123.2<br />
interests 2.8 2.8<br />
Other debt 5.7 5.7<br />
Capital loan 45.1 45.1<br />
interests 2.8 2.8 5.6<br />
Loans from credit institutions 45.8 15.1 0.1 63.3 124.3<br />
interests 5.0 3.8 3.2 3.2 3.2 10.1 28.6<br />
Financial leasing 2.4 2.4 2.5 1.5 1.6 5.6 16.0<br />
interests 0.9 0.7 0.6 0.5 0.4 1.5 4.6<br />
Trade payables 112.0 112.0<br />
Derivative liabilities 0.3 0.3<br />
Total, Dec 31 307.8 70.0 6.4 5.2 5.2 80.5 475.1<br />
64.8% 14.7% 1.4% 1.1% 1.1% 16.9% 100.0%
Consolidated Financial Statements, IFRS<br />
73<br />
9.2 Non-current interest bearing debt<br />
M€<br />
<strong>2009</strong><br />
Fair<br />
value<br />
Carrying<br />
amount<br />
2008<br />
Fair<br />
value<br />
Carrying<br />
amount<br />
Capital loan * ) 45.5 45.1<br />
Loans from credit institutions 63.1 63.1 78.6 78.6<br />
Financial leasing debt 13.0 11.6 14.9 13.6<br />
Other non-current debt 0.1 0.1 0.1 0.1<br />
Total, Dec 31 76.2 74.9 139.1 137.5<br />
All interest-bearing debts are valued at periodized acquisition cost. The fair values of interest-bearing debts have been calculated by<br />
discounting the cash flow of the debt by the market rate at the end of <strong>report</strong>ing period.<br />
* ) The capital loan is moved to current interest bearing debt due to full repayment within one year.<br />
Finance lease debt<br />
M€ <strong>2009</strong> 2008<br />
Finance lease liabilities are payable as follows:<br />
Less than one year 3.1 3.3<br />
Between one and five years 8.7 10.2<br />
More than five years 4.9 7.0<br />
Minimum lease payments in total 16.7 20.5<br />
Minimum lease payments, principal<br />
M€ <strong>2009</strong> 2008<br />
Less than one year 1.5 2.4<br />
Between one and five years 7.0 8.0<br />
More than five years 4.7 5.6<br />
Present value of minimum finance lease payments 13.1 16.0<br />
Future finance charges 3.6 4.5<br />
9.3 Current interest bearing debt<br />
M€<br />
<strong>2009</strong><br />
Fair<br />
value<br />
Carrying<br />
amount<br />
2008<br />
Fair<br />
value<br />
Carrying<br />
amount<br />
Bank overdrafts 1.5 1.5 6.9 6.9<br />
Loans from credit institutions 15.0 15.0 47.9 47.9<br />
Commercial papers 136.4 136.4 123.1 123.1<br />
Capital loan * ) 45.6 45.1 0.0 0.0<br />
Financial leasing debt 1.5 1.5 2.4 2.4<br />
Other 0.2 0.2 3.3 3.3<br />
Total, Dec 31 200.2 199.7 183.7 183.7<br />
* ) Main characteristics of the loan: The principal, interest and any other yield will be payable on the dissolution or bankruptcy of the<br />
company solely at a priority ranking inferior to that of all other debt. The principal can be repaid if and only to the extent the company<br />
will retain full cover for its restricted equity and non-distributable funds in accordance with the balance sheet and consolidated<br />
balance sheet approved for the latest financial year. Interest can be paid if and only to the extent the equivalent sum is available for<br />
dividend distribution in accordance with the balance sheet and consolidated balance sheet approved for the latest financial year.<br />
The loan will be repaid in full on June 17, 2010 and the interest rate on the loan is fixed 6.25%.The fair value has been calculated<br />
using an estimated 3.9% interest rate. The loan is listed on NASDAQ OMX Helsinki but the trading volume is very low.
74 FISKARS Financial statements <strong>2009</strong><br />
9.4 Currency exposure, average interest rates and sensitivity analysis<br />
The exchange rate sensitivity analysis in accordance with IFRS 7 has been carried out by examining the group's operational position<br />
and the parent company's exposure to the risks in four major currencies representing 70% of the Group's exposure. The operational<br />
currency position consists of the estimated net cash flows of sales and purchases during the next year. Business units hedge these<br />
cash flows with currency forwards with the parent company. The exchange rate sensitivity of the operations below illustrates a 10%<br />
exchange rate change impact on profit before taxes if the cash flows had not been hedged.<br />
The Parent Company's currency exposure includes internal and external financial items. The exchange rate sensitivity illustrates a<br />
10% exchange rate change impact on profit before taxes.<br />
<strong>2009</strong><br />
M€ USD GBP SEK CAD<br />
Operational currency position -19.8 10.1 15.0 8.1<br />
Exchange rate sensitivity of the operations 2.0 1.0 1.5 0.8<br />
Parent Company:<br />
External loans and deposits -4.9 1.6 0.8 -1.7<br />
External currency derivatives 85.4 -16.3 -14.9 -6.9<br />
Internal loans and deposits -60.6 5.1 -0.8 0.3<br />
Internal currency derivatives -19.8 10.1 15.0 8.1<br />
Currency exposure 0.0 0.4 0.1 -0.2<br />
Exchange rate sensitivity 0.0 0.0 0.0 0.0<br />
2008<br />
M€ USD GBP SEK CAD<br />
Operational currency position -24.9 11.6 23.0 9.6<br />
Exchange rate sensitivity of the operations 2.5 1.2 2.3 1.0<br />
Parent Company:<br />
External loans and deposits -40.8 0.0 -1.0 0.8<br />
External currency derivatives 50.3 -19.9 -33.3 -10.0<br />
Internal loans and deposits -29.5 9.8 0.0 -0.1<br />
Internal currency derivatives -24.9 11.6 23.0 9.6<br />
Hedged net investments in foreign operations 43.1 0.0 10.1 0.0<br />
Currency exposure -1.9 1.5 -1.2 0.3<br />
Exchange rate sensitivity 0.2 0.1 0.1 0.0<br />
The interest rate sensitivity illustrates the impact on next year's profit of a permanent 1 percentage point change in interest rates.<br />
The <strong>Corporation</strong>'s net interest bearing debt as of December 31, <strong>2009</strong> was €235.7 million and the average interest reset period was 5<br />
months. A permanent 1 percentage point increase on all interest rates would increase the corporation's interest costs by €2.0 million in<br />
2010.
Consolidated Financial Statements, IFRS<br />
75<br />
The table below shows the corporation's net interest bearing debt, average interest rates and interest rate sensitivity by major currencies.<br />
<strong>2009</strong><br />
M€ EUR USD GBP SEK Other Total<br />
External loans and deposits 222.7 16.4 -1.0 -3.3 0.9 235.7<br />
Currency derivatives 0.0 0.0 0.0 0.0 0.0 0.0<br />
Net debt 222.7 16.4 -1.0 -3.3 0.9 235.7<br />
Average interest rate (p.a.) 2.2% 3.8% 0.8% 0.4% 2.7% 2.3%<br />
Interest rate sensitivity 1.9 0.1 0.0 0.0 0.0 2.0<br />
2008<br />
M€ EUR USD GBP SEK Other Total<br />
External loans and deposits 256.1 54.9 -0.1 2.0 -1.5 311.4<br />
Currency derivatives -49.0 -50.3 19.9 33.3 44.6 -1.5<br />
Net debt 207.1 4.6 19.9 35.3 43.1 309.9<br />
Average interest rate (p.a.) 5.6% 2.8% 2.6% 2.1% 5.0% 5.0%<br />
Interest rate sensitivity 1.1 0.2 0.2 0.3 0.4 2.3<br />
9.5 Lease obligations<br />
M€ <strong>2009</strong> 2008<br />
Operating leases, payments next year 15.7 14.6<br />
Operating leases, payments later 44.6 49.8<br />
Total operating leases, Dec 31 60.3 64.5<br />
The present value of financial lease agreements has been recorded under liabilities in the balance sheet.<br />
9.6 Contingencies and pledged assets<br />
M€ <strong>2009</strong> 2008<br />
Guarantees as security for own commitments 0.2 1.2<br />
Guarantees as security for subsidiaries' commitments 9.4 16.0<br />
Real estate mortgages as security for third-party commitments 2.0 1.9<br />
Lease commitments 60.3 64.5<br />
Pledged assets 1.7 1.8<br />
Other contingencies 4.4 4.8<br />
Total pledged assets and contingencies, Dec 31 78.0 90.4<br />
9.7 Nominal amounts of derivatives<br />
M€ <strong>2009</strong> 2008<br />
Forward exchange contracts 150.9 171.1<br />
Electricity forward agreements 1.8 1.6<br />
Interest rate swaps 1.1 16.1
76 FISKARS Financial statements <strong>2009</strong><br />
Fair value vs. nominal amounts of derivatives<br />
M€ <strong>2009</strong> 2008<br />
Forward exchange contracts 0.4 1.6<br />
Electricity forward agreements 0.0 -0.3<br />
Interest rate swaps -0.1 0.0<br />
(+ calculatory gain, – calculatory loss)<br />
9.8 Fair value measurement of financial instruments<br />
The fair value measurement hierarchy has three levels. Level 1: Quoted prices for similar instruments; Level 2: Observable market<br />
inputs other than Level 1 inputs; Level 3: Inputs not based on observable market data. The basis of input for measurement is as<br />
follows:<br />
• Derivatives: level 2<br />
• Shares at fair value through profit and loss: listed shares level 1, unlisted shares level 2<br />
• Other investments: level 2.<br />
9.9 Maturity of derivatives<br />
<strong>2009</strong><br />
M€ 2010 2011<br />
Later<br />
years<br />
Total<br />
Forward exchange contracts 150.9 150.9<br />
Electricity forward agreements 0.8 0.8 0.3 1.8<br />
Interest rate swaps 0.0 1.1 0.0 1.1<br />
Total, Dec 31 151.7 1.9 0.3 153.9<br />
2008<br />
M€ <strong>2009</strong> 2010<br />
Later<br />
years<br />
Total<br />
Forward exchange contracts 171.1 171.1<br />
Electricity forward agreements 0.6 0.6 0.3 1.6<br />
Interest rate swaps 15.0 1.1 16.1<br />
Forward interest rate agreements 0.0<br />
Total, Dec 31 186.7 0.6 1.4 188.8<br />
9.10 Hedging of net investments in foreign subsidiaries<br />
<strong>2009</strong><br />
M€ USD SEK DKK NOK PLN Other Total<br />
Net investment 81.9 13.5 -48.3 4.1 12.1<br />
Hedge<br />
Exchange gain / (loss)<br />
recognized in equity 0.4 0.2 0.0 -0.1 0.7 0.2 1.3<br />
2008<br />
M€ USD SEK DKK NOK PLN Other Total<br />
Net investment 91.2 16.7 -45.3 4.2 10.4<br />
Hedge -43.1 -10.1 48.6 -1.5 -6.0<br />
Exchange gain / (loss)<br />
recognized in equity -2.4 1.5 0.1 0.3 1.2 0.0 0.7
Consolidated Financial Statements, IFRS<br />
77<br />
10. Financial risk management<br />
Financial risks are managed by Corporate Treasury, in accordance<br />
with a set of risk management principles approved by the<br />
Board of Directors.<br />
Currency risk<br />
Currency risk is linked to changes in the value of <strong>Fiskars</strong>’ cash<br />
flows, its balance sheet, and/or its competitiveness resulting from<br />
changes in exchange rates. <strong>Fiskars</strong>’ currency position is split<br />
between its transaction position and translation position, both of<br />
which are managed separately.<br />
Transaction risk results from the possibility that the value of<br />
expected cash flow denominated in a particular currency may<br />
change as a result of changes in exchange rates. Translation risk<br />
refers to the impact that changes in exchange rates can have on<br />
the consolidated balance sheet, and which can affect the value<br />
of balance sheet assets, equity, and debt liabilities. In addition to<br />
balance sheet values, changes in exchange rates can also result<br />
in some circumstances in changes in key indicators, such as the<br />
Group’s equity-to-assets ratio and gearing.<br />
<strong>Fiskars</strong> aims to manage its currency risks primarily through<br />
business means. Production inputs allocated for purchasing,<br />
together with products, are primarily denominated in the local<br />
currencies of the Group’s corporate companies, of which the<br />
euro (41% of consolidated net sales), the US dollar (29%), the<br />
Swedish krona (9%) and the pound sterling (5%) are the most<br />
important.<br />
Higher levels of imports indirectly expose <strong>Fiskars</strong> to risks<br />
linked to changes in the local currencies of its suppliers, of which<br />
the most important is the Chinese Renminbi.<br />
Transaction risk<br />
The objective of <strong>Fiskars</strong>’ approach to managing its transaction<br />
risk is to reduce the impact of changes in exchange rates on the<br />
Group’s budgeted gross profit. Business units are responsible for<br />
managing the currency risks associated with their projected and<br />
agreed commercial cash flows (commercial exposure) during<br />
each budget period. Units primarily hedge their exposure using<br />
currency forwards with Corporate Treasury.<br />
The Group’s net position is based on its commercial exposure,<br />
receivables and liabilities denominated in foreign currencies,<br />
and currency derivatives used for hedging purposes (Note 9.4).<br />
Currency forwards and swaps are the most widely used instruments<br />
in hedging currency risks. Derivatives are used solely for<br />
hedging purposes.<br />
<strong>Fiskars</strong> does not apply hedge accounting as defined under<br />
IAS 39 for transaction risk purposes. All gains and losses made<br />
on currency derivatives are booked in the income statement.<br />
If hedge accounting had been applied to currency derivatives<br />
<strong>Fiskars</strong>’ consolidated profit before tax for <strong>2009</strong> would have been<br />
€4.5 million above the <strong>report</strong>ed figure (2008: €3.7 million below).<br />
Translation risk<br />
The objective of the management of translation risk is to reduce<br />
the impact of changes in exchange rates on the Group’s equity.<br />
<strong>Fiskars</strong> applies hedge accounting in accordance with IAS 39<br />
and IAS 21 in respect of net investments made in certain units<br />
outside Finland (Note 9.9). The exchange gain resulting from<br />
this hedging, booked to equity, totaled €1.3 million (€0.7 million).<br />
On December 31, <strong>2009</strong> <strong>Fiskars</strong> did not have any outstanding<br />
hedges on the net investments.<br />
Interest rate risk<br />
Interest rate risk refers to possible changes in cash flow, assets,<br />
or the value of liabilities resulting from changes in interest rates.<br />
<strong>Fiskars</strong> concentrates on managing the interest rate risks associated<br />
with financial items.<br />
The Group’s interest-bearing net liabilities as of December 31,<br />
<strong>2009</strong> was €235.7 million (€309.9). Of this total, the €45.1 million<br />
capital loan and €13.1 million in financial leases were fixed-rate<br />
instruments, while the others were variable-rate items. The average<br />
interest rate reset period of interest-bearing liabilities was 5<br />
months (10 months).<br />
A change of one percentage point in market interest rates on<br />
the closing date would have an impact of €2.0 million (€1.9) on<br />
the consolidated result before tax in 2010.<br />
Liquidity and re-financing risk<br />
Liquidity risk refers to the possibility of the Group’s financial<br />
assets proving insufficient to cover its business needs or a situation<br />
in which arranging such funding would result in substantial<br />
additional costs.<br />
Re-financing risk refers to the possibility of such a large<br />
amount of liabilities falling due over such a short space of time<br />
that the re-financing needed might be unavailable or prohibitively<br />
expensive.<br />
The Group has extensive unused credit facilities at its disposal<br />
to guarantee its liquidity. As of the end of the year, the aggregate<br />
of unutilized committed revolving credit facilities and overdraft<br />
facilities totaled €448.5 million (€430.3). In addition, the Group’s<br />
parent company in Finland has a commercial paper program with<br />
a number of leading banks amounting to €400.0 million, of which<br />
€136.4 million (€123.2) was utilized as of the end of the year.<br />
The Group’s re-financing risk is managed by maintaining an<br />
appropriate maturity structure in respects of loans and credit<br />
facilities spread over a number of years.<br />
Commodity risk<br />
<strong>Fiskars</strong> may use derivatives to hedge its exposure to commodity<br />
price fluctuations where appropriate. As of the end of the year,<br />
the Group held no commodity derivative contracts other than<br />
electricity futures with a nominal value of €1.8 million (€1.6) recognized<br />
at market value through the Income Statement.<br />
Credit risk<br />
Corporate Treasury is responsible for evaluating and monitoring<br />
financial counterparty risk. The Group minimizes this risk by<br />
limiting its counterparties to a limited number of major banks and<br />
financial institutions and by working within agreed counterparty<br />
limits.<br />
Business units are responsible for monitoring customer credit<br />
risks. The Group’s major customers comprise large international<br />
retailers. As of the end of the year, the Group’s sales receivables<br />
totaled €89.2 million (€90.7), and the financial statements include<br />
provisions for bad debts related to sales receivables totaling €3.2<br />
million (€2.9).
78 FISKARS Financial statements <strong>2009</strong><br />
Management of Capital<br />
<strong>Fiskars</strong> is not subject to any externally imposed capital requirements<br />
(other than eventual local company law requirements<br />
effective in the jurisdictions where <strong>Fiskars</strong> Group Companies are<br />
active).<br />
The Group’s objectives when managing capital are:<br />
• to safeguard the <strong>Corporation</strong>’s ability to continue as a going<br />
concern so that it can continue to provide returns for<br />
shareholders and take care of its obligations towards other<br />
stakeholders<br />
• to provide an adequate return to shareholders by maintaining<br />
a balanced business and investment portfolio that provides<br />
returns both on short and long term<br />
• to maintain possibilities to act on potential investment opportunities<br />
The aim is to maintain the capital structure of the Group strong<br />
enough to ensure Group’s capacity to fund its operations in all<br />
business conditions.<br />
M€ <strong>2009</strong> 2008<br />
Equity 504.8 446.7<br />
Non-current interest bearing debt 74.9 137.5<br />
Current interest bearing debt 199.7 183.7<br />
Non-current investments -0.2<br />
Cash and cash equivalents -38.6 -11.3<br />
Net interest bearing debt 235.7 309.9<br />
<strong>2009</strong> 2008<br />
Equity to Assets 52% 46%<br />
Net gearing 47% 69%<br />
The formulas for calculating the ratios are presented in<br />
calculation of financial indicators on Page 84.<br />
11. Related party transactions<br />
<strong>Fiskars</strong> has no significant transactions, liabilities or receivables with its associated company, Wärtsilä. The dividend from Wärtsilä<br />
€25.3 million (€67.2 million in 2008), has been <strong>report</strong>ed as dividends from associate in the Consolidated Statement of Cash Flows. The<br />
dividend was received in the first quarter of <strong>2009</strong>. <strong>Fiskars</strong> has no significant transactions, liabilities or receivables with its associate<br />
Rörstrands Kulturforum AB. Iittala Group Oy Ab rents real estate from its associate Koy Iittalan Lasimäki and has granted a capital loan<br />
to the company at inception.<br />
<strong>Fiskars</strong> has booked fees for legal services to Foley & Lardner LLP where Ralf Böer, board member of <strong>Fiskars</strong>, is Chairman, CEO and<br />
partner. Ralf Böer did not provide any of the services, and total fees paid to Foley represent less than 0.3% of Foley's revenues.<br />
M€ <strong>2009</strong> 2008<br />
Rent 0.2 0.2<br />
Capital loan 0.2 0.2<br />
Legal service fees 1.4 1.3
Consolidated Financial Statements, IFRS<br />
79<br />
Shareholdings of the key management, Dec 31<br />
Includes holdings of corporations under controlling power together with a family member.<br />
Own<br />
holdings<br />
<strong>2009</strong><br />
Holdings of<br />
controlled<br />
corporations<br />
Total<br />
Own<br />
holdings<br />
2008<br />
Holdings of<br />
controlled<br />
corporations<br />
Bergh Kaj-Gustaf 5,000 5,000 5,000 5,000<br />
Böer Ralf 5,677 5,677 5,677 5,677<br />
Ehrnrooth Alexander 1,833,534 9,213,770 11,047,304 5,930 8,241,476 8,247,406<br />
Ehrnrooth Paul 648,205 8,440,406 9,088,611 30,798 7,879,391 7,910,189<br />
Ervasti-Vaintola Ilona 14,000 14,000 14,000 14,000<br />
Gripenberg Gustaf 243,320 4,056,348 4,299,668 236,600 3,779,524 4,016,124<br />
Grotenfelt Karl 11,680 11,680 11,680 11,680<br />
Kauniskangas Kari * ) 25,397 25,397 23,397 23,397<br />
Slotte Karsten 1,000 1,000 1,000 1,000<br />
Suominen Jukka 1,500 1,500 N/A<br />
Alfthan Max 2,500 2,500 1,400 1,400<br />
Kangas-Kärki Teemu 2,000 2,000<br />
Karlsson Jutta 0 0<br />
Korhonen Hille 3,350 3,350<br />
* ) In accordance with CEO's director's agreement the Company sold 15,397 <strong>Fiskars</strong> A shares to the CEO during Jan 2008.<br />
The Directors and the CEO do not have any debts to the Company; nor has the company given pledges or taken on other responsibilities<br />
in their names.<br />
Total<br />
Fees, wages and salaries paid to the key management<br />
T€ <strong>2009</strong> 2008<br />
Bergh Kaj-Gustaf 91.4 94.2<br />
Böer Ralf 45.5 49.9<br />
Ehrnrooth Alexander 60.5 64.3<br />
Ehrnrooth Paul 61.0 63.8<br />
Ervasti-Vaintola Ilona 46.0 47.1<br />
Gripenberg Gustaf 48.2 49.3<br />
Grotenfelt Karl 44.4 49.3<br />
Kauniskangas Kari 468.7 913.6<br />
Slotte Karsten 46.0 34.5<br />
Suominen Jukka 44.9 36.2<br />
Executive Board excl. President & CEO * ) 764.5<br />
Allonen Heikki 731.5<br />
Drury David 12.1<br />
Lindberg Ingmar 230.1<br />
Thelin Clas 12.6<br />
Total 1,721.1 2,388.5<br />
The key management consists of the Board of Directors, the President & CEO and members of Corporate Management Team<br />
(Executive Board).<br />
* ) Comparison amount of fees, wages and salaries from year 2008 are not presented due to changes in the Executive Board.
80 FISKARS Financial statements <strong>2009</strong><br />
12. Subsidiaries And other participations<br />
Shares in subsidiaries<br />
Domicile<br />
% of<br />
share<br />
capital<br />
% of<br />
voting<br />
power<br />
Nature of<br />
activities<br />
Avlis AB Sollentuna SE 100.0 100.0 H<br />
iittala bvba Antwerpen BE 100.0 100.0 M<br />
iittala GmbH Solingen DE 100.0 100.0 M<br />
iittala a/s Tallinn EE 100.0 100.0 M<br />
Iittala Group Oy Ab Helsinki FI 100.0 100.0 T<br />
ImanCo Oy Helsinki FI 100.0 100.0 H<br />
iittala Ltd. Windsor Berkshire GB 100.0 100.0 M<br />
iittala b.v. Oosterhout NL 100.0 100.0 M<br />
Hackman Polska Sp. Z.o.o. Warsaw PL 100.0 100.0 L<br />
OOO iittala Moscow RU 100.0 100.0 L<br />
iittala ab Höganäs SE 100.0 100.0 M<br />
Nilsjohan AB Höganäs SE 100.0 100.0 L<br />
iittala, Inc. New Jersey US 100.0 100.0 M<br />
Silva Shenzhen Company Shenzhen CN 100.0 100.0 T<br />
Silva Deutschland GmbH Friedrichsdorf DE 100.0 100.0 M<br />
Silva France S.A.R.L. Mantes la Ville FR 100.0 100.0 M<br />
Silva Ltd Livingston GB 100.0 100.0 M<br />
Silva Far East Ltd. Hong Kong HK 100.0 100.0 H<br />
Silva Sweden AB Sollentuna SE 100.0 100.0 T<br />
<strong>Fiskars</strong> Brands, Inc. Madison, Wi. US 100.0 100.0 T<br />
<strong>Fiskars</strong> Brands (Australia) Pty Limited Melbourne AU 100.0 100.0 M<br />
<strong>Fiskars</strong> Brands Canada, Inc. Toronto CA 100.0 100.0 M<br />
<strong>Fiskars</strong> de Mexico, S.A. de C.V. Mexico City MX 100.0 100.0 M<br />
<strong>Fiskars</strong> Servicios, S.A. de C.V. Mexico City MX 100.0 100.0 L<br />
Puntomex Internacional, S.A. de C.V. iL Tijuana MX 100.0 100.0 H<br />
<strong>Fiskars</strong> Brands Global Holdings LLC Madison, Wi. US 100.0 100.0 H<br />
<strong>Fiskars</strong> Brands Europe ApS Silkeborg DK 100.0 100.0 H<br />
Excalibur Management Consulting (Shanghai) Co., Ltd. Shanghai CN 100.0 100.0 H<br />
<strong>Fiskars</strong> Brands Germany GmbH Herford DE 100.0 100.0 T<br />
<strong>Fiskars</strong> Deutschland GmbH iL Herford DE 100.0 100.0 L<br />
<strong>Fiskars</strong> Brands Danmark A/S Silkeborg DK 100.0 100.0 M<br />
<strong>Fiskars</strong> Brands Spain S.L. Madrid ES 100.0 100.0 M<br />
<strong>Fiskars</strong> Brands Fininvest Oy Ab Raasepori FI 100.0 100.0 H<br />
<strong>Fiskars</strong> Brands Finland Oy Ab Raasepori FI 100.0 100.0 T<br />
<strong>Fiskars</strong> Brands France S.A.S Wissous FR 100.0 100.0 M<br />
<strong>Fiskars</strong> Brands UK Limited Bridgend GB 100.0 100.0 T<br />
<strong>Fiskars</strong> Limited Bridgend GB 100.0 100.0 L
Consolidated Financial Statements, IFRS<br />
81<br />
Domicile<br />
% of<br />
share<br />
capital<br />
% of<br />
voting<br />
power<br />
Nature of<br />
activities<br />
Kitchen Devils Limited Bridgend GB 100.0 100.0 L<br />
Richard Sankey & Son Limited Nottingham GB 100.0 100.0 T<br />
Vikingate Limited Nottingham GB 100.0 100.0 L<br />
Consumer Brands (Hong Kong) Co., Limited Hong Kong HK 100.0 100.0 H<br />
<strong>Fiskars</strong> Brands Hungary Ltd. iL Budapest HU 100.0 100.0 M<br />
<strong>Fiskars</strong> Brands Italia S.r.l. Premana IT 100.0 100.0 T<br />
<strong>Fiskars</strong> Brands Holding AS Oslo NO 100.0 100.0 H<br />
<strong>Fiskars</strong> AS, Norge Oslo NO 100.0 100.0 M<br />
<strong>Fiskars</strong> Brands Polska Sp. z o.o. Slupsk PL 100.0 100.0 T<br />
ZAO <strong>Fiskars</strong> Brands Rus St. Petersburg RU 100.0 100.0 T<br />
<strong>Fiskars</strong> Brands Holding AB iL Motala SE 100.0 100.0 L<br />
Inha Works Ltd. Ähtäri FI 100.0 100.0 T<br />
Inha Invest Oy Ab Ähtäri FI 100.0 100.0 H<br />
Ferraria Oy Ab Raasepori FI 100.0 100.0 H<br />
Kiinteistö Oy Danskog gård Raasepori FI 100.0 100.0 H<br />
Ab Åbo Båtvarf - Turun Veneveistämö Oy Turku FI 100.0 100.0 L<br />
Management or holding H<br />
Manufacturing and marketing T<br />
Marketing M<br />
Dormant L<br />
Shares in associates<br />
Number of<br />
shares<br />
Domicile<br />
% of<br />
share capital<br />
% of<br />
voting power<br />
Wärtsilä <strong>Corporation</strong> 16,846,301 Helsinki FI 17.1 17.1<br />
Other shares<br />
Number of<br />
shares<br />
Domicile<br />
% of<br />
share capital<br />
% of<br />
voting power<br />
Rautaruukki <strong>Corporation</strong> 10,000 Helsinki FI 0.0 0.0
82 FISKARS Financial statements <strong>2009</strong><br />
Financial INDICATORs<br />
Five Years in Figures<br />
<strong>2009</strong> 2008 2007 2006 2005<br />
Net sales M€ 663 697 647 530 510<br />
of which outside Finland M€ 521 546 553 486 466<br />
in percent of net sales % 78.6 78.2 85.4 91.8 91.4<br />
export from Finland M€ 89 98 79 59 55<br />
Percentage change of net sales % -4.9 7.7 22.1 3.8 -9.4<br />
Earnings before depreciation and amortization (EBITDA) M€ 68 39 79 51 52<br />
in percent of net sales % 10.2 5.6 12.3 9.7 10.2<br />
Operating profit (EBIT) M€ 39 6 54 22 -5<br />
in percent of net sales % 6.0 0.9 8.3 4.2 -1.1<br />
Operating profit excluding non-recurring items M€ 40 41 52 33 34<br />
Share of profit from associates M€ 66 70 43 59 29<br />
Change in fair value of biological assets M€ 0 -6 10 5 -1<br />
Financial items net M€ -14 -19 13 -9 43<br />
in percent of net sales % -2.1 -2.8 2.0 -1.7 8.4<br />
Profit before taxes M€ 91 52 120 77 65<br />
in percent of net sales % 13.8 7.4 18.5 14.5 12.8<br />
Income tax (continuing operations) M€ -8 -2 -11 -10 -7<br />
Profit from discontinued operations M€ 15 4<br />
Profit for the period attributable to the equity holders of the Company M€ 84 49 108 82 62<br />
in percent of net sales % 12.6 7.1 16.8 15.5 12.2<br />
Minority interest M€ 0.0 -0.1 0.3 0.0<br />
Employee benefits M€ 165 187 146 121 126<br />
Depreciation and amortization M€ 28 33 23 29 59<br />
in percent of net sales % 4.2 4.7 3.6 5.4 11.5<br />
Capital expenditure (incl. acquisitions) M€ 15 30 221 41 61<br />
in percent of net sales % 2.2 4.3 34.1 7.7 11.9<br />
Research and development costs in income statement M€ 9 8 7 6 5<br />
in percent of net sales % 1.3 1.2 1.1 1.2 1.0<br />
Capitalized development costs M€ 0 1 1 1 1<br />
Equity attributable to equity holders of the Company M€ 505 447 478 422 403<br />
Minority interest M€ 0.0 0.0 0.5 0.0<br />
Equity total M€ 505 447 478 422 403<br />
Net interest bearing debt M€ 236 310 319 102 140<br />
Interest bearing debt M€ 275 321 354 147 162<br />
Non-interest bearing debt M€ 194 202 215 139 138<br />
Balance sheet total M€ 973 970 1,047 707 703<br />
Return on investment % 14 9 19 18 14<br />
Return on equity % 18 11 25 20 17<br />
Equity ratio % 52 46 46 60 57<br />
Net gearing % 47 69 67 24 35<br />
Persons employed, average 3,867 4,325 3,517 3,167 3,426<br />
Persons employed, Dec 31 3,623 4,119 4,515 3,003 3,220<br />
of which outside Finland 2,111 2,397 2,662 2,224 2,377<br />
Discontinued operations include Power Sentry in 2006 and 2005.
Financial INDICATORs<br />
83<br />
Share-Related Figures<br />
<strong>2009</strong> 2008 2007 2006 2005<br />
Share capital M€ 77.5 77.5 77.5 77.5 77.5<br />
Earnings per share (basic and diluted) € 1.05 0.64 1.40 1.06 0.80<br />
continuing operations 1.05 0.64 1.40 0.86 0.75<br />
discontinued operations 0.20 0.05<br />
Dividend per share ** ) €/Share 0.52 * ) 0.50 0.80 0.60 0.75<br />
Dividend M€ 42.6 * ) 38.2 61.5 46.0 57.1<br />
Equity per share € 6.16 5.77 6.18 5.45 5.20<br />
Adjusted average price ** ) €/Share 8.25 10.91 13.33 10.71 9.75<br />
Adjusted lowest price per share ** ) €/Share 5.32 6.89 11.92 9.00 7.91<br />
Adjusted highest price per share ** ) €/Share 11.10 13.90 15.40 12.55 12.00<br />
Adjusted price per share, Dec 31 ** ) €/Share 10.62 6.96 13.30 12.29 9.60<br />
Market value of shares M€ 869.9 633.2 1,055.1 947.0 749.6<br />
Number of shares, 1,000 Total 82,023.3 77,510.2 77,510.2 77,510.2 77,510.2<br />
Number of treasury shares, 1,000 Total 112.6 112.5 127.9 127.9 127.9<br />
Number of shares traded, 1,000 Total 4,406.8 5,082.1 12,648.2 6,565.2 12,596.8<br />
Price per earnings ** ) Share 10 11 9 12 12<br />
Dividend per earnings in percent % 51.0 77.6 55.9 56.1 92.0<br />
Dividend yield in percent ** ) Share 4.9 7.2 6.0 4.9 7.8<br />
Number of shareholders, Dec 31 11,916 9,899 8,356 6,592 6,114<br />
* ) Board's proposal.<br />
** ) The combination of the share series A and K was registered on 30 July <strong>2009</strong>. The comparison years include the share information<br />
as presented earlier for share serie A.<br />
Basic and diluted Earnings per Share are equal, as the company has no potential ordinary shares.<br />
Formulas for calculations of financial indicators are shown on Page 84.<br />
Euro exchange rates<br />
<strong>2009</strong><br />
Income statement<br />
2008<br />
Income statement<br />
<strong>2009</strong><br />
Balance sheet<br />
2008<br />
Balance sheet<br />
USD 1.395 1.471 1.441 1.392<br />
GBP 0.891 0.796 0.888 0.953<br />
DKK 7.446 7.456 7.442 7.451<br />
SEK 10.619 9.615 10.252 10.870<br />
NOK 8.728 8.224 8.300 9.750<br />
CAD 1.585 1.559 1.513 1.700
84 FISKARS Financial statements <strong>2009</strong><br />
Calculation of FINANCIAL INDICATORS<br />
Earnings before depreciation<br />
and amortization<br />
= Operating profit + depreciation and amortization + impairment<br />
Return on investment in percent =<br />
Profit for the period + income taxes + interest and other financial expenses<br />
Balance sheet total – non-interest bearing debt<br />
(average of beginning and end of year amounts)<br />
x 100<br />
Return on equity in percent =<br />
Profit for the period<br />
Equity, total (average of beginning and end of year amounts)<br />
x 100<br />
Equity ratio in percent =<br />
Equity, total<br />
Balance sheet total – advances received<br />
x 100<br />
Net gearing in percent =<br />
Interest bearing debt – cash and bank<br />
Equity, total<br />
x 100<br />
Earnings per share =<br />
Profit attributable to equity holders of the company<br />
Weighted average number of outstanding ordinary shares, Dec 31<br />
Earnings per share from<br />
continuing activities<br />
=<br />
Profit from continuing activities attributable to equity holders of the company<br />
Weighted average number of outstanding ordinary shares, Dec 31<br />
Equity per share =<br />
Equity attributable to equity holders of the company<br />
Number of outstanding ordinary shares, Dec 31<br />
Adjusted average share price =<br />
Value of shares traded during the period<br />
Number of shares traded during the period, adjusted for emissions<br />
Market capitalization = Number of outstanding ordinary shares, Dec 31 x market quotation, Dec 31<br />
Price per earnings (P/E) =<br />
Market quotation per share, Dec 31<br />
Earnings per share<br />
Dividend per earnings in percent =<br />
Dividend paid<br />
Profit attributable to equity holders of the company<br />
x 100<br />
Dividend per share =<br />
Dividend paid<br />
Number of outstanding shares, Dec 31<br />
Dividend yield in percent =<br />
Dividend per share<br />
Market quotation, Dec 31 adjusted for emissions<br />
x 100
Parent Company Financial Statements, FAS<br />
Parent company<br />
financial statements, fas<br />
85<br />
Parent Company Income Statement<br />
M€ Note <strong>2009</strong> 2008<br />
Net sales 1 20.1 20.1<br />
Cost of goods sold -3.5 -3.4<br />
Gross profit 16.6 82% 16.6 83%<br />
Administration expenses -13.6 -8.9<br />
Other operating income 4 0.2 0.5<br />
Other operating expenses 5 -0.1 -2.4<br />
Operating profit 3.1 16% 5.9 29%<br />
Gain/loss on sale of Wärtsilä shares -13.6 * )<br />
Financial income and expenses 7 -1.6 -371.9 ** )<br />
Profit (loss) before extraordinary items 1.6 -379.6<br />
Extraordinary items 8 8.5 8.6<br />
Profit (loss) before appropriations and taxes 10.0 -370.9<br />
Appropriations 0.2 0.2<br />
Income taxes 9 -2.7 -2.2<br />
Profit (loss) for the period 7.6 -373.0<br />
* ) <strong>Fiskars</strong> <strong>Corporation</strong> sold 901,857 Wärtsilä shares to its wholly owned subsidiary Avlis AB in December 2008 at NASDAQ<br />
OMX Helsinki. The group-internal loss from the sale was €13.6 million.<br />
** ) The book value of the <strong>Fiskars</strong> <strong>Corporation</strong>'s subsidiary Avlis AB was impaired to correspond the subsidiary's equity as at<br />
31 December 2008.
86 FISKARS Financial statements <strong>2009</strong><br />
Parent Company Balance Sheet<br />
M€ Note Dec 31, <strong>2009</strong> Dec 31, 2008<br />
ASSETS<br />
Non-current assets<br />
Intangible assets 10 0.6 0.5<br />
Tangible assets 11<br />
Land and water 15.3 15.1<br />
Buildings 16.0 16.5<br />
Machinery and equipment 1.6 1.9<br />
Construction in progress 0.1 0.2<br />
32.9 33.7<br />
Investments 12<br />
Holding in subsidiaries 577.8 578.0<br />
Receivables from subsidiaries 108.3 133.6<br />
Other shares 2.9 2.9<br />
689.0 714.5<br />
Non-current assets total 722.6 78% 748.7 78%<br />
Current assets<br />
Inventories 13 0.2 0.2<br />
Current receivables<br />
Trade receivables 0.3 0.4<br />
Receivables from subsidiaries 14 169.5 202.5<br />
Prepayments and accrued income 15 1.2 1.2<br />
171.0 204.1<br />
Cash and cash equivalents 16 29.7 4.6<br />
Current assets total 201.0 22% 209.0 22%<br />
Assets total 923.6 100% 957.7 100%
Parent Company Financial Statements, FAS<br />
87<br />
M€ Note Dec 31, <strong>2009</strong> Dec 31, 2008<br />
SHAREHOLDERS' EQUITY AND LIABILITIES<br />
Shareholders' equity 17<br />
Share capital 77.5 77.5<br />
Revaluation reserve 3.8 3.8<br />
Treasury shares -0.8 -0.8<br />
Other reserves 3.2 3.2<br />
Retained earnings 423.1 834.3<br />
Profit (loss) for the financial year 7.6 -373.0<br />
Shareholders' equity total 514.4 56% 545.0 57%<br />
APPROPRIATIONS 18 1.7 1.9<br />
Liabilities<br />
Non-current 19<br />
Capital loan 20 45.1<br />
Loans from credit institutions 62.9 78.3<br />
62.9 123.4<br />
Current<br />
Capital loan 20 45.1<br />
Loans from credit institutions 151.6 177.7<br />
Advances received 0.2 0.2<br />
Trade payables 0.4 0.3<br />
Liabilities to subsidiaries 21 138.9 97.5<br />
Income tax payable 0.5 1.7<br />
Other payables 0.5 1.7<br />
Accruals and deferred income 22 7.4 8.3<br />
344.7 287.4<br />
Liabilities total 407.6 44% 410.8 43%<br />
Shareholders' equity and liabilities total 923.6 100% 957.7 100%
88 FISKARS Financial statements <strong>2009</strong><br />
Parent Company Statement of Cash Flows<br />
M€ <strong>2009</strong> 2008<br />
Cash flow from operating activities<br />
Profit before extraordinary items, appropriations and taxes 1.6 -379.6<br />
Adjustments for<br />
Depreciation and amortization 1.6 1.8<br />
Gains and losses for non-current assets -0.3 382.8<br />
Financial income -9.0 -19.6<br />
Financial expense 10.6 22.3<br />
Cash generated before working capital changes 4.5 7.6<br />
Change in current receivables -0.6 -0.3<br />
Change in current non-interest bearing liabilities 0.8 -1.2<br />
Cash generated from operations 4.7 6.1<br />
Financial income 8.3 17.9<br />
Dividends received 0.0 3.5<br />
Financial expenses -11.7 -21.5<br />
Taxes paid -3.9 -0.3<br />
Net cash flow from operating activities (A) -2.5 12.6<br />
CASH FLOW FROM INVESTING ACTIVITIES<br />
Investments in subsidiaries and other non-current assets 0.0 -814.9<br />
Purchase of tangible and intangible assets -1.1 -2.0<br />
Proceeds from disposal of investments 0.0 19.9<br />
Proceeds from sale of tangible and intangible assets 0.6 0.5<br />
Change in receivables from subsidiaries 25.2 854.6<br />
Net cash flow from investments (B) 24.7 58.1<br />
Cash flow after investments 22.2 70.7<br />
CASH FLOW FROM FINANCING ACTIVITIES<br />
Sell of treasury shares 0.0 0.2<br />
Change in non-current debt -60.5 13.9<br />
Change in current interest bearing debt 58.1 -24.9<br />
Change in current receivables 34.8 -18.0<br />
Dividends paid -38.2 -61.5<br />
Group contributions 8.7 6.9<br />
Net cash flow from financing activities (C) 2.9 -90.4<br />
Change in cash (A+B+C) 25.1 -19.6<br />
Cash at beginning of year 4.6 24.3<br />
Cash at end of year 29.7 4.6
Parent Company Financial Statements, FAS<br />
89<br />
Statement of Changes in<br />
Parent Company Shareholders' Equity<br />
M€<br />
Share<br />
capital<br />
Revaluation<br />
reserve<br />
Treasury<br />
shares<br />
Other<br />
reserves<br />
Retained<br />
earnings<br />
Dec 31, 2007 77.5 3.8 -0.9 3.2 895.7 979.3<br />
Total<br />
Transfer from revaluation reserve<br />
following sale of landholdings 0.0 0.0 0.0<br />
Other changes 0.1 0.1 0.2<br />
Dividends -61.5 -61.5<br />
Net profit (loss) -373.0 -373.0<br />
Dec 31, 2008 77.5 3.8 -0.8 3.2 461.3 545.0<br />
Transfer from revaluation reserve<br />
following sale of landholdings 0.0 0.0 0.0<br />
Dividends -38.2 -38.2<br />
Net profit (loss) 7.6 7.6<br />
Dec 31, <strong>2009</strong> 77.5 3.8 -0.8 3.2 430.6 514.4
90 FISKARS Financial statements <strong>2009</strong><br />
Parent Company Accounting Principles<br />
The financial statements have been<br />
prepared in accordance with local requirements<br />
and generally accepted accounting<br />
principles in Finland (Finnish Accounting<br />
Standards, FAS).The financial statements<br />
are presented in euros.<br />
The preparation of financial statements<br />
in conformity with regulations in force and<br />
generally accepted accounting principles<br />
requires management to make estimates<br />
and assumptions that affect the valuation<br />
of assets and liabilities and <strong>report</strong>ed<br />
amounts of revenues and expenses.<br />
Actual results could differ from those<br />
estimates.<br />
Transactions in<br />
foreign currencies<br />
Transactions in foreign currencies are<br />
recorded at the rates of exchange prevailing<br />
at the date of the transaction. At the<br />
end of the <strong>report</strong>ing period balances in<br />
foreign currencies are translated using the<br />
exchange rate prevailing at the end of the<br />
<strong>report</strong>ing period. Derivatives are recognized<br />
initially at cost and subsequently at<br />
fair value determined at the end of each<br />
<strong>report</strong>ing period. Realized gains and<br />
losses as well as fair value changes are<br />
recognized in financial items in the income<br />
statement.<br />
Net sales<br />
Net sales is defined as invoiced amount<br />
less indirect taxes and rebates.<br />
Research and development<br />
costs<br />
Research and development costs are<br />
expensed as incurred.<br />
Pension benefit plans<br />
The retirement plans for the Finnish companies'<br />
employees are funded through<br />
payments to independent insurance<br />
companies.<br />
Extraordinary income and<br />
expense<br />
Group contributions, merger losses and<br />
liquidation losses are <strong>report</strong>ed in extraordinary<br />
income and expenses.<br />
Tangible and intangible<br />
assets and other long<br />
term investments<br />
Tangible and intangible assets are stated<br />
at cost less accumulated depreciation<br />
according to plan. Certain land holdings<br />
have been revalued.<br />
Revaluations are based on market<br />
values at time of the revaluation. Revaluation<br />
reserves are adjusted for decreases<br />
in the market value of land holdings. When<br />
revalued real estate is sold, the respective<br />
share in the revaluation reserve is transferred<br />
to retained earnings.<br />
Tangible and intangible assets are<br />
depreciated and amortized over their expected<br />
useful lives. Typically, the following<br />
expected useful lives are applied:<br />
• Long term expenditure 3–10 years<br />
• Buildings<br />
25–40 years<br />
• Vehicles<br />
4 years<br />
• Machinery and equipment 3–10 years<br />
• Land and water No depreciation<br />
Gains and losses on disposal of tangible<br />
and intangible assets are included in<br />
operating profit.<br />
Investments in holdings in subsidiaries<br />
are stated in the balance sheet at cost or<br />
at net realizable value if the net realizable<br />
value is significantly and permanently<br />
impaired.<br />
Inventories<br />
Inventories are stated at the lower of cost<br />
and net realizable value. Cost includes<br />
both direct and indirect costs. Cost is<br />
determined on a first in first out (FIFO)<br />
basis. Net realizable value is the amount<br />
that could be realized from the sale of the<br />
asset less any related sales cost.<br />
Receivables<br />
Receivables are carried at the lower of<br />
cost or probable value.<br />
Leasing<br />
Operating lease payments are expensed<br />
as incurred. Future leasing payment<br />
obligations are <strong>report</strong>ed as contingent<br />
liabilities.<br />
Provisions<br />
Provisions consist of reserves for future<br />
costs to which the <strong>Corporation</strong> is committed<br />
and reserves for loss-making<br />
contracts.<br />
Appropriations<br />
Appropriations in the parent company<br />
balance sheet consist of depreciation in<br />
excess of plan.<br />
Income taxes<br />
Income taxes consist of the aggregate<br />
current tax expense based on the Finnish<br />
tax rules, adjustments to prior year taxes.
Parent Company Financial Statements, FAS<br />
91<br />
Notes to the Financial Statements<br />
of Parent Company<br />
Notes to the Income statement<br />
1. Net sales<br />
M€ <strong>2009</strong> 2008<br />
Royalties 15.0 15.4<br />
Lease income 3.0 2.9<br />
Other 2.1 1.8<br />
Total 20.1 20.1<br />
2. Personnel costs<br />
M€ <strong>2009</strong> 2008<br />
Wages and salaries 6.0 5.6<br />
Pension costs 0.5 0.6<br />
Other personnel costs 1.7 0.7<br />
Total 8.2 6.9<br />
3. Number of employees<br />
<strong>2009</strong> 2008<br />
Average 60 49<br />
End-of-period 57 51<br />
4. Other operating income<br />
M€ <strong>2009</strong> 2008<br />
Net gain on sale of property, plant and equipment 0.2 0.5<br />
Other income 0.0 0.1<br />
Total 0.2 0.5<br />
5. Other operating expenses<br />
M€ <strong>2009</strong> 2008<br />
To subsidiaries 0.1 2.4<br />
Total 0.1 2.4<br />
6. Audit fees paid to Company's Auditors<br />
M€ <strong>2009</strong> 2008<br />
Audit fees 0.1 0.1<br />
Tax consultation 0.0 0.2<br />
Other 0.0 0.0<br />
Total 0.2 0.3
92 FISKARS Financial statements <strong>2009</strong><br />
7. Financial income and expenses<br />
M€ <strong>2009</strong> 2008<br />
Dividend income<br />
From associates 3.5<br />
From other investments 0.0 0.0<br />
Dividend income, total 0.0 3.5<br />
Interest and financial income from non-current investments<br />
From subsidiaries 3.1 6.6<br />
From other investments 0.0<br />
Interest and financial income from non-current investments, total 3.1 6.6<br />
Other interest and financial income<br />
From subsidiaries 2.9 9.3<br />
From other parties 2.9 0.3<br />
Other interest and financial income, total 5.8 9.6<br />
Interest and financial income, total 9.0 16.1<br />
Impairment of non-current investments<br />
Subsidiaries * ) -369.2<br />
Other parties -0.1<br />
Impairment of non-current investments, total 0.0 -369.2<br />
* ) The book value of <strong>Fiskars</strong> <strong>Corporation</strong>'s subsidiary Avlis AB was impaired to correspond<br />
the subsidiary's equity as at December 31, 2008.<br />
Interest and other financial expenses<br />
To subsidiaries -0.3 -1.9<br />
To other parties -10.3 -20.4<br />
Interest and other financial expenses, total -10.6 -22.3<br />
Total financial income and expenses -1.6 -371.9<br />
Net exchange gains and losses included in financial items 2.8 -2.1<br />
8. Extraordinary items<br />
M€ <strong>2009</strong> 2008<br />
Group contribution received 17.4 14.1<br />
Group contribution paid -8.9 -5.5<br />
Total 8.5 8.6<br />
9. Income taxes<br />
M€ <strong>2009</strong> 2008<br />
Current year taxes for profit before extraordinary items -0.5 0.0<br />
Tax for extraordinary items -2.2 -2.2<br />
Income taxes per income statement -2.7 -2.2
Parent Company Financial Statements, FAS<br />
93<br />
Notes to the Balance sheet, assets<br />
10. Intangible assets<br />
M€ <strong>2009</strong> 2008<br />
Historical cost, Jan 1 1.4 1.4<br />
Additions 0.3 0.0<br />
Historical cost, Dec 31 1.6 1.4<br />
Accumulated amortization according to plan, Jan 1 0.9 0.7<br />
Amortization according to plan 0.1 0.1<br />
Accumulated amortization according to plan, Dec 31 1.0 0.9<br />
Net book value, Dec 31 0.6 0.5<br />
11. Tangible assets<br />
<strong>2009</strong><br />
M€<br />
Land<br />
and<br />
water Buildings<br />
Machinery<br />
and<br />
equipment<br />
Construction<br />
in<br />
progress<br />
Total<br />
Historical cost, Jan 1 5.3 33.3 5.7 0.2 44.5<br />
Additions 0.2 0.5 0.1 0.0 0.9<br />
Decrease 0.0 0.0 -0.3 -0.3<br />
Transfers 0.1 0.0 -0.1 0.0<br />
Historical cost, Dec 31 5.5 33.9 5.6 0.1 45.1<br />
Accumulated depreciation according to plan, Jan 1 16.8 3.8 20.6<br />
Depreciation according to plan 1.1 0.3 1.5<br />
Decrease 0.0 -0.2 -0.2<br />
Accumulated depreciation according to plan, Dec 31 17.9 4.0 21.9<br />
Revaluation, Jan 1 9.8 9.8<br />
Decrease 0.0 0.0<br />
Revaluation, Dec 31 9.8 9.8<br />
Book value, Dec 31, <strong>2009</strong> 15.3 16.0 1.6 0.1 32.9
94 FISKARS Financial statements <strong>2009</strong><br />
2008<br />
M€<br />
Land<br />
and<br />
water Buildings<br />
Machinery<br />
and<br />
equipment<br />
Construction<br />
in<br />
progress<br />
Total<br />
Historical cost, Jan 1 5.0 32.7 5.5 0.2 43.3<br />
Additions 0.4 0.6 0.5 0.1 1.7<br />
Decrease -0.1 0.0 -0.3 -0.1 -0.5<br />
Transfers 0.0 0.0 0.0 0.0<br />
Historical cost, Dec 31 5.3 33.3 5.7 0.2 44.5<br />
Accumulated depreciation according to plan, Jan 1 15.6 3.6 19.3<br />
Depreciation according to plan 1.1 0.5 1.6<br />
Decrease 0.0 -0.3 -0.3<br />
Accumulated depreciation according to plan, Dec 31 16.8 3.8 20.6<br />
Revaluation, Jan 1 9.8 9.8<br />
Decrease 0.0 0.0<br />
Revaluation, Dec 31 9.8 9.8<br />
Book value, Dec 31, 2008 15.1 16.5 1.9 0.2 33.7<br />
12. Investments<br />
<strong>2009</strong><br />
Receivables<br />
M€<br />
Holdings in<br />
subsidiaries<br />
from<br />
subsidiaries<br />
Shares in<br />
associates<br />
Other<br />
shares<br />
Total<br />
Historical cost, Jan 1 983.5 133.6 3.6 1,120.6<br />
Additions 1.2 1.2<br />
Disposals -0.2 -26.4 -26.7<br />
Historical cost, Dec 31 983.2 108.3 3.6 1,095.1<br />
Write-downs, Jan 1 -405.5 -0.7 -406.2<br />
Write-downs, Dec 31 -405.5 -0.7 -406.1<br />
Net book value, Dec 31, <strong>2009</strong> 577.8 108.3 0.0 2.9 689.0<br />
2008<br />
Receivables<br />
M€<br />
Holdings in<br />
subsidiaries<br />
from<br />
subsidiaries<br />
Shares in<br />
associates<br />
Other<br />
shares<br />
Total<br />
Historical cost, Jan 1 169.8 988.1 33.3 3.2 1,194.4<br />
Additions 813.7 56.1 1.3 871.0<br />
Decreases -910.7 -33.3 -0.8 -944.8<br />
Historical cost, Dec 31 983.5 133.6 0.0 3.6 1,120.6<br />
Write-downs, Jan 1 -36.3 -0.6 -36.9<br />
Increase -369.2 -0.1 -369.2<br />
Write-downs, Dec 31 -405.5 -0.7 -406.2<br />
Net book value, Dec 31, 2008 578.0 133.6 0.0 2.9 714.5
Parent Company Financial Statements, FAS<br />
95<br />
Shares in subsidiaries<br />
Number<br />
of shares<br />
Domicile<br />
% of<br />
share capital<br />
% of<br />
voting power<br />
Book value<br />
(€ 1,000)<br />
Avlis AB * ) N/A Sollentuna SE 100.0 100.0 444,622<br />
<strong>Fiskars</strong> Brands, Inc. 22,924,913 Madison, Wi. US 100.0 100.0 42,484<br />
<strong>Fiskars</strong> Brands Europe ApS 1,251,250 Silkeborg DK 100.0 100.0 71,338<br />
Inha Works Ltd. 5,000 Ähtäri FI 100.0 100.0 1,199<br />
Ferraria Oy Ab 750,000 Raasepori FI 100.0 100.0 17,660<br />
Kiinteistö Oy Danskog gård 4,000 Raasepori FI 100.0 100.0 505<br />
Ab Åbo Båtvarf - Turun Veneveistämö Oy 150 Turku FI 100.0 100.0 3<br />
577,811<br />
* ) Holds 17.1% of Wärtsilä's total shares, the market value of Wärtsilä shares as at Dec 31, <strong>2009</strong> amounted to €472.9 million (353.9).<br />
Other shares<br />
Number<br />
of shares<br />
Domicile<br />
% of<br />
share capital<br />
% of<br />
voting power<br />
Book value<br />
(€ 1,000)<br />
Rautaruukki <strong>Corporation</strong> 10,000 FI 0.0 0.0 20<br />
Other shares owned by the Parent Company 2,856<br />
13. Inventories<br />
M€ <strong>2009</strong> 2008<br />
Finished goods 0.2 0.2<br />
Total, Dec 31 0.2 0.2<br />
2,875<br />
14. Receivables from subsidiaries<br />
M€ <strong>2009</strong> 2008<br />
Trade receivables 0.3 0.1<br />
Loan receivables 134.3 169.0<br />
Other receivables 12.6 12.7<br />
Prepayments and accrued income 22.2 20.7<br />
Total, Dec 31 169.5 202.5<br />
15. Prepayments and accrued income<br />
M€ <strong>2009</strong> 2008<br />
Prepaid and accrued interest 0.2 1.2<br />
Other prepayments and accruals 1.1 0.0<br />
Total, Dec 31 1.2 1.2<br />
16. Cash and cash equivalents<br />
M€ <strong>2009</strong> 2008<br />
Cash and cash equivalents 29.7 2.7<br />
Money market investments 1.9<br />
Total, Dec 31 29.7 4.6
96 FISKARS Financial statements <strong>2009</strong><br />
Notes to the Balance sheet, shareholders' equity and liabilities<br />
17. Shareholders' equity<br />
M€ <strong>2009</strong> 2008<br />
Share capital<br />
A Shares<br />
Jan 1 54.9 54.9<br />
Change * ) -54.9 0.0<br />
Dec 31 0.0 54.9<br />
K Shares<br />
Jan 1 22.6 22.6<br />
Change * ) -22.6 0.0<br />
Dec 31 0.0 22.6<br />
New shares<br />
Jan 1<br />
Change * ) 77.5<br />
Dec 31 77.5<br />
Share capital, Dec 31 77.5 77.5<br />
Revaluation reserve<br />
Jan 1 3.8 3.8<br />
Decrease following sale of fixed assets 0.0 0.0<br />
Revaluation reserve, Dec 31 3.8 3.8<br />
Treasury shares<br />
A Shares<br />
Jan 1 -0.8 -0.9<br />
Decrease 0.8 0.1<br />
Dec 31 0.0 -0.8<br />
K Shares<br />
Jan 1 0.0 0.0<br />
Decrease 0.0 0.0<br />
Dec 31 0.0 0.0<br />
New shares<br />
Jan 1<br />
Change * ) -0.8<br />
Dec 31 -0.8<br />
M€ <strong>2009</strong> 2008<br />
Other reserves<br />
Jan 1 3.2 3.2<br />
Other reserves, Dec 31 3.2 3.2<br />
Retained earnings<br />
Jan 1 461.3 895.7<br />
Dividends -38.2 -61.5<br />
Sale of treasury shares 0.1<br />
Net profit 7.6 -373.0<br />
Retained earnings, Dec 31 430.6 461.3<br />
Less treasury shares -0.8 -0.8<br />
Distributable earnings, Dec 31 429.9 460.5<br />
Restricted equity 80.7 80.7<br />
Non-restricted equity 433.6 464.3<br />
Shareholders' equity total, Dec 31 514.4 545.0<br />
18. Appropriations (Untaxed reserves)<br />
M€ <strong>2009</strong> 2008<br />
Depreciation in excess of plan, Jan 1 1.9 2.0<br />
Changes during the year -0.2 -0.2<br />
Depreciation in excess of plan, Dec 31 1.7 1.9<br />
The deferred tax liabilities, 26% from appropriations, are not<br />
recorded.<br />
19. Non-current liabilities<br />
which mature after 5 years<br />
M€ <strong>2009</strong> 2008<br />
Loans from credit institutions 52.5 63.3<br />
Treasury shares, Dec 31 -0.8 -0.8<br />
* ) <strong>Fiskars</strong> <strong>Corporation</strong> has one series of shares following the<br />
combination of the company’s series A and K shares in July<br />
<strong>2009</strong>. The new single class shares (FIS1V) became subject<br />
to public trading as of July 31. All shares carry one vote each<br />
and equal rights.
Parent Company Financial Statements, FAS<br />
97<br />
20. Capital loan<br />
Main characteristics of the loan:<br />
The principal, interest and any other yield will be payable on the dissolution or bankruptcy of the Company solely at a priority ranking<br />
inferior to that of all other debt. The principal can be repaid if and only to the extent the Company will retain full cover for its restricted<br />
equity and non-distributable funds in accordance with the balance sheet and consolidated balance sheet approved for the latest financial<br />
year. Interest can be paid if and only to the extent the equivalent sum is available for dividend distribution in accordance with the<br />
balance sheet and consolidated balance sheet approved for the latest financial year. The loan will be repaid in full on June 17, 2010<br />
and a fixed <strong>annual</strong> interest of 6.25% will be paid. The loan is listed on NASDAQ OMX Helsinki.<br />
21. Amounts owed to subsidiaries<br />
M€ <strong>2009</strong> 2008<br />
Trade payables 0.0 2.4<br />
Other liabilities 130.0 89.5<br />
Accruals and deferred income 8.9 5.6<br />
Total, Dec 31 138.9 97.5<br />
22. Accruals and deferred income<br />
M€ <strong>2009</strong> 2008<br />
Interest payable 2.4 6.2<br />
Wages, salaries and social costs 2.4 1.7<br />
Other items 2.6 0.4<br />
Total, Dec 31 7.4 8.3<br />
23. Lease obligations<br />
M€ <strong>2009</strong> 2008<br />
Operating leases, payments next year 0.6 0.4<br />
Operating leases, payments later 2.8 0.1<br />
Total, Dec 31 3.4 0.5<br />
24. Contingencies and pledged assets<br />
M€ <strong>2009</strong> 2008<br />
As security for own commitments<br />
Lease commitments 3.4 0.5<br />
Other contingencies 4.4 4.6<br />
Guarantees as security for subsidiaries' commitments 9.4 15.0<br />
Total, Dec 31 17.2 20.1
98 FISKARS Financial statements <strong>2009</strong><br />
BOARD’S PROPOSAL<br />
to THE ANNUAL<br />
GENERAL MEETING<br />
The distributable equity of the Parent Company at the end of the<br />
<strong>2009</strong> fiscal year was €429.9 million (460.5).<br />
The Board of Directors proposes to the Annual General Meeting<br />
of Shareholders that a dividend of €0.52 per share would be paid<br />
for <strong>2009</strong>.<br />
The number of shares entitling to a dividend totaled 81,910,722.<br />
The proposed distribution of dividend would thus be<br />
€42,593,575.44. This would leave €387.3 million of unused profit<br />
funds at the Parent Company.<br />
No material changes have taken place in the financial position<br />
of the Company after the end of the fiscal year. The financial<br />
standing of the Company is good and according to the Board of<br />
Directors’ assessment the proposed distribution of dividend will<br />
not compromise the Company’s solvency.<br />
Helsinki, February 10, 2010<br />
Kaj-Gustaf Bergh<br />
ralf Böer<br />
Alexander Ehrnrooth<br />
paul Ehrnrooth<br />
Ilona Ervasti-Vaintola<br />
Gustaf Gripenberg<br />
Karl Grotenfelt<br />
Karsten Slotte<br />
Jukka Suominen<br />
P<br />
Kari Kauniskangas<br />
president and CEO
AUDITORS’ REPORT<br />
99<br />
AUDITORS’ REPORT<br />
To the Annual General<br />
Meeting of <strong>Fiskars</strong> <strong>Corporation</strong><br />
We have audited the accounting records, the financial statements,<br />
the <strong>report</strong> of the Board of Directors, and the administration<br />
of <strong>Fiskars</strong> <strong>Corporation</strong> for the year ended on December 31,<br />
<strong>2009</strong>. The financial statements comprise the consolidated balance<br />
sheet, income statement, statement of comprehensive income,<br />
statement of changes in consolidated equity, statement of<br />
cash flows and notes to the consolidated financial statements, as<br />
well as the parent company's balance sheet, income statement,<br />
statement of cash flows and notes to the financial statements.<br />
The Responsibility of the Board of Directors<br />
and the President and CEO<br />
The Board of Directors and the President and CEO are responsible<br />
for the preparation of the financial statements and the <strong>report</strong><br />
of the Board of Directors and for the fair presentation of the consolidated<br />
financial statements in accordance with International<br />
Financial Reporting Standards (IFRS) as adopted by the EU, as<br />
well as for the fair presentation of the parent company’s financial<br />
statements and the <strong>report</strong> of the Board of Directors in accordance<br />
with laws and regulations governing the preparation of the<br />
financial statements and the <strong>report</strong> of the Board of Directors in<br />
Finland. The Board of Directors is responsible for the appropriate<br />
arrangement of the control of the company’s accounts and<br />
finances, and the President and CEO shall see to it that the accounts<br />
of the company are in compliance with the law and that its<br />
financial affairs have been arranged in a reliable manner.<br />
Auditors’ Responsibility<br />
Our responsibility is to perform an audit in accordance with<br />
good auditing practice in Finland, and to express an opinion on<br />
the parent company’s financial statements, on the consolidated<br />
financial statements and on the <strong>report</strong> of the Board of Directors<br />
based on our audit. Good auditing practice requires that we<br />
comply with ethical requirements and plan and perform the audit<br />
to obtain reasonable assurance whether the financial statements<br />
and the <strong>report</strong> of the Board of Directors are free from material<br />
misstatement and whether the members of the Board of Directors<br />
of the parent company and the President and CEO have complied<br />
with the Limited Liability Companies Act.<br />
An audit involves performing procedures to obtain audit<br />
evidence about the amounts and disclosures in the financial<br />
statements and the <strong>report</strong> of the Board of Directors. The procedures<br />
selected depend on the auditor’s judgment, including the<br />
assessment of the risks of material misstatement of the financial<br />
statements or of the <strong>report</strong> of the Board of Directors, whether due<br />
to fraud or error. In making those risk assessments, the auditor<br />
considers internal control relevant to the entity’s preparation and<br />
fair presentation of the financial statements and the <strong>report</strong> of the<br />
Board of Directors in order to design audit procedures that are<br />
appropriate in the circumstances. An audit also includes evaluating<br />
the appropriateness of accounting policies used and the<br />
reasonableness of accounting estimates made by management,<br />
as well as evaluating the overall presentation of the financial<br />
statements and the <strong>report</strong> of the Board of Directors.<br />
The audit was performed in accordance with good auditing<br />
practice in Finland. We believe that the audit evidence we have<br />
obtained is sufficient and appropriate to provide a basis for our<br />
audit opinion.<br />
Opinion on the Consolidated Financial Statements<br />
In our opinion, the consolidated financial statements give a true<br />
and fair view of the financial position, financial performance, and<br />
cash flows of the group in accordance with International Financial<br />
Reporting Standards (IFRS) as adopted by the EU.<br />
Opinion on the Company’s Financial Statements<br />
and the Report of the Board of Directors<br />
In our opinion, the financial statements and the <strong>report</strong> of the<br />
Board of Directors give a true and fair view of both the consolidated<br />
and the parent company’s financial performance and<br />
financial position in accordance with the laws and regulations<br />
governing the preparation of the financial statements and the<br />
<strong>report</strong> of the Board of Directors in Finland. The information in the<br />
<strong>report</strong> of the Board of Directors is consistent with the information<br />
in the financial statements.<br />
Helsinki, February 10, 2010<br />
KPMG OY AB<br />
Mauri Palvi<br />
Authorized Public Accountant
100 FISKARS Financial statements <strong>2009</strong><br />
Shares and shareholders<br />
Information on the share<br />
<strong>Fiskars</strong> <strong>Corporation</strong>’s shares are traded in the Large Cap segment<br />
of NASDAQ OMX Helsinki Ltd. The Company has one<br />
series of shares following the combination series A and K shares<br />
in July <strong>2009</strong>. After the combination all share carry one vote each<br />
and have equal rights. New single class shares became subject<br />
to public trading as of July 31, <strong>2009</strong> with a trading code FIS1V<br />
(earlier FISAS and FISKS).<br />
In connection with the combination of the share series, a free<br />
share issue was directed to the holders of series K shares. In the<br />
share issue, the holders of series K shares received one share<br />
free of charge for each five series K shares. As a result, a total of<br />
4,513,141 new shares were issued.<br />
The share combination further involved the merger of Agrofin<br />
Oy Ab into <strong>Fiskars</strong> <strong>Corporation</strong>. As a merger consideration,<br />
in total 11,863,964 new shares were issued to the shareholders<br />
of Agrofin Oy Ab. At the same time, the 11,863,964 shares,<br />
transferred to the Company in connection to the execution of the<br />
merger, were cancelled.<br />
The total number of shares at the end of <strong>2009</strong> was 82,023,341.<br />
The share capital remained unchanged in <strong>2009</strong> at €77,510,200.<br />
Treasury shares<br />
As of the end of the year, <strong>Fiskars</strong> owned 112,619 treasury shares,<br />
corresponding to 0.14% of the <strong>Corporation</strong>’s shares and votes.<br />
The Company has acquired the shares at the NASDAQ OMX<br />
Helsinki in accordance with the authorization of the general meeting<br />
of the shareholders. The acquisitions have been made from<br />
December 10, 2003 through January 16, 2004.<br />
Board authorizations<br />
The Annual General Meeting on March 16, <strong>2009</strong> authorized the<br />
Board to acquire <strong>Fiskars</strong>’ shares and convey them, a maximum<br />
of 2,700,000 of Series A shares and a maximum of 1,100,000<br />
of Series K shares. The authorizations were cancelled in the<br />
Extraordinary General Meeting on June 5, <strong>2009</strong>.<br />
The Extraordinary General Meeting on June 5, <strong>2009</strong> authorized<br />
the Board to acquire <strong>Fiskars</strong>’ share and convey them, a maximum<br />
of 4,020,000 shares. The Board may decide on the conveyance<br />
of the shares otherwise than in proportion to the shareholders<br />
pre-emptive subscription rights. The authorizations will be in<br />
force until the end of the next Annual General Meeting.<br />
The Board of Directors has not used these authorizations during<br />
<strong>2009</strong>.<br />
Shareholders<br />
<strong>Fiskars</strong> <strong>Corporation</strong> had 11,915 (2008: 9,899) shareholders as<br />
of the end of the year. Approximately 2.5% of the share capital<br />
was owned by foreign or nominee-registered shareholders (2008:<br />
2.2% of shares and 0.6% of voting rights).<br />
Management shareholding<br />
On December 31, <strong>2009</strong>, the Board members, the President &<br />
CEO and the companies where they have a controlling interest<br />
together with a family member, owned a total of 24,507,687<br />
shares corresponding to 29.9% of the Company’s shares and<br />
votes. The Company did not have any share option programs.<br />
Changes in the number of shares, 2008–<strong>2009</strong><br />
A share K share Total<br />
Total shares, Dec 31, 2008 54,944,492 22,565,708 77,510,200<br />
Jul 30, <strong>2009</strong> -54,944,492 -22,565,708 77,510,200 Combination of share series<br />
Jul 30,<strong>2009</strong> 4,513,141 Directed issue: one new share for each five series K shares<br />
Jul 31, <strong>2009</strong> 11,863,964 Directed issue to shareholders of Agrofin<br />
Aug 8, <strong>2009</strong> -11,863,964 Cancelling shares in accordance with the merger of Agrofin<br />
Total shares, Dec 31, <strong>2009</strong> 82,023,341<br />
Treasury shares 112,619
Shares and Shareholders101<br />
Share ownership, December 31, <strong>2009</strong><br />
Ownership structure<br />
Number of<br />
shareholders %<br />
Number of<br />
shares and votes %<br />
Private corporations 528 4.43 28,495,893 34.74<br />
Financial institutions and insurance companies 19 0.16 691,077 0.84<br />
Public entities 14 0.12 5,826,931 7.10<br />
Households 11,120 93.32 34,884,065 42.53<br />
Non-profit organizations 145 1.22 10,084,354 12.29<br />
Foreigners 80 0.67 1,020,289 1.24<br />
Nominee registered 9 0.08 1,003,568 1.22<br />
Other 1 0.01 17,164 0.02<br />
Total 11,916 100.00 82,023,341 100.00<br />
Distribution of shares, December 31, <strong>2009</strong><br />
Number of shares<br />
Number of<br />
shareholders %<br />
Number of<br />
shares and votes %<br />
1–100 3,064 25.71 215,810 0.26<br />
101–500 4,901 41.13 1,330,390 1.62<br />
501–1,000 1,677 14.08 1,282,652 1.56<br />
1,001–10,000 1,970 16.53 5,504,872 6.71<br />
10,001–100,000 228 1.91 5,773,792 7.04<br />
100,001– 76 0.64 67,915,825 82.80<br />
Total 11,916 100.00 82,023,341 100.00<br />
Major shareholders, December 31, <strong>2009</strong><br />
Total shares<br />
% of shares<br />
and votes<br />
1 Virala Oy Ab 9,213,770 11.2<br />
2 Turret Oy Ab 8,440,406 10.3<br />
3 Oy Holdix Ab 5,959,050 7.3<br />
4 I.A. von Julins Sterbhus 2,689,120 3.3<br />
5 Sophie von Julins stiftelse 2,551,791 3.1<br />
6 Varma Mutual Pension Insurance Company 2,469,326 3.0<br />
7 Julius Tallberg Oy Ab 2,277,035 2.8<br />
8 Ilmarinen Mutual Pension Insurance Company 1,940,950 2.4<br />
9 Ehrnrooth Alexander 1,833,534 2.2<br />
10 Fromond Louise 1,686,135 2.1<br />
11 Fromond Anna 1,685,518 2.1<br />
12 Fromond Elsa 1,623,926 2.0<br />
13 Ehrnrooth Albert 1,610,372 2.0<br />
14 Ehrnrooth Jacob 1,566,929 1.9<br />
15 Ehrnrooth Sophia 1,556,928 1.9<br />
16 Åberg Albertina 1,141,959 1.4<br />
17 Stiftelsen för Åbo Akademi 969,241 1.2<br />
18 Wrede Sophie 821,790 1.0<br />
19 Hartwall Peter 748,450 0.9<br />
20 Lindsay von Julin & Co Ab 733,320 0.9<br />
20 major shareholders 51,519,550 63.0
102 FISKARS Financial ANNUAL REPORT statements <strong>2009</strong> <strong>2009</strong><br />
Stock Exchange<br />
Releases in <strong>2009</strong><br />
Financial <strong>report</strong>s<br />
Feb 13 <strong>Fiskars</strong> Financial Statement Release 2008<br />
Apr 23 <strong>Fiskars</strong>’ new <strong>report</strong>ing structure and restated<br />
comparison figures for 2008<br />
May 6 <strong>Fiskars</strong> Interim Report January-March <strong>2009</strong><br />
Aug 6 <strong>Fiskars</strong> Interim Report January-June <strong>2009</strong><br />
Nov 4 <strong>Fiskars</strong> Interim Report January-September <strong>2009</strong><br />
Combination of share series<br />
Apr 15 Board of Directors proposes a combination of share<br />
series and a merger of Agrofin Oy Ab into <strong>Fiskars</strong><br />
Apr 20 Notice to the Extraordinary General Meeting<br />
Jun 5 Resolutions of the Extraordinary General Meeting<br />
Jul 27 Conditions for the combination of share series of<br />
<strong>Fiskars</strong> fulfilled<br />
Jul 30 hares issued in <strong>Fiskars</strong>’ directed free share issue and<br />
combination of share series registered with the Trade<br />
Register<br />
Jul 31 Trading of <strong>Fiskars</strong>’ combined shares begins<br />
Jul 31 Merger between <strong>Fiskars</strong> and Agrofin executed<br />
Aug 3 <strong>Fiskars</strong> shares issued as merger consideration to<br />
Agrofin shareholders have been taken into public<br />
trading<br />
Changes in share holdings<br />
Apr 17 Notification on a change in holdings, referred to in<br />
Chapter 2, section 10 of the Securities Markets Act<br />
Apr 21 Notification on a change in holdings, referred to in<br />
Chapter 2, section 10 of the Securities Markets Act<br />
Jun 16 Notification on a change in holdings, referred to in<br />
Chapter 2, section 10 of the Securities Markets Act<br />
Jul 31 Notification on a change in holdings, referred to in<br />
Chapter 2, section 10 of the Securities Markets Act<br />
Jul 31 Notification on a change in holdings, referred to in<br />
Chapter 2, section 10 of the Securities Markets Act<br />
Aug 3 Notification on a change in holdings, referred to in<br />
Chapter 2, section 10 of the Securities Markets Act<br />
Oct 6 Notification on a change in holdings, referred to in<br />
Chapter 2, section 10 of the Securities Markets Act<br />
Other stock exchange releases<br />
Jan 13 <strong>Fiskars</strong>’ <strong>annual</strong> review 2008<br />
Feb 11 Codetermination negotiations concluded at the Iittala<br />
Group<br />
Feb 13 Notice to the Annual General Meeting<br />
Feb 16 Iittala Group to start codetermination negotiations at<br />
Arabia, Iittala, and Nuutajärvi plants<br />
Mar 9 <strong>Fiskars</strong> Annual Report 2008 published<br />
Mar 16 <strong>Fiskars</strong> Annual General Meeting of shareholders <strong>2009</strong><br />
Mar 30 New president for <strong>Fiskars</strong>’ Boats business<br />
Apr 1 Codetermination negotiations concluded at the Iittala<br />
Group plants<br />
May 7 <strong>Fiskars</strong> to start codetermination negotiations at its<br />
plant in Billnäs<br />
Jun 22 Codetermination negotiations concluded at <strong>Fiskars</strong>’<br />
plant in Billnäs<br />
Aug 18 President of <strong>Fiskars</strong>’ Home Business Area resigns<br />
Aug 26 New President appointed for <strong>Fiskars</strong>’ Home Business<br />
Area<br />
Oct 7 <strong>Fiskars</strong> Home to simplify its organization and begin<br />
codetermination negotiations at the Iittala Group<br />
Dec 1 Codetermination negotiations concluded at the Iittala<br />
Group<br />
Dec 9 <strong>Fiskars</strong>’ financial <strong>report</strong>s in 2010<br />
The releases and <strong>report</strong>s are available on the <strong>Fiskars</strong><br />
<strong>Corporation</strong>’s website: www.fiskarsgroup.com.
INVESTORS103<br />
For shareholders<br />
<strong>Fiskars</strong>’ shares are traded on NASDAQ OMX in Helsinki. Following<br />
the combination of series A and K shares in July <strong>2009</strong>, the<br />
company now has one share series traded under the FIS1V code<br />
(previously FISAS and FISKS).<br />
Share details<br />
Market<br />
ISIN<br />
Trading code<br />
Segment<br />
Sector<br />
NASDAQ OMX Helsinki<br />
FI000900400<br />
FIS1V (OMX)<br />
OMXH Large Cap<br />
Consumer Discretionary,<br />
Housewares & Specialties<br />
GICS code 25201050<br />
Shares as of Dec 31, <strong>2009</strong> 82,023,341<br />
ANNUAL GENERAL MEETING AND DIVIDEND<br />
<strong>Fiskars</strong> <strong>Corporation</strong> will hold its Annual General Meeting (AGM)<br />
at 3.00 pm EET on Tuesday, March 16, 2010 in the Congress<br />
Wing of the Helsinki Exhibition & Convention Centre (Messu aukio<br />
1, Helsinki). Reception of persons who have registered for the<br />
meeting will begin at 2.00 pm.<br />
All shareholders included in the register of shareholders maintained<br />
by Euroclear Finland Ltd. as of March 4, 2010 shall be<br />
entitled to attend the meeting. Shareholders wishing to attend the<br />
AGM should inform the company by 3.00 pm on March 11, 2010<br />
at the latest.<br />
The Board of Directors will propose paying a dividend of €0.52<br />
per share for the <strong>2009</strong> fiscal year. The record date for payment of<br />
the dividend will be March 19, 2010 and dividends will be paid<br />
on March 26, 2010.<br />
Further information on the matters to be discussed at the AGM<br />
and how to register can be found in the invitation to the meeting<br />
at www.fiskarsgroup.com.<br />
Investor relations<br />
The goal of <strong>Fiskars</strong>’ investor relations is to provide all parties in<br />
the market with accurate, up-to-date, and sufficient information<br />
on the company to enable them to analyze its performance and<br />
prospects as an investment. Information is provided to all stakeholders<br />
simultaneously.<br />
<strong>Fiskars</strong> has adopted a silent period of three weeks prior to the<br />
publication of results. During this period comments on market<br />
situation or company prospects are not available from <strong>Fiskars</strong>.<br />
Meetings with investors and analysts are coordinated by Corporate<br />
Communications. Questions on investor relations matters<br />
should be addressed to Communications Manager Nora Malin<br />
(nora.malin@fiskars.fi).<br />
<strong>Fiskars</strong>’ share price, €<br />
January 1, 2005–December 31, <strong>2009</strong><br />
15<br />
10<br />
5<br />
0<br />
2005 2006 2007 2008 <strong>2009</strong><br />
FIS1V (FISAS until July 30, <strong>2009</strong>)<br />
OMXH25 index
Towards new<br />
innovations<br />
<strong>Fiskars</strong>’ 360-year heritage is an important<br />
source of inspiration as we continue developing<br />
functional, imaginative, and innovative products<br />
with new designers – creating products that<br />
will last from generation to generation.
For investors<br />
<strong>Fiskars</strong> <strong>Corporation</strong>’s shares (FIS1V) are<br />
traded on NASDAQ OMX in Helsinki.<br />
<strong>Fiskars</strong> will publish three interim <strong>report</strong>s<br />
during 2010:<br />
• January–March on May 4, 2010<br />
• January–June on August 5, 2010<br />
• January–September on November 2, 2010<br />
All the company’s financial reviews and<br />
other IR material can be consulted online<br />
at www.fiskarsgroup.com. Visitors to the<br />
site can subscribe to releases via email,<br />
or order a printed copy of the Annual<br />
Report. Interim <strong>report</strong>s, Annual Reports,<br />
and stock exchange releases are<br />
published in Finnish, Swedish, and English.<br />
www.fiskarsgroup.com
<strong>Fiskars</strong> <strong>Corporation</strong><br />
Hämeentie 135 A<br />
P. O. Box 130<br />
00561 Helsinki, Finland<br />
Tel. +358 204 3910<br />
www.fiskarsgroup.com<br />
Lasting<br />
everyday<br />
design,<br />
since 1649