Active NZ Survey (2007-08).pdf
Active NZ Survey (2007-08).pdf
Active NZ Survey (2007-08).pdf

Create successful ePaper yourself
Turn your PDF publications into a flip-book with our unique Google optimized e-Paper software.
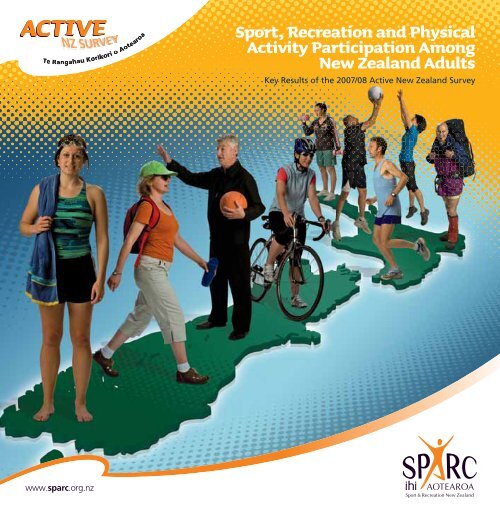
Sport, Recreation and Physical<br />
Activity Participation Among<br />
New Zealand Adults<br />
Key Results of the <strong>2007</strong>/<strong>08</strong> <strong>Active</strong> New Zealand <strong>Survey</strong><br />
www.sparc.org.nz
ISBN: 1-877356-73-5<br />
Citation:<br />
Sport and Recreation New Zealand (20<strong>08</strong>). Sport, Recreation and Physical Activity Participation Among<br />
New Zealand Adults: Key Results of the <strong>2007</strong>/<strong>08</strong> <strong>Active</strong> <strong>NZ</strong> <strong>Survey</strong>. Wellington: SPARC<br />
Published in 20<strong>08</strong> by Sport and Recreation New Zealand.<br />
This document is available on the SPARC website: www.sparc.org.nz
ACTIVE <strong>NZ</strong> SURVEY KEY RESULTS 1<br />
FOREWORD<br />
SPARC is very pleased to release the first results from the <strong>2007</strong>/<strong>08</strong> <strong>Active</strong><br />
<strong>NZ</strong> <strong>Survey</strong>.<br />
<strong>Active</strong> <strong>NZ</strong> is a new national physical activity survey. Consequently, it sets a<br />
benchmark in how we will monitor participation in sport, recreation and<br />
physical activities among New Zealand adults.<br />
This has been a huge project for SPARC to undertake with the survey being<br />
fielded over a 12 month period and incorporated two measurement tools to<br />
capture robust, quality data from over 4,000 Kiwis. We are extremely pleased<br />
with the depth of information this survey gives us and our partners in the sport<br />
and recreation sector.<br />
So what does it tell us? Sport and recreation continues to be a major part of<br />
the lives of New Zealand adults. During any week, nearly 80 percent of adults<br />
participated in at least one sport or recreation activity; over 12 months, one in<br />
four Kiwis provided support to sport and recreation as volunteers and almost<br />
40 percent took part in at least one event or organised competition. In terms of<br />
how active Kiwis are, nearly 50 percent of adults met physical activity guidelines<br />
for adults advocated in New Zealand (at least 30 minutes of physical activity a<br />
day on five or more days a week).<br />
In terms of trend data, participation levels in sport and recreation, volunteering<br />
levels and being members of clubs or centres can be compared to data collected<br />
in 2000/01. Again the news is good; our levels of engagement in sport and<br />
recreation as participants and volunteers have remained stable between 2000/01<br />
and <strong>2007</strong>/<strong>08</strong>.<br />
SPARC will be releasing much more information from the survey over the<br />
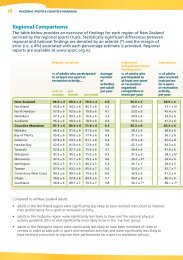
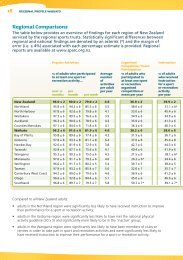
coming months, including for the first time, a profile for each of the 17 Regional<br />
Sports Trusts which will allow regional bodies to compare high-level results to<br />
other regions and nationally. We will also be releasing profiles on the sport and<br />
recreation activities with the highest participation numbers. In addition there<br />
will be ethnic-specific profiles, profiles focusing on volunteers and other<br />
demographic groups.<br />
Finally I would like to take this opportunity to thank the following people and<br />
organisations who helped this project come to fruition: all the participants who<br />
freely gave their time to participate in this survey; Ministry of Health, Statistics<br />
New Zealand and Dr Karen Moy who assisted with the design of the survey;<br />
Nielsen for undertaking the survey; and the SPARC Research Team, in particular,<br />
Grant McLean, Paula Pope and Maea Hohepa who managed the <strong>Active</strong> <strong>NZ</strong><br />
survey, analysed the data and wrote this report.<br />
Peter Miskimmin<br />
Chief Executive SPARC
2<br />
CONTENTS<br />
Foreword 1<br />
Executive Summary 3<br />
Report Content 3<br />
Key Findings 3<br />
<strong>2007</strong>/<strong>08</strong> <strong>Active</strong> <strong>NZ</strong> <strong>Survey</strong> Findings 4<br />
INTRODUCTION 5<br />
The <strong>2007</strong>/<strong>08</strong> <strong>Active</strong> <strong>NZ</strong> <strong>Survey</strong> 5<br />
The Objectives of the <strong>2007</strong>/<strong>08</strong> <strong>Active</strong> <strong>NZ</strong> <strong>Survey</strong> 5<br />
Methodology 5<br />
PARTICIPATION IN SPORT AND RECREATION 6<br />
Popular Activities 6<br />
Participation in an Organised Competition or Event<br />
Over 12 Months 12<br />
Involvement in a Sport or Recreation Club or Centre<br />
Over a Month 13<br />
Received Instruction for a Sport or Recreation Activity<br />
Over 12 Months 13<br />
VOLUNTEERS 14<br />
Volunteer Levels Among All Adults 14<br />
Most Common Roles Among Volunteers 14<br />
Most Common Volunteer Roles Among All Adults 14<br />
NATIONAL PHYSICAL ACTIVITY GUIDELINES 15<br />
Physical Activity Levels 15<br />
Physical Activity Levels by Gender and Age 16<br />
Physical Activity Levels by Ethnicity 16<br />
Achieving 30 Minutes of Moderate Intensity Physical Activity<br />
a Day Through Different Physical Activity Domains 17<br />
The Number of Days Adults Achieved at Least 30 Minutes<br />
a Day of Moderate Intensity Physical Activity 17<br />
Sport and Recreation Trends 2000/01 – <strong>2007</strong>/<strong>08</strong> 18<br />
INTRODUCTION 19<br />
Comparisons 19<br />
2000/01 <strong>Survey</strong> versus <strong>2007</strong>/<strong>08</strong> <strong>Survey</strong> 19<br />
TRENDS 20<br />
Sport and Recreation Participation 20<br />
Volunteer Levels 20<br />
Member of a Club or Centre 20
ACTIVE <strong>NZ</strong> SURVEY KEY RESULTS<br />
3<br />
EXECUTIVE SUMMARY<br />
Report Content<br />
This report consists of two main sections.<br />
Section 1, ‘<strong>2007</strong>/<strong>08</strong> <strong>Active</strong> <strong>NZ</strong> <strong>Survey</strong> Findings’, contains an overview of<br />
key findings from the <strong>2007</strong>/<strong>08</strong> <strong>Active</strong> <strong>NZ</strong> survey, in particular, the level of<br />
engagement New Zealand adults have with sport and recreation as participants<br />
or volunteers and how active New Zealand adults are.<br />
Section 2 ‘Sport and Recreation Trends 2000/01-<strong>2007</strong>/<strong>08</strong>’ outlines trend data for<br />
three sport and recreation indicators: (1) sport and recreation participation over<br />
12 months; (2) level of volunteering over 12 months; and (3) involvement levels in<br />
a club or centre over a month.<br />
Over the next few months SPARC will do further analysis of the data to provide<br />
more targeted reports on a range of areas. For example, individualised reports for<br />
17 regions will be produced, followed by reports focusing on specific sport and<br />
recreation activities, volunteers and ethnic-specific reports. A full technical report<br />
will also be completed. Additional information about these reports can be found<br />
on page 21 of this report.<br />
Physical Activity Levels<br />
• 48.2 percent (women, 44%; men, 52%) of adults achieved New Zealand’s<br />
national physical activity guideline, that is they participated in at least<br />
30 minutes of moderate intensity physical activity on five or more days of<br />
the week.<br />
• Compared with the New Zealand population, a similar percentage of adults<br />
in each ethnic group achieved the national physical activity guidelines, but<br />
inactivity levels were higher among Asian adults.<br />
Trends<br />
• Between 2000/01 and <strong>2007</strong>/<strong>08</strong> levels of participation in sport and<br />
recreation among adults (aged 18 years and over) have remained stable<br />
in the following areas:<br />
−<br />
−<br />
participating in at least one sport and recreation activity over 12 months;<br />
volunteering in sport and recreation over 12 months; and<br />
− being a member of a club or centre to participate in a sport or recreation<br />
activity per month.<br />
Key Findings<br />
Popular Activities<br />
• Over 12 months, 96 percent of adults participated in one or more sport or<br />
recreation activities. During any week, 79 percent of adults participated in at<br />
least one sport or recreation activity.<br />
• High participation levels were found for a mixture of sport and recreation<br />
activities, with walking, gardening and swimming being the most popular<br />
activities in which adults participated each year.<br />
• On average, adults participated in 4.6 sport and recreation activities per year.<br />
Volunteering, Organised Event Participation<br />
and Instruction<br />
• Over 12 months:<br />
−<br />
25.3 percent of adults volunteered in sport and recreation;<br />
− 36.9 percent of adults participated in at least one event or organised<br />
competition; and<br />
− 39.9 percent of adults received instruction from a coach, instructor, teacher<br />
or trainer.<br />
Club or Centre Involvement<br />
• During any month, 34.9 percent of adults were members of clubs or centres to<br />
do a sport or recreation activity.
4<br />
<strong>2007</strong>/<strong>08</strong> ACTIVE <strong>NZ</strong><br />
SURVEY FINDINGS
ACTIVE <strong>NZ</strong> SURVEY KEY RESULTS 5<br />
INTRODUCTION<br />
The <strong>2007</strong>/<strong>08</strong> <strong>Active</strong> <strong>NZ</strong> <strong>Survey</strong><br />
<strong>Active</strong> <strong>NZ</strong> is a national-level measurement tool used by Sport and Recreation<br />
New Zealand (SPARC) to monitor physical activity, in particular sport and<br />
recreation participation among New Zealand adults. The <strong>2007</strong>/<strong>08</strong> survey<br />
provides new benchmarks for monitoring physical activity.<br />
The Objectives of the <strong>2007</strong>/<strong>08</strong> <strong>Active</strong><br />
<strong>NZ</strong> <strong>Survey</strong><br />
The key objectives of the <strong>Active</strong> <strong>NZ</strong> <strong>Survey</strong> were to:<br />
• measure participation levels in various sport, recreation, and physical activities;<br />
• determine the percentage of New Zealand adults who met the New Zealand<br />
Physical Activity Guidelines;<br />
• provide a baseline from which to track long-term trends in sport, recreation<br />
and physical activity at a national level; and<br />
• gain insights into sport, recreation and physical activity levels across various<br />
regions and demographic variables.<br />
Methodology<br />
The <strong>Survey</strong><br />
The <strong>Active</strong> <strong>NZ</strong> <strong>Survey</strong> consists of two data collection methods:<br />
1. a sport and recreation survey; and<br />
2. a seven-day physical activity recall diary.<br />
The <strong>Active</strong> <strong>NZ</strong> <strong>Survey</strong> collected information about all physical activity domains<br />
(i.e. sport and recreation, active travel including walking or cycling to a<br />
destination, occupational activity and incidental activities like washing the car).<br />
The survey also assessed the intensity at which people did physical activities,<br />
whether adults were members of clubs or centres to do sport and recreation<br />
activities and the type and level of sport and recreation volunteering.<br />
The Sample<br />
Data were collected from 4,443 New Zealand adults aged 16 years and over<br />
through face-to-face interviews. The interviews were completed over a 12-month<br />
period beginning March <strong>2007</strong>. An overall response rate of 61 percent was<br />
achieved. The data have been weighted to be representative of the New Zealand<br />
adult population.<br />
Sample profile<br />
Number interviewed<br />
(n)<br />
Weighted sample<br />
(n)<br />
Total Population 4,443 3,275,730<br />
Gender<br />
Men 1,857 1,582,670<br />
Women 2,586 1,693,060<br />
Age<br />
16-24 523 549,492<br />
25-34 713 544,391<br />
35-49 1,288 946,050<br />
50-64 948 7<strong>08</strong>,461<br />
≥ 65 971 527,336<br />
Ethnicity<br />
<strong>NZ</strong> European 3,056 2,288,363<br />
Màori 783 399,125<br />
Pacific 274 185,532<br />
Asian 361 317,530<br />
Other 295 257,178<br />
Ethnic-Specific Data<br />
The ethnic groupings represented in this report are Màori, New Zealand<br />
European, Pacific and Asian. The Other ethnic group includes mainly Middle-<br />
Eastern, Latin American and African ethnicities.<br />
To provide a representative picture of ethnic affiliation, participants could<br />
report multiple ethnicities. This means that the same person can be represented<br />
in different ethnic groups (e.g. Màori and New Zealand European).<br />
Consequently, the sum of the ethnic group populations exceeds the total<br />
New Zealand population.<br />
Percent estimates for each ethnic group should only be compared with<br />
percent estimates for the total population and not between ethnic groups<br />
(e.g. comparing Màori and Pacific data).<br />
Margin of Error<br />
Percent estimates based on the total <strong>Active</strong> <strong>NZ</strong> <strong>Survey</strong> sample (n=4,443) are<br />
subject to a margin of error of ± 2 percent.<br />
Interpretation: For a percent estimate of 64.1 percent (i.e. percent of adults who<br />
participated in walking as a sport or recreation activity; page 6), the true estimate<br />
lies somewhere between 62.1 percent and 66.1 percent.
6<br />
PARTICIPATION<br />
IN SPORT & RECREATION<br />
Popular Activities<br />
The information presented in this section, ‘Popular Activities’, indicates the percentage of<br />
all adults who participated in a specific activity, irrespective of the intensity or duration of<br />
the activity undertaken. Also, participation levels are reported for three timeframes: over<br />
12 months, per month and per week.<br />
The 20 Most Popular Sport and Recreation Activities Participated in Over 12 Months<br />
60%<br />
50%<br />
40%<br />
30%<br />
20%<br />
64.1%<br />
43.2%<br />
34.8%<br />
26.5%<br />
22.7%<br />
19.3% 17.5% 16.8%<br />
10%<br />
0%<br />
Walking<br />
Gardening<br />
Swimming<br />
Number of New Zealand adults participating<br />
2,100,278 1,414,633 1,139,812 868,271 745,183 633,769 574,109 549,112<br />
Equipment<br />
based exercise 1 Cycling 2<br />
Fishing 3<br />
Jogging/Running<br />
Dance 4
ACTIVE <strong>NZ</strong> SURVEY KEY RESULTS 7<br />
The 10 Most Popular Sport and Recreation<br />
Activities Participated In Over 12 Months<br />
By Gender<br />
Men % Women %<br />
Walking 52.3 Walking 75.1<br />
Gardening 37.3 Gardening 48.7<br />
Swimming 33.4 Swimming 36.1<br />
Fishing 29.8 Equipment-based exercise 27.0<br />
Cycling 28.0 Dance 22.6<br />
Equipment-based exercise 26.0 Cycling 17.8<br />
Golf 20.1 Jogging/Running 15.8<br />
Jogging/Running 19.3 Pilates/Yoga 14.6<br />
Cricket 11.7 Aerobics 12.9<br />
Football 10.7 Netball 9.9<br />
• The top three activities for men and women are identical in terms of<br />
activity type and order of popularity.<br />
• Six of the top ten activities are the same for men and women, these<br />
activities being walking, gardening, swimming, equipment-based<br />
exercise, cycling and jogging/running.<br />
• Unique activities popular with women included dance, pilates/yoga,<br />
aerobics and netball, while fishing, golf, cricket and football were<br />
uniquely popular with men.<br />
12.7%<br />
9.4% 9.3% 8.9% 8.5%<br />
7.3%<br />
6.9% 6.7% 6.4% 6.4% 6.4% 6.3%<br />
Golf<br />
Tramping<br />
Tennis<br />
Pilates/Yoga<br />
Aerobics<br />
Cricket 5<br />
Football 5<br />
Touch Rugby<br />
Netball 5<br />
Canoeing/<br />
Kayaking<br />
Basketball 5<br />
Snow Sports 6<br />
416,223 306,343 304,675 290,753 277,866 237,965 227,265 219,952 209,769 209,652 209,428 206,073<br />
1 Equipment-based exercise includes the use of exercise equipment (e.g. exercycles,<br />
treadmills, weights) at home or at the gym.<br />
2 Cycling includes mountain biking and cycling.<br />
3 Fishing includes freshwater and marine fishing.<br />
4 Dance includes several dance genres (e.g. ballet, hip-hop, disco, ballroom, modern, tap).<br />
5 Includes both indoor and outdoor versions of this activity.<br />
6 Snow sports includes skiing and snowboarding.
8<br />
The 10 Most Popular Sport and Recreation Activities Participated In Over 12 Months by Age<br />
16 – 24 years %<br />
25 – 34 years %<br />
Swimming 47.3<br />
Walking 42.6<br />
Equipment-based exercise 34.1<br />
Jogging/Running 32.5<br />
Dance 28.2<br />
Cycling 22.5<br />
Basketball 22.2<br />
Rugby 19.7<br />
Touch 19.2<br />
Tennis 17.6<br />
Walking 65.0<br />
Swimming 44.0<br />
Gardening 34.6<br />
Equipment-based exercise 32.4<br />
Jogging/Running 29.4<br />
Cycling 26.8<br />
Fishing 20.7<br />
Dance 19.9<br />
Golf 15.8<br />
Aerobics 14.2<br />
35 – 49 years %<br />
Walking 64.8<br />
Gardening 45.1<br />
Swimming 40.9<br />
Cycling 32.0<br />
Equipment-based exercise 27.3<br />
Fishing 24.9<br />
Jogging/Running 18.7<br />
Dance 16.6<br />
Golf 12.2<br />
Tramping 10.7<br />
50 – 64 years %<br />
Walking 72.5<br />
Gardening 55.0<br />
Swimming 24.4<br />
Equipment-based exercise 24.4<br />
Cycling 19.9<br />
Fishing 18.8<br />
Golf 14.0<br />
Dance 12.3<br />
Tramping 10.5<br />
Pilates/Yoga 7.3<br />
≥ 65 years %<br />
Walking 73.3<br />
Gardening 65.7<br />
Swimming 15.3<br />
Equipment-based exercise 14.0<br />
Bowls 13.5<br />
Fishing 11.0<br />
Golf 10.5<br />
Dance 7.9<br />
Callisthenics 6.4<br />
Cycling 6.1<br />
• Popular activities common across all age groups are walking, swimming,<br />
equipment-based exercise, jogging/running and dance.<br />
• Basketball, rugby, touch and tennis are popular activities among the youngest<br />
age group, 16 to 24 year olds.<br />
• After the age of 25 years, gardening, fishing and golf become popular activities.<br />
• Bowls is a popular activity for those aged 65 years and over.<br />
• Walking is a common activity across all age groups but becomes the most<br />
prominent activity after the age of 25 years.<br />
• Dance is another highly popular activity across age groups, especially among<br />
adults aged 16 to 24 years old.
ACTIVE <strong>NZ</strong> SURVEY KEY RESULTS 9<br />
The 10 Most Popular Sport and Recreation Activities Participated In Over 12 Months by Ethnicity<br />
Māori %<br />
Walking 54.0<br />
Swimming 38.5<br />
Gardening 32.2<br />
Fishing 24.9<br />
Equipment-based exercise 23.0<br />
Dance 22.2<br />
Cycling 20.4<br />
Touch 19.3<br />
Jogging/Running 19.2<br />
Rugby 14.4<br />
Pacific %<br />
Walking 48.3<br />
Equipment-based exercise 24.8<br />
Swimming 23.8<br />
Touch 22.4<br />
Dance 20.9<br />
Volleyball 20.9<br />
Rugby 17.2<br />
Gardening 16.8<br />
Jogging/Running 16.7<br />
Basketball 13.6<br />
Total Population %<br />
Walking 64.1<br />
Gardening 43.2<br />
Swimming 34.8<br />
Equipment-based exercise 26.5<br />
Cycling 22.7<br />
Fishing 19.3<br />
Jogging/Running 17.5<br />
Dance 16.8<br />
Golf 12.7<br />
Tramping 9.4<br />
<strong>NZ</strong> European %<br />
Walking 66.6<br />
Gardening 49.2<br />
Swimming 35.4<br />
Equipment-based exercise 27.8<br />
Cycling 26.0<br />
Fishing 21.1<br />
Jogging/Running 17.8<br />
Dance 16.1<br />
Golf 14.2<br />
Tramping 10.8<br />
Other %<br />
Walking 72.8<br />
Gardening 44.9<br />
Swimming 39.7<br />
Equipment-based exercise 27.9<br />
Cycling 21.9<br />
Jogging/Running 18.7<br />
Dance 15.4<br />
Fishing 14.7<br />
Tramping 11.1<br />
Football 10.5<br />
Asian %<br />
Walking 58.5<br />
Swimming 32.7<br />
Equipment-based exercise 25.3<br />
Gardening 23.6<br />
Jogging/Running 16.8<br />
Dance 16.4<br />
Pilates/Yoga 14.9<br />
Badminton 13.9<br />
Basketball 12.6<br />
Cycling 11.1<br />
• Compared with the total New Zealand<br />
population 7 , activities popular with specific<br />
ethnic groups included:<br />
−<br />
touch and rugby for Màori adults;<br />
− touch, volleyball, rugby and basketball for<br />
Pacific adults;<br />
− pilates/yoga, badminton and basketball for<br />
Asian adults; and<br />
−<br />
football for Other adults.<br />
• Popular activities common across all ethnic groups<br />
included walking, swimming, gardening and<br />
equipment-based exercise.<br />
7 Because participants could report multiple ethnicities, the same<br />
person can be represented in different ethnic groups (e.g. Màori<br />
and <strong>NZ</strong> European). Consequently, ethnic-specific findings should<br />
only be compared with estimates for the total population and not<br />
between ethnic groups.
10<br />
Participation in Sport or Recreation Activities Over Different Timeframes<br />
Percentage of adults who took part in at least one sport or recreation activity…<br />
OVER<br />
12-MONTHS<br />
Total Population<br />
Gender<br />
Men<br />
Women<br />
Age<br />
16-24<br />
25-34<br />
35-49<br />
50-64<br />
≥ 65<br />
Ethnicity<br />
Màori<br />
Asian<br />
<strong>NZ</strong> European<br />
Pacific<br />
Other<br />
Among adults:<br />
96.0<br />
95.7<br />
96.3<br />
97.2<br />
97.0<br />
96.7<br />
96.0<br />
92.8<br />
97.2<br />
97.2<br />
96.0<br />
92.1<br />
95.4<br />
• the percentage who participated<br />
in at least one sport or recreation<br />
activity decreased as the<br />
timeframe shortened (i.e. year,<br />
month, week), irrespective of<br />
gender, age or ethnicity;<br />
• during any week, 79 percent of<br />
adults participated in at least one<br />
sport or recreation activity;<br />
• over 12 months, the participation<br />
level increased to 96 percent,<br />
indicating that most adults are<br />
involved in sport or recreation;<br />
Total Population<br />
Gender<br />
Men<br />
Women<br />
Age<br />
16-24<br />
25-34<br />
35-49<br />
50-64<br />
≥ 65<br />
Ethnicity<br />
Màori<br />
Asian<br />
<strong>NZ</strong> European<br />
Pacific<br />
Other<br />
PER MONTH<br />
90.0<br />
89.2<br />
90.8<br />
89.8<br />
90.3<br />
89.9<br />
90.6<br />
89.4<br />
89.0<br />
88.8<br />
91.4<br />
80.0<br />
89.0<br />
• the level of participation did not<br />
differ substantially across different<br />
age groups or between men and<br />
women; and<br />
• compared with the total population,<br />
a lower percentage of Pacific adults<br />
took part in activities across<br />
all timeframes.<br />
Total Population<br />
Gender<br />
Men<br />
Women<br />
Age<br />
16-24<br />
25-34<br />
35-49<br />
50-64<br />
≥ 65<br />
Ethnicity<br />
Màori<br />
Asian<br />
<strong>NZ</strong> European<br />
Pacific<br />
Other<br />
PER WEEK<br />
79.0<br />
77.7<br />
80.3<br />
78.9<br />
77.6<br />
76.8<br />
80.9<br />
82.1<br />
77.5<br />
73.0<br />
80.7<br />
69.1<br />
78.9
ACTIVE <strong>NZ</strong> SURVEY KEY RESULTS 11<br />
Number of Sport and Recreation Activities Participated In<br />
Over 12 Months<br />
Percentage of adults who took part in…<br />
One sport or<br />
recreation<br />
activity<br />
Two sport or<br />
recreation<br />
activities<br />
Three or<br />
more sport<br />
or recreation<br />
activities<br />
Total Population 96.0 84.7 69.3<br />
Gender<br />
Men 95.7 84.9 71.1<br />
Women 96.3 84.6 67.7<br />
Age<br />
16-24 97.2 90.3 81.5<br />
25-34 97.0 89.3 79.3<br />
35-49 96.7 85.7 74.2<br />
50-64 96.0 81.9 60.7<br />
≥ 65 92.8 76.3 49.3<br />
Ethnicity<br />
Màori 97.2 83.6 70.1<br />
Asian 97.2 80.4 57.1<br />
<strong>NZ</strong> European 96.0 86.4 71.9<br />
Pacific 92.1 75.6 60.8<br />
Other 95.4 82.5 69.0<br />
Average<br />
number of sport<br />
and recreation<br />
activities<br />
4.6<br />
5.0<br />
4.2<br />
6.5<br />
5.4<br />
4.8<br />
3.6<br />
2.7<br />
5.2<br />
3.8<br />
4.7<br />
4.0<br />
4.4<br />
Over 12 months:<br />
• 85 percent of adults participated<br />
in at least two different sport and<br />
recreation activities;<br />
• men and women participated in a<br />
similar number of activities;<br />
• fewer people in the older age<br />
groups (50 years and over)<br />
participated in at least three sport<br />
or recreation activities;<br />
• the average number of activities<br />
participated in over 12 months<br />
decreased with increasing age, from<br />
6.5 for 16 to 24 year olds to 2.7 for<br />
those aged 65 years and over; and<br />
• compared with the total population,<br />
all ethnic groups achieved a similar<br />
percent estimate for participation<br />
in at least one sport or recreation<br />
activity, but participation in three<br />
or more activities was lower among<br />
Pacific and Asian adults.
12<br />
Participation in an Organised Competition or Event Over 12 Months<br />
Participation in an Organised Competition or Event<br />
Total Population 36.9<br />
Gender<br />
%<br />
Men 44.5<br />
Women 29.8<br />
Ethnicity<br />
Màori 44.2<br />
Pacific 41.2<br />
<strong>NZ</strong> European 38.6<br />
Asian 21.5<br />
Other 27.3<br />
Over 12 months:<br />
• over one-third (36.9%) of all adults participated in at<br />
least one organised competition or event;<br />
• men were more likely to participate in an organised<br />
event or competition than women;<br />
• participation levels in an organised event or competition<br />
decreased with increasing age; and<br />
• compared with the total population, participation in<br />
an organised competition or event was higher among<br />
Màori and Pacific adults, but lower among Asian and<br />
Other adults.<br />
Participation in an Organised Competition or Event by Age<br />
≥65yrs<br />
25.2%<br />
50-60yrs<br />
32.0% 35-49yrs<br />
35.7%<br />
25-34yrs<br />
40.2% 16-24yrs<br />
53.1%<br />
20% 30% 40% 50%<br />
60%
ACTIVE <strong>NZ</strong> SURVEY KEY RESULTS 13<br />
Involvement in a Sport or<br />
Recreation Club or Centre<br />
Over a Month<br />
Various clubs and centres exist for people to take part in sport<br />
and recreation activities.<br />
The <strong>Active</strong> <strong>NZ</strong> <strong>Survey</strong> examined the percentage of all adults<br />
who were members of the following clubs and centres:<br />
• sport or physical activity club;<br />
• gym or fitness centre;<br />
• social club/work team; and<br />
• other type of club/centre.<br />
On this page the percentage of all adults who were members<br />
of any type of club or centre and the percentage of all adults<br />
involved with a specific club or centre are presented.<br />
Member of Any Club or Centre<br />
Total Population 34.9<br />
Gender<br />
Men 38.6<br />
Women 31.6<br />
Age<br />
16-24 51.6<br />
25-34 32.3<br />
35-49 30.6<br />
50-64 30.3<br />
≥ 65 34.5<br />
Ethnicity<br />
Màori 37.7<br />
Pacific 36.5<br />
<strong>NZ</strong> European 35.9<br />
Asian 29.2<br />
Other 27.9<br />
During any month:<br />
• over one-third (34.9%) of all adults were members of<br />
clubs or centres;<br />
• one in every two adults aged 16 to 24 years were<br />
members of clubs or centres; and<br />
• compared with the total population, a higher percentage<br />
of Màori but fewer Asian and Other adults were<br />
members of clubs or centres.<br />
%<br />
Member of a Specific Club or Centre Type 8<br />
Sport/Physical activity club 17.9<br />
Gym/Fitness centre 11.8<br />
Social club/work team 5.1<br />
Other type of club 6.3<br />
Among the different types of clubs and centres:<br />
• almost one in five adults was a member of a sport or physical activity club; and<br />
• the second most common club or centre with which adults engage was a gym<br />
or fitness centre.<br />
Percentage of adults who received<br />
instruction from a Coach, Instructor,<br />
Teacher or Trainer…<br />
Total Population 39.9<br />
Gender<br />
Men 37.2<br />
Women 42.4<br />
Age<br />
16-24 67.3<br />
25-34 47.0<br />
35-49 37.7<br />
50-64 30.0<br />
≥ 65 20.9<br />
Ethnicity<br />
Màori 45.1<br />
Pacific 42.9<br />
<strong>NZ</strong> European 40.1<br />
Asian 36.5<br />
Other 37.5<br />
%<br />
Received Instruction for a Sport or<br />
Recreation Activity Over 12 Months<br />
Over 12 months:<br />
• 40 percent of adults<br />
received instruction from<br />
a coach, instructor, teacher<br />
or trainer;<br />
• receiving instruction was<br />
most common among 16 to<br />
24 year olds;<br />
• receiving instruction<br />
decreased with increasing<br />
age; and<br />
• compared with the total<br />
population, a higher<br />
percentage of Màori but a<br />
lower percentage of Asian<br />
and Other adults received<br />
instruction for a sport or<br />
recreation activity.<br />
8 Participants could choose multiple club/centre types noted in this<br />
table, therefore, when the percentages for each club/centre type<br />
are summated they do not equal 34.9 percent.
14<br />
VOLUNTEERS<br />
Over 12 months:<br />
• one in four adults volunteered for a sport<br />
or recreation activity, equating to 829,735<br />
sport and recreation volunteers;<br />
• a similar percentage of men and women<br />
volunteered;<br />
• parent helper and coach were the most<br />
common roles;<br />
• volunteering levels peaked in the 35 to 49<br />
year old age group; and<br />
• compared with the total population,<br />
volunteering levels were higher among<br />
Màori and Pacific adults and lower among<br />
Asian and Other adults.<br />
Volunteer Levels<br />
Among All Adults<br />
Total Population 25.3<br />
Gender<br />
Men 24.9<br />
Women 25.8<br />
Age<br />
16-24 27.3<br />
25-34 25.9<br />
35-49 34.8<br />
50-64 20.1<br />
≥ 65 12.5<br />
Ethnicity<br />
%<br />
Màori 33.2<br />
Pacific 31.9<br />
<strong>NZ</strong> European 26.1<br />
Asian 13.2<br />
Other 24.3<br />
Most Common Roles<br />
Among Volunteers<br />
%<br />
Coach/Trainer/Teacher/Instructor 46.5<br />
Parent helper 36.9<br />
Referee/Judge/Official/Umpire 31.0<br />
Administrator/Secretary /Committee<br />
member<br />
26.3<br />
Among the 25.3 percent of adults who did volunteer:<br />
• the most common role was coach/teacher/trainer,<br />
followed by, in sequential order, parent helper,<br />
referee and administration-based roles.<br />
Most Common Volunteer Roles Among All Adults<br />
12<br />
10<br />
8<br />
11.8<br />
%<br />
6<br />
4<br />
9.3<br />
7.9<br />
6.7<br />
2<br />
0<br />
Coach/Trainer/<br />
Teacher/Instructor<br />
Parent helper<br />
Referee/Judge/<br />
Official/Umpire<br />
Administrator/Secretary/<br />
Committee member<br />
Number of New Zealand adults volunteering<br />
386,025 306,243 257,251 218,334
ACTIVE <strong>NZ</strong> SURVEY KEY RESULTS 15<br />
NATIONAL PHYSICAL<br />
ACTIVITY GUIDELINES<br />
Physical Activity Levels<br />
New Zealand Physical Activity Guidelines state that adults<br />
should participate in at least 30 minutes of moderate-intensity<br />
physical activity 9 on most, if not on all days of the week.<br />
To meet this guideline, participation in at least 30 minutes of moderate intensity<br />
physical activity on five or more days of the week was required. Consequently,<br />
this guideline is referred to as the 30 x 5 recommendation.<br />
48.2%<br />
(1,578,046 adults)<br />
30 x 5 Guideline Met<br />
12.7 %<br />
(416,419 adults)<br />
Inactive<br />
39.1%<br />
(1,281,265 adults)<br />
Some Activity<br />
Adults were categorised into<br />
one of three groups:<br />
1. 30 x 5 Guideline Met<br />
Adults who achieved<br />
30 minutes of moderate<br />
intensity physical activity on<br />
at least five days out of seven.<br />
2. Some Activity<br />
Adults who did not meet the<br />
30 x 5 recommendation but<br />
did achieve at least 30 minutes<br />
of moderate intensity physical<br />
activity over seven days.<br />
3. Inactive<br />
Adults who, over seven days,<br />
achieved less than 30 minutes<br />
of moderate-intensity physical<br />
activity in total.<br />
9 Moderate intensity physical activity will cause<br />
a slight, but noticeable, increase in breathing<br />
and heart rate.
16<br />
Physical Activity Levels<br />
by Gender and Age<br />
30 x 5<br />
Guideline Met<br />
%<br />
Some<br />
Activity<br />
%<br />
• Nearly half of all adults met the 30 x 5 physical activity guideline – the<br />
minimum level of physical activity advocated in New Zealand for adults; and<br />
• a higher percentage of men than women met this guideline.<br />
Inactive<br />
%<br />
Total Population 48.2 39.1 12.7<br />
Gender<br />
Men 52.3 37.0 10.8<br />
Women 44.4 41.1 14.5<br />
Age<br />
16-24 43.6 47.3 9.1<br />
25-34 50.1 38.9 11.1<br />
35-49 54.6 35.0 10.4<br />
50-64 52.0 36.4 11.5<br />
≥ 65 34.2 41.8 24.0<br />
Physical Activity Levels<br />
by Ethnicity<br />
60<br />
50<br />
40<br />
% 30<br />
20<br />
10<br />
0<br />
%<br />
30 x 5 Guideline Met Group<br />
50<br />
40<br />
30<br />
20<br />
10<br />
0<br />
53.5<br />
Māori<br />
Inactive Group<br />
Pacific<br />
Some Activity Group<br />
52.6 48.9 37.8 49.2<br />
<strong>NZ</strong><br />
European<br />
Asian<br />
Other<br />
34.7 36.5 40.0 41.2 35.1<br />
Māori Pacific <strong>NZ</strong><br />
European<br />
Asian<br />
Other<br />
<strong>NZ</strong><br />
population<br />
48.2%<br />
<strong>NZ</strong><br />
population<br />
39.1%<br />
25<br />
20<br />
15<br />
%<br />
10<br />
5<br />
0<br />
11.8 10.9 11.2 21.0 15.7<br />
Māori Pacific <strong>NZ</strong><br />
European<br />
Asian<br />
Other<br />
<strong>NZ</strong><br />
population<br />
12.7%<br />
Compared with the New Zealand population:<br />
• most ethnic groups had a similar percentage of adults in the 30 x 5 Guideline<br />
Met and Some Activity groups; and<br />
• a higher percentage of Asian adults were in the Inactive group.
ACTIVE <strong>NZ</strong> SURVEY KEY RESULTS 17<br />
Achieving 30 Minutes of Moderate Intensity Physical Activity<br />
a Day Through Different Physical Activity Domains<br />
Adults can achieve the 30 x 5 recommendation through<br />
different physical activity domains. These physical activity<br />
domains include:<br />
• sport and recreation activities (e.g. swimming);<br />
• occupational activity (e.g. farming);<br />
• active travel (e.g. biking to work); and<br />
• unpaid work/other physical activities (e.g. DIY).<br />
30 x 5<br />
Guideline<br />
Met<br />
Some<br />
Activity<br />
Inactive<br />
Among the 48.2 percent of adults in the 30 x 5 Guideline Met group...<br />
42.2 percent met the 30 x 5<br />
recommendation through their<br />
sport and recreation activity<br />
33.1 percent met the 30 x 5<br />
recommendation through their<br />
occupational activity<br />
7.9 percent met the 30 x 5<br />
recommendation through their<br />
active travel<br />
18.2 percent met the 30 x 5<br />
recommendation through their<br />
unpaid work/other activities<br />
• When physical activity domains are examined individually, adults are more likely<br />
to achieve this minimum level of physical activity (30 x 5) through sport and<br />
recreation activity (42.2%) compared with the other physical activity domains.<br />
The Number of Days Adults Achieved at Least 30 Minutes a Day<br />
of Moderate Intensity Physical Activity<br />
%<br />
25<br />
20<br />
15<br />
10<br />
5<br />
14.8<br />
8.5<br />
9.2<br />
9.6<br />
9.8<br />
12.7<br />
13.8<br />
21.7<br />
• Nearly half (48.2%) of all adults achieved 30 minutes of moderate intensity<br />
physical activity on at least five days a week.<br />
• Almost one-fifth of all adults were close to meeting the 30 x 5<br />
recommendation; they just needed to do an additional 30 minutes on one or<br />
two more days a week.<br />
• Fifteen percent of adults did not engage in 30 minutes of moderate intensity<br />
physical activity on any day of the week.<br />
0<br />
0 1 2 3 4 5 6 7
18<br />
SPORT AND<br />
RECREATION TRENDS<br />
2000/01 – <strong>2007</strong>/<strong>08</strong>
ACTIVE <strong>NZ</strong> SURVEY KEY RESULTS 19<br />
INTRODUCTION<br />
Comparisons<br />
The information in this section outlines trend data (2000/01 to <strong>2007</strong>/<strong>08</strong>) for three sport and<br />
recreation indicators:<br />
1.<br />
sport and recreation participation over 12 months;<br />
2. level of volunteering over 12 months; and<br />
3. involvement levels in a club or centre over a month.<br />
2000/01 <strong>Survey</strong> versus <strong>2007</strong>/<strong>08</strong> <strong>Survey</strong><br />
The 2000/01 survey, referred to as the ‘New Zealand Sport and Physical Activity <strong>Survey</strong>’, was conducted by Hillary<br />
Commission. This survey was subsequently modified by SPARC to collect more in-depth, robust sport, recreation, and<br />
physical activity data that would inform SPARC’s mandate. The survey was renamed as <strong>Active</strong> <strong>NZ</strong> <strong>Survey</strong> to reflect these<br />
differences. Hence, the <strong>2007</strong>/<strong>08</strong> <strong>Active</strong> <strong>NZ</strong> <strong>Survey</strong> is the first national survey conducted by SPARC. The key modifications<br />
between the New Zealand Sport and Physical Activity <strong>Survey</strong> and the <strong>Active</strong> <strong>NZ</strong> <strong>Survey</strong> are presented in the table below.<br />
2000/01 <strong>NZ</strong>SPAS <strong>2007</strong>/<strong>08</strong> <strong>Active</strong> <strong>NZ</strong> <strong>Survey</strong><br />
Measurement tool(s) Sport and Recreation <strong>Survey</strong> Modified version of the Sport and Recreation <strong>Survey</strong> AND<br />
a seven-day physical activity recall diary<br />
Sample Population<br />
Data Collection<br />
Children (5 to 17 years old) and<br />
Adults (≥18 years old)<br />
Self-report (adult data)<br />
Parental proxy reports (child data)<br />
Adults only ( ≥16 years old)<br />
Self-report (adult data)<br />
For the comparisons presented in this report to be made the <strong>2007</strong>/<strong>08</strong> <strong>Active</strong> <strong>NZ</strong> data were adjusted in two ways.<br />
1. 16 to 17 year olds were excluded (as the 2000/01 survey collected information only from adults aged 18 years and over<br />
while the <strong>Active</strong> <strong>NZ</strong> <strong>Survey</strong> interviewed adults aged 16 years and over).<br />
2. A wider range of sport and recreation activities was examined in the <strong>2007</strong>/<strong>08</strong> survey compared with the 2000/01 survey<br />
(e.g. dance). The <strong>2007</strong>/<strong>08</strong> survey activity list was therefore reduced to match the sport and recreation activities list from<br />
the 2000/01 survey.
20<br />
TRENDS<br />
The comparison analyses indicate that engagement in sport and recreation has remained stable when<br />
the margin of error for each survey (±2%) is taken into account. In particular, in 2000/01 and <strong>2007</strong>/<strong>08</strong><br />
a similar percentage of adults had:<br />
• participated in at least one sport or recreation activity per year;<br />
• been sport and recreation volunteers; and<br />
• been members of clubs or centres to participate in sport and recreation activities.<br />
Sport and Recreation Participation<br />
Percentage of New Zealand adults who … 2000/01 <strong>NZ</strong>SPAS <strong>2007</strong>/<strong>08</strong> <strong>Active</strong> <strong>NZ</strong><br />
participated in at least one sport or recreation<br />
activity over 12 months.<br />
97.9 95.8<br />
Volunteer Levels<br />
Percentage of New Zealand adults who … 2000/01 <strong>NZ</strong>SPAS <strong>2007</strong>/<strong>08</strong> <strong>Active</strong> <strong>NZ</strong><br />
had been volunteers for a sport or recreation<br />
activity over 12 months.<br />
27.2 24.9<br />
Member of a Club or Centre<br />
Percentage of New Zealand adults who … 2000/01 <strong>NZ</strong>SPAS <strong>2007</strong>/<strong>08</strong> <strong>Active</strong> <strong>NZ</strong><br />
had been members of clubs/centres to participate<br />
in a sport or recreation activity per month.<br />
35.1 33.7<br />
Note: As adjustments were made to the <strong>2007</strong>/<strong>08</strong> <strong>Active</strong> <strong>NZ</strong> dataset to allow comparative analyses, the<br />
<strong>2007</strong>/<strong>08</strong> percentages noted in the tables above differ to those mentioned earlier in this report which<br />
were based on the entire sample (≥16 years) and the complete <strong>2007</strong>/<strong>08</strong> survey activity list.
ACTIVE <strong>NZ</strong> SURVEY KEY RESULTS 21<br />
UPCOMING ACTIVE <strong>NZ</strong><br />
SURVEY PUBLICATIONS<br />
Reports<br />
Regional Sports Trusts reports<br />
Sport and recreation activity reports<br />
Specialist reports<br />
Full report<br />
Content<br />
An overview of sport and recreation participation and<br />
physical activity for 17 regions.<br />
Topline information specific to individual sport and<br />
recreation activities with high participation levels.<br />
Content will include who took part in activity, where,<br />
at what intensity and for what length of time.<br />
An overview of sport and recreation participation,<br />
physical activity levels, involvement in sport<br />
and recreation as a volunteer, club/centre<br />
member and in organised events/competitions<br />
for specific demographic groups (e.g. Màori profile,<br />
volunteer profile).<br />
A full report consisting of descriptive findings with<br />
statistical analyses.
22<br />
PO Box 2251, Wellington, New Zealand<br />
Phone: +64 4 472 8058 Fax: +64 4 471 <strong>08</strong>13<br />
www.sparc.org.nz<br />
113713 – 11/20<strong>08</strong>