

MnrAq
MnrAq
MnrAq

You also want an ePaper? Increase the reach of your titles
YUMPU automatically turns print PDFs into web optimized ePapers that Google loves.
Annex 3 201<br />
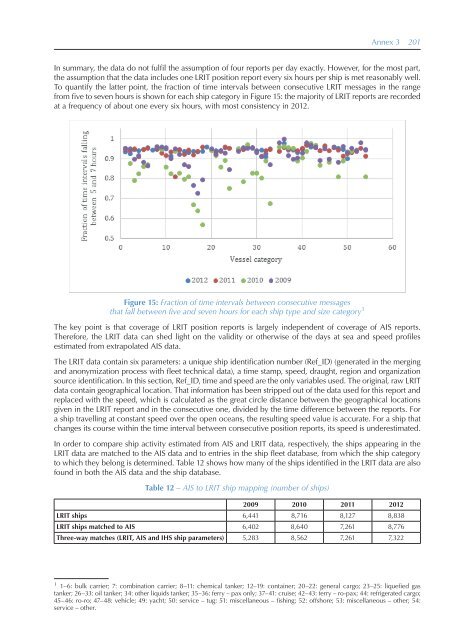
In summary, the data do not fulfil the assumption of four reports per day exactly. However, for the most part,<br />
the assumption that the data includes one LRIT position report every six hours per ship is met reasonably well.<br />
To quantify the latter point, the fraction of time intervals between consecutive LRIT messages in the range<br />
from five to seven hours is shown for each ship category in Figure 15: the majority of LRIT reports are recorded<br />
at a frequency of about one every six hours, with most consistency in 2012.<br />
Figure 15: Fraction of time intervals between consecutive messages<br />
that fall between five and seven hours for each ship type and size category 1<br />
The key point is that coverage of LRIT position reports is largely independent of coverage of AIS reports.<br />
Therefore, the LRIT data can shed light on the validity or otherwise of the days at sea and speed profiles<br />
estimated from extrapolated AIS data.<br />
The LRIT data contain six parameters: a unique ship identification number (Ref_ID) (generated in the merging<br />
and anonymization process with fleet technical data), a time stamp, speed, draught, region and organization<br />
source identification. In this section, Ref_ID, time and speed are the only variables used. The original, raw LRIT<br />
data contain geographical location. That information has been stripped out of the data used for this report and<br />
replaced with the speed, which is calculated as the great circle distance between the geographical locations<br />
given in the LRIT report and in the consecutive one, divided by the time difference between the reports. For<br />
a ship travelling at constant speed over the open oceans, the resulting speed value is accurate. For a ship that<br />
changes its course within the time interval between consecutive position reports, its speed is underestimated.<br />
In order to compare ship activity estimated from AIS and LRIT data, respectively, the ships appearing in the<br />
LRIT data are matched to the AIS data and to entries in the ship fleet database, from which the ship category<br />
to which they belong is determined. Table 12 shows how many of the ships identified in the LRIT data are also<br />
found in both the AIS data and the ship database.<br />
Table 12 – AIS to LRIT ship mapping (number of ships)<br />
2009 2010 2011 2012<br />
LRIT ships 6,441 8,716 8,127 8,838<br />
LRIT ships matched to AIS 6,402 8,640 7,261 8,776<br />
Three-way matches (LRIT, AIS and IHS ship parameters) 5,283 8,562 7,261 7,322<br />
1 1–6: bulk carrier; 7: combination carrier; 8–11: chemical tanker; 12–19: container; 20–22: general cargo; 23–25: liquefied gas<br />
tanker; 26–33: oil tanker; 34: other liquids tanker; 35–36: ferry – pax only; 37–41: cruise; 42–43: ferry – ro-pax; 44: refrigerated cargo;<br />
45–46: ro-ro; 47–48: vehicle; 49: yacht; 50: service – tug; 51: miscellaneous – fishing; 52: offshore; 53: miscellaneous – other; 54:<br />
service – other.