Download the documentation - True BASIC
Download the documentation - True BASIC
Download the documentation - True BASIC

You also want an ePaper? Increase the reach of your titles
YUMPU automatically turns print PDFs into web optimized ePapers that Google loves.
Frequency Distributions 33<br />
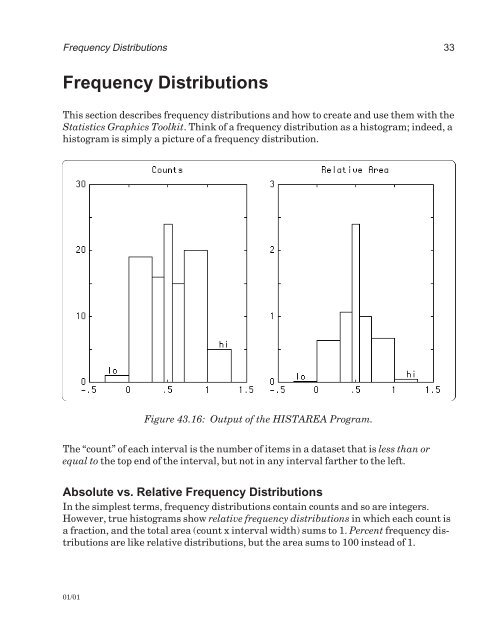
Frequency Distributions<br />
This section describes frequency distributions and how to create and use <strong>the</strong>m with <strong>the</strong><br />
Statistics Graphics Toolkit. Think of a frequency distribution as a histogram; indeed, a<br />
histogram is simply a picture of a frequency distribution.<br />
Figure 43.16: Output of <strong>the</strong> HISTAREA Program.<br />
The “count” of each interval is <strong>the</strong> number of items in a dataset that is less than or<br />
equal to <strong>the</strong> top end of <strong>the</strong> interval, but not in any interval far<strong>the</strong>r to <strong>the</strong> left.<br />
Absolute vs. Relative Frequency Distributions<br />
In <strong>the</strong> simplest terms, frequency distributions contain counts and so are integers.<br />
However, true histograms show relative frequency distributions in which each count is<br />
a fraction, and <strong>the</strong> total area (count x interval width) sums to 1. Percent frequency distributions<br />
are like relative distributions, but <strong>the</strong> area sums to 100 instead of 1.<br />
01/01