Growth Opportunities and Challenges for the Chilean Copper ...
Growth Opportunities and Challenges for the Chilean Copper ...
Growth Opportunities and Challenges for the Chilean Copper ...

Create successful ePaper yourself
Turn your PDF publications into a flip-book with our unique Google optimized e-Paper software.
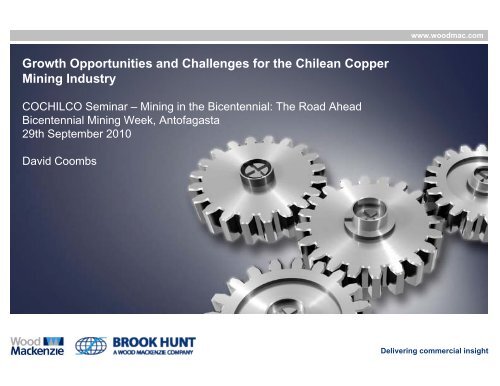
www.woodmac.com<br />
<strong>Growth</strong> <strong>Opportunities</strong> <strong>and</strong> <strong>Challenges</strong> <strong>for</strong> <strong>the</strong> <strong>Chilean</strong> <strong>Copper</strong><br />
Mining Industry<br />
COCHILCO Seminar – Mining in <strong>the</strong> Bicentennial: The Road Ahead<br />
Bicentennial Mining Week, Antofagasta<br />
29th September 2010<br />
David Coombs<br />
Delivering commercial insight
www.woodmac.com<br />
Wood Mackenzie Disclaimer<br />
This presentation has been prepared by Brook Hunt, a Wood Mackenzie Limited company.<br />
The in<strong>for</strong>mation upon which this presentation is based comes from our own experience, knowledge<br />
<strong>and</strong> databases. The opinions expressed in this presentation are those of Brook Hunt. They have<br />
been arrived at following careful consideration <strong>and</strong> enquiry but we do not guarantee <strong>the</strong>ir fairness,<br />
completeness or accuracy. The opinions, as of this date, are subject to change. We do not accept<br />
any liability <strong>for</strong> your reliance upon <strong>the</strong>m.<br />
© Wood Mackenzie 2<br />
Delivering commercial insight
www.woodmac.com<br />
Agenda – Can Chile Maintain its Market Share of Global <strong>Copper</strong> Supply ?<br />
1<br />
<strong>Chilean</strong> <strong>Copper</strong> Mining Today - Global Context<br />
2 <strong>Challenges</strong> Facing <strong>the</strong> Mining Sector<br />
3<br />
<strong>Opportunities</strong> <strong>for</strong> <strong>Growth</strong><br />
4<br />
Conclusion<br />
© Wood Mackenzie 3<br />
Delivering commercial insight
www.woodmac.com<br />
Agenda<br />
1<br />
<strong>Chilean</strong> <strong>Copper</strong> Mining Today - Global Context<br />
2 <strong>Challenges</strong> Facing <strong>the</strong> Mining Sector<br />
3<br />
<strong>Opportunities</strong> <strong>for</strong> <strong>Growth</strong><br />
4<br />
Conclusion – Positive Outlook<br />
© Wood Mackenzie 4<br />
Delivering commercial insight
www.woodmac.com<br />
Chile Will Produce 32% of Global Mined <strong>Copper</strong> in 2010<br />
Can it Maintain its Market Share ?<br />
% of Glob bal<br />
40%<br />
35%<br />
30%<br />
Nitrate t<br />
Industry<br />
American<br />
Investment<br />
Tension with<br />
Investors -<br />
Profit Re-<br />
Distribution<br />
Formation of<br />
CODELCO,<br />
Political Re<strong>for</strong>m,<br />
Foreign Investment<br />
r - <strong>Chilean</strong><br />
Min ned Coppe<br />
25%<br />
20%<br />
15%<br />
10%<br />
5%<br />
0%<br />
1900 1910 1920 1930 1940 1950 1960 1970 1980 1990 2000 2010<br />
Source Brook Hunt, M etallgesellschaft, World Non Ferrous M etals Production <strong>and</strong> Prices - 1700-1976, Schmitz<br />
Source: Brook Hunt, Metallgesllschaft, World Non Ferrous Metals Production <strong>and</strong> Prices – 1700-1976, Schmitz<br />
© Wood Mackenzie 5<br />
Delivering commercial insight
Ore Reserves & Resources >10Mt contained Cu – Operating Mines<br />
<strong>Chilean</strong> assets – 25% In-Situ Cu in Reserves, 75% in Resources<br />
www.woodmac.com<br />
Rese eource Grade Cu% Equivale nt<br />
4.5<br />
4.0<br />
3.5<br />
3.0<br />
25 2.5<br />
2.0<br />
1.5<br />
1.0<br />
0.5<br />
0.0<br />
Tenke-Fungurume SxEw<br />
Kamoto_KOV<br />
Cuajone<br />
Norilsk<br />
KGHM Polish <strong>Copper</strong><br />
Cerro Verde<br />
Olympic Dam<br />
Antamina<br />
Grasberg<br />
Los Bronces<br />
Los Pelambres<br />
Collahuasi<br />
Escondida<br />
Cananea<br />
SCALE<br />
(In-Situ Cu)<br />
50 Mt<br />
20 Mt<br />
5 Mt<br />
Andina<br />
El Teniente<br />
Codelco Norte<br />
0 5,000 10,000 15,000 20,000<br />
Resource Mt<br />
Global <strong>Chilean</strong> Scale<br />
Source: Company Disclosure<br />
© Wood Mackenzie 6<br />
Delivering commercial insight
www.woodmac.com<br />
Ore Reserves <strong>and</strong> Resources – Operating Mines & Projects<br />
New Scale<br />
t<br />
Resou urce Grade Cu u% Equivelant<br />
2.0<br />
1.5<br />
1.0<br />
El Morro<br />
0.5<br />
Caserones<br />
Antucoya<br />
0.0<br />
Los Sulfatos (Inf)<br />
San Enrique Monolito (Inf)<br />
Esperanza<br />
Sierra Gorda -<br />
Cerro Casale Antofagasta<br />
Sierra Gorda - Quadra<br />
SCALE<br />
(In-Situ Cu)<br />
50 Mt<br />
20 Mt<br />
5 Mt<br />
0 5,000 10,000<br />
Resource Mt<br />
O<strong>the</strong>r Greenfield<br />
Projects in Chile<br />
‣Relincho<br />
‣Vizcachitas<br />
‣Barreal Seco<br />
‣Pascua<br />
‣Elenita<br />
‣Santo Domingo<br />
Sur/Iris<br />
‣Inca de Oro<br />
‣El Espino<br />
‣Filipina Gr<strong>and</strong>e<br />
Andina<br />
Codelco Norte<br />
El Teniente<br />
Source: Company Disclosure<br />
Global Base Chile Projects Chile Base Global Projects<br />
© Wood Mackenzie 7<br />
Delivering commercial insight
www.woodmac.com<br />
Chile’s Mines are Competitive<br />
© Wood Mackenzie 8<br />
Delivering commercial insight
www.woodmac.com<br />
Limited capacity in <strong>the</strong> highest cost decile – <strong>the</strong> Vulnerable zone<br />
© Wood Mackenzie 9<br />
Delivering commercial insight
www.woodmac.com<br />
Agenda<br />
1<br />
<strong>Chilean</strong> <strong>Copper</strong> Mining Today - Global Context<br />
2 <strong>Challenges</strong> Facing <strong>the</strong> Mining Sector<br />
3<br />
<strong>Opportunities</strong> <strong>for</strong> <strong>Growth</strong><br />
4<br />
Conclusion – Positive Outlook<br />
© Wood Mackenzie 10<br />
Delivering commercial insight
Chile Provides a Competitive Policy environment in which to Invest<br />
The Fraser Institute Survey of Mining Companies, 2009/10<br />
www.woodmac.com<br />
Policy Potential Index – 13 Measures incl.<br />
Chile<br />
USA (Alaska)<br />
Mexico<br />
Canada (BC)<br />
Peru<br />
China<br />
Zambia<br />
PNG<br />
Indonesia<br />
Mongolia<br />
Congo D.R.<br />
Philippines<br />
0 20 40 60 80 100<br />
Policy Potential Index<br />
Regulation <strong>and</strong> En<strong>for</strong>cement<br />
Environmental Regulation<br />
Fiscal Regime <strong>and</strong> Stability<br />
L<strong>and</strong> Title Issues<br />
Infrastructure<br />
Socioeconomic Agreement<br />
Political Stability<br />
Labour Regulation <strong>and</strong> Availability<br />
Mineral Potential<br />
Security<br />
Source: The Fraser Institute - used with permission<br />
© Wood Mackenzie 11<br />
Delivering commercial insight
www.woodmac.com<br />
Key <strong>Challenges</strong> - Water<br />
© Wood Mackenzie 12<br />
Delivering commercial insight
www.woodmac.com<br />
Key <strong>Challenges</strong> - Power<br />
Courtesy Gas Atacama<br />
© Wood Mackenzie 13<br />
Delivering commercial insight
www.woodmac.com<br />
<strong>Chilean</strong> Power Costs in 2008 Uncompetitive - Gas Supply Related<br />
Future Price Risk considered greater <strong>the</strong>n Supply Risk<br />
2008 Chile hit by gas shortage<br />
PNG<br />
Canada<br />
USA<br />
Zambia<br />
Chile<br />
Philippines<br />
Pol<strong>and</strong><br />
Mexico<br />
Peru<br />
Global<br />
Australia<br />
Indonesia<br />
0 2 4 6 8 10 12 14<br />
Power Cost (c/kWhr)<br />
Global average costs in <strong>the</strong> mining<br />
sector was 7.9c/kWhr in 2008<br />
Power averaged 14.1c/lb of direct<br />
mine-site costs globally (12%),<br />
4.5c/lb of direct smelter costs (21%)<br />
<strong>and</strong> energy, predominantly power,<br />
1.9c/lb at refineries (34%)<br />
Source: Brook Hunt<br />
© Wood Mackenzie 14<br />
Delivering commercial insight
Future Regional Gas Supply – Potentially Leads to Lower Power Prices<br />
www.woodmac.com<br />
16,000<br />
450<br />
mmcfd<br />
14,000<br />
12,000<br />
10,000000<br />
8,000<br />
6,000<br />
4,000<br />
2,000<br />
400<br />
350<br />
300<br />
250<br />
200<br />
150<br />
100<br />
50<br />
Mcmd<br />
0<br />
2000 2005 2010 2015 2020 2025 2030<br />
Bolivia Brazil Non-Pre-Salt Brazil Pre-Salt<br />
Argentina Conventional Argentina Unconventional O<strong>the</strong>r<br />
LNG Regas Capacity<br />
Dem<strong>and</strong> EMS<br />
0<br />
Source: Brook Hunt a Wood Mackenzie Company<br />
© Wood Mackenzie 15<br />
Delivering commercial insight
www.woodmac.com<br />
Potential Regional Excess of Gas – But will it Reach Chile ?<br />
Courtesy Gas Atacama<br />
© Wood Mackenzie 16<br />
Delivering commercial insight
www.woodmac.com<br />
Key <strong>Challenges</strong> - Royalties <strong>and</strong> Taxation<br />
9000 25%<br />
8000<br />
7000<br />
20%<br />
Roy yalties <strong>and</strong> Tax xes $M<br />
6000<br />
5000<br />
4000<br />
3000<br />
2000<br />
15%<br />
10%<br />
5%<br />
Mining as % GDP<br />
1000<br />
0<br />
1994 1996 1998 2000 2002 2004 2006 2008<br />
CODELCO Main 10 Mining Companies Mining % of GDP<br />
0%<br />
Source: Cochilco<br />
© Wood Mackenzie 17<br />
Delivering commercial insight
www.woodmac.com<br />
Agenda<br />
1<br />
<strong>Chilean</strong> <strong>Copper</strong> Mining Today - Global Context<br />
2 <strong>Challenges</strong> Facing <strong>the</strong> Mining Sector<br />
3<br />
<strong>Opportunities</strong> <strong>for</strong> <strong>Growth</strong><br />
4<br />
Conclusion – Positive Outlook<br />
© Wood Mackenzie 18<br />
Delivering commercial insight
www.woodmac.com<br />
The copper price is cyclical <strong>and</strong> over <strong>the</strong> period from <strong>the</strong> 1970s<br />
to mid 2000s was in structural decline, this has now reversed….<br />
450<br />
400<br />
350<br />
300<br />
250<br />
200<br />
150<br />
100<br />
50<br />
0<br />
2009$ Cycle average<br />
price<br />
guidance<br />
offered by<br />
incentive<br />
price analysis,<br />
cost<br />
relationships<br />
are weak<br />
This is a schematic not a <strong>for</strong>ecast<br />
1900 1910 1920 1930 1940 1950 1960 1970 1980 1990 2000 2010 2020 2030<br />
Trough prices<br />
can be<br />
gauged by<br />
reference to<br />
<strong>the</strong> cost curve<br />
© Wood Mackenzie 19<br />
Delivering commercial insight
www.woodmac.com<br />
Escalations in Nominal Capital Costs in US$ (Compound)<br />
Q1 2005 – Q1 2010 Costs have increased by between 20 <strong>and</strong> 40% annually<br />
12%<br />
10%<br />
8%<br />
2005<br />
Qtr Ave 7.4%<br />
Annualised 33%<br />
2006<br />
Qtr Ave 8.7%<br />
Annualised 40%<br />
2007<br />
Qtr Ave 9 1% 2008<br />
Qtr Ave 9.1%<br />
Annualised 42%<br />
2008<br />
Qtr Ave 6.7%<br />
Annualised 30%<br />
2009<br />
Qtr Ave 5.0%<br />
Annualised 22%<br />
Escalation<br />
6%<br />
4%<br />
arterly Capex<br />
2%<br />
Qu<br />
0%<br />
(22) Q1 2005<br />
(23) Q2 2005<br />
(22) Q3 2005<br />
(19) Q4 2005<br />
(25) Q1 2006<br />
(28) Q2 2006<br />
(29) Q3 2006<br />
(35) Q4 2006<br />
(38) Q1 2007<br />
(41) Q2 2007<br />
(39) Q3 2007<br />
(46) Q4 2007<br />
(40) Q1 2008<br />
(41) Q2 2008<br />
(23) Q3 2008<br />
(24) Q4 2008<br />
(21) Q1 2009<br />
(19) Q2 2009<br />
(19) Q3 2009<br />
(12) Q4 2009<br />
(6) Q1 2010<br />
Source Brook Hunt, a Wood Mackenzie Company<br />
Period (Number of Data Points)<br />
© Wood Mackenzie 20<br />
Delivering commercial insight
Capital <strong>and</strong> operating cost escalation has shifted <strong>the</strong> Incentive Price curve up<br />
Required prices at 2009 input costs being double those of 2002<br />
www.woodmac.com<br />
R (c/lb Cu<br />
Price <strong>for</strong> 12% IR<br />
Incentive<br />
320<br />
300<br />
280<br />
260<br />
240<br />
220<br />
200<br />
180<br />
160<br />
140<br />
120<br />
100<br />
80<br />
60<br />
40<br />
20<br />
0<br />
0 500 1000 1500 2000 2500 3000 3500 4000 4500 5000 5500 6000 6500 7000 7500<br />
Cumulative Average Production (Cu/kt/a)<br />
2002 2009<br />
Source Brook Hunt, a Wood Mackenzie Company<br />
© Wood Mackenzie 21<br />
Delivering commercial insight
Long Term Dem<strong>and</strong> <strong>for</strong> Additional Mine Capacity<br />
By 2015 we will require a fur<strong>the</strong>r 2.1Mt mine capacity basis 5% disruptions<br />
By 2025 we anticipate <strong>the</strong> dem<strong>and</strong> <strong>for</strong> an additional 13Mt/a capacity<br />
www.woodmac.com<br />
26<br />
24<br />
Recovera able Mine Coppe er - Mt<br />
22<br />
20<br />
18<br />
16<br />
14<br />
2015<br />
1.2 /2.1 Mt<br />
2020<br />
5.0 / 5.8 Mt<br />
2025<br />
12.5 / 13.11 Mt<br />
Base Case Mine Prodn<br />
(0% Disruption)<br />
Base Case Mine Prodn<br />
(5% Disruption)<br />
Base Case Mine Dem<strong>and</strong><br />
(3.6% CAGR 2009-2025)<br />
12<br />
10<br />
2010<br />
2011<br />
2012<br />
2013<br />
2014<br />
2015<br />
2016<br />
2017<br />
2018<br />
2019<br />
2020<br />
2021<br />
2022<br />
2023<br />
2024<br />
2025<br />
So urce: B ro o k Hunt - A Wo o d M ackenzie Company<br />
© Wood Mackenzie 22<br />
Delivering commercial insight
Ore Reserves <strong>and</strong> Resources – Operations & Projects<br />
New Scale<br />
Resou urce Grade Cu u% Equivelant<br />
2.0<br />
1.5<br />
1.0<br />
El Morro<br />
0.5<br />
Caserones<br />
Antucoya<br />
0.0<br />
Udokan 20MtCu @3.2% Cu eq<br />
Konkola Deep 8.2MtCu @3.8%Cu eq<br />
Aynak<br />
Resolution <strong>Copper</strong><br />
Los Sulfatos (Inf)<br />
San Enrique Monolito (Inf)<br />
Oyu Tolgoi<br />
Reko Diq<br />
Esperanza<br />
Sierra Gorda -<br />
Cerro Casale Antofagasta<br />
Sierra Gorda - Quadra<br />
La Granja<br />
SCALE<br />
(In-Situ Cu)<br />
50 Mt<br />
20 Mt<br />
5 Mt<br />
Cobre Panama (Petaquilla)<br />
0 5,000 10,000<br />
Resource Mt<br />
Pebble<br />
www.woodmac.com<br />
Andina<br />
Codelco Norte<br />
El Teniente<br />
Source: Company Disclosure<br />
Global Base Chile Projects Chile Base Global Projects<br />
© Wood Mackenzie 23<br />
Delivering commercial insight
www.woodmac.com<br />
<strong>Chilean</strong> & Global Mine Projects<br />
<strong>Chilean</strong> Projects Capex Cu<br />
Capital<br />
Intensity Cash Cost Global Projects Capex Cu<br />
Capital<br />
Intensity Cash Cost<br />
$Bn kt/a k$/(t/aCuEq) Quartile $Bn kt/a k$/(t/aCuEq) Quartile<br />
Codelco Norte Agua Rica 2.1 130 11.8 1<br />
- MMH 1.7 165 8.4 3 Antappacay 1.5 160 8.6 3<br />
- Chuqui' UG 1.9 340 4.6 3 Aynak 4.4 320 13.8 -<br />
Andina 230kt/d 4.8 320 13.1 2 Cobre Panama 4.3 255 15.0 1<br />
El Teneinte NNM 1.5 100 13.2 2 El Pachon 2.4 200 10.8<br />
Frieda River 4.2 190 20.3 1<br />
Caserones 2.0 165 10.4 4 La Granja 2.5 500 4.7 2<br />
Cerro Casale 4.2 112 26.3 4 Las Bambas 4.2 400 9.6 2<br />
Collahuasi Ph II 2.5 270 8.4 3 Oyu Tolgoi 4.6 550 7.9 1<br />
El Morro 2.5 170 12.8 1 Pebble 2.8 300 6.7 3<br />
Escondida V <strong>and</strong> VI 5.0 400 12.3 2 Quellaveco 2.8 200 12.5 2<br />
Esperanza 23 2.3 190 10.4 3 Reko Diq 33 3.3 190 15.8 -<br />
Los Bronces exp 2.2 175 11.6 3 Resolution <strong>Copper</strong> 2.5 560 4.0 3<br />
Pascua Lama 1.5 4 26.3 - Rio Blanco 1.4 190 6.3 3<br />
Quebrada Blanca 3.0 200 12.9 - Tampakan 5.2 340 13.8 1<br />
Relincho 1.6 160 8.6 - Toromocho 2.2 210 8.6 2<br />
Sierra Gorda - Q-FNX 2 180 92 9.2 1 Udokan 39 3.9 150 12.0 -<br />
Chile Total 38.7 2951 Global Sample Total 54.3 4845<br />
Chile Average 211 3 Global Sample Average 285 2<br />
Average Wt by Paid Cu 10.9 Average Wt by Paid Cu 9.6<br />
Source: Corporate disclosure, Cochilco estimates <strong>for</strong> CODELCO- May 2010<br />
© Wood Mackenzie 24<br />
Delivering commercial insight
www.woodmac.com<br />
<strong>Chilean</strong> Mine Production <strong>Growth</strong><br />
9<br />
8<br />
r Mine Produc ction - Mt Cu<br />
Coppe<br />
7<br />
6<br />
5<br />
4<br />
3<br />
2<br />
1<br />
0<br />
1995 2000 2005 2010 2015 2020 2025 2030<br />
Operating<br />
In Construction<br />
Highly Probable<br />
Probable<br />
Possible<br />
Source: Brook Hunt a Wood Mackenzie Company<br />
© Wood Mackenzie 25<br />
Delivering commercial insight
www.woodmac.com<br />
Agenda<br />
1<br />
<strong>Chilean</strong> <strong>Copper</strong> Mining Today - Global Context<br />
2 <strong>Challenges</strong> Facing <strong>the</strong> Mining Sector<br />
3<br />
<strong>Opportunities</strong> <strong>for</strong> <strong>Growth</strong><br />
4<br />
Conclusion<br />
© Wood Mackenzie 26<br />
Delivering commercial insight
www.woodmac.com<br />
Key Policy <strong>and</strong> Investor <strong>Challenges</strong><br />
Policy <strong>Challenges</strong><br />
• Maintaining Chiles Competitive Policy Environment<br />
• Water Sustainability<br />
• Power Availability <strong>and</strong> Costs<br />
• Taxation<br />
Investor <strong>Challenges</strong><br />
• Controlling Capital <strong>and</strong> Operating Costs<br />
• Decision Making with Price Uncertainty<br />
© Wood Mackenzie 27<br />
Delivering commercial insight
Potential <strong>Chilean</strong> Global Market Share of Mined <strong>Copper</strong> Production<br />
www.woodmac.com<br />
45%<br />
Chiles as<br />
% Global Min ne Production<br />
40%<br />
35%<br />
30%<br />
25%<br />
20%<br />
15%<br />
10%<br />
5%<br />
0%<br />
2010 2015 2020 2025 2030<br />
+Possibles + Probable Base Case & High Probability<br />
Source: Brook Hunt a Wood Mackenzie Company<br />
© Wood Mackenzie 28<br />
Delivering commercial insight
www.woodmac.com<br />
Brook Hunt<br />
Woburn House<br />
45 High Street<br />
Addlestone<br />
Surrey KT15 1TU<br />
Global Contact Details<br />
Europe +44 (0) 1932 878000<br />
Americas +1 713 470 1600<br />
Asia Pacific +65 6518 0800<br />
Email metals@woodmac.com<br />
Global Offices<br />
Australia - Canada - China - Japan - Malaysia - Russia - Singapore - South Africa - United Arab Emirates - United Kingdom - United States<br />
Wood Mackenzie has been providing its unique range of research products <strong>and</strong> consulting services to <strong>the</strong> Energy industry<br />
<strong>for</strong> over 30 years. Wood Mackenzie provides <strong>for</strong>ward-looking commercial insight that enables clients to make better<br />
business decisions. i For more in<strong>for</strong>mation visit: it www.woodmac.com<br />
© Wood Mackenzie 29<br />
Delivering commercial insight