
Create successful ePaper yourself
Turn your PDF publications into a flip-book with our unique Google optimized e-Paper software.
<strong>Religare</strong> <strong>Morning</strong> <strong>Digest</strong><br />
Septamber 30, 2013<br />
Technical Market View<br />
Recommendation<br />
SYMBOL<br />
RELCAPITAL<br />
Buy/Sell<br />
Sell Fut<br />
CMP 332.2<br />
Initiation range 334 - 335<br />
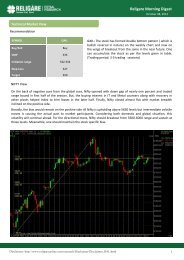
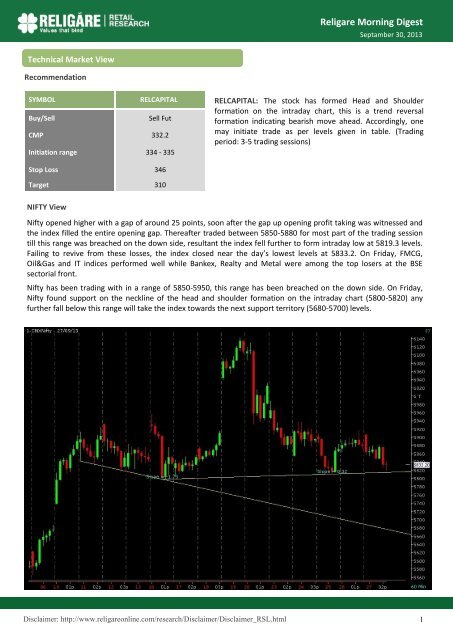
RELCAPITAL: The stock has formed Head and Shoulder<br />
formation on the intraday chart, this is a trend reversal<br />
formation indicating bearish move ahead. Accordingly, one<br />
may initiate trade as per levels given in table. (Trading<br />
period: 3-5 trading sessions)<br />
Stop Loss 346<br />
Target 310<br />
NIFTY View<br />
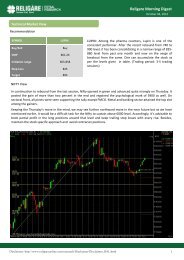
Nifty opened higher with a gap of around 25 points, soon after the gap up opening profit taking was witnessed and<br />
the index filled the entire opening gap. Thereafter traded between 5850-5880 for most part of the trading session<br />
till this range was breached on the down side, resultant the index fell further to form intraday low at 5819.3 levels.<br />
Failing to revive from these losses, the index closed near the day’s lowest levels at 5833.2. On Friday, FMCG,<br />
Oil&Gas and IT indices performed well while Bankex, Realty and Metal were among the top losers at the BSE<br />
sectorial front.<br />
Nifty has been trading with in a range of 5850-5950, this range has been breached on the down side. On Friday,<br />
Nifty found support on the neckline of the head and shoulder formation on the intraday chart (5800-5820) any<br />
further fall below this range will take the index towards the next support territory (5680-5700) levels.<br />
Disclaimer: http://www.religareonline.com/research/Disclaimer/Disclaimer_RSL.html<br />
1
<strong>Religare</strong> <strong>Morning</strong> <strong>Digest</strong><br />
Septamber 30, 2013<br />
Technical Market View<br />
TRENDSHEET - INDEX TREND *<br />
INDEX SPOT Close Trend Trend changed on Trend changed at Closing Stop Loss<br />
NIFTY 6083.15 5833.20 Down Up 23-May-13 05-Sep-13 5967.05 5592.95 6200 5670<br />
BANKNIFTY 12961.55 9899.75 Up 05-Sep-13 16-Apr-13 11871.60 9682.40 12630 9800<br />
CNX-IT 6410.95 8166.55 Up 08-May-13 21-Aug-13 6380.15 8175.30 6050 7885<br />
CNXMIDCAP 7914.80 7052.50 Down Up 23-May-13 10-Sep-13 7802.05 6889.00 8200 6790<br />
Nifty 50 - Trend Sheet *<br />
STOCKS LTP Trend Trend changed on Trend changed at at Closing Stop Loss<br />
ACC 1245.45 1099.55 Up 10-Sep-13 25-Apr-13 1022.55 1255.05 1030 1190<br />
AMBUJACEM 185.6 184.5 Up 16-Apr-13 24-Jul-13 171.6 180.45 178 175<br />
ASIANPAINT 4826.05 469.8 Down Up 10-Sep-13 9-Apr-13 445.8 4531.6 440 5000<br />
AXISBANK 1478.15 1030.9 Up 05-Sep-13 16-Apr-13 927.5 1363.3 1020 1400<br />
BAJAJ-AUTO 1993.15 1818.1 Up 04-Sep-13 23-Apr-13 1888.75 1805 1850 1730<br />
BANKBARODA 682.25 501.25 Down Up 24-Sep-13 25-Apr-13 503.7 708.55 545 680<br />
BHARTIARTL 309.15 325.3 Down Up 06-Sep-13 24-May-13 313.75 298.5 315 332<br />
BHEL 196.95 143.75 Up 23-Aug-13 25-Apr-13 116.1 192.55 130 187<br />
BPCL 377.45 328.6 Down 25-Sep-13 23-May-13 305.5 379.9 340 415<br />
CAIRN 286.15 317.75 Down Up 23-May-13 19-Jul-13 308.05 277.55 310 305<br />
CIPLA 401.5 434.3 Up 28-Jun-13 08-Mar-13 391.95 391.8 400 390<br />
COALINDIA 313.8 306.9 Down Up 05-Sep-13 24-Jan-13 283.4 343.65 285 320<br />
DLF 131.85 215.3 Down 23-Sep-13 22-May-13 141.65 227.15 145 235<br />
DRREDDY 2090.95 2412.2 Up 29-Aug-13 4-Apr-13 2258.45 1889.75 2300 1960<br />
GAIL 324.5 326.3 Down Up 13-Sep-13 23-May-13 313.8 324.3 305 345<br />
GRASIM 2680.55 2991.8 Up 10-Sep-13 25-Apr-13 2449.9 2983.2 2500 2900<br />
HCLTECH 1072.75 741.7 Up 9-May-13 770.15 1000 695<br />
HDFC 929.5 784.2 Up 05-Sep-13 11-Mar-13 750.4 831.65 775 840<br />
HDFCBANK 715.05 608.9 Down Up 25-Sep-13 16-Apr-13 620.6 663.35 660 675<br />
HEROMOTOCO 1654.35 2048.05 Up 23-Apr-13 15-Jul-13 1573.6 1725 1900 1550<br />
HINDALCO 110.6 113.9 Up 12-Aug-13 23-Apr-13 94.05 96.3 108 100<br />
Disclaimer: http://www.religareonline.com/research/Disclaimer/Disclaimer_RSL.html<br />
2
<strong>Religare</strong> <strong>Morning</strong> <strong>Digest</strong><br />
Septamber 30, 2013<br />
Technical Market View<br />
STOCKS LTP Trend Trend when changed Rate when trend changed Closing Stop loss<br />
HINDUNILVR 621 Up 10-Sep-13 653.5 620<br />
ICICIBANK 923.3 Down 27-Sep-13 923.3 1000<br />
IDFC 88.85 Down 25-Sep-13 90.05 100<br />
INDUSINDBK 375.65 Down 23-Sep-13 386 415<br />
INFY 3006.6 Up 03-Jun-13 2514.1 2850<br />
ITC 347.9 Up 10-Sep-13 335.9 325<br />
JINDALSTEL 235.95 Up 10-Sep-13 237 235<br />
JPASSOCIAT 36.6 Down 23-Sep-13 37.75 41<br />
KOTAKBANK 682.85 Up 30-Aug-13 690.85 680<br />
LT 815.85 Up 10-Sep-13 807.2 800<br />
LUPIN 853.5 Up 03-Sep-13 840.4 820<br />
M&M 844 Up 11-Sep-13 827.35 800<br />
MARUTI 1366.95 Up 11-Sep-13 1360.8 1330<br />
NMDC 126.75 Up 12-Aug-13 108.75 115<br />
NTPC 147.95 Up 10-Sep-13 138.6 137<br />
ONGC 274.4 Down 24-Sep-13 274.5 301<br />
PNB 477.65 Down 23-Sep-13 483.85 525<br />
POWERGRID 98.95 Up 10-Sep-13 102.25 94<br />
RANBAXY 334 Down 16-Sep-13 359.2 370<br />
RELIANCE 839.9 Up 30-Aug-13 853.85 835<br />
RELINFRA 392.35 Up 06-Sep-13 366 375<br />
SBIN 1640.7 Up 05-Sep-13 1638.15 1600<br />
SESAGOA 182.7 Up 12-Aug-13 135.25 170<br />
SUNPHARMA 589.85 Up 10-Sep-13 549.7 545<br />
TATAMOTORS 340.1 Up 05-Sep-13 318.1 320<br />
TATAPOWER 81.65 Up 13-Sep-13 78.4 76<br />
TATASTEEL 287.4 Up 12-Aug-13 236.55 280<br />
TCS 1948.1 Up 28-Jun-13 1518.15 1900<br />
ULTRACEMCO 1829 Up 06-Sep-13 1601.05 1680<br />
*Refer Annexure to understand this table<br />
Disclaimer: http://www.religareonline.com/research/Disclaimer/Disclaimer_RSL.html<br />
3
<strong>Religare</strong> <strong>Morning</strong> <strong>Digest</strong><br />
Septamber 30, 2013<br />
Derivative Market View<br />
Nifty closes negative led by fall in stocks from the banking segment and FMCG like ICICI Bank, HDFC Bank, SBI, ITC and HUL.<br />
Volumes was low but stock specific trend is negative, sector specific Bank Nifty has broken crucial support of 9920, it appears to<br />
be a bearish “Flag” pattern breakout and could lead to 9500 or lower levels.<br />
India VIX closed up by 0.25% to close at 24.06 levels. Nifty futures closed down 59.15 points at 5888.15 with a premium of<br />
49.05 points to the spot closing of 5833.20<br />
Nifty appears to be in a range between 5940 and 5800 but with a negative bias. If breaks below 5800 in cash Nifty will be<br />
negative up to 5688 which is the Strong support due to the Gap.<br />
Nifty would be positive provided 5800 is maintained and crosses above 6040 in that case we can see a target of 6200. However,<br />
bias is negative and looks like down side breakout below 5800 is strongly possible. Nifty fut. resistance for tomorrow is at 5945-<br />
5980 support exists at 5830-5780.<br />
Stocks Futures with Upward Potential<br />
Stocks Futures with Downward Potential<br />
Stocks Price % Change OI<br />
Change<br />
In OI<br />
Stocks Price % Change OI<br />
Change<br />
In OI<br />
BATAINDIA 864.85 4.01 1132 21.2 RELCAP 329.30 -3.83 5344 8.0<br />
ADANIENT 147.75 2.43 6347 1.5 JSWSTEEL 733.75 -2.63 14873 1.9<br />
MCDOWELL-N 2642 5.94 47487 3.7 ORIENTBANK 150.95 -4.46 1998 9.8<br />
F & O Trade / Strategy Recommendation for today<br />
Stock View CMP Strategy<br />
Recommended<br />
Price/ Initiation<br />
Range<br />
Target Price<br />
Stop loss<br />
HAVELLS BULLISH 637.40 BUY OCT. FUT 628-631 655 621<br />
Today’s Derivatives Summary<br />
Disclaimer: http://www.religareonline.com/research/Disclaimer/Disclaimer_RSL.html<br />
4
22-Aug<br />
26-Aug<br />
27-Aug<br />
28-Aug<br />
29-Aug<br />
30-Aug<br />
2-Sep<br />
3-Sep<br />
4-Sep<br />
5-Sep<br />
6-Sep<br />
10-Sep<br />
11-Sep<br />
12-Sep<br />
13-Sep<br />
16-Sep<br />
17-Sep<br />
18-Sep<br />
19-Sep<br />
20-Sep<br />
23-Sep<br />
24-Sep<br />
25-Sep<br />
26-Sep<br />
<strong>Religare</strong> <strong>Morning</strong> <strong>Digest</strong><br />
Septamber 30, 2013<br />
Fundamental Market view<br />
After a dreary trading session; markets edged lower, weakness in European stocks also weighed on<br />
sentiments. Combative comments from the Reserve Bank of India governor Raghuram Rajan on Thursday,<br />
26 September 2013, that inflation continued to remain high also adversely hit the markets. Metals,<br />
Mining, Capital goods, Banking and Realty were the major contributors to this dull day. Bond prices<br />
dropped again.<br />
Daily Trends In FIIs Investments (Rs Crore)<br />
4000<br />
3000<br />
2000<br />
1000<br />
0<br />
-1000<br />
-2000<br />
Corporate News<br />
Mahindra & Mahindra Ltd has announced a price increase ranging from Rs 6,000 to Rs 20,000<br />
covering its passenger and commercial vehicles. The price hike works out to be about 2% across its<br />
product portfolio.<br />
Bajaj Auto plans to increase the prices of its vehicles across segments due to rise in input costs.<br />
Glenmark Pharmaceuticals received a small research fee payment from Forest Laboratories Inc. on<br />
collaboration for the development of novel mPGES-1 inhibitors.<br />
Disclaimer: http://www.religareonline.com/research/Disclaimer/Disclaimer_RSL.html<br />
5
<strong>Religare</strong> <strong>Morning</strong> <strong>Digest</strong><br />
Septamber 30, 2013<br />
Annexure<br />
How to Understand the Trend Sheet table<br />
When trend changes to up, one can buy & when trend changes to down one can sell.<br />
Resistance is mentioned for stocks which are in downtrend where one can go short with closing stop loss<br />
as mentioned. Support is mentioned for stocks which are in uptrend where one can go long with closing<br />
stop loss as mentioned.<br />
Closing stop loss has to be seen at closing at 3:30pm. All stocks prices refer to spot price.<br />
In this table of trends, it has been observed that if someone tries to take all levels of a stock or index continuously,<br />
the losses are small but once the market catches a strong trend in either direction, one makes<br />
a huge profit that time.<br />
In our trend sheet,<br />
If we underline only the stock name and closing stop loss then it means we have trailed our closing stop<br />
loss.<br />
If we underline the complete line including all fields Stock’s name, LTP, Trend, Trend changed on, Trend<br />
changed at & closing stop loss, it signifies fresh reversal of the trend.<br />
Note – For our running recommendations and past performance, please click here<br />
Disclaimer: http://www.religareonline.com/research/Disclaimer/Disclaimer_RSL.html<br />
6