Who is an asylum-seeker? - unhcr
Who is an asylum-seeker? - unhcr
Who is an asylum-seeker? - unhcr

You also want an ePaper? Increase the reach of your titles
YUMPU automatically turns print PDFs into web optimized ePapers that Google loves.
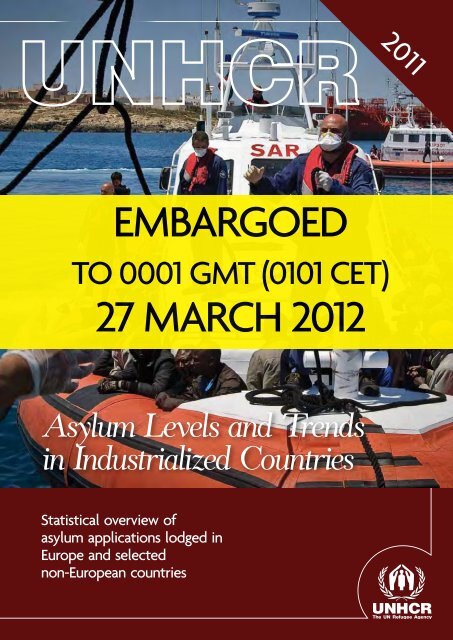
2011<br />
EMBARGOED<br />
TO 0001 GMT (0101 CET)<br />
27 MARCH 2012<br />
Asylum Levels <strong>an</strong>d Trends<br />
in Industrialized Countries<br />
Stat<strong>is</strong>tical overview of<br />
<strong>asylum</strong> applications lodged in<br />
Europe <strong>an</strong>d selected<br />
non-Europe<strong>an</strong> countries
Trends at a Gl<strong>an</strong>ce<br />
77%<br />
<strong>Who</strong> <strong>is</strong> <strong>an</strong><br />
<strong>asylum</strong>-<strong>seeker</strong>?<br />
2011 in review<br />
20%<br />
An estimated 441,300 <strong>asylum</strong><br />
applications were reg<strong>is</strong>tred in<br />
2011 in the 44 countries included<br />
in th<strong>is</strong> report, some 73,300 claims<br />
or 20 per cent more th<strong>an</strong> in 2010<br />
(368,000). The 2011 level <strong>is</strong> the<br />
highest since 2003 when 505,000<br />
<strong>asylum</strong> applications were lodged<br />
in the industrialized countries.<br />
15%<br />
The 27 Member States of the<br />
Europe<strong>an</strong> Union reg<strong>is</strong>tered<br />
277,400 <strong>asylum</strong> claims in 2011,<br />
a 15 per cent increase compared<br />
to 2010 (240,400). The EU-27<br />
together accounted for 85 per cent<br />
of all <strong>asylum</strong> claims in Europe.<br />
10%<br />
In Europe, the largest relative<br />
increase in <strong>an</strong>nual <strong>asylum</strong><br />
levels occurred in the eight<br />
Southern Europe<strong>an</strong> countries<br />
which received 66,800 <strong>asylum</strong><br />
requests during 2011, <strong>an</strong> 87 per<br />
cent increase compared to 2010.<br />
Th<strong>is</strong> increase <strong>is</strong> due mainly to<br />
boat arrivals in Italy <strong>an</strong>d Malta<br />
<strong>an</strong>d to the reg<strong>is</strong>tration of greater<br />
numbers of individual requests<br />
for international protection in<br />
Turkey (+74%).<br />
13,000<br />
16,700<br />
11,800<br />
The number of <strong>asylum</strong>-<strong>seeker</strong>s<br />
327,200<br />
in Australia <strong>an</strong>d New Zeal<strong>an</strong>d<br />
The 38 countries in Europe<br />
decreased by 9 per cent during<br />
In the Nordic countries, the<br />
received 327,200 claims, <strong>an</strong><br />
2011 (11,800 claims) compared to<br />
number of newly reg<strong>is</strong>tered<br />
increase of 19 per cent compared<br />
the previous year (13,000). Th<strong>is</strong> <strong>is</strong><br />
<strong>asylum</strong>-<strong>seeker</strong>s decreased by 10<br />
to 2010 (274,700 claims).<br />
the first decrease in six years.<br />
per cent to 45,700, a similar level<br />
to those of 2007 <strong>an</strong>d 2008. The<br />
decrease was uniform across all<br />
countries.<br />
+19%<br />
87%<br />
1/4<br />
In North America, <strong>an</strong> estimated<br />
99,400 new <strong>asylum</strong> applications<br />
were submitted in 2011, almost<br />
a quarter (+20,700 claims) more<br />
th<strong>an</strong> in 2010. The figures for<br />
C<strong>an</strong>ada <strong>an</strong>d the United States of<br />
America show a similar trend.<br />
For <strong>asylum</strong>-<strong>seeker</strong>s from Côte<br />
d’Ivoire, Libya, the Syri<strong>an</strong> Arab<br />
Republic, <strong>an</strong>d Tun<strong>is</strong>ia, levels<br />
were at a record high among the<br />
industrialized countries. Asylum<strong>seeker</strong>s<br />
originating from these<br />
four countries submitted in total<br />
16,700 claims more th<strong>an</strong> in 2010.<br />
Jap<strong>an</strong> <strong>an</strong>d the Republic of Korea<br />
reg<strong>is</strong>tered a combined number of<br />
2,900 new <strong>asylum</strong> claims in 2011,<br />
a 77 per cent increase compared<br />
to 2010 (1,600 claims) <strong>an</strong>d the<br />
highest on record.<br />
1. USA<br />
2. FRA<br />
3. GER<br />
4. ITA<br />
5. SWE<br />
53 %<br />
47 %<br />
others<br />
With <strong>an</strong> estimated 74,000 <strong>asylum</strong><br />
applications, the United States<br />
of America was the largest single<br />
recipient of new <strong>asylum</strong> claims<br />
among the 44 industrialized<br />
countries. Fr<strong>an</strong>ce was second<br />
with 51,900 <strong>asylum</strong> applications,<br />
followed by Germ<strong>an</strong>y (45,700),<br />
Italy (34,100) (1) , <strong>an</strong>d Sweden<br />
(29,600). The top five receiving<br />
countries together accounted for<br />
more th<strong>an</strong> half (53%) of all <strong>asylum</strong><br />
claims received in the countries<br />
included in th<strong>is</strong> report.<br />
Top<br />
5<br />
An <strong>asylum</strong>-<strong>seeker</strong> <strong>is</strong> <strong>an</strong> individual who has<br />
sought international protection <strong>an</strong>d whose claim<br />
for refugee status has not been determined yet.<br />
As part of its obligation to protect refugees on<br />
its territory, the country of <strong>asylum</strong> <strong>is</strong> normally<br />
responsible for determining whether <strong>an</strong> <strong>asylum</strong><strong>seeker</strong><br />
<strong>is</strong> a refugee or not. Th<strong>is</strong> responsibility <strong>is</strong><br />
often incorporated in national leg<strong>is</strong>lation of the<br />
country <strong>an</strong>d, for State Parties, <strong>is</strong> derived from<br />
the 1951 Convention Relating to the Satus of<br />
Refugees. •<br />
1. afgh<strong>an</strong><strong>is</strong>t<strong>an</strong><br />
2. china<br />
3. IRAQ<br />
4. serbia (<strong>an</strong>d Kosovo: S/RES/1244 (1999))<br />
5. PAKISTAN<br />
With 35,700 <strong>asylum</strong> claims<br />
lodged in 2011, Afgh<strong>an</strong><strong>is</strong>t<strong>an</strong> was<br />
the most import<strong>an</strong>t source<br />
country of <strong>asylum</strong>-<strong>seeker</strong>s in<br />
the 44 industrialized countries,<br />
followed by China (24,400 claims),<br />
Iraq (23,500), Serbia (<strong>an</strong>d Kosovo:<br />
Security Council resolution 1244<br />
(1999)) (2) (21,200), <strong>an</strong>d Pak<strong>is</strong>t<strong>an</strong><br />
(18,100).<br />
Slightly less th<strong>an</strong> half of all<br />
<strong>asylum</strong> claims were submitted by<br />
individuals originating from Asia<br />
(45%). Africa was the second most<br />
import<strong>an</strong>t source continent (27%<br />
of all claims), followed by Europe<br />
(15%), <strong>an</strong>d the Americas (8%).<br />
1 Th<strong>is</strong> figure <strong>is</strong> prov<strong>is</strong>ional <strong>an</strong>d subject to ch<strong>an</strong>ge<br />
since the Government of Italy <strong>is</strong> still processing<br />
<strong>asylum</strong> claims received in 2011.<br />
2 Henceforth referred to in th<strong>is</strong> document as<br />
“Serbia (<strong>an</strong>d Kosovo: S/RES/1244 (1999))”.<br />
2 Asylum Levels <strong>an</strong>d Trends in Industrialized Countries - 2011 Asylum Levels <strong>an</strong>d Trends in Industrialized Countries - 2011 3
I<br />
Introduction<br />
Th<strong>is</strong> report summarizes patterns <strong>an</strong>d trends in the number of individual <strong>asylum</strong> claims (3)<br />
submitted in Europe <strong>an</strong>d selected non-Europe<strong>an</strong> countries during 2011. The data presented are<br />
based on information available as of 14 March 2012, unless otherw<strong>is</strong>e indicated. The report covers<br />
the 38 Europe<strong>an</strong> <strong>an</strong>d six non-Europe<strong>an</strong> States that currently provide monthly <strong>asylum</strong> stat<strong>is</strong>tics<br />
to UNHCR. Figures are mostly based on official <strong>asylum</strong> stat<strong>is</strong>tics, reflecting national laws <strong>an</strong>d<br />
procedures. In addition, UNHCR conducted refugee status determination under its m<strong>an</strong>date<br />
in a number of countries included in th<strong>is</strong> report . (4) Annex Table 2 provides trends in selected<br />
Eastern Europe<strong>an</strong> countries, based on <strong>an</strong>nual data.<br />
Refugees in the Lor<strong>an</strong> reception centre<br />
on the Itali<strong>an</strong> <strong>is</strong>l<strong>an</strong>d of Lampedusa.<br />
© UnhcR / L. SenIGALLIESI<br />
The group of coun-<br />
TRies <strong>an</strong>alYSed <strong>is</strong> referred<br />
to collectively as “the<br />
44 industrialized countries”<br />
<strong>an</strong>d <strong>is</strong> defined as such for the<br />
purposes of th<strong>is</strong> report only. The 44<br />
countries are: 27 Member States of the<br />
Europe<strong>an</strong> Union (5) , Alb<strong>an</strong>ia, Bosnia<br />
<strong>an</strong>d Herzegovina, Croatia, Icel<strong>an</strong>d,<br />
Liechtenstein, Montenegro, Norway,<br />
Serbia (<strong>an</strong>d Kosovo: S/RES/1244 (1999)),<br />
Switzerl<strong>an</strong>d, The former Yugoslav Republic<br />
of Macedonia, <strong>an</strong>d Turkey, as<br />
well as Australia, C<strong>an</strong>ada, Jap<strong>an</strong>, New<br />
Zeal<strong>an</strong>d, the Republic of Korea <strong>an</strong>d the<br />
United States of America. The group<br />
of 44 countries received <strong>an</strong> estimated<br />
441,300 <strong>asylum</strong> applications in 2011.<br />
The numbers in th<strong>is</strong> report reflect<br />
<strong>asylum</strong> claims made at the first inst<strong>an</strong>ce<br />
of <strong>asylum</strong> procedures. Applications<br />
on appeal or review are not included,<br />
nor <strong>is</strong> information on the outcome<br />
of <strong>asylum</strong> procedures or on the<br />
adm<strong>is</strong>sion of refugees through resettlement<br />
programmes, as such details are<br />
available in other UNHCR reports. (6)<br />
To the extent possible, the stat<strong>is</strong>tics<br />
presented reflect the number of individuals<br />
lodging <strong>an</strong> <strong>asylum</strong> application<br />
for the first time. However, some of the<br />
figures quoted in th<strong>is</strong> report are likely<br />
to include repeat applications, <strong>an</strong>d<br />
therefore may not reflect the actual<br />
number of new <strong>asylum</strong>-<strong>seeker</strong>s. Also,<br />
the number of <strong>asylum</strong> applications<br />
may not reflect the number of <strong>asylum</strong><strong>seeker</strong>s,<br />
as some individuals seek <strong>asylum</strong><br />
in more th<strong>an</strong> one country during<br />
the same year. (7)<br />
All data refer to the number of individuals<br />
with the exception of <strong>asylum</strong><strong>seeker</strong>s<br />
in the United States of America<br />
where figures are available only for the<br />
number of cases (which may include<br />
several individuals) for applications<br />
submitted to the United States Department<br />
of Homel<strong>an</strong>d Security (DHS).<br />
However, applications submitted to<br />
the United States Department of Justice,<br />
Executive Office of Immigration<br />
Review (EOIR), are recorded as individuals.<br />
To allow comparability across<br />
countries of <strong>asylum</strong>, UNHCR uses a<br />
figure of 1.4 individuals per case to estimate<br />
the number of people reported<br />
by DHS, because h<strong>is</strong>torical data suggest<br />
that, on average, one <strong>asylum</strong> case<br />
contains 1.4 individuals. In the country<br />
of origin tables, figures for the United<br />
States of America are a combination<br />
of the number of cases (DHS) <strong>an</strong>d the<br />
number of individuals (EOIR), owing<br />
to the large variation in family size by<br />
nationality.<br />
All figures in th<strong>is</strong> report should be considered<br />
as prov<strong>is</strong>ional <strong>an</strong>d subject to ch<strong>an</strong>ge.<br />
Due to retroactive ch<strong>an</strong>ges <strong>an</strong>d adjustments,<br />
some of the data included in th<strong>is</strong><br />
publication may differ slightly from<br />
that reported in previous UNHCR<br />
documents or from the official figures<br />
publ<strong>is</strong>hed by States. •<br />
3 An <strong>asylum</strong>-<strong>seeker</strong> <strong>is</strong> <strong>an</strong> individual who has sought international protection <strong>an</strong>d whose claim for refugee status has not yet been determined. As part of its obligation to<br />
protect refugees on its territory, the country of <strong>asylum</strong> <strong>is</strong> normally responsible for determining whether <strong>an</strong> <strong>asylum</strong>-<strong>seeker</strong> <strong>is</strong> a refugee or not. Th<strong>is</strong> responsibility <strong>is</strong> often<br />
incorporated in national leg<strong>is</strong>lation of the country <strong>an</strong>d, for State Parties, <strong>is</strong> derived from the 1951 Convention Relating to the Status of Refugees.<br />
4 During the period 2007-2011, UNHCR conducted refugee status determination under its m<strong>an</strong>date in Cyprus (northern part of Cyprus only), Montenegro, Serbia<br />
(<strong>an</strong>d Kosovo: S/RES/1244 (1999)), <strong>an</strong>d Turkey (see notes in Annex Table 1 for more details).<br />
5 See Annex Table 1 for a l<strong>is</strong>t of countries.<br />
6 See UNHCR’s 2010 Stat<strong>is</strong>tical Yearbook at http://www.<strong>unhcr</strong>.org/stat<strong>is</strong>tics.<br />
7 According to EURODAC’s Central Unit, the verification of <strong>asylum</strong> claims in 2010 showed that 24.2 per cent of all <strong>asylum</strong> claims reg<strong>is</strong>tered in the system were<br />
multiple claims, i.e. the applic<strong>an</strong>t had submitted at least one previous application in the same or <strong>an</strong>other Member State of the Europe<strong>an</strong> Union. (Source: http://ec.europa.<br />
eu/home-affairs/doc_centre/<strong>asylum</strong>/<strong>asylum</strong>_identification_en.htm)<br />
4 Asylum Levels <strong>an</strong>d Trends in Industrialized Countries - 2011 Asylum Levels <strong>an</strong>d Trends in Industrialized Countries - 2011 5
II<br />
Global <strong>an</strong>d Regional Trends(8)<br />
The year 2011 was characterized by a signific<strong>an</strong>t number of people seeking <strong>asylum</strong> or refugee<br />
status from countries experiencing recent or ongoing conflict, turmoil or security concerns.<br />
Th<strong>is</strong> applies in particular to <strong>asylum</strong>-<strong>seeker</strong>s originating from Afgh<strong>an</strong><strong>is</strong>t<strong>an</strong>, Côte d’Ivoire, Libya,<br />
the Syri<strong>an</strong> Arab Republic, <strong>an</strong>d Tun<strong>is</strong>ia.<br />
People queuing outside the Belgi<strong>an</strong><br />
Department of Immigration in<br />
Brussels waiting to file <strong>an</strong> <strong>asylum</strong><br />
application. The Department takes<br />
photos, fingerprints <strong>an</strong>d a chest-x-ray.<br />
Personal data are also reg<strong>is</strong>tered.<br />
© UnhcR / D. TELEm<strong>an</strong>s<br />
Following averageS of<br />
roughly 370,000 <strong>asylum</strong> applications<br />
per year in the 44<br />
industrialized countries since<br />
2008, signific<strong>an</strong>t increases were<br />
reg<strong>is</strong>tered in 2011. An estimated 441,300<br />
<strong>asylum</strong> applications were recorded in<br />
the 44 countries, representing some<br />
73,300 claims (+20%) more th<strong>an</strong> in 2010<br />
(368,000). The 2011 level was the highest<br />
since 2003 when more th<strong>an</strong> 505,000<br />
<strong>asylum</strong> applications were lodged in the<br />
industrialized countries. As shown in<br />
Figure 1, the overall increase observed in<br />
2011 applies to most major regions <strong>an</strong>alysed<br />
in th<strong>is</strong> report.<br />
Out of a total of 441,300 <strong>asylum</strong> applications<br />
reg<strong>is</strong>tered in 2011, the 38 countries<br />
in Europe (9) received 327,200 claims,<br />
<strong>an</strong> increase of 19 per cent compared to<br />
2010 (274,700 claims). However, the figures<br />
show variations in <strong>asylum</strong> trends<br />
at the regional <strong>an</strong>d country level. For<br />
example, the 27 Member States of the<br />
Europe<strong>an</strong> Union reg<strong>is</strong>tered 277,400 <strong>asylum</strong><br />
claims in 2011, a 15 per cent increase<br />
compared to 2010 (240,400). Within th<strong>is</strong><br />
group, the 15 pre-2004 (‘old’) EU Member<br />
States reg<strong>is</strong>tered 37,300 more claims<br />
during 2011 (+17%), while the 12 ‘new’ EU<br />
Fig. 1 Ch<strong>an</strong>ge in <strong>asylum</strong> claims in selected regions<br />
EU-27<br />
Europe<br />
C<strong>an</strong>ada/USA<br />
Australia/<br />
New Zeal<strong>an</strong>d<br />
Jap<strong>an</strong>/<br />
Rep. of Korea<br />
-44%<br />
-41%<br />
-45%<br />
-44%<br />
-3%<br />
-5%<br />
-4%<br />
-9%<br />
-5%<br />
Member States, who joined the EU<br />
in or after 2004, reg<strong>is</strong>tered 400 fewer<br />
claims, a drop of 2 per cent. The EU-27<br />
together accounted for 85 per cent of all<br />
<strong>asylum</strong> claims in Europe.<br />
Among the Europe<strong>an</strong> regions, the<br />
largest relative increase in <strong>an</strong>nual <strong>asylum</strong><br />
levels was reported by the eight<br />
15%<br />
19%<br />
26%<br />
67%<br />
77%<br />
2008-2009<br />
2009-2010<br />
2010-2011<br />
336%<br />
Southern Europe<strong>an</strong> countries (10) which received<br />
66,800 <strong>asylum</strong> requests during<br />
2011, <strong>an</strong> 87 per cent increase compared<br />
to 2010. Th<strong>is</strong> increase <strong>is</strong> mainly due to<br />
boat arrivals in Italy <strong>an</strong>d Malta <strong>an</strong>d the<br />
reg<strong>is</strong>tration of more individual requests<br />
for international protection in Turkey<br />
(+74%). despite th<strong>is</strong> recent increase,<br />
8 See notes in Annex Table 1 for a l<strong>is</strong>t of countries included under each regional grouping.<br />
9 When including the countries l<strong>is</strong>ted in Annex Table 2, the total number of <strong>asylum</strong> claims in 2011 amounts to 444,000, compared to 372,400 the previous year.<br />
10 Refers to Alb<strong>an</strong>ia, Cyprus, Greece, Italy, Malta, Portugal, Spain <strong>an</strong>d Turkey.<br />
6 Asylum Levels <strong>an</strong>d Trends in Industrialized Countries - 2011 Asylum Levels <strong>an</strong>d Trends in Industrialized Countries - 2011 7
When comparing the share of the 44 industrialized countries to the global number of reg<strong>is</strong>tered<br />
<strong>asylum</strong>-<strong>seeker</strong>s between 2007 <strong>an</strong>d 2010, the relative import<strong>an</strong>ce of the 44 countries as a destination<br />
region has declined. In 2007, the 44 countries received roughly 65 per cent of all new <strong>asylum</strong><br />
applications worldwide. By 2010, th<strong>is</strong> percentage had fallen to about 50, with sub-Sahar<strong>an</strong> Africa<br />
emerging as a major destination region for people seeking international protection. (a) The global<br />
number of <strong>asylum</strong> applications reg<strong>is</strong>tered in 2011 <strong>is</strong> not yet available. •<br />
a See UNHCR’s 2010 Stat<strong>is</strong>tical Yearbook<br />
TABLE 1<br />
Asylum claims lodged in selected regions<br />
Regions 2009 2010 2011<br />
Ch<strong>an</strong>ge<br />
‘ 11-’10<br />
Europe 287,830 274,710 327,190 19%<br />
- EU-total 247,330 240,410 277,370 15%<br />
- EU-“old” 222,130 224,850 262,190 17%<br />
- EU-“new” 25,200 15,560 15,180 -2%<br />
USA/C<strong>an</strong>ada 82,270 78,690 99,370 26%<br />
Australia/New Zeal<strong>an</strong>d 7,760 12,980 11,820 -9%<br />
Jap<strong>an</strong>/Rep. of Korea 1,710 1,630 2,880 77%<br />
Total 379,570 368,010 441,260 20%<br />
See notes in Annex Table 1 for l<strong>is</strong>t of countries included.<br />
levels remain below the latest peak in<br />
2008 (74,400 claims). Italy was the main<br />
recipient of <strong>asylum</strong> applications in the region<br />
(34,100 claims) (11) , followed by Turkey<br />
(16,000) <strong>an</strong>d Greece (9,300).<br />
In the Nordic countries (12) , on the<br />
other h<strong>an</strong>d, the number of newly reg<strong>is</strong>tered<br />
<strong>asylum</strong>-<strong>seeker</strong>s decreased by 10<br />
per cent to 45,700, almost the 2007 <strong>an</strong>d<br />
2008 levels. With the exception of Icel<strong>an</strong>d,<br />
the decrease was uniform among<br />
all countries. Overall, Sweden remained<br />
the most import<strong>an</strong>t destination for <strong>asylum</strong>-<strong>seeker</strong>s<br />
in the region with 29,600<br />
<strong>asylum</strong> applications, followed by Norway<br />
(9,100) <strong>an</strong>d denmark (3,800).<br />
The number of <strong>asylum</strong>-<strong>seeker</strong>s in<br />
Australia <strong>an</strong>d New Zeal<strong>an</strong>d decreased by<br />
9 per cent during 2011 (11,800 claims)<br />
compared to the previous year (13,000).<br />
It <strong>is</strong> primarily in Australia that the<br />
decrease occurred with 11,500 claims,<br />
down 9 per cent from 2010. It <strong>is</strong> the first<br />
decrease observed in six years, <strong>an</strong>d <strong>is</strong> due<br />
to fewer <strong>asylum</strong>-<strong>seeker</strong>s arriving to Australia<br />
by boat. One third of <strong>asylum</strong>-<strong>seeker</strong>s<br />
in Australia originate from Afgh<strong>an</strong><strong>is</strong>t<strong>an</strong><br />
or the Islamic Republic of Ir<strong>an</strong>.<br />
Asylum levels in Australia remain below<br />
those recorded by m<strong>an</strong>y other industrialized<br />
<strong>an</strong>d non-industrialized countries.<br />
In New Zeal<strong>an</strong>d, levels have remained<br />
fairly stable in the past six years<br />
(on average 300 new claims per year).<br />
Jap<strong>an</strong> <strong>an</strong>d the Republic of Korea reg<strong>is</strong>tered<br />
a combined number of 2,900 new<br />
<strong>asylum</strong> claims in 2011, a 77 per cent increase<br />
compared to 2010 (1,600 claims).<br />
Although it <strong>is</strong> the highest level on record<br />
in both countries, numbers continue<br />
to be modest in compar<strong>is</strong>on with<br />
other industrialized countries. Jap<strong>an</strong><br />
reg<strong>is</strong>tered 1,900 (13) new <strong>asylum</strong> applications<br />
(+56%) <strong>an</strong>d the Republic of Korea<br />
1,000 claims (+135%) in 2011. People seeking<br />
international protection in Jap<strong>an</strong><br />
were predomin<strong>an</strong>tly from My<strong>an</strong>mar<br />
while Pak<strong>is</strong>t<strong>an</strong> was the main country of<br />
origin of <strong>asylum</strong>-<strong>seeker</strong>s in the Republic<br />
of Korea.<br />
In North America, <strong>an</strong> estimated<br />
99,400 new <strong>asylum</strong> applications were<br />
submitted in 2011, one quarter (+20,700<br />
claims) more th<strong>an</strong> in 2010. The figures<br />
show a similar trend for C<strong>an</strong>ada <strong>an</strong>d<br />
the United States of America. The former<br />
reg<strong>is</strong>tered 25,300 new applications,<br />
9 per cent more th<strong>an</strong> in 2010 (23,200),<br />
while the latter recorded approximately<br />
74,000 (14) claims, a 33 per cent increase<br />
(55,500 claims in 2010). Although 2011<br />
<strong>is</strong> the highest level in almost a decade<br />
for th<strong>is</strong> region, it <strong>is</strong> two thirds that of<br />
2001 when close to 150,000 applications<br />
in total were lodged in C<strong>an</strong>ada <strong>an</strong>d the<br />
United States of America. •<br />
11 Th<strong>is</strong> figure <strong>is</strong> prov<strong>is</strong>ional <strong>an</strong>d subject to ch<strong>an</strong>ge since the Government of Italy <strong>is</strong> still processing <strong>asylum</strong><br />
claims received in 2011.<br />
12 Refers to Denmark, Finl<strong>an</strong>d, Icel<strong>an</strong>d, Norway <strong>an</strong>d Sweden.<br />
13 Monthly <strong>asylum</strong> data for Jap<strong>an</strong> <strong>is</strong> available from 2002. Figures for Jap<strong>an</strong> are UNHCR estimates.<br />
14 Estimated number of individuals based on the number of new cases (37,100) <strong>an</strong>d multiplied by 1.4 to reflect<br />
the average number of individuals per case (Source: US Department of Homel<strong>an</strong>d Security); <strong>an</strong>d the number<br />
of new “defensive” <strong>asylum</strong> requests lodged with the Executive Office of Immigration Review (22,100; reported<br />
by individuals).<br />
III<br />
Levels <strong>an</strong>d<br />
Patterns in<br />
Countries<br />
of Asylum<br />
With 235,400 reg<strong>is</strong>tered <strong>asylum</strong><br />
claims in 2011, the United States of<br />
America, Fr<strong>an</strong>ce, Germ<strong>an</strong>y, Italy, <strong>an</strong>d<br />
Sweden were the top five receiving<br />
countries, together accounting for<br />
more th<strong>an</strong> half (53%) of all new<br />
<strong>asylum</strong> claims submitted in the<br />
44 industrialized countries covered<br />
by th<strong>is</strong> report. In compar<strong>is</strong>on, some<br />
186,800 claims were reg<strong>is</strong>tered<br />
in these five countries in 2010.<br />
For the sixth consecutive<br />
yeaR, the United States<br />
of America remained the largest<br />
single recipient of new <strong>asylum</strong><br />
claims, accounting for one out of<br />
six claims lodged in the 44 countries included<br />
in Annex Table 1. An estimated<br />
74,000 individuals submitted <strong>an</strong> application,<br />
18,500 claims more th<strong>an</strong> the year<br />
before. Asylum-<strong>seeker</strong>s from China<br />
(+20%), Mexico (+94%) <strong>an</strong>d India (+241%)<br />
accounted primarily for th<strong>is</strong> increase.<br />
Almost half of all <strong>asylum</strong> claims in the<br />
country were lodged by <strong>asylum</strong>-<strong>seeker</strong>s<br />
from China (26%), Mexico (14%), or El<br />
Salvador (7%). The <strong>an</strong>nual share of the<br />
United States of America in the number<br />
of <strong>asylum</strong> claims received among<br />
the group of industrialized countries<br />
has fluctuated in recent years, r<strong>an</strong>ging<br />
between 13 <strong>an</strong>d 17 per cent.<br />
Fr<strong>an</strong>ce was the second largest recipient<br />
of applications among the group of<br />
44 countries with 51,900 new applications<br />
reg<strong>is</strong>tered during 2011. Th<strong>is</strong> <strong>is</strong> not<br />
only <strong>an</strong> 8 per cent increase over 2010<br />
(48,100 claims), but also the fourth consecutive<br />
r<strong>is</strong>e. The higher level in 2011<br />
<strong>is</strong> partly attributable to a doubling of<br />
<strong>asylum</strong> claims from Armeni<strong>an</strong>s: from<br />
1,800 in 2010 to more th<strong>an</strong> 3,600 claims<br />
a year later. Similarly, <strong>asylum</strong> claims<br />
from citizens of Côte d’Ivoire tripled,<br />
from 500 to almost 1,700 during the<br />
same period. The Russi<strong>an</strong> Federation<br />
was the top country of origin of <strong>asylum</strong><strong>seeker</strong>s<br />
in Fr<strong>an</strong>ce, with 4,000 <strong>asylum</strong><br />
claims reg<strong>is</strong>tered in 2011, followed by<br />
Fig. 2 Asylum claims submitted in 10 major receiving<br />
countries | 2011<br />
80,000<br />
70,000<br />
60,000<br />
50,000<br />
40,000<br />
30,000<br />
20,000<br />
10,000<br />
0<br />
2010<br />
2011<br />
United Fr<strong>an</strong>ce Germ<strong>an</strong>y Italy Sweden Belgium United C<strong>an</strong>ada Switzer- Turkey<br />
States Kingdom l<strong>an</strong>d<br />
the Democratic Republic of the Congo<br />
(3,800 claims) <strong>an</strong>d Armenia (3,600<br />
claims). On average, every eighth application<br />
in the 44 industrialized countries<br />
was received by Fr<strong>an</strong>ce.<br />
Germ<strong>an</strong>y was the third largest recipient<br />
of applications among the 44 countries,<br />
with 45,700 new <strong>asylum</strong> requests<br />
reg<strong>is</strong>tered during 2011. Th<strong>is</strong> <strong>is</strong> <strong>an</strong> 11 per<br />
cent increase compared to 2010 (41,300<br />
claims) <strong>an</strong>d the highest value since 2003<br />
(50,600 claims). The increase in 2011 <strong>is</strong><br />
partly attributed to a higher number<br />
of <strong>asylum</strong>-<strong>seeker</strong>s from Afgh<strong>an</strong><strong>is</strong>t<strong>an</strong><br />
(+32%), the Syri<strong>an</strong> Arab Republic (+77%),<br />
<strong>an</strong>d Pak<strong>is</strong>t<strong>an</strong> (+202%). Afgh<strong>an</strong><strong>is</strong>t<strong>an</strong> was<br />
also the top country of origin of <strong>asylum</strong><strong>seeker</strong>s<br />
in Germ<strong>an</strong>y with 7,800 claims<br />
reg<strong>is</strong>tered in 2011. On average, three out<br />
of ten applications in the country were<br />
lodged by Afgh<strong>an</strong>s.<br />
Following signific<strong>an</strong>tly increased<br />
numbers of new <strong>asylum</strong> applic<strong>an</strong>ts in<br />
2008 (30,300 claims), m<strong>an</strong>y of them arriving<br />
by sea, the number of persons<br />
requesting international protection<br />
in Italy descended to a five-year low in<br />
2010 (10,000 claims). However, in 2011,<br />
th<strong>is</strong> trend was reversed with <strong>an</strong> estimated<br />
34,100 (15) <strong>asylum</strong> applications<br />
reg<strong>is</strong>tered (+240%). Th<strong>is</strong> figure constitutes<br />
<strong>an</strong> all-time-high for Italy, making<br />
it the fourth largest recipient of <strong>asylum</strong><strong>seeker</strong>s<br />
in the industrialized world in<br />
2011. Tun<strong>is</strong>ia became the main country<br />
of origin of <strong>asylum</strong>-<strong>seeker</strong>s in Italy<br />
15 Th<strong>is</strong> figure <strong>is</strong> prov<strong>is</strong>ional <strong>an</strong>d subject to ch<strong>an</strong>ge<br />
since the Government of Italy <strong>is</strong> still processing<br />
<strong>asylum</strong> claims received in 2011. The country of<br />
origin breakdown <strong>is</strong> available for 18,100 out of the<br />
34,100 <strong>asylum</strong> applications.<br />
8 Asylum Levels <strong>an</strong>d Trends in Industrialized Countries - 2011<br />
Asylum Levels <strong>an</strong>d Trends in Industrialized Countries - 2011<br />
9
Map 1<br />
Asylum applications lodged in 44 industrialized countries | 2010-2011<br />
Absolute <strong>an</strong>d relative increase or decrease 2011 compared to 2010<br />
+2,190<br />
+20<br />
-2,170<br />
-930<br />
-1,010<br />
+40<br />
+18,490<br />
-1,150<br />
+270<br />
+30<br />
+120<br />
-650<br />
+670<br />
+2,770<br />
-1,740<br />
+4,410<br />
+4,230<br />
+1,420<br />
-40<br />
+5,920<br />
+3,840<br />
-1,340<br />
+10<br />
-90<br />
+3,410<br />
-410<br />
+60<br />
+860<br />
+520 0 +2,530<br />
+230 -130<br />
+570<br />
+10<br />
-960<br />
+24,070 * +1,710 -1,390<br />
+6,800<br />
A Chechen <strong>asylum</strong>-<strong>seeker</strong><br />
women in the Linin Reception<br />
Centre in Linin, Pol<strong>an</strong>d.<br />
© UnhcR / b. sz<strong>an</strong>DELSZKy<br />
with 3,500 claims reg<strong>is</strong>tered (up from 140<br />
a year earlier). Tun<strong>is</strong>ia was followed by<br />
Nigeria (2,900 claims), Gh<strong>an</strong>a (1,300) <strong>an</strong>d<br />
Pak<strong>is</strong>t<strong>an</strong> (1,200).<br />
Sweden r<strong>an</strong>ked fifth among the 44<br />
industrialized countries with 29,600 applications<br />
received during the year. In<br />
contrast to the top four receiving countries,<br />
Sweden experienced a 7 per cent<br />
drop compared to 2010 (31,800 claims).<br />
It <strong>is</strong> mainly the fall in numbers of <strong>asylum</strong>-<strong>seeker</strong>s<br />
from Serbia (<strong>an</strong>d Kosovo: S/<br />
RES/1244 (1999)) <strong>an</strong>d from Somalia who<br />
accounted for th<strong>is</strong> drop. In the case of<br />
Serbia, figures halved during 2011 (3,000<br />
fewer claims), while 1,600 fewer claims<br />
from Somal<strong>is</strong> were reg<strong>is</strong>tered (-28%). In<br />
contrast, the number of Afgh<strong>an</strong>s seeking<br />
international protection in Sweden<br />
increased from 2,400 in 2010 to more<br />
th<strong>an</strong> 4,100 (+72%). Afgh<strong>an</strong><strong>is</strong>t<strong>an</strong> thus<br />
became the main country of origin of<br />
<strong>asylum</strong>-<strong>seeker</strong>s in Sweden. during the<br />
same period, <strong>asylum</strong> claims from people<br />
originating from Bosnia <strong>an</strong>d Herzegovina<br />
went up from 120 to almost 1,000.<br />
Increase <strong>an</strong>d decrease of<br />
<strong>asylum</strong> claims<br />
Increase over 100%<br />
Increase 50% to 100%<br />
Increase 1% to 50%<br />
Decrease 1% to 50%<br />
Decrease 50% to 100%<br />
Decrease over 100%<br />
Note: Th<strong>is</strong> map <strong>is</strong> limited to the 44 countries which<br />
provide monthly <strong>asylum</strong> stat<strong>is</strong>tics to UNHCR.<br />
All figures are rounded off to the closest ten.<br />
* Prov<strong>is</strong>ional figure subject to ch<strong>an</strong>ge.<br />
The 26,000 <strong>asylum</strong> applications<br />
reg<strong>is</strong>tered in Belgium in 2011 were at<br />
the highest level for more th<strong>an</strong> a decade.<br />
The number increased by one fifth<br />
(+19%) compared to 2010, making Belgium<br />
the sixth largest receiving country<br />
during the reporting period. Figures<br />
in Belgium have gone up for the fourth<br />
consecutive year. It <strong>is</strong> mainly Afgh<strong>an</strong><br />
<strong>asylum</strong>-<strong>seeker</strong>s who account for th<strong>is</strong><br />
+590<br />
+660<br />
-1,130<br />
-30<br />
10 Asylum Levels <strong>an</strong>d Trends in Industrialized Countries - 2011<br />
Asylum Levels <strong>an</strong>d Trends in Industrialized Countries - 2011<br />
11
<strong>is</strong>e, due to a more th<strong>an</strong> doubling of <strong>asylum</strong><br />
claims from 1,100 in 2010 to close to<br />
2,800 one year later. The number of Alb<strong>an</strong>i<strong>an</strong><br />
<strong>asylum</strong>-<strong>seeker</strong>s quintupled from<br />
210 claims in 2010 to more th<strong>an</strong> 1,100 in<br />
2011. Serbia (<strong>an</strong>d Kosovo: S/RES/1244<br />
(1999)) remained the leading country<br />
of origin of <strong>asylum</strong>-<strong>seeker</strong>s in Belgium<br />
with roughly 3,100 claims reg<strong>is</strong>tered.<br />
The United Kingdom was the seventh<br />
largest recipient of new <strong>asylum</strong>-<strong>seeker</strong>s<br />
in 2011 with 25,400 claims. Th<strong>is</strong> was<br />
the second lowest level in two decades.<br />
Compared to 2010, figures increased by<br />
12 per cent. The United Kingdom was<br />
followed by C<strong>an</strong>ada (25,300 claims), Switzerl<strong>an</strong>d<br />
(19,400 claims), Turkey (16,000<br />
claims), <strong>an</strong>d Austria (14,400). All four<br />
countries witnessed increases during<br />
the year r<strong>an</strong>ging from 9 per cent (C<strong>an</strong>ada)<br />
to 74 per cent (Turkey).<br />
TABLE 2<br />
Ch<strong>an</strong>ges in the r<strong>an</strong>king<br />
of the top-15 receiving<br />
countries<br />
Countries 2007 2008 2009 2010 2011<br />
United States 1 1 1 1 1<br />
Fr<strong>an</strong>ce 3 3 2 2 2<br />
Germ<strong>an</strong>y 7 7 5 3 3<br />
Italy 8 5 7 14 4<br />
Sweden 2 6 6 4 5<br />
Belgium 10 14 9 7 6<br />
United Kingdom 5 4 4 6 7<br />
C<strong>an</strong>ada 4 2 3 5 8<br />
Switzerl<strong>an</strong>d 11 9 13 8 9<br />
Turkey 13 12 15 15 10<br />
Austria 9 13 11 11 11<br />
Netherl<strong>an</strong>ds 15 11 12 9 12<br />
Australia 19 16 16 10 13<br />
Greece 6 8 10 12 14<br />
Norway 17 10 8 13 15<br />
R<strong>an</strong>king of countries<br />
The numbers of people requesting international<br />
protection have fluctuated<br />
signific<strong>an</strong>tly between countries <strong>an</strong>d<br />
years, largely depending on political<br />
developments in countries of origin or<br />
ch<strong>an</strong>ges in <strong>asylum</strong> polices in receiving<br />
countries. However, other factors<br />
may also be of relev<strong>an</strong>ce, including the<br />
ex<strong>is</strong>tence of social networks of certain<br />
communities in destination countries,<br />
improved capacity to reg<strong>is</strong>ter <strong>asylum</strong><strong>seeker</strong>s,<br />
<strong>an</strong>d the fact that some countries<br />
are perceived as being more likely<br />
to gr<strong>an</strong>t refugee status th<strong>an</strong> others.<br />
These factors are reflected in the<br />
current <strong>an</strong>d past r<strong>an</strong>kings of some of the<br />
countries included in th<strong>is</strong> report. Italy,<br />
for inst<strong>an</strong>ce, saw a sharp increase in<br />
new <strong>asylum</strong> applic<strong>an</strong>ts in 2008 (30,300<br />
claims), m<strong>an</strong>y arriving by sea. In 2008,<br />
Italy was the fifth largest recipient of<br />
<strong>asylum</strong>-<strong>seeker</strong>s among the group of 44<br />
industrialized countries. In 2009, Italy<br />
<strong>an</strong>d Libya concluded <strong>an</strong> agreement to<br />
turn boats back to the latter. As a consequence,<br />
the numbers of people requesting<br />
international protection in Italy<br />
dropped by almost half between 2008<br />
<strong>an</strong>d 2009 (17,600 applications). In 2010,<br />
th<strong>is</strong> trend continued, with only 10,400<br />
individuals seeking <strong>asylum</strong> in Italy <strong>an</strong>d<br />
the country then r<strong>an</strong>ked as the 14 th most<br />
popular destination among the group of<br />
industrialized countries. Following the<br />
‘Arab Spring’ in North Africa in early<br />
2011, arrivals by boat in Italy resumed,<br />
resulting in triple the number of <strong>asylum</strong><br />
applications in 2011 (34,100 claims) (16) .<br />
As a result, the country moved up in its<br />
r<strong>an</strong>king to become the 4 th highest destination<br />
country.<br />
Greece introduced special procedures<br />
at the end of 2006 to clear the<br />
backlog of <strong>asylum</strong>-<strong>seeker</strong>s waiting to<br />
reg<strong>is</strong>ter claims. As a consequence, the<br />
number of applic<strong>an</strong>ts reg<strong>is</strong>tered rose<br />
sharply in 2007, making Greece the<br />
6 th largest receiving country that year<br />
(25,100 claims). Since then, the number<br />
has decreased steadily to 9,300 applications<br />
in 2011, partly due to the slow<br />
pace of reg<strong>is</strong>tration of claims. As a consequence,<br />
Greece dropped to 14 th place.<br />
In 2008 <strong>an</strong>d 2009, C<strong>an</strong>ada was, respectively,<br />
the second <strong>an</strong>d third highest<br />
destination country for <strong>asylum</strong>-<strong>seeker</strong>s<br />
among the group of industrialized countries.<br />
The relatively high number of<br />
Czech <strong>asylum</strong> applications during th<strong>is</strong><br />
period partly contributed to C<strong>an</strong>ada’s<br />
high r<strong>an</strong>king. In the second half of 2009,<br />
C<strong>an</strong>ada introduced v<strong>is</strong>a requirements<br />
for Czech citizens. As a result, the number<br />
of <strong>asylum</strong>-<strong>seeker</strong>s from the Czech<br />
Republic dropped from more th<strong>an</strong><br />
2,000 in 2009, to almost zero in both<br />
2010 <strong>an</strong>d 2011. C<strong>an</strong>ada’s r<strong>an</strong>king subsequently<br />
dropped to 8 th place in 2011.<br />
16 Prov<strong>is</strong>ional figure subject to ch<strong>an</strong>ge.<br />
TABLE 3<br />
Share of main receiving<br />
countries of <strong>asylum</strong><strong>seeker</strong>s<br />
in total number<br />
of applications<br />
Countries 2007 2008 2009 2010 2011<br />
United States 15% 13% 13% 15% 17%<br />
Fr<strong>an</strong>ce 9% 9% 11% 13% 12%<br />
Germ<strong>an</strong>y 6% 6% 7% 11% 10%<br />
Italy 4% 8% 5% 3% 8%<br />
Sweden 11% 6% 6% 9% 7%<br />
Belgium 3% 3% 5% 6% 6%<br />
United Kingdom 8% 8% 8% 6% 6%<br />
C<strong>an</strong>ada 8% 10% 9% 6% 6%<br />
Switzerl<strong>an</strong>d 3% 4% 4% 4% 4%<br />
Turkey 2% 3% 2% 3% 4%<br />
Austria 4% 3% 4% 3% 3%<br />
Netherl<strong>an</strong>ds 2% 4% 4% 4% 3%<br />
Australia 1% 1% 2% 3% 3%<br />
Greece 8% 5% 4% 3% 2%<br />
Norway 2% 4% 5% 3% 2%<br />
Trends over the past five years<br />
Between 2007 <strong>an</strong>d 2011, the United States<br />
of America received the largest number<br />
of new <strong>asylum</strong>-<strong>seeker</strong>s (278,800 claims),<br />
followed by Fr<strong>an</strong>ce (206,900 claims), Germ<strong>an</strong>y<br />
(156,000 claims), C<strong>an</strong>ada (147,000<br />
claims), <strong>an</strong>d Sweden (146,400 claims). Together,<br />
the three leading <strong>asylum</strong> countries<br />
received one-third of all <strong>asylum</strong><br />
requests submitted in the 44 industrialized<br />
countries l<strong>is</strong>ted in Annex Table 1.<br />
The countries’ individual share in<br />
the total number of applications received<br />
reveals a ch<strong>an</strong>ging pattern over<br />
time. As a result of signific<strong>an</strong>tly more<br />
people seeking <strong>asylum</strong> in the United<br />
States of America, the country’s share<br />
as the main recipient over the five-year<br />
period from 2007 to 2011 increased from<br />
13 per cent in 2008-2009 to 17 per cent in<br />
2011. A similar trend has been observed<br />
for Germ<strong>an</strong>y <strong>an</strong>d Belgium where both<br />
countries’ shares have gradually increased:<br />
in the case of Germ<strong>an</strong>y, from 6<br />
per cent in 2007 to 10 per cent in 2011; in<br />
the case of Belgium, from 3 to 6 per cent.<br />
The share of Italy, on the other<br />
h<strong>an</strong>d, stood at 8 per cent in 2008 as a result<br />
of major arrivals of <strong>asylum</strong>-<strong>seeker</strong>s<br />
by boat. Two years later, it had dropped<br />
to 3 per cent. With <strong>asylum</strong> levels in Italy<br />
picking up again in 2011, the country’s<br />
share increased to 8 per cent.<br />
during 2007, Greece’s share had increased<br />
to 8 per cent following the introduction<br />
of special procedures at the<br />
end of 2006 to clear the backlog of <strong>asylum</strong>-<strong>seeker</strong>s<br />
waiting to reg<strong>is</strong>ter <strong>asylum</strong><br />
claims. However, by the end of 2011, its<br />
share was down to 2 per cent.<br />
The trends described above are<br />
based on the absolute numbers of reported<br />
<strong>asylum</strong> claims. The <strong>an</strong>alys<strong>is</strong><br />
ch<strong>an</strong>ges when comparing the number<br />
of <strong>asylum</strong>-<strong>seeker</strong>s to the size of the national<br />
population or the Gross domestic<br />
Product (gdp) (ppp) (17) . These measures<br />
may allow for a better compar<strong>is</strong>on<br />
among countries as they may more accurately<br />
reflect the capacity of a country<br />
to host <strong>asylum</strong>-<strong>seeker</strong>s. (18)<br />
Based on the first indicator (national<br />
population), between 2007 <strong>an</strong>d 2011 the<br />
two Mediterr<strong>an</strong>e<strong>an</strong> <strong>is</strong>l<strong>an</strong>ds of Malta <strong>an</strong>d<br />
Cyprus received, on average, the highest<br />
number of <strong>asylum</strong>-<strong>seeker</strong>s compared to<br />
their national population: 20.1 <strong>an</strong>d 17.1<br />
applic<strong>an</strong>ts per 1,000 inhabit<strong>an</strong>ts, respectively.<br />
Sweden r<strong>an</strong>ked third (15.6 applic<strong>an</strong>ts<br />
per 1,000 inhabit<strong>an</strong>ts), followed by<br />
Liechtenstein (14.7 applic<strong>an</strong>ts per 1,000<br />
inhabit<strong>an</strong>ts), Norway (11.7 applic<strong>an</strong>ts per<br />
1,000 inhabit<strong>an</strong>ts), <strong>an</strong>d Switzerl<strong>an</strong>d (9.8<br />
applic<strong>an</strong>ts per 1,000 inhabit<strong>an</strong>ts) [see<br />
Figure 3]. The United States of America<br />
<strong>an</strong>d Fr<strong>an</strong>ce, the two main recipients of<br />
new <strong>asylum</strong>-<strong>seeker</strong>s during th<strong>is</strong> period,<br />
were r<strong>an</strong>ked respectively 24 th <strong>an</strong>d 14 th ,<br />
with <strong>an</strong> average of one <strong>an</strong>d three <strong>asylum</strong>-<strong>seeker</strong>s<br />
per 1,000 inhabit<strong>an</strong>ts.<br />
Comparing the number of <strong>asylum</strong><strong>seeker</strong>s<br />
to the Gross domestic Product<br />
(ppp) of a country reveals a different picture.<br />
Here, the United States of America<br />
<strong>an</strong>d Fr<strong>an</strong>ce are the countries with the<br />
highest number of <strong>asylum</strong>-<strong>seeker</strong>s (5.9<br />
<strong>an</strong>d 6.1 applic<strong>an</strong>ts per capita each) compared<br />
to the national economy, followed<br />
by Germ<strong>an</strong>y (4.4 applic<strong>an</strong>ts per capita),<br />
Turkey (4.1 applic<strong>an</strong>ts per capita), <strong>an</strong>d<br />
the United Kingdom (4.0 applic<strong>an</strong>ts per<br />
capita) [see Figure 4]. (19)<br />
It <strong>is</strong> interesting to note that out of<br />
the five main destination countries of<br />
<strong>asylum</strong>-<strong>seeker</strong>s in 2011 (United States of<br />
America, Fr<strong>an</strong>ce, Germ<strong>an</strong>y, Italy, <strong>an</strong>d<br />
Sweden), only Sweden features among<br />
the top ten when compared against population<br />
size. But all five feature when<br />
compared against gdp (ppp) per capita.<br />
Fig. 3 Number of <strong>asylum</strong>-<strong>seeker</strong>s per 1,000 inhabit<strong>an</strong>ts<br />
| 2007-2011<br />
Malta<br />
Cyprus<br />
Sweden<br />
Liechtenstein<br />
Norway<br />
11.7<br />
Switzerl<strong>an</strong>d<br />
9.8<br />
Luxembourg<br />
8.4<br />
Belgium<br />
8.2<br />
Austria<br />
7.9<br />
Greece 7.1<br />
Fig. 4 Number of <strong>asylum</strong>-<strong>seeker</strong>s per 1 USD GDP (PPP)<br />
per capita | 2007-2011<br />
Fr<strong>an</strong>ce<br />
United States<br />
Germ<strong>an</strong>y<br />
Turkey<br />
United Kingdom<br />
Sweden<br />
C<strong>an</strong>ada<br />
Italy<br />
Greece<br />
2.9<br />
Belgium 2.4<br />
Th<strong>is</strong> may be explained by the relatively<br />
large variation in national population<br />
size among the industrialized countries.<br />
The top five destination countries<br />
have a signific<strong>an</strong>tly larger population<br />
size compared to Cyprus, Malta, or<br />
Liechtenstein. In the case of the gdp<br />
(ppp) per capita ratio, the countries included<br />
c<strong>an</strong> be considered as all having<br />
highly developed economies <strong>an</strong>d the<br />
variation in gdp figures between them<br />
<strong>is</strong> not that signific<strong>an</strong>t. With th<strong>is</strong> import<strong>an</strong>t<br />
difference in mind, the gdp indicator<br />
might be more me<strong>an</strong>ingful <strong>an</strong>d<br />
interesting when making compar<strong>is</strong>ons<br />
among these 44 countries. •<br />
17 In order to compare countries, the Purchasing Power Parity (PPP) GDP <strong>is</strong> considered (Source:<br />
International Monetary Fund, World Economic Outlook Database, April 2011). Source for national<br />
population: United Nations Population Div<strong>is</strong>ion, World Population Prospects: The 2010 Rev<strong>is</strong>ion, New<br />
York, 2011.<br />
18 For the purposes of th<strong>is</strong> type of <strong>an</strong>alys<strong>is</strong>, the number of <strong>asylum</strong> applications reg<strong>is</strong>tered over a five-year<br />
period has been considered to account for some extreme fluctuations in the values.<br />
19 Among the 44 countries included in th<strong>is</strong> report, the number of <strong>asylum</strong>-<strong>seeker</strong>s per 1 USD GDP (PPP)<br />
per capita appears as rather modest when compared to the ‘burden’ some developing countries shoulder in<br />
receiving <strong>asylum</strong>-<strong>seeker</strong>s. For inst<strong>an</strong>ce, Gh<strong>an</strong>a <strong>an</strong>d Ug<strong>an</strong>da, two major <strong>asylum</strong>-<strong>seeker</strong> receiving countries<br />
with 20,100 <strong>an</strong>d 12,700 <strong>asylum</strong> applications respectively reg<strong>is</strong>tered in 2011, received 8 <strong>an</strong>d 10 <strong>asylum</strong>-<strong>seeker</strong>s<br />
respectively per 1 USD GDP (PPP) per capita in 2011 only.<br />
3.6<br />
14.7<br />
4.1<br />
4.0<br />
3.9<br />
3.8<br />
15.6<br />
4.4<br />
17.1<br />
20.1<br />
6.1<br />
5.9<br />
12 Asylum Levels <strong>an</strong>d Trends in Industrialized Countries - 2011 Asylum Levels <strong>an</strong>d Trends in Industrialized Countries - 2011 13
IV<br />
Origin of <strong>asylum</strong>-<strong>seeker</strong>s<br />
In 2011, people from 200 different countries or territories submitted <strong>asylum</strong> claims in one of the<br />
44 countries presented in th<strong>is</strong> report. Slightly less th<strong>an</strong> half of all <strong>asylum</strong> applications were<br />
submitted by individuals from Asia (45%). Africa was the second most import<strong>an</strong>t source continent<br />
(27% of all claims), followed by Europe (15%), <strong>an</strong>d the Americas (8%). (20) The country of origin<br />
of some 19,500 <strong>asylum</strong>-<strong>seeker</strong>s was unknown. All major source regions of <strong>asylum</strong> applications<br />
showed either <strong>an</strong> increase or remained stable in 2011. Because signific<strong>an</strong>tly fewer people<br />
from Serbia (<strong>an</strong>d Kosovo: S/RES/1244 (1999)) <strong>an</strong>d The former Yugoslav Republic of Macedonia<br />
requested refugee status in 2011, Europe was the only continent to show a decrease as a source<br />
region of <strong>asylum</strong> applications in 2011 (-9%).<br />
An Afgh<strong>an</strong> <strong>asylum</strong>-seeking<br />
family in the Radauti<br />
Reception Centre in Radauti,<br />
Rom<strong>an</strong>ia.<br />
© UnhcR / B. SZAnDELSZKy<br />
Out of the 40 main<br />
a S Y l u m - s e e k e r<br />
nationalitieS, 32<br />
reg<strong>is</strong>tered a r<strong>is</strong>e during<br />
2011 amounting to 68,000<br />
claims. Th<strong>is</strong> <strong>is</strong> signific<strong>an</strong>tly more th<strong>an</strong><br />
in 2010 when 17 <strong>asylum</strong>-<strong>seeker</strong> nationalities<br />
recorded <strong>an</strong> increase. The eight<br />
nationalities reg<strong>is</strong>tering a decline in<br />
2011 submitted a total of 14,000 claims<br />
less th<strong>an</strong> in 2010. Among the major<br />
countries of origin of <strong>asylum</strong>-<strong>seeker</strong>s,<br />
signific<strong>an</strong>t increases were reg<strong>is</strong>tered<br />
from Tun<strong>is</strong>ia (+769%), Pak<strong>is</strong>t<strong>an</strong> (+66%),<br />
Mexico (+62%), <strong>an</strong>d Afgh<strong>an</strong><strong>is</strong>t<strong>an</strong> (+34%).<br />
Conversely, of the eight nationalities<br />
that recorded a decrease in 2011 as<br />
compared to 2010, only two reg<strong>is</strong>tered<br />
a drop of more th<strong>an</strong> 10 per cent: Serbia<br />
TABLE 4<br />
D<strong>is</strong>tribution of <strong>asylum</strong> claims<br />
by region of origin<br />
Countries 2008 2009 2010 2011<br />
Africa 29.9% 28.4% 25.7% 26.7%<br />
Americas 10.9% 8.8% 7.8% 8.0%<br />
Asia 44.8% 45.1% 45.3% 45.4%<br />
Europe 12.7% 15.4% 19.2% 14.6%<br />
Oce<strong>an</strong>ia 0.1% 0.1% 0.2% 0.1%<br />
Unknown * 1.5% 2.2% 1.9% 5.2%<br />
* Includes stateless <strong>asylum</strong>-<strong>seeker</strong>s.<br />
(<strong>an</strong>d Kosovo: S/RES/1244 (1999)) (-28%)<br />
<strong>an</strong>d The former Yugoslav Republic of Macedonia<br />
(-11%).<br />
Afgh<strong>an</strong><strong>is</strong>t<strong>an</strong>, China, Iraq, Serbia (<strong>an</strong>d<br />
Kosovo: S/RES/1244 (1999)) <strong>an</strong>d Pak<strong>is</strong>t<strong>an</strong><br />
were the five top source countries of<br />
<strong>asylum</strong>-<strong>seeker</strong>s in the 44 industrialized<br />
countries in 2011. Th<strong>is</strong> <strong>is</strong> comparable to<br />
2010, when Serbia, Afgh<strong>an</strong><strong>is</strong>t<strong>an</strong>, China,<br />
Iraq, <strong>an</strong>d the Russi<strong>an</strong> Federation were<br />
the top-r<strong>an</strong>king source countries.<br />
In 2011, Afgh<strong>an</strong><strong>is</strong>t<strong>an</strong> again became<br />
the main country of origin of <strong>asylum</strong><strong>seeker</strong>s<br />
in industrialized countries.<br />
20 The geographical regions used are those of the UN Stat<strong>is</strong>tics Div<strong>is</strong>ion (http://unstats.un.org/unsd/methods/m49/m49.htm)<br />
14 Asylum Levels <strong>an</strong>d Trends in Industrialized Countries - 2011 Asylum Levels <strong>an</strong>d Trends in Industrialized Countries - 2011 15
Fig. 5 Main nationalities of <strong>asylum</strong>-<strong>seeker</strong>s | 2011<br />
Other<br />
63%<br />
* Serbia (<strong>an</strong>d Kosovo: S/RES/1244 (1999))<br />
* Serbia (<strong>an</strong>d Kosovo: S/RES/1244 (1999))<br />
8%<br />
Afgh<strong>an</strong><strong>is</strong>t<strong>an</strong><br />
6%<br />
4%<br />
6%<br />
China<br />
4%<br />
5%<br />
4%<br />
Iraq<br />
Serbia *<br />
Pak<strong>is</strong>t<strong>an</strong><br />
Islamic Rep. of Ir<strong>an</strong><br />
Russi<strong>an</strong> Fed.<br />
Fig. 6 Asylum requests from Afgh<strong>an</strong><strong>is</strong>t<strong>an</strong>, China, Iraq<br />
<strong>an</strong>d Serbia | 2001 - 2011<br />
60,000<br />
50,000<br />
40,000<br />
30,000<br />
20,000<br />
10,000<br />
0<br />
‘01 ‘02 ‘03 ‘04 ‘05 ‘06 ‘07 ‘08 ‘09 ‘10 ‘11<br />
Afgh<strong>an</strong><strong>is</strong>t<strong>an</strong> Iraq Serbia * China<br />
The last time Afgh<strong>an</strong><strong>is</strong>t<strong>an</strong> was at the<br />
top of the l<strong>is</strong>t was in 2009 when some<br />
27,200 Afgh<strong>an</strong> citizens sought <strong>asylum</strong>.<br />
Prov<strong>is</strong>ional data indicate that some<br />
35,700 Afgh<strong>an</strong>s requested refugee status<br />
in 2011. Th<strong>is</strong> was 34 per cent more th<strong>an</strong><br />
in 2010 (26,600 claims). It <strong>is</strong> believed<br />
that the continued volatile situation in<br />
the country may be one reason why Afgh<strong>an</strong>s<br />
increasingly seek <strong>asylum</strong> abroad.<br />
The share of <strong>asylum</strong>-<strong>seeker</strong>s from Afgh<strong>an</strong><strong>is</strong>t<strong>an</strong><br />
in the total number of <strong>asylum</strong><br />
claims has remained stable between<br />
2009 <strong>an</strong>d 2010 (7% each). However, in<br />
2011, they constituted almost 9 per cent<br />
of all <strong>asylum</strong> applications lodged in the<br />
44 industrialized countries [see Figure 5].<br />
Afgh<strong>an</strong> <strong>asylum</strong>-<strong>seeker</strong>s sought international<br />
protection in 42 out of the<br />
44 industrialized countries. The levels<br />
were highest in Germ<strong>an</strong>y (7,800 claims)<br />
<strong>an</strong>d Sweden (4,100 claims). In Germ<strong>an</strong>y,<br />
the number of Afgh<strong>an</strong> <strong>asylum</strong> claims<br />
went up by 32 per cent while in Sweden<br />
by 72 per cent. Other import<strong>an</strong>t destination<br />
countries were Austria (3,600<br />
© UnhcR / D. TELEm<strong>an</strong>s<br />
Children in a playing field at the Fedasil <strong>asylum</strong> centre in Bovigny, Belgium.<br />
Belgium has 45 reception centres for <strong>asylum</strong>-<strong>seeker</strong>s. They are m<strong>an</strong>aged by<br />
Fedasil or the Belgi<strong>an</strong> Red Cross.<br />
claims), Belgium (2,800), <strong>an</strong>d Turkey<br />
(2,500; unhCR procedure). In all three<br />
cases, figures more th<strong>an</strong> doubled in 2011.<br />
Serbia (<strong>an</strong>d Kosovo: S/RES/1244 (1999))<br />
emerged as a new destination country<br />
for Afgh<strong>an</strong> <strong>asylum</strong>-<strong>seeker</strong>s: 1,700 <strong>asylum</strong><br />
claims were lodged in 2011 compared<br />
to only 320 a year earlier (+432%).<br />
In contrast, signific<strong>an</strong>t decreases in the<br />
number of Afgh<strong>an</strong> <strong>asylum</strong> applications<br />
were reg<strong>is</strong>tered in Australia (-45%) due<br />
to fewer boat arrivals.<br />
With 24,400 <strong>asylum</strong> applications<br />
submitted by Chinese <strong>asylum</strong>-<strong>seeker</strong>s<br />
in 2011, the figure <strong>is</strong> at its highest since<br />
2003 (25,600 claims). The number increased<br />
by 13 per cent compared to 2010<br />
(21,600 claims). Th<strong>is</strong> made China the<br />
second highest-r<strong>an</strong>king source country<br />
of <strong>asylum</strong>-<strong>seeker</strong>s among the 44 industrialized<br />
countries. Similar to previous<br />
years, the United States of America<br />
reg<strong>is</strong>tered more th<strong>an</strong> half of all Chinese<br />
<strong>asylum</strong> applications (15,450). Fr<strong>an</strong>ce<br />
was the second largest recipient with<br />
2,200 Chinese <strong>asylum</strong> requests, slightly<br />
more th<strong>an</strong> a year earlier (1,900 claims)<br />
[see Figure 6].<br />
After having constituted the main<br />
group of <strong>asylum</strong>-<strong>seeker</strong>s in industrialized<br />
countries in 2008 (40,400 claims),<br />
the number of Iraq<strong>is</strong> seeking <strong>asylum</strong><br />
had halved by 2010 (20,600 claims). Th<strong>is</strong><br />
trend was reversed in 2011 with 23,500<br />
Iraq<strong>is</strong> requesting international protection,<br />
2,900 claims more (+14%) th<strong>an</strong> the<br />
year before [see Figure 6]. Iraq thus became<br />
the third highest country of origin<br />
of <strong>asylum</strong>-<strong>seeker</strong>s among the group of<br />
industrialized countries. The increase<br />
was particularly signific<strong>an</strong>t in Turkey<br />
where UNHCR conducts refugee status<br />
determination under its m<strong>an</strong>date. Here,<br />
the figure more th<strong>an</strong> doubled from 3,700<br />
in 2010 to 7,900 in 2011. Germ<strong>an</strong>y reg<strong>is</strong>tered<br />
5,800 new Iraqi <strong>asylum</strong> claims,<br />
virtually unch<strong>an</strong>ged from 2010. Sweden,<br />
on the other h<strong>an</strong>d, experienced a<br />
rather dramatic decrease in Iraqi claims<br />
in the past years, with figures having<br />
fallen from as high as 18,600 in 2006.<br />
Sweden reg<strong>is</strong>tered 1,600 Iraqi claims in<br />
2011. Other import<strong>an</strong>t destination countries<br />
were Belgium (2,000 claims) <strong>an</strong>d<br />
the Netherl<strong>an</strong>ds (1,400 claims).<br />
Serbia (<strong>an</strong>d Kosovo: S/RES/1244 (1999))<br />
was the main country of origin of <strong>asylum</strong>-<strong>seeker</strong>s<br />
in 2010 with 29,600 <strong>asylum</strong><br />
claims reg<strong>is</strong>tered, 50 per cent higher<br />
th<strong>an</strong> in 2009. Th<strong>is</strong> signific<strong>an</strong>t increase<br />
was widely attributed to the Europe<strong>an</strong><br />
Union’s introduction as of 19 december<br />
2009 of v<strong>is</strong>a-free entry for holders<br />
of Serbi<strong>an</strong> passports. In 2011, however,<br />
Serbia (<strong>an</strong>d Kosovo: S/RES/1244 (1999))<br />
dropped to fourth place with 21,200<br />
reg<strong>is</strong>tered claims during the year [see<br />
Figure 6]. Th<strong>is</strong> constituted a decrease of<br />
8,400 claims (-28%) when compared to<br />
2010. The drop was particularly signific<strong>an</strong>t<br />
in Sweden <strong>an</strong>d Fr<strong>an</strong>ce. In the former,<br />
4,000 fewer claims were lodged in<br />
2011 (-50%) while in the latter, there were<br />
2,300 fewer claims submitted (-40%). In<br />
Luxembourg, however, the number of<br />
<strong>asylum</strong> claims from people originating<br />
from Serbia (<strong>an</strong>d Kosovo: S/RES/1244<br />
(1999)) more th<strong>an</strong> tripled from 300 in<br />
2010 to 1,100 a year later, stretching reception<br />
facilities for <strong>asylum</strong>-<strong>seeker</strong>s to a<br />
maximum. Overall, Germ<strong>an</strong>y was the<br />
prime destination for <strong>asylum</strong>-<strong>seeker</strong>s<br />
from Serbia (<strong>an</strong>d Kosovo: S/RES/1244<br />
(1999)) in 2011 (6,000 claims).<br />
About four-fifths of the countries<br />
reporting monthly <strong>asylum</strong> stat<strong>is</strong>tics to<br />
unhCR d<strong>is</strong>tingu<strong>is</strong>h applic<strong>an</strong>ts originating<br />
from Kosovo (S/RES/1244 (1999)<br />
in their data. The available evidence<br />
shows that the proportion of <strong>asylum</strong><strong>seeker</strong>s<br />
from Kosovo in these countries<br />
has decreased over the past three years.<br />
In 2009, on average, 74 per cent of applic<strong>an</strong>ts<br />
from Serbia came from Kosovo.<br />
Th<strong>is</strong> figure dropped to 45 per cent in<br />
2010 <strong>an</strong>d to a further 41 per cent in 2011.<br />
Among the main receiving countries,<br />
the proportion of people from Serbia<br />
originating from Kosovo <strong>is</strong> highest in<br />
Fr<strong>an</strong>ce (84%), Austria (66%), <strong>an</strong>d Belgium<br />
(48%). It <strong>is</strong> relatively low in Luxembourg<br />
(13%), Germ<strong>an</strong>y (23%), Sweden<br />
(31%), <strong>an</strong>d Switzerl<strong>an</strong>d (35%).<br />
With 18,100 applications submitted<br />
by <strong>asylum</strong>-<strong>seeker</strong>s from Pak<strong>is</strong>t<strong>an</strong> in<br />
2011, the figure <strong>is</strong> the highest on record.<br />
The number increased by two-thirds<br />
(+66%) compared to 2010 (11,000 claims).<br />
Th<strong>is</strong> made Pak<strong>is</strong>t<strong>an</strong> the fifth highest<br />
source country of <strong>asylum</strong>-<strong>seeker</strong>s in the<br />
industrialized world. The increase was<br />
particularly signific<strong>an</strong>t in the United<br />
Kingdom <strong>an</strong>d Germ<strong>an</strong>y, the two main<br />
destination countries. In the former,<br />
close to 4,000 <strong>asylum</strong> applications were<br />
reg<strong>is</strong>tered, up 86 per cent from 2,100<br />
the year earlier. In the latter, figures<br />
tripled from 840 claims to more th<strong>an</strong><br />
2,500 during the same period. Among<br />
the 19 countries reg<strong>is</strong>tering 100 or more<br />
16 Asylum Levels <strong>an</strong>d Trends in Industrialized Countries - 2011 Asylum Levels <strong>an</strong>d Trends in Industrialized Countries - 2011 17
TABLE 5<br />
Ch<strong>an</strong>ges in the r<strong>an</strong>king of the top-15<br />
countries of origin<br />
Countries of origin 2007 2008 2009 2010 2011<br />
Afgh<strong>an</strong><strong>is</strong>t<strong>an</strong> 8 4 1 2 1<br />
China 3 5 5 3 2<br />
Iraq 1 1 2 4 3<br />
Serbia* 4 6 6 1 4<br />
Pak<strong>is</strong>t<strong>an</strong> 5 8 8 8 5<br />
Islamic Rep. of Ir<strong>an</strong> 9 11 9 7 6<br />
Russi<strong>an</strong> Federation 2 3 4 5 7<br />
Somalia 6 2 3 6 8<br />
Eritrea 12 9 12 11 9<br />
Nigeria 13 7 7 9 10<br />
Mexico 7 10 13 17 11<br />
Sri L<strong>an</strong>ka 10 12 11 10 12<br />
Syri<strong>an</strong> Arab Rep. 17 20 19 20 13<br />
Tun<strong>is</strong>ia 77 71 66 66 14<br />
B<strong>an</strong>gladesh 16 15 17 15 15<br />
* Serbia (<strong>an</strong>d Kosovo: SC/RES/1244 (1999)).<br />
V<br />
Annex<br />
For <strong>asylum</strong>-<strong>seeker</strong>s from Côte d’Ivoire, Libya, the<br />
Syri<strong>an</strong> Arab Republic, <strong>an</strong>d Tun<strong>is</strong>ia, levels were at a record<br />
high among the industrialized countries.<br />
<strong>asylum</strong> claims by Pak<strong>is</strong>t<strong>an</strong>i citizens in<br />
2011, 16 reported <strong>an</strong> increase. With 2,300<br />
claims reg<strong>is</strong>tered, Greece was the only<br />
major destination country showing a<br />
drop in Pak<strong>is</strong>t<strong>an</strong>i <strong>asylum</strong> claims (-16%).<br />
The number of <strong>asylum</strong>-<strong>seeker</strong>s<br />
originating from the Islamic Republic<br />
of Ir<strong>an</strong> increased by one fifth in 2011<br />
(+19%), the highest for more th<strong>an</strong> a decade.<br />
Some 18,100 <strong>asylum</strong>-<strong>seeker</strong>s were<br />
reg<strong>is</strong>tered during the year in the 44<br />
countries covered by th<strong>is</strong> report. Turkey<br />
remained the prime destination<br />
with 3,400 <strong>asylum</strong> claims or almost<br />
one fifth of all Ir<strong>an</strong>i<strong>an</strong> requests being<br />
lodged. Germ<strong>an</strong>y <strong>an</strong>d the United Kingdom<br />
also received a signific<strong>an</strong>t number<br />
of Ir<strong>an</strong>i<strong>an</strong> <strong>asylum</strong>-<strong>seeker</strong>s with 3,400<br />
<strong>an</strong>d 3,000 claims respectively. In both<br />
cases, the numbers went up by about<br />
one third compared to 2010.<br />
Other signific<strong>an</strong>t source countries of<br />
<strong>asylum</strong>-<strong>seeker</strong>s in the 44 industrialized<br />
countries in 2011 were the Russi<strong>an</strong> Federation<br />
(17,000 claims), Somalia (15,500),<br />
Eritrea (10,600), Nigeria (10,500), <strong>an</strong>d<br />
Mexico (8,900).<br />
For <strong>asylum</strong>-<strong>seeker</strong>s from Côte<br />
d’Ivoire, Libya, the Syri<strong>an</strong> Arab Republic,<br />
<strong>an</strong>d Tun<strong>is</strong>ia, levels were at a record high<br />
among the industrialized countries.<br />
For Tun<strong>is</strong>ia, figures went up nine-fold,<br />
from 900 in 2010 to 7,900 in 2011. Italy<br />
<strong>an</strong>d Switzerl<strong>an</strong>d together received<br />
three quarters of those claims. In the<br />
case of Côte d’Ivoire, figures stood at<br />
5,200 <strong>asylum</strong> applications during 2011<br />
(+180%) with Fr<strong>an</strong>ce being the prime<br />
destination (1,700 claims). Out of the<br />
8,400 Syri<strong>an</strong> <strong>asylum</strong> claims in 2011<br />
(+68%), one third were submitted in<br />
Germ<strong>an</strong>y alone. The almost five-fold<br />
increase in Liby<strong>an</strong> <strong>asylum</strong>-<strong>seeker</strong>s<br />
(3,800 claims) was concentrated in the<br />
United Kingdom which reg<strong>is</strong>tered one<br />
third of all claims.<br />
Over the last five years, some<br />
ch<strong>an</strong>ges have occurred in the r<strong>an</strong>king<br />
of the main countries of origin of <strong>asylum</strong><br />
applic<strong>an</strong>ts. In 2007, Afgh<strong>an</strong><strong>is</strong>t<strong>an</strong><br />
r<strong>an</strong>ked as the 8 th highest source country.<br />
Over the last three years, it has<br />
moved up the l<strong>is</strong>t occupying either the<br />
1 st or 2 nd position. The Russi<strong>an</strong> Federation<br />
was the 2 nd largest source country<br />
in 2007 but fell to 7 th place in 2011, while<br />
the Islamic Republic of Ir<strong>an</strong> moved up<br />
from 11 th in 2008 to 6 th place in 2011. Tun<strong>is</strong>ia<br />
saw a signific<strong>an</strong>t ch<strong>an</strong>ge, moving<br />
from 66 th in 2010 to 14 th place in 2011,<br />
only one year later. •<br />
18 Asylum Levels <strong>an</strong>d Trends in Industrialized Countries - 2011<br />
Asylum Levels <strong>an</strong>d Trends in Industrialized Countries - 2011<br />
19
TABLE 1<br />
Asylum applications submitted in Europe <strong>an</strong>d selected non-Europe<strong>an</strong> countries<br />
| 2007-2011<br />
For country notes <strong>an</strong>d regional classification, see next page.<br />
Country/region<br />
of <strong>asylum</strong> 2007 2008 2009 2010 2011 Total<br />
Annual<br />
ch<strong>an</strong>ge<br />
‘11-’10<br />
Per 1,000 inhabit<strong>an</strong>ts Per 1 USD/GDP per capita *<br />
Share R<strong>an</strong>k Total R<strong>an</strong>k Total R<strong>an</strong>k<br />
2011 ‘07-’11 2011 ‘07-’11 2011 ‘07-’11 2011 ‘07-’11 2011 ‘07-’11 2011 ‘07-’11<br />
Alb<strong>an</strong>ia 30 10 - 10 20 70 100% 0% 0% 44 44 0.0 0.0 44 44 0.0 0.0 42 41<br />
Australia 3,980 4,770 7,420 12,640 11,510 40,320 -9% 3% 2% 13 15 0.5 1.8 18 19 0.3 1.0 14 16<br />
Austria 11,920 12,840 15,820 11,010 14,430 66,020 31% 3% 3% 11 11 1.7 7.9 8 9 0.4 1.7 12 13<br />
Belgium 11,120 12,250 17,190 21,760 25,980 88,300 19% 6% 5% 6 8 2.4 8.2 5 8 0.7 2.4 8 10<br />
Bosnia <strong>an</strong>d<br />
Herzegovina<br />
570 100 50 50 40 810 -20% 0% 0% 43 38 0.0 0.2 43 39 0.0 0.1 40 31<br />
Bulgaria 980 750 850 1,030 890 4,500 -14% 0% 0% 29 29 0.1 0.6 33 28 0.1 0.3 26 25<br />
C<strong>an</strong>ada 28,340 36,900 33,250 23,160 25,350 147,000 9% 6% 8% 8 4 0.7 4.3 12 11 0.6 3.8 9 7<br />
Croatia 200 160 150 290 810 1,610 179% 0% 0% 30 32 0.2 0.4 27 35 0.0 0.1 28 33<br />
Cyprus 6,790 3,920 3,200 3,160 1,770 18,840 -44% 0% 1% 24 18 1.6 17.1 9 2 0.1 0.9 23 17<br />
Czech Rep. 1,880 1,710 1,360 490 490 5,930 0% 0% 0% 32 25 0.0 0.6 39 29 0.0 0.2 36 28<br />
denmark 1,850 2,360 3,820 4,970 3,810 16,810 -23% 1% 1% 17 20 0.7 3.0 14 16 0.1 0.5 20 22<br />
Estonia 10 10 40 30 70 160 133% 0% 0% 40 43 0.1 0.1 38 40 0.0 0.0 41 42<br />
Finl<strong>an</strong>d 1,430 4,020 5,910 4,020 3,090 18,470 -23% 1% 1% 20 19 0.6 3.4 15 13 0.1 0.5 22 21<br />
Fr<strong>an</strong>ce 29,390 35,400 42,120 48,070 51,910 206,890 8% 12% 11% 2 2 0.8 3.3 10 14 1.5 6.1 2 1<br />
Germ<strong>an</strong>y 19,160 22,090 27,650 41,330 45,740 155,970 11% 10% 8% 3 3 0.6 1.9 17 18 1.3 4.4 3 3<br />
Greece 25,110 19,880 15,930 10,270 9,310 80,500 -9% 2% 4% 14 9 0.8 7.1 11 10 0.3 2.9 13 9<br />
Hungary 3,430 3,120 4,670 2,100 1,690 15,010 -20% 0% 1% 26 21 0.2 1.5 28 21 0.1 0.8 21 18<br />
Icel<strong>an</strong>d 40 80 40 50 70 280 40% 0% 0% 40 41 0.2 0.9 26 25 0.0 0.0 43 43<br />
Irel<strong>an</strong>d 3,990 3,870 2,690 1,940 1,290 13,780 -34% 0% 1% 27 22 0.3 3.1 23 15 0.0 0.4 29 24<br />
Italy 14,050 30,320 17,600 10,050 34,120 106,140 240% 8% 6% 4 7 0.6 1.8 16 20 1.2 3.6 5 8<br />
Jap<strong>an</strong> 820 1,600 1,390 1,200 1,870 6,880 56% 0% 0% 22 24 0.0 0.1 42 43 0.1 0.2 27 29<br />
Latvia 30 50 50 60 340 530 467% 0% 0% 35 39 0.2 0.2 30 38 0.0 0.0 33 39<br />
Liechtenstein 30 30 290 110 70 530 -36% 0% 0% 40 39 1.9 14.7 6 4 .. .. .. ..<br />
Lithu<strong>an</strong>ia 130 220 210 370 410 1,340 11% 0% 0% 34 35 0.1 0.4 32 34 0.0 0.1 32 34<br />
Luxembourg 430 460 480 740 2,160 4,270 192% 0% 0% 21 30 4.3 8.4 2 7 0.0 0.1 31 36<br />
Malta 1,380 2,610 2,390 140 1,850 8,370 1221% 0% 0% 23 23 4.4 20.1 1 1 0.1 0.3 25 26<br />
Montenegro - 10 20 10 240 280 2300% 0% 0% 39 41 0.4 0.4 20 33 0.0 0.0 34 40<br />
Netherl<strong>an</strong>ds 7,100 13,400 14,910 13,330 11,590 60,330 -13% 3% 3% 12 12 0.7 3.6 13 12 0.3 1.5 15 14<br />
New Zeal<strong>an</strong>d 250 250 340 340 310 1,490 -9% 0% 0% 36 33 0.1 0.3 37 36 0.0 0.1 38 35<br />
Norway 6,530 14,430 17,230 10,060 9,050 57,300 -10% 2% 3% 15 13 1.9 11.7 7 5 0.2 1.1 17 15<br />
Pol<strong>an</strong>d 7,210 7,200 10,590 6,530 5,190 36,720 -21% 1% 2% 16 16 0.1 1.0 31 23 0.3 1.9 16 11<br />
Portugal 220 160 140 160 280 960 75% 0% 0% 38 37 0.0 0.1 40 41 0.0 0.0 37 38<br />
Rep. of Korea 720 360 320 430 1,010 2,840 135% 0% 0% 28 31 0.0 0.1 41 42 0.0 0.1 30 32<br />
Rom<strong>an</strong>ia 660 1,170 840 860 1,720 5,250 100% 0% 0% 25 27 0.1 0.2 35 37 0.1 0.4 18 23<br />
Serbia (<strong>an</strong>d Kosovo:<br />
S/RES/1244 (1999))<br />
60 80 310 790 3,320 4,560 320% 1% 0% 19 28 0.3 0.5 22 32 0.4 0.6 11 20<br />
- of which Kosovo 10 - 30 270 190 500 -30% .. .. .. .. .. .. .. .. .. .. .. ..<br />
Slovakia 2,640 910 820 540 450 5,360 -17% 0% 0% 33 26 0.1 1.0 34 22 0.0 0.2 35 27<br />
Slovenia 430 240 180 250 310 1,410 24% 0% 0% 36 34 0.2 0.7 29 27 0.0 0.1 39 37<br />
Spain 7,660 4,520 3,010 2,740 3,410 21,340 24% 1% 1% 18 17 0.1 0.5 36 31 0.1 0.7 19 19<br />
Sweden 36,370 24,350 24,190 31,820 29,650 146,380 -7% 7% 8% 5 5 3.2 15.6 3 3 0.8 3.9 6 6<br />
Switzerl<strong>an</strong>d 10,840 16,610 14,490 13,520 19,440 74,900 44% 4% 4% 9 10 2.5 9.8 4 6 0.5 1.8 10 12<br />
The former<br />
Yugoslav Rep. of<br />
30 50 90 180 740 1,090 311% 0% 0% 31 36 0.4 0.5 21 30 0.1 0.1 24 30<br />
Macedonia<br />
Turkey 7,650 12,980 7,830 9,230 16,020 53,710 74% 4% 3% 10 14 0.2 0.7 25 26 1.2 4.1 4 4<br />
United Kingdom 28,300 31,320 30,670 22,640 25,420 138,350 12% 6% 7% 7 6 0.4 2.2 19 17 0.7 4.0 7 5<br />
United States 50,720 49,560 49,020 55,530 74,020 278,850 33% 17% 15% 1 1 0.2 0.9 24 24 1.6 5.9 1 2<br />
Notes<br />
Source: Governments, UNHCR.<br />
Th<strong>is</strong> table includes final data for 2007 to 2010. In the following tables, the 2010 figures are based on<br />
the monthly database. Th<strong>is</strong> results in some d<strong>is</strong>crep<strong>an</strong>cies.<br />
All figures in th<strong>is</strong> table have been rounded to the closest ten.<br />
* Th<strong>is</strong> refers to Gross Domestic Product (GDP), Purchasing Power Parity (PPP), per<br />
capita.<br />
Table 1. Notes<br />
a. Country notes<br />
Australia. Figures for 2007-2008 are based on the number of applications for protection<br />
v<strong>is</strong>as lodged, not <strong>asylum</strong> applications.<br />
Belgium. Figures include accomp<strong>an</strong>ying children since 2009. Data include repeat<br />
applications (2,800 in 2007; 3,330 in 2008; 4,260 in 2009).<br />
C<strong>an</strong>ada. Source: Citizenship <strong>an</strong>d Immigration C<strong>an</strong>ada.<br />
Cyprus. In addition, UNHCR reg<strong>is</strong>tered <strong>asylum</strong> applications in the northern part of<br />
Cyprus<br />
in 2007 (44) <strong>an</strong>d 2008 (19).<br />
Denmark. Figures for 2007-2008 exclude Iraqi interpreters who worked for the D<strong>an</strong><strong>is</strong>h<br />
Forces<br />
in Iraq.<br />
Fr<strong>an</strong>ce. Includes <strong>asylum</strong> applications of minors.<br />
Jap<strong>an</strong>. Figures are UNHCR estimates.<br />
Italy. The 2011 figure <strong>is</strong> prov<strong>is</strong>ional <strong>an</strong>d subject to ch<strong>an</strong>ge since the Government of Italy<br />
<strong>is</strong> still processing <strong>asylum</strong> claims received in 2011.<br />
Montenegro. Data prior to 2008 are UNHCR figures.<br />
Pol<strong>an</strong>d. Data excludes a signific<strong>an</strong>t number of repeat applications. December 2011 data<br />
estimated by UNHCR.<br />
TABLE 2<br />
Serbia. Source: UNHCR (2007-2010).<br />
Spain. Includes applications lodged at Sp<strong>an</strong><strong>is</strong>h embassies.<br />
Switzerl<strong>an</strong>d. Figures exclude repeat applications.<br />
Turkey. Source: UNHCR.<br />
United States. Figures include (1) stat<strong>is</strong>tics from the US Department of Homel<strong>an</strong>d<br />
Security (DHS), based on the number of cases <strong>an</strong>d multiplied by 1.4 to reflect the<br />
estimated number of individuals; <strong>an</strong>d (2) the number of new («defensive») requests<br />
lodged with the Department of Justice, Executive Office for Immigration Review<br />
(EOIR), based on the number of individuals.<br />
b. Regional classification<br />
EU-“old” (15). Austria, Belgium, Denmark, Finl<strong>an</strong>d, Fr<strong>an</strong>ce, Germ<strong>an</strong>y, Greece, Irel<strong>an</strong>d,<br />
Italy, Luxembourg, Netherl<strong>an</strong>ds, Portugal, Spain, Sweden <strong>an</strong>d United Kingdom.<br />
EU-“new” (12). Bulgaria, Cyprus, Czech Republic, Estonia, Hungary, Latvia, Lithu<strong>an</strong>ia,<br />
Malta, Pol<strong>an</strong>d, Rom<strong>an</strong>ia, Slovakia <strong>an</strong>d Slovenia.<br />
EU-Total (27). EU-“old” <strong>an</strong>d EU-“new”.<br />
Nordic countries (5). Denmark, Finl<strong>an</strong>d, Icel<strong>an</strong>d, Norway <strong>an</strong>d Sweden.<br />
Western Europe (19). EU-“old” plus Icel<strong>an</strong>d, Norway, Liechtenstein <strong>an</strong>d Switzerl<strong>an</strong>d.<br />
Southern Europe (8). Alb<strong>an</strong>ia, Cyprus, Greece, Italy, Malta, Portugal, Spain <strong>an</strong>d Turkey.<br />
Former Yugoslavia (6). Bosnia <strong>an</strong>d Herzegovina, Croatia, Montenegro, Serbia<br />
(<strong>an</strong>d Kosovo: S/RES/1244 (1999)), Slovenia, <strong>an</strong>d The former Yugoslav Republic of<br />
Macedonia.<br />
Total Europe (38). All Europe<strong>an</strong> countries l<strong>is</strong>ted.<br />
Source for national population: United Nations, Population Div<strong>is</strong>ion, “World Population<br />
Prospects: The 2010 Rev<strong>is</strong>ion”, New York, 2011.<br />
Source for Gross Domestic Product (PPP): International Monetary Fund, World<br />
Economic Outlook Database, April 2011.<br />
Asylum applications submitted in selected countries in Eastern Europe<br />
| 2007-2011<br />
All figures are based on <strong>an</strong>nual data<br />
Country<br />
of <strong>asylum</strong> 2007 2008 2009 2010 2011 Total<br />
Annual<br />
ch<strong>an</strong>ge<br />
‘11-’10<br />
Per 1,000 inhabit<strong>an</strong>ts Per 1 USD/GDP per capita<br />
Share<br />
R<strong>an</strong>k<br />
Total R<strong>an</strong>k Total R<strong>an</strong>k<br />
2011 ‘07-’11 2011 ‘07-’11 2011 ‘07-’11 2011 ‘07-’11 2011 ‘07-’11 2011 ‘07-’11<br />
Armenia 300 210 70 50 70 700 40% 3% 3% 6 4 0.0 0.2 4 1 0.0 0.1 6 5<br />
Azerbaij<strong>an</strong> 540 380 250 270 220 1,660 -19% 8% 6% 3 3 0.0 0.2 3 3 0.0 0.2 4 3<br />
Belarus 50 90 160 150 90 540 -40% 3% 2% 4 5 0.0 0.1 6 7 0.0 0.0 7 7<br />
Georgia 20 40 40 70 80 250 14% 3% 1% 5 7 0.0 0.1 5 6 0.0 0.0 5 6<br />
Rep. of Moldova 80 60 90 130 70 430 -46% 3% 2% 6 6 0.0 0.1 1 4 0.0 0.1 3 4<br />
Russi<strong>an</strong> Federation 3,370 5,420 2,710 2,180 1,270 14,950 -42% 47% 56% 1 1 0.0 0.1 7 5 0.1 1.0 2 2<br />
Ukraine 2,270 2,240 1,360 1,500 890 8,260 -41% 33% 31% 2 2 0.0 0.2 2 2 0.1 1.2 1 1<br />
Total 6,630 8,440 4,680 4,350 2,690 26,790 -38% 0.0 0.1<br />
Notes<br />
Source: Governments, UNHCR<br />
All figures in th<strong>is</strong> table have been rounded to the closest ten.<br />
Azerbaij<strong>an</strong>. Source: Government <strong>an</strong>d UNHCR.<br />
Russi<strong>an</strong> Federation. In addition, 2,990 persons applied for temporary <strong>asylum</strong> in 2009, 1,710 in 2010 <strong>an</strong>d 1,030 in 2011.<br />
Source for national population: United Nations, Population Div<strong>is</strong>ion, “World Population Prospects: The 2010 Rev<strong>is</strong>ion”, New York, 2011.<br />
Source for Gross Domestic Product (PPP): International Monetary Fund, World Economic Outlook Database, April 2011.<br />
EU-“Old” (15) 198,100 217,240 222,130 224,850 262,190 1,124,510 17% 59% 59% 0.7 2.8<br />
EU-“New” (12) 25,570 21,910 25,200 15,560 15,180 103,420 -2% 3% 5% 0.1 1.0<br />
EU-Total (27) 223,670 239,150 247,330 240,410 277,370 1,227,930 15% 63% 65% 0.6 2.5<br />
Nordic countries (5) 46,220 45,240 51,190 50,920 45,670 239,240 -10% 10% 13% 1.8 9.4<br />
Western Europe (19) 215,540 248,390 254,180 248,590 290,820 1,257,520 17% 66% 66% 0.7 3.1<br />
Southern Europe (8) 62,890 74,400 50,100 35,760 66,780 289,930 87% 15% 15% 0.3 1.4<br />
Former<br />
Yugoslavia (6) 1,280 640 770 1,300 5,270 9,260 305% 1% 0% 0.2 0.4<br />
Total Europe (38) 249,650 283,690 287,830 274,710 327,190 1,423,090 19% 74% 75% 0.5 2.3<br />
C<strong>an</strong>ada/USA 79,060 86,460 82,270 78,690 99,370 425,850 26% 23% 22% 0.3 1.2<br />
Australia/<br />
New Zeal<strong>an</strong>d<br />
4,230 5,020 7,760 12,980 11,820 41,810 -9% 3% 2% 0.4 1.6<br />
Jap<strong>an</strong>/Rep. of Korea 1,540 1,960 1,710 1,630 2,880 9,720 77% 1% 1% 0.0 0.1<br />
Total (44) 334,480 377,130 379,570 368,010 441,260 1,900,470 20% 0.4 1.6<br />
20 Asylum Levels <strong>an</strong>d Trends in Industrialized Countries - 2011 Asylum Levels <strong>an</strong>d Trends in Industrialized Countries - 2011<br />
21
TABLE 3 Origin of <strong>asylum</strong> applications lodged in 44 industrialized countries | 2010 <strong>an</strong>d 2011<br />
TABLE 4<br />
Covering all 44 countries which provided monthly data to UNHCR.<br />
R<strong>an</strong>king based on 2011 data.<br />
Origin of <strong>asylum</strong> applications lodged in Europe | 2010 <strong>an</strong>d 2011<br />
Covering 38 Europe<strong>an</strong> countries which provided monthly data to UNHCR.<br />
R<strong>an</strong>king based on 2011 data.<br />
Annual<br />
Share<br />
R<strong>an</strong>k<br />
Origin 2010 2011 Total ch<strong>an</strong>ge 2010 2011 Total 2010 2011<br />
Afgh<strong>an</strong><strong>is</strong>t<strong>an</strong> 26,619 35,729 62,348 34% 7.5 8.4 8.0 2 1<br />
China 21,597 24,446 46,043 13% 6.1 5.7 5.9 3 2<br />
Iraq 20,572 23,469 44,041 14% 5.8 5.5 5.6 4 3<br />
Serbia (<strong>an</strong>d Kosovo: S/RES/1244(1999)) 29,605 21,246 50,851 -28% 8.3 5.0 6.5 1 4<br />
Pak<strong>is</strong>t<strong>an</strong> 10,959 18,141 29,100 66% 3.1 4.3 3.7 8 5<br />
Islamic Rep. of Ir<strong>an</strong> 15,185 18,128 33,313 19% 4.3 4.3 4.3 7 6<br />
Russi<strong>an</strong> Federation 18,542 16,977 35,519 -8% 5.2 4.0 4.5 5 7<br />
Somalia 17,005 15,482 32,487 -9% 4.8 3.6 4.2 6 8<br />
Eritrea 8,521 10,616 19,137 25% 2.4 2.5 2.5 11 9<br />
Nigeria 9,668 10,498 20,166 9% 2.7 2.5 2.6 9 10<br />
Mexico 5,497 8,906 14,403 62% 1.5 2.1 1.8 17 11<br />
Sri L<strong>an</strong>ka 9,073 8,521 17,594 -6% 2.6 2.0 2.3 10 12<br />
Syri<strong>an</strong> Arab Rep. 4,996 8,383 13,379 68% 1.4 2.0 1.7 20 13<br />
Tun<strong>is</strong>ia 910 7,907 8,817 769% 0.3 1.9 1.1 39 14<br />
B<strong>an</strong>gladesh 6,195 7,644 13,839 23% 1.7 1.8 1.8 15 15<br />
India 4,899 6,772 11,671 38% 1.4 1.6 1.5 21 16<br />
Georgia 7,381 6,700 14,081 -9% 2.1 1.6 1.8 12 17<br />
Turkey 6,509 6,688 13,197 3% 1.8 1.6 1.7 13 18<br />
dem. Rep. of the Congo 5,834 6,574 12,408 13% 1.6 1.5 1.6 16 19<br />
Armenia 5,288 6,220 11,508 18% 1.5 1.5 1.5 19 20<br />
Guinea 5,352 6,113 11,465 14% 1.5 1.4 1.5 18 21<br />
The former Yugoslav Rep. of Macedonia 6,289 5,607 11,896 -11% 1.8 1.3 1.5 14 22<br />
Côte d’Ivoire 1,852 5,192 7,044 180% 0.5 1.2 0.9 35 23<br />
Algeria 3,917 4,982 8,899 27% 1.1 1.2 1.1 23 24<br />
El Salvador 3,366 4,610 7,976 37% 0.9 1.1 1.0 25 25<br />
Hungary 2,424 4,488 6,912 85% 0.7 1.1 0.9 29 26<br />
Haiti 4,176 3,915 8,091 -6% 1.2 0.9 1.0 22 27<br />
Egypt 2,135 3,841 5,976 80% 0.6 0.9 0.8 32 28<br />
Libya 823 3,825 4,648 365% 0.2 0.9 0.6 40 29<br />
Guatemala 2,562 3,656 6,218 43% 0.7 0.9 0.8 28 30<br />
Stateless 3,731 3,344 7,075 -10% 1.0 0.8 0.9 24 31<br />
Alb<strong>an</strong>ia 2,227 3,330 5,557 50% 0.6 0.8 0.7 31 32<br />
Sud<strong>an</strong> 2,694 3,236 5,930 20% 0.8 0.8 0.8 27 33<br />
Ethiopia 3,092 3,180 6,272 3% 0.9 0.7 0.8 26 34<br />
Nepal 2,118 2,913 5,031 38% 0.6 0.7 0.6 33 35<br />
Gh<strong>an</strong>a 1,757 2,817 4,574 60% 0.5 0.7 0.6 36 36<br />
Bosnia <strong>an</strong>d Herzegovina 2,326 2,732 5,058 17% 0.7 0.6 0.6 30 37<br />
Morocco 1,369 2,696 4,065 97% 0.4 0.6 0.5 37 38<br />
Mali 1,255 2,363 3,618 88% 0.4 0.6 0.5 38 39<br />
Azerbaij<strong>an</strong> 1,996 2,363 4,359 18% 0.6 0.6 0.6 34 39<br />
Other * 65,189 82,134 147,323 26% 18.3 19.3 18.8<br />
Total 355,505 426,384 781,889 20% 100.0 100.0 100.0<br />
Annual<br />
Share<br />
R<strong>an</strong>k<br />
Origin 2010 2011 Total ch<strong>an</strong>ge 2010 2011 Total 2010 2011<br />
Afgh<strong>an</strong><strong>is</strong>t<strong>an</strong> 22,922 33,317 56,239 45% 8.4 10.2 9.4 2 1<br />
Iraq 19,142 22,315 41,457 17% 7.0 6.8 6.9 3 2<br />
Serbia (<strong>an</strong>d Kosovo: S/RES/1244(1999)) 29,266 20,910 50,176 -29% 10.7 6.4 8.4 1 3<br />
Russi<strong>an</strong> Federation 17,257 15,667 32,924 -9% 6.3 4.8 5.5 4 4<br />
Pak<strong>is</strong>t<strong>an</strong> 9,227 15,212 24,439 65% 3.4 4.7 4.1 7 5<br />
Islamic Rep. of Ir<strong>an</strong> 12,923 14,985 27,908 16% 4.7 4.6 4.7 6 6<br />
Somalia 16,070 14,778 30,848 -8% 5.9 4.5 5.1 5 7<br />
Eritrea 7,865 9,739 17,604 24% 2.9 3.0 2.9 9 8<br />
Nigeria 8,517 9,406 17,923 10% 3.1 2.9 3.0 8 9<br />
Syri<strong>an</strong> Arab Rep. 4,782 7,845 12,627 64% 1.7 2.4 2.1 19 10<br />
Tun<strong>is</strong>ia 865 7,786 8,651 800% 0.3 2.4 1.4 39 11<br />
Sri L<strong>an</strong>ka 6,669 6,917 13,586 4% 2.4 2.1 2.3 11 12<br />
B<strong>an</strong>gladesh 5,716 6,905 12,621 21% 2.1 2.1 2.1 15 13<br />
Georgia 7,263 6,592 13,855 -9% 2.7 2.0 2.3 10 14<br />
dem. Rep. of the Congo 5,406 6,065 11,471 12% 2.0 1.9 1.9 16 15<br />
Armenia 5,059 6,037 11,096 19% 1.8 1.9 1.8 17 16<br />
Turkey 5,888 5,941 11,829 1% 2.1 1.8 2.0 14 17<br />
China 5,928 5,907 11,835 0% 2.2 1.8 2.0 13 18<br />
Guinea 4,876 5,712 10,588 17% 1.8 1.8 1.8 18 19<br />
The former Yugoslav Rep. of Macedonia 6,251 5,562 11,813 -11% 2.3 1.7 2.0 12 20<br />
Algeria 3,777 4,784 8,561 27% 1.4 1.5 1.4 20 21<br />
Côte d’Ivoire 1,545 4,571 6,116 196% 0.6 1.4 1.0 32 22<br />
Libya 761 3,277 4,038 331% 0.3 1.0 0.7 40 23<br />
Sud<strong>an</strong> 2,474 2,941 5,415 19% 0.9 0.9 0.9 23 24<br />
Alb<strong>an</strong>ia 1,861 2,915 4,776 57% 0.7 0.9 0.8 28 25<br />
India 3,085 2,732 5,817 -11% 1.1 0.8 1.0 21 26<br />
Stateless 2,606 2,707 5,313 4% 1.0 0.8 0.9 22 27<br />
Morocco 1,296 2,604 3,900 101% 0.5 0.8 0.6 34 28<br />
Gh<strong>an</strong>a 1,585 2,587 4,172 63% 0.6 0.8 0.7 31 29<br />
Bosnia <strong>an</strong>d Herzegovina 2,182 2,515 4,697 15% 0.8 0.8 0.8 24 30<br />
Azerbaij<strong>an</strong> 1,928 2,274 4,202 18% 0.7 0.7 0.7 27 31<br />
Egypt 1,147 2,118 3,265 85% 0.4 0.6 0.5 36 32<br />
Haiti 2,041 2,048 4,089 0% 0.7 0.6 0.7 26 33<br />
Mali 957 2,037 2,994 113% 0.3 0.6 0.5 37 34<br />
Ethiopia 1,656 1,811 3,467 9% 0.6 0.6 0.6 30 35<br />
Senegal 1,260 1,671 2,931 33% 0.5 0.5 0.5 35 36<br />
Cameroon 1,463 1,609 3,072 10% 0.5 0.5 0.5 33 37<br />
Viet Nam 2,163 1,560 3,723 -28% 0.8 0.5 0.6 25 38<br />
Mongolia 1,670 1,559 3,229 -7% 0.6 0.5 0.5 29 39<br />
Belarus 941 1,441 2,382 53% 0.3 0.4 0.4 38 40<br />
Other * 35,609 49,807 85,416 40% 13.0 15.2 14.2<br />
Total 273,899 327,166 601,065 19% 100.0 100.0 100.0<br />
* The country of origin of 16,000 <strong>asylum</strong>-<strong>seeker</strong>s in Italy in 2011 <strong>is</strong> unknown. * The country of origin of 16,000 <strong>asylum</strong>-<strong>seeker</strong>s in Italy in 2011 <strong>is</strong> unknown.<br />
22 Asylum Levels <strong>an</strong>d Trends in Industrialized Countries - 2011 Asylum Levels <strong>an</strong>d Trends in Industrialized Countries - 2011<br />
23
TABLE 5 Origin of <strong>asylum</strong> applications lodged in the Europe<strong>an</strong> Union (27) | 2010 <strong>an</strong>d 2011<br />
TABLE 6<br />
Covering 27 Europe<strong>an</strong> Union countries which provided monthly data to UNHCR.<br />
R<strong>an</strong>king based on 2011 data.<br />
Applications submitted by country of <strong>asylum</strong> <strong>an</strong>d origin | 2010<br />
Covering all 44 <strong>asylum</strong> countries which provided monthly data to UNHCR. See notes in Annex Table 1.<br />
Top-20 r<strong>an</strong>king of countries based on applications lodged in all countries. An aster<strong>is</strong>k (*) denotes between 1 <strong>an</strong>d 4 applications.<br />
Annual<br />
Share<br />
R<strong>an</strong>k<br />
Origin 2010 2011 Total ch<strong>an</strong>ge 2010 2011 Total 2010 2011<br />
Afgh<strong>an</strong><strong>is</strong>t<strong>an</strong> 19,442 26,159 45,601 35% 8.1 9.5 8.8 2 1<br />
Serbia (<strong>an</strong>d Kosovo: S/RES/1244 (1999)) 27,429 19,072 46,501 -30% 11.4 6.9 9.0 1 2<br />
Russi<strong>an</strong> Federation 16,266 15,045 31,311 -8% 6.8 5.4 6.1 3 3<br />
Pak<strong>is</strong>t<strong>an</strong> 8,936 14,386 23,322 61% 3.7 5.2 4.5 7 4<br />
Iraq 14,448 13,623 28,071 -6% 6.0 4.9 5.4 4 5<br />
Islamic Rep. of Ir<strong>an</strong> 9,291 10,789 20,080 16% 3.9 3.9 3.9 6 6<br />
Somalia 13,844 10,656 24,500 -23% 5.8 3.9 4.7 5 7<br />
Nigeria 6,536 7,824 14,360 20% 2.7 2.8 2.8 9 8<br />
B<strong>an</strong>gladesh 5,659 6,787 12,446 20% 2.4 2.5 2.4 12 9<br />
Syri<strong>an</strong> Arab Rep. 4,228 6,725 10,953 59% 1.8 2.4 2.1 19 10<br />
Sri L<strong>an</strong>ka 5,699 6,431 12,130 13% 2.4 2.3 2.4 11 11<br />
Georgia 6,641 6,252 12,893 -6% 2.8 2.3 2.5 8 12<br />
Armenia 4,965 5,929 10,894 19% 2.1 2.1 2.1 16 13<br />
dem. Rep. of the Congo 5,080 5,800 10,880 14% 2.1 2.1 2.1 15 14<br />
Turkey 5,345 5,376 10,721 1% 2.2 1.9 2.1 14 15<br />
Guinea 4,555 5,340 9,895 17% 1.9 1.9 1.9 17 16<br />
Tun<strong>is</strong>ia 519 5,248 5,767 911% 0.2 1.9 1.1 40 17<br />
Eritrea 4,406 5,208 9,614 18% 1.8 1.9 1.9 18 18<br />
China 5,392 5,084 10,476 -6% 2.3 1.8 2.0 13 19<br />
The former Yugoslav Rep. of Macedonia 5,711 4,699 10,410 -18% 2.4 1.7 2.0 10 20<br />
Côte d’Ivoire 1,419 4,262 5,681 200% 0.6 1.5 1.1 30 21<br />
Algeria 3,296 4,062 7,358 23% 1.4 1.5 1.4 20 22<br />
Alb<strong>an</strong>ia 1,820 2,822 4,642 55% 0.8 1.0 0.9 28 23<br />
Libya 690 2,710 3,400 293% 0.3 1.0 0.7 39 24<br />
India 3,012 2,612 5,624 -13% 1.3 0.9 1.1 21 25<br />
Sud<strong>an</strong> 2,177 2,558 4,735 18% 0.9 0.9 0.9 22 26<br />
Stateless 2,129 2,418 4,547 14% 0.9 0.9 0.9 24 27<br />
Gh<strong>an</strong>a 1,408 2,381 3,789 69% 0.6 0.9 0.7 31 28<br />
Bosnia <strong>an</strong>d Herzegovina 1,998 2,275 4,273 14% 0.8 0.8 0.8 26 29<br />
Azerbaij<strong>an</strong> 1,850 2,190 4,040 18% 0.8 0.8 0.8 27 30<br />
Haiti 2,032 2,043 4,075 1% 0.8 0.7 0.8 25 31<br />
Egypt 1,079 1,994 3,073 85% 0.5 0.7 0.6 35 32<br />
Mali 905 1,980 2,885 119% 0.4 0.7 0.6 37 33<br />
Morocco 1,061 1,859 2,920 75% 0.4 0.7 0.6 36 34<br />
Viet Nam 2,135 1,527 3,662 -28% 0.9 0.6 0.7 23 35<br />
Senegal 1,141 1,501 2,642 32% 0.5 0.5 0.5 34 36<br />
Cameroon 1,359 1,468 2,827 8% 0.6 0.5 0.5 32 37<br />
Mongolia 1,559 1,456 3,015 -7% 0.7 0.5 0.6 29 38<br />
Comoros 756 1,390 2,146 84% 0.3 0.5 0.4 38 39<br />
Maurit<strong>an</strong>ia 1,196 1,378 2,574 15% 0.5 0.5 0.5 33 40<br />
Other * 32,194 46,024 78,218 43% 13.4 16.6 15.1<br />
Total 239,608 277,343 516,951 16% 100.0 100.0 100.0<br />
* The country of origin of 16,000 <strong>asylum</strong>-<strong>seeker</strong>s in Italy in 2011 <strong>is</strong> unknown.<br />
Origin Alb<strong>an</strong>ia Australia Austria Belgium<br />
Bosnia<br />
<strong>an</strong>d H. Bulgaria C<strong>an</strong>ada Croatia Cyprus Czech Rep. Denmark Estonia Finl<strong>an</strong>d Fr<strong>an</strong>ce Germ<strong>an</strong>y<br />
Serbia (<strong>an</strong>d Kosovo:<br />
S/RES/1244(1999))<br />
* 5 972 4,545 10 * 183 11 * 6 402 - 325 5,754 6,546<br />
Afgh<strong>an</strong><strong>is</strong>t<strong>an</strong> - 3,129 1,582 1,124 11 58 392 107 41 6 1,476 9 265 770 5,905<br />
China - 1,191 217 176 - * 1,582 - 123 6 14 - 20 1,933 367<br />
Iraq * 856 336 1,637 * 452 151 9 343 5 237 - 575 439 5,555<br />
Russi<strong>an</strong><br />
Federation<br />
- 5 2,322 1,141 - 11 459 5 17 36 340 7 436 4,302 1,199<br />
Somalia - 17 190 237 - * 365 11 * * 110 - 571 419 2,235<br />
Islamic Rep.<br />
of Ir<strong>an</strong><br />
* 1,354 387 261 * 61 331 21 118 8 597 - 142 396 2,475<br />
Pak<strong>is</strong>t<strong>an</strong> - 470 276 309 * 17 492 5 155 5 26 * 5 890 840<br />
Nigeria - 31 573 119 - 9 860 * 133 25 24 * 84 738 716<br />
Sri L<strong>an</strong>ka - 796 14 121 - 6 1,203 - 187 - 28 * 21 2,827 435<br />
Eritrea - 24 11 106 * * 76 - * - 26 - 14 721 642<br />
Georgia - * 370 336 - 14 58 * 41 5 15 - 61 1,354 664<br />
Turkey - 119 369 241 - 10 283 * 114 17 51 * 117 1,402 1,340<br />
The former<br />
Yugoslav Rep. of * * 194 980 - * 14 * - - 21 - 20 590 2,466<br />
Macedonia<br />
B<strong>an</strong>gladesh - 104 116 178 - 6 118 - 148 - 32 - 11 3,140 92<br />
dem. Rep. of<br />
the Congo<br />
- * 28 813 - 6 314 - * 7 17 - 47 3,395 152<br />
Mexico - - - 8 - - 1,198 - - - - - - 5 *<br />
Guinea - * 35 1,455 - * 84 - 17 - 8 - 10 2,012 229<br />
Armenia - * 278 1,266 - 62 17 - 7 9 31 * 11 1,766 296<br />
Syri<strong>an</strong> Arab Rep. - 22 194 302 * 52 126 * 96 6 821 - 41 192 1,490<br />
Origin Greece Hungary Icel<strong>an</strong>d Irel<strong>an</strong>d Italy Jap<strong>an</strong> Latvia<br />
Liechtenstein<br />
Lithu<strong>an</strong>ia<br />
Luxembourg<br />
Malta<br />
Montenegro<br />
Netherl<strong>an</strong>ds<br />
New<br />
Zeal<strong>an</strong>d Norway<br />
Serbia (<strong>an</strong>d Kosovo:<br />
S/RES/1244(1999))<br />
11 637 - 19 795 - - 6 * 301 - - 106 - 444<br />
Afgh<strong>an</strong><strong>is</strong>t<strong>an</strong> 524 796 7 69 873 * 23 - 26 12 - - 1,364 * 979<br />
China 549 10 - 228 18 17 - - - - * - 302 22 192<br />
Iraq 342 55 5 29 380 * - * * 79 7 - 1,383 10 460<br />
Russi<strong>an</strong> Federation 100 26 - 14 21 * 7 32 40 25 - * 207 * 628<br />
Somalia 141 53 5 38 84 - - * - 29 34 - 3,372 * 1,397<br />
Islamic Rep. of<br />
Ir<strong>an</strong><br />
125 72 6 36 269 35 * * * 31 * - 785 42 429<br />
Pak<strong>is</strong>t<strong>an</strong> 2,748 41 * 200 929 83 - - * - 16 - 60 7 99<br />
Nigeria 393 42 * 387 1,385 34 * 11 - 5 8 - 168 * 354<br />
Sri L<strong>an</strong>ka 36 6 - 9 87 173 - - - * - - 197 23 71<br />
Eritrea 59 - * 15 181 - - - - 12 6 - 392 * 1,711<br />
Georgia 1,162 76 * 53 80 - * - 235 7 - - 587 * 85<br />
Turkey 71 95 - * 854 127 - - - 19 * * 92 * 74<br />
The former<br />
Yugoslav Rep. of * 8 * * 98 - - 38 - 14 - - 389 - 93<br />
Macedonia<br />
B<strong>an</strong>gladesh 987 7 - 51 222 27 - - * * - - 14 6 17<br />
dem. Rep. of the<br />
Congo<br />
15 * - 70 57 12 * - - 8 * - 40 * 86<br />
Mexico - * - - * * - - - - - - * * 13<br />
Guinea 31 5 - * 167 * * - - * - - 230 - 59<br />
Armenia 71 11 - 9 53 * - - 21 * - - 611 - 17<br />
Syri<strong>an</strong> Arab Rep. 167 26 * * 48 - - * - 19 8 - 125 * 119<br />
…/…<br />
24 Asylum Levels <strong>an</strong>d Trends in Industrialized Countries - 2011 Asylum Levels <strong>an</strong>d Trends in Industrialized Countries - 2011<br />
25
TABLE 6<br />
Applications submitted by country of <strong>asylum</strong> <strong>an</strong>d origin | 2010 (ctnd)<br />
Covering all 44 <strong>asylum</strong> countries which provided monthly data to UNHCR. See notes in Annex Table 1.<br />
Top-20 r<strong>an</strong>king of countries based on applications lodged in all countries. An aster<strong>is</strong>k (*) denotes between 1 <strong>an</strong>d 4 applications.<br />
TABLE 7<br />
Applications submitted by country of <strong>asylum</strong> <strong>an</strong>d origin | 2011 (ctnd)<br />
Covering all 44 <strong>asylum</strong> countries which provided monthly data to UNHCR. See notes in Annex Table 1.<br />
Top-20 r<strong>an</strong>king of countries based on applications lodged in all countries. An aster<strong>is</strong>k (*) denotes between 1 <strong>an</strong>d 4 applications.<br />
Origin Pol<strong>an</strong>d Portugal<br />
Rep. of<br />
Korea Rom<strong>an</strong>ia Serbia (1) Slovakia Slovenia Spain Sweden Switzerl<strong>an</strong>d<br />
TfYR<br />
Macedonia (2) Turkey<br />
United<br />
Kingdom<br />
United<br />
States (3)<br />
Serbia (<strong>an</strong>d Kosovo:<br />
S/RES/1244(1999))<br />
- - - 11 * 10 28 7 7,907 1,358 * - 30 151<br />
Afgh<strong>an</strong><strong>is</strong>t<strong>an</strong> 25 * 15 120 425 76 23 41 2,397 632 71 1,248 1,835 156<br />
China 9 * 7 67 - 35 * 6 90 333 - 11 1,215 12,850<br />
Iraq 27 - * 75 53 7 7 21 1,978 501 * 3,656 475 409<br />
Russi<strong>an</strong> Federation 4,796 5 - 12 * 65 8 44 987 315 * 5 100 817<br />
Somalia 5 * * 13 42 23 8 39 5,560 302 18 448 675 550<br />
Islamic Rep. of Ir<strong>an</strong> 7 6 6 35 12 12 9 63 1,183 276 * 2,881 2,210 494<br />
Pak<strong>is</strong>t<strong>an</strong> 27 * 129 62 30 34 - 63 111 92 21 42 2,115 551<br />
Nigeria 19 7 19 22 * 6 11 237 321 1,597 - 12 1,100 206<br />
Sri L<strong>an</strong>ka 6 * * 16 - 6 - 32 34 892 - 7 1,625 205<br />
Eritrea * - - * - - * 8 1,444 1,708 5 33 760 555<br />
Georgia 1,083 * - 9 * 66 * 48 291 531 - - 75 58<br />
Turkey 19 * - 68 * 9 27 19 235 462 - - 170 88<br />
The former<br />
Yugoslav Rep. of * * - - - - * 12 908 403 - - 5 22<br />
Macedonia<br />
B<strong>an</strong>gladesh 18 - 41 11 * 7 - 12 107 25 - 14 495 183<br />
dem. Rep. of the<br />
Congo<br />
* 9 9 12 13 * * 88 86 161 - 66 215 87<br />
Mexico - - - - - - - 17 8 * - - 10 4,225<br />
Guinea 6 43 * * * * - 166 28 239 - 21 105 384<br />
Armenia 107 - - - - 12 - 37 278 77 - - 25 210<br />
Syri<strong>an</strong> Arab Rep. 8 - - 19 * 5 * 19 427 387 * 37 160 63<br />
1 Serbia (<strong>an</strong>d Kosovo: S/RES/1244 (1999))<br />
2 The former Yugoslav Republic of Macedonia<br />
3 Combination of number of persons (EOIR) <strong>an</strong>d cases (DHS).<br />
TABLE 7<br />
Applications submitted by country of <strong>asylum</strong> <strong>an</strong>d origin | 2011<br />
Covering all 44 <strong>asylum</strong> countries which provided monthly data to UNHCR. See notes in Annex Table 1.<br />
Top-20 r<strong>an</strong>king of countries based on applications lodged in all countries. An aster<strong>is</strong>k (*) denotes between 1 <strong>an</strong>d 4 applications.<br />
Origin Alb<strong>an</strong>ia Australia Austria Belgium<br />
Bosnia<br />
<strong>an</strong>d H. Bulgaria C<strong>an</strong>ada Croatia Cyprus Czech Rep. Denmark Estonia Finl<strong>an</strong>d Fr<strong>an</strong>ce Germ<strong>an</strong>y<br />
Afgh<strong>an</strong><strong>is</strong>t<strong>an</strong> - 1,721 3,623 2,773 * 92 397 487 16 25 903 8 292 651 7,767<br />
China * 1,188 238 292 - 6 1,853 - 30 * 26 - 26 2,184 339<br />
Iraq * 491 484 2,004 - 344 164 7 52 8 115 * 588 252 5,831<br />
Serbia (<strong>an</strong>d Kosovo:<br />
S/RES/1244 (1999))<br />
8 * 541 3,067 8 * 142 5 - * 325 - 160 3,458 5,974<br />
Pak<strong>is</strong>t<strong>an</strong> * 817 952 924 * 27 828 70 148 6 57 - 23 1,432 2,539<br />
Islamic Rep. of<br />
Ir<strong>an</strong><br />
- 2,156 457 367 * 37 319 40 68 7 461 - 125 193 3,352<br />
Russi<strong>an</strong><br />
Federation<br />
- 7 2,319 1,747 - * 433 15 12 25 304 * 294 4,042 1,689<br />
Somalia * 15 611 454 * 42 409 42 - - 107 * 365 755 984<br />
Eritrea - 11 27 83 - - 100 9 * 10 20 - 7 924 632<br />
Nigeria - 58 411 165 * 18 685 * 22 16 52 - 105 799 759<br />
Mexico - * * * - - 653 - - * - - * - -<br />
Sri L<strong>an</strong>ka - 370 13 129 - * 629 - 114 - 22 - 25 3,183 521<br />
Syri<strong>an</strong> Arab Rep. - 94 423 494 - 85 176 9 187 7 428 - 109 119 2,634<br />
Tun<strong>is</strong>ia - - 182 100 * 9 76 14 * * 56 - 25 198 473<br />
B<strong>an</strong>gladesh * 127 87 493 - 6 115 * 182 - 32 * 20 3,568 143<br />
India - 765 463 157 - * 751 * 134 * 32 * 10 42 822<br />
Georgia - 10 261 347 - 7 26 * 17 6 19 6 70 1,646 471<br />
Turkey - 91 414 430 - * 331 9 33 17 25 * 74 1,737 1,578<br />
dem. Rep. of<br />
the Congo<br />
- 7 49 1,084 - - 370 - * 6 15 11 39 3,804 190<br />
Armenia - * 218 556 - 37 22 - 11 7 36 7 11 3,638 335<br />
Origin Greece Hungary Icel<strong>an</strong>d Irel<strong>an</strong>d Italy (1) Jap<strong>an</strong> (2) Latvia<br />
Liechtenstein<br />
Lithu<strong>an</strong>ia Luxembourg Malta Montenegro Netherl<strong>an</strong>ds<br />
Afgh<strong>an</strong><strong>is</strong>t<strong>an</strong> 637 649 * 67 880 * * * 45 21 - 8 1,885 11 979<br />
China 406 8 - 142 28 20 - * * * * - 276 20 101<br />
Iraq 257 54 5 18 219 * * - - 43 * * 1,435 11 357<br />
Serbia (<strong>an</strong>d Kosovo:<br />
S/RES/1244 (1999))<br />
5 238 * 10 146 - - 31 - 1,097 - - 120 - 240<br />
Pak<strong>is</strong>t<strong>an</strong> 2,309 121 * 175 1,150 170 * - - * 45 * 94 22 92<br />
Islamic Rep. of<br />
Ir<strong>an</strong><br />
247 33 * 13 160 48 16 * - 35 * 7 929 29 355<br />
Russi<strong>an</strong><br />
Federation<br />
69 12 7 17 9 - 18 14 58 49 - - 451 * 365<br />
Somalia 68 61 * 21 513 - - * - 13 454 * 1,415 * 2,216<br />
Eritrea 37 * * 8 183 - - - - 12 306 - 458 - 1,256<br />
Nigeria 362 22 6 182 2,876 51 - * * 11 246 * 129 * 240<br />
Mexico * - - * * * - - - * - - * - 8<br />
Sri L<strong>an</strong>ka 45 * - * 58 226 * - - * - - 124 19 40<br />
Syri<strong>an</strong> Arab Rep. 352 91 * 9 195 * 16 - * 11 122 * 168 * 198<br />
Tun<strong>is</strong>ia 23 30 - - 3,531 5 - - - 42 6 31 22 * 76<br />
B<strong>an</strong>gladesh 615 * * 22 734 98 * - - * 33 - 23 8 75<br />
India 179 11 * 9 20 51 - - - - - - 22 * 56<br />
Georgia 1,121 21 * 15 26 - 176 * 202 16 - * 189 - 49<br />
Turkey 34 25 - - 492 235 5 - * 22 - * 96 * 42<br />
dem. Rep. of<br />
the Congo<br />
11 15 * 70 51 * 39 - * 10 - - 18 * 47<br />
Armenia 52 12 - 8 18 - * * 28 * - - 471 - 15<br />
Origin Pol<strong>an</strong>d Portugal<br />
Rep. of<br />
Korea Rom<strong>an</strong>ia Serbia (3) Slovakia Slovenia Spain Sweden Switzerl<strong>an</strong>d<br />
TfYR<br />
Macedonia (4)<br />
Turkey<br />
New<br />
Zeal<strong>an</strong>d<br />
United<br />
Kingdom<br />
Norway<br />
United<br />
States (5)<br />
Afgh<strong>an</strong><strong>is</strong>t<strong>an</strong> 29 * 60 107 1,757 73 57 30 4,120 1,006 427 2,486 1,525 219<br />
China 7 - 8 47 - 12 - * 101 688 - 32 920 15,450<br />
Iraq 20 5 * 59 16 6 7 19 1,634 378 13 7,912 365 480<br />
Serbia (<strong>an</strong>d Kosovo:<br />
S/RES/1244 (1999))<br />
- 0 - 6 - 10 35 - 3,915 1,539 5 - 25 193<br />
Pak<strong>is</strong>t<strong>an</strong> 9 11 434 144 356 11 26 78 183 97 172 29 3,945 658<br />
Islamic Rep. of<br />
Ir<strong>an</strong><br />
8 11 * 31 37 13 8 62 1,118 326 10 3,411 3,045 590<br />
Russi<strong>an</strong><br />
Federation<br />
2,784 8 * 8 * 35 * 65 930 217 * - 95 865<br />
Somalia 9 26 - 24 501 76 17 59 3,979 558 53 744 660 279<br />
Eritrea 12 - - - 11 - - 12 1,649 3,224 * 27 835 766<br />
Nigeria 12 22 39 7 * * 5 259 340 1,303 - 23 1,055 257<br />
Mexico - - - * - - - 17 8 5 - - 10 8,186<br />
Sri L<strong>an</strong>ka * * 100 - 6 * - 36 24 433 * 5 2,125 260<br />
Syri<strong>an</strong> Arab Rep. 10 - * 36 33 7 10 97 646 688 * 188 500 262<br />
Tun<strong>is</strong>ia * - * 218 77 * 24 5 266 2,324 * 13 40 35<br />
B<strong>an</strong>gladesh 5 * 38 19 12 6 - 12 116 23 - 5 665 353<br />
India * - 15 18 27 19 * 15 45 13 11 7 610 2,457<br />
Georgia 1,240 5 - 22 - 57 * 12 280 281 * - 40 72<br />
Turkey 11 * - 28 * 10 39 12 139 508 - - 180 86<br />
dem. Rep. of<br />
the Congo<br />
5 14 6 - * * * 70 109 139 - 76 200 121<br />
Armenia 162 - - 19 - 9 - 29 262 92 - - 15 159<br />
1 Th<strong>is</strong> table excludes some 16,000 <strong>asylum</strong> applications lodged in Italy due to lack of breakdown by country of origin.<br />
2 UNHCR estimates.<br />
3 Serbia (<strong>an</strong>d Kosovo: S/RES/1244 (1999)).<br />
4 The former Yugoslav Republic of Macedonia.<br />
5 Combination of number of persons (EOIR) <strong>an</strong>d cases (DHS).<br />
…/…<br />
26 Asylum Levels <strong>an</strong>d Trends in Industrialized Countries - 2011 Asylum Levels <strong>an</strong>d Trends in Industrialized Countries - 2011<br />
27
TABLE 8 Quarterly <strong>asylum</strong> applications lodged in 44 industrialized countries | 2010-2011<br />
TABLE 9<br />
Covering 44 countries which provided monthly data to UNHCR.<br />
Origin of <strong>asylum</strong> applic<strong>an</strong>ts in 44 industrialized countries by quarter | 2010<br />
Covering 44 countries which provided monthly data to UNHCR.<br />
Asylum<br />
2010 2011 Quarterly ch<strong>an</strong>ge 2011<br />
country<br />
Q1 Q2 Q3 Q4 Q1 Q2 Q3 Q4 Q2-Q1 Q3-Q2 Q4-Q3<br />
Alb<strong>an</strong>ia 3 2 5 2 12 1 3 1 -92% 200% -67%<br />
Australia 2,375 3,762 3,274 3,262 2,623 2,332 2,769 3,789 -11% 19% 37%<br />
Austria 2,464 2,565 3,109 2,874 2,757 3,055 4,547 4,067 11% 49% -11%<br />
Belgium 5,655 3,807 5,491 6,803 6,260 5,719 6,816 7,189 -9% 19% 5%<br />
Bosnia <strong>an</strong>d Herzegovina 5 11 10 12 10 7 18 9 -30% 157% -50%<br />
Bulgaria 283 213 264 265 274 192 224 200 -30% 17% -11%<br />
C<strong>an</strong>ada 6,086 5,048 6,029 5,994 5,949 5,567 6,368 7,463 -6% 14% 17%<br />
Croatia 8 41 132 109 127 199 170 311 57% -15% 83%<br />
Cyprus 611 622 574 1,052 458 436 446 425 -5% 2% -5%<br />
Czech Rep. 129 108 119 129 110 104 145 133 -5% 39% -8%<br />
denmark 1,194 1,058 1,340 1,373 959 825 873 1,154 -14% 6% 32%<br />
Estonia 6 14 8 5 15 19 25 8 27% 32% -68%<br />
Finl<strong>an</strong>d 1,191 1,047 965 815 712 662 844 867 -7% 27% 3%<br />
Fr<strong>an</strong>ce 12,261 11,368 11,154 13,008 13,386 13,499 12,065 12,963 1% -11% 7%<br />
Germ<strong>an</strong>y 7,885 7,768 12,250 13,429 10,896 9,787 11,811 13,247 -10% 21% 12%<br />
Greece 2,194 2,507 3,186 2,386 2,529 1,953 2,428 2,401 -23% 24% -1%<br />
Hungary 760 649 706 349 341 427 356 569 25% -17% 60%<br />
Icel<strong>an</strong>d 7 10 19 15 9 23 21 20 156% -9% -5%<br />
Irel<strong>an</strong>d 532 494 491 422 385 301 319 285 -22% 6% -11%<br />
Italy * 2,721 2,647 2,139 2,545 3,987 6,873 4,184 3,065 72% -39% -27%<br />
Jap<strong>an</strong> ** 232 239 356 384 404 466 482 515 15% 3% 7%<br />
Latvia 8 20 17 16 25 80 163 67 220% 104% -59%<br />
Liechtenstein 59 17 12 25 27 18 22 7 -33% 22% -68%<br />
Lithu<strong>an</strong>ia 49 58 85 180 66 43 136 161 -35% 216% 18%<br />
Luxembourg 118 138 186 304 500 395 691 576 -21% 75% -17%<br />
Malta 30 19 62 28 45 1,587 57 164 3427% -96% 188%<br />
Montenegro 2 1 - 6 23 73 66 73 217% -10% 11%<br />
Netherl<strong>an</strong>ds 3,803 2,598 3,137 3,795 2,862 2,848 3,083 2,797 -0% 8% -9%<br />
New Zeal<strong>an</strong>d 78 96 74 77 75 90 76 64 20% -16% -16%<br />
Norway 2,516 2,014 2,909 2,625 2,143 2,359 2,436 2,115 10% 3% -13%<br />
Pol<strong>an</strong>d *** 1,403 1,521 1,826 1,790 716 1,036 1,487 1,951 45% 44% 31%<br />
Portugal 36 41 49 34 43 53 92 87 23% 74% -5%<br />
Rep. of Korea 55 63 146 159 158 228 233 392 44% 2% 68%<br />
Rom<strong>an</strong>ia 230 225 215 189 258 295 579 588 14% 96% 2%<br />
Serbia (<strong>an</strong>d Kosovo: S/RES/1244 (1999)) 118 150 204 321 552 973 1,149 646 76% 18% -44%<br />
- of which Kosovo 37 42 92 100 110 42 13 23 -62% -69% 77%<br />
Slovakia 123 175 153 90 105 98 121 123 -7% 23% 2%<br />
Slovenia 30 35 45 101 92 82 65 68 -11% -21% 5%<br />
Spain 632 578 790 738 937 1,010 825 642 8% -18% -22%<br />
Sweden 8,117 5,933 8,517 9,252 6,214 6,381 7,425 9,628 3% 16% 30%<br />
Switzerl<strong>an</strong>d 3,283 3,101 3,359 3,778 3,722 4,758 4,727 6,232 28% -1% 32%<br />
The former Yugoslav Rep.<br />
of Macedonia<br />
51 15 26 82 148 217 213 162 47% -2% -24%<br />
Turkey 1,701 1,634 2,593 3,298 2,653 2,528 4,013 6,827 -5% 59% 70%<br />
United Kingdom 5,405 5,460 5,465 5,755 6,075 6,100 6,450 6,790 0% 6% 5%<br />
United States 12,427 14,670 14,336 14,099 17,301 19,364 18,912 18,443 12% -2% -2%<br />
Origin<br />
No. of applications Ch<strong>an</strong>ge (%) Share (%)<br />
Q1 Q2 Q3 Q4 Total Q2-Q1 Q3-Q2 Q4-Q3 Q1 Q2 Q3 Q4<br />
Serbia<br />
(<strong>an</strong>d Kosovo: S/RES/1244 (1999))<br />
6,202 4,785 7,642 10,976 29,605 -23% 60% 44% 7.4 6.0 8.2 11.1<br />
Afgh<strong>an</strong><strong>is</strong>t<strong>an</strong> 6,533 6,315 7,109 6,662 26,619 -3% 13% -6% 7.7 7.9 7.7 6.7<br />
China 4,819 5,377 5,637 5,764 21,597 12% 5% 2% 5.7 6.8 6.1 5.8<br />
Iraq 4,883 4,212 5,467 6,010 20,572 -14% 30% 10% 5.8 5.3 5.9 6.1<br />
Russi<strong>an</strong> Federation 4,507 4,288 4,943 4,804 18,542 -5% 15% -3% 5.3 5.4 5.3 4.9<br />
Somalia 4,168 3,828 5,129 3,880 17,005 -8% 34% -24% 4.9 4.8 5.5 3.9<br />
Islamic Rep. of Ir<strong>an</strong> 3,099 2,982 4,283 4,821 15,185 -4% 44% 13% 3.7 3.8 4.6 4.9<br />
Pak<strong>is</strong>t<strong>an</strong> 2,103 2,429 3,102 3,325 10,959 16% 28% 7% 2.5 3.1 3.3 3.4<br />
Nigeria 2,511 2,332 2,292 2,533 9,668 -7% -2% 11% 3.0 2.9 2.5 2.6<br />
Sri L<strong>an</strong>ka 2,134 2,059 2,468 2,412 9,073 -4% 20% -2% 2.5 2.6 2.7 2.4<br />
Eritrea 1,773 1,834 2,534 2,380 8,521 3% 38% -6% 2.1 2.3 2.7 2.4<br />
Georgia 2,061 1,858 1,814 1,648 7,381 -10% -2% -9% 2.4 2.3 2.0 1.7<br />
Turkey 1,504 1,476 1,714 1,815 6,509 -2% 16% 6% 1.8 1.9 1.8 1.8<br />
The former Yugoslav Rep.<br />
of Macedonia<br />
1,262 536 1,781 2,710 6,289 -58% 232% 52% 1.5 0.7 1.9 2.7<br />
B<strong>an</strong>gladesh 1,233 1,576 1,569 1,817 6,195 28% -0% 16% 1.5 2.0 1.7 1.8<br />
dem. Rep. of the Congo 1,389 1,411 1,536 1,498 5,834 2% 9% -2% 1.6 1.8 1.7 1.5<br />
Mexico 1,228 1,414 1,397 1,458 5,497 15% -1% 4% 1.5 1.8 1.5 1.5<br />
Guinea 1,484 1,174 1,257 1,437 5,352 -21% 7% 14% 1.8 1.5 1.4 1.5<br />
Armenia 1,401 947 1,335 1,605 5,288 -32% 41% 20% 1.7 1.2 1.4 1.6<br />
Syri<strong>an</strong> Arab Rep. 1,257 1,066 1,310 1,363 4,996 -15% 23% 4% 1.5 1.3 1.4 1.4<br />
India 1,054 1,123 1,319 1,403 4,899 7% 17% 6% 1.2 1.4 1.4 1.4<br />
Haiti 1,206 1,202 884 884 4,176 -0% -26% 0% 1.4 1.5 1.0 0.9<br />
Algeria 987 875 936 1,119 3,917 -11% 7% 20% 1.2 1.1 1.0 1.1<br />
Stateless 732 831 1,006 1,162 3,731 14% 21% 16% 0.9 1.0 1.1 1.2<br />
El Salvador 793 876 854 843 3,366 10% -3% -1% 0.9 1.1 0.9 0.9<br />
Ethiopia 759 736 825 772 3,092 -3% 12% -6% 0.9 0.9 0.9 0.8<br />
Sud<strong>an</strong> 638 606 734 716 2,694 -5% 21% -2% 0.8 0.8 0.8 0.7<br />
Zimbabwe 827 790 528 464 2,609 -4% -33% -12% 1.0 1.0 0.6 0.5<br />
Guatemala 591 620 691 660 2,562 5% 11% -4% 0.7 0.8 0.7 0.7<br />
Colombia 706 617 583 575 2,481 -13% -6% -1% 0.8 0.8 0.6 0.6<br />
Hungary 844 497 378 705 2,424 -41% -24% 87% 1.0 0.6 0.4 0.7<br />
Viet Nam 560 626 620 572 2,378 12% -1% -8% 0.7 0.8 0.7 0.6<br />
Bosnia <strong>an</strong>d Herzegovina 678 552 404 692 2,326 -19% -27% 71% 0.8 0.7 0.4 0.7<br />
Alb<strong>an</strong>ia 583 602 540 502 2,227 3% -10% -7% 0.7 0.8 0.6 0.5<br />
Egypt 487 514 523 611 2,135 6% 2% 17% 0.6 0.6 0.6 0.6<br />
Nepal 433 488 575 622 2,118 13% 18% 8% 0.5 0.6 0.6 0.6<br />
Cameroon 522 475 563 492 2,052 -9% 19% -13% 0.6 0.6 0.6 0.5<br />
Azerbaij<strong>an</strong> 630 401 443 522 1,996 -36% 10% 18% 0.7 0.5 0.5 0.5<br />
Mongolia 491 478 448 517 1,934 -3% -6% 15% 0.6 0.6 0.5 0.5<br />
Côte d’Ivoire 454 477 483 438 1,852 5% 1% -9% 0.5 0.6 0.5 0.4<br />
Other 14,798 14,171 15,093 15,787 59,849 -4% 7% 5% 17.5 17.8 16.3 16.0<br />
Total 84,324 79,456 92,749 98,976 355,505 -6% 17% 7% 100.0 100.0 100.0 100.0<br />
EU-“Old” (15) 54,208 48,009 58,269 63,533 58,502 59,461 62,453 65,758 2% 5% 5%<br />
EU-“New” (12) 3,662 3,659 4,074 4,194 2,505 4,399 3,804 4,457 76% -14% 17%<br />
EU-Total (27) 57,870 51,668 62,343 67,727 61,007 63,860 66,257 70,215 5% 4% 6%<br />
Nordic countries (5) 13,025 10,062 13,750 14,080 10,037 10,250 11,599 13,784 2% 13% 19%<br />
Western Europe (19) 60,073 53,151 64,568 69,976 64,403 66,619 69,659 74,132 4% 5% 7%<br />
Southern Europe (8) 6,227 6,416 6,805 6,785 8,011 11,913 8,035 6,785 49% -33% -16%<br />
Total Europe (38) 65,623 58,664 71,612 78,000 70,433 75,016 79,095 86,618 7% 5% 10%<br />
C<strong>an</strong>ada/USA 18,513 19,718 20,365 20,093 23,250 24,931 25,280 25,906 7% 1% 2%<br />
Australia/New Zeal<strong>an</strong>d 2,453 3,858 3,348 3,339 2,698 2,422 2,845 3,853 -10% 17% 35%<br />
Jap<strong>an</strong>/Rep. of Korea 287 302 502 543 562 694 715 907 23% 3% 27%<br />
Total non-Europe (6) 21,253 23,878 24,215 23,975 26,510 28,047 28,840 30,666 6% 3% 6%<br />
Total (44) 86,876 82,542 95,827 101,975 96,943 103,063 107,935 117,284 6% 5% 9%<br />
* Italy: Th<strong>is</strong> table excludes some 16,000 <strong>asylum</strong> applications lodged in Italy in 2011 due to lack of detailed data.<br />
** Jap<strong>an</strong>: UNHCR estimate.<br />
*** Pol<strong>an</strong>d: December 2011 data estimated by UNHCR.<br />
28 Asylum Levels <strong>an</strong>d Trends in Industrialized Countries - 2011 Asylum Levels <strong>an</strong>d Trends in Industrialized Countries - 2011<br />
29
TABLE 10 Origin of <strong>asylum</strong> applic<strong>an</strong>ts in 44 industrialized countries by quarter | 2011<br />
TABLE 11<br />
Covering 44 countries which provided monthly data to UNHCR.<br />
Origin of <strong>asylum</strong> applic<strong>an</strong>ts in Europe by quarter | 2010<br />
Covering 38 Europe<strong>an</strong> countries which provided monthly data to UNHCR.<br />
Origin<br />
No. of applications Ch<strong>an</strong>ge (%) Share (%)<br />
Q1 Q2 Q3 Q4 Total Q2-Q1 Q3-Q2 Q4-Q3 Q1 Q2 Q3 Q4<br />
Afgh<strong>an</strong><strong>is</strong>t<strong>an</strong> 6,995 8,415 10,514 9,805 35,729 20% 25% -7% 7.5 8.5 10.1 8.7<br />
China 5,685 6,031 6,491 6,239 24,446 6% 8% -4% 6.1 6.1 6.3 5.5<br />
Iraq 5,421 4,639 5,865 7,544 23,469 -14% 26% 29% 5.8 4.7 5.6 6.7<br />
Serbia (<strong>an</strong>d Kosovo: S/RES/1244 (1999)) 6,383 4,015 3,347 7,501 21,246 -37% -17% 124% 6.8 4.1 3.2 6.6<br />
Pak<strong>is</strong>t<strong>an</strong> 3,459 3,915 5,238 5,529 18,141 13% 34% 6% 3.7 4.0 5.0 4.9<br />
Islamic Rep. of Ir<strong>an</strong> 4,015 3,571 4,630 5,912 18,128 -11% 30% 28% 4.3 3.6 4.5 5.2<br />
Russi<strong>an</strong> Federation 3,822 3,688 4,820 4,647 16,977 -4% 31% -4% 4.1 3.7 4.6 4.1<br />
Somalia 2,917 3,940 4,155 4,470 15,482 35% 5% 8% 3.1 4.0 4.0 3.9<br />
Eritrea 2,369 3,360 2,563 2,324 10,616 42% -24% -9% 2.5 3.4 2.5 2.1<br />
Nigeria 2,128 3,299 2,546 2,525 10,498 55% -23% -1% 2.3 3.3 2.5 2.2<br />
Mexico 1,935 2,237 2,297 2,437 8,906 16% 3% 6% 2.1 2.3 2.2 2.2<br />
Sri L<strong>an</strong>ka 2,302 2,042 1,957 2,220 8,521 -11% -4% 13% 2.5 2.1 1.9 2.0<br />
Syri<strong>an</strong> Arab Rep. 1,403 1,629 2,600 2,751 8,383 16% 60% 6% 1.5 1.6 2.5 2.4<br />
Tun<strong>is</strong>ia 2,768 1,869 1,736 1,534 7,907 -32% -7% -12% 3.0 1.9 1.7 1.4<br />
B<strong>an</strong>gladesh 1,689 2,303 1,823 1,829 7,644 36% -21% 0% 1.8 2.3 1.8 1.6<br />
India 1,613 1,666 1,840 1,653 6,772 3% 10% -10% 1.7 1.7 1.8 1.5<br />
Georgia 1,353 1,455 1,971 1,921 6,700 8% 35% -3% 1.4 1.5 1.9 1.7<br />
Turkey 1,840 1,553 1,432 1,863 6,688 -16% -8% 30% 2.0 1.6 1.4 1.6<br />
dem. Rep. of the Congo 1,596 1,571 1,636 1,771 6,574 -2% 4% 8% 1.7 1.6 1.6 1.6<br />
Armenia 1,331 1,641 1,633 1,615 6,220 23% -0% -1% 1.4 1.7 1.6 1.4<br />
Guinea 1,624 1,416 1,531 1,542 6,113 -13% 8% 1% 1.7 1.4 1.5 1.4<br />
The former Yugoslav Rep.<br />
of Macedonia<br />
1,532 2,075 822 1,178 5,607 35% -60% 43% 1.6 2.1 0.8 1.0<br />
Côte d’Ivoire 1,326 2,028 1,035 803 5,192 53% -49% -22% 1.4 2.0 1.0 0.7<br />
Algeria 1,038 1,127 1,376 1,441 4,982 9% 22% 5% 1.1 1.1 1.3 1.3<br />
El Salvador 1,181 1,183 1,141 1,105 4,610 0% -4% -3% 1.3 1.2 1.1 1.0<br />
Hungary 711 904 1,015 1,858 4,488 27% 12% 83% 0.8 0.9 1.0 1.6<br />
Haiti 1,156 1,094 823 842 3,915 -5% -25% 2% 1.2 1.1 0.8 0.7<br />
Egypt 786 806 1,005 1,244 3,841 3% 25% 24% 0.8 0.8 1.0 1.1<br />
Libya 477 1,485 1,292 571 3,825 211% -13% -56% 0.5 1.5 1.2 0.5<br />
Guatemala 819 861 939 1,037 3,656 5% 9% 10% 0.9 0.9 0.9 0.9<br />
Stateless 903 776 875 790 3,344 -14% 13% -10% 1.0 0.8 0.8 0.7<br />
Alb<strong>an</strong>ia 496 584 776 1,474 3,330 18% 33% 90% 0.5 0.6 0.7 1.3<br />
Sud<strong>an</strong> 700 845 882 809 3,236 21% 4% -8% 0.7 0.9 0.8 0.7<br />
Ethiopia 741 813 881 745 3,180 10% 8% -15% 0.8 0.8 0.8 0.7<br />
Nepal 648 650 826 789 2,913 0% 27% -4% 0.7 0.7 0.8 0.7<br />
Gh<strong>an</strong>a 405 1,213 712 487 2,817 200% -41% -32% 0.4 1.2 0.7 0.4<br />
Bosnia <strong>an</strong>d Herzegovina 377 413 758 1,184 2,732 10% 84% 56% 0.4 0.4 0.7 1.0<br />
Morocco 496 538 786 876 2,696 8% 46% 11% 0.5 0.5 0.8 0.8<br />
Mali 320 921 718 404 2,363 188% -22% -44% 0.3 0.9 0.7 0.4<br />
Azerbaij<strong>an</strong> 597 480 609 677 2,363 -20% 27% 11% 0.6 0.5 0.6 0.6<br />
Other * 16,317 16,194 16,115 17,500 66,126 -1% -0% 9% 17.4 16.3 15.5 15.4<br />
Total 93,674 99,245 104,011 113,446 410,376 6% 5% 9% 100.0 100.0 100.0 100.0<br />
No. of applications Ch<strong>an</strong>ge (%) Share (%)<br />
Origin<br />
Q1 Q2 Q3 Q4 Total Q2-Q1 Q3-Q2 Q4-Q3 Q1 Q2 Q3 Q4<br />
Serbia (<strong>an</strong>d Kosovo: S/RES/1244 (1999)) 6,121 4,678 7,561 10,906 29,266 -24% 62% 44% 9.3 8.0 10.6 14.0<br />
Afgh<strong>an</strong><strong>is</strong>t<strong>an</strong> 5,858 4,772 6,136 6,156 22,922 -19% 29% 0% 8.9 8.1 8.6 7.9<br />
Iraq 4,580 3,917 5,084 5,561 19,142 -14% 30% 9% 7.0 6.7 7.1 7.1<br />
Russi<strong>an</strong> Federation 4,216 3,848 4,674 4,519 17,257 -9% 21% -3% 6.4 6.6 6.5 5.8<br />
Somalia 3,986 3,572 4,842 3,670 16,070 -10% 36% -24% 6.1 6.1 6.8 4.7<br />
Islamic Rep. of Ir<strong>an</strong> 2,761 2,524 3,661 3,977 12,923 -9% 45% 9% 4.2 4.3 5.1 5.1<br />
Pak<strong>is</strong>t<strong>an</strong> 1,720 2,085 2,664 2,758 9,227 21% 28% 4% 2.6 3.6 3.7 3.5<br />
Nigeria 2,244 2,071 1,977 2,225 8,517 -8% -5% 13% 3.4 3.5 2.8 2.9<br />
Eritrea 1,615 1,694 2,388 2,168 7,865 5% 41% -9% 2.5 2.9 3.3 2.8<br />
Georgia 2,026 1,826 1,787 1,624 7,263 -10% -2% -9% 3.1 3.1 2.5 2.1<br />
Sri L<strong>an</strong>ka 1,720 1,469 1,531 1,949 6,669 -15% 4% 27% 2.6 2.5 2.1 2.5<br />
The former Yugoslav Rep.<br />
of Macedonia<br />
1,253 528 1,768 2,702 6,251 -58% 235% 53% 1.9 0.9 2.5 3.5<br />
China 1,287 1,374 1,599 1,668 5,928 7% 16% 4% 2.0 2.3 2.2 2.1<br />
Turkey 1,359 1,342 1,548 1,639 5,888 -1% 15% 6% 2.1 2.3 2.2 2.1<br />
B<strong>an</strong>gladesh 1,130 1,434 1,454 1,698 5,716 27% 1% 17% 1.7 2.4 2.0 2.2<br />
dem. Rep. of the Congo 1,318 1,325 1,383 1,380 5,406 1% 4% -0% 2.0 2.3 1.9 1.8<br />
Armenia 1,342 866 1,288 1,563 5,059 -35% 49% 21% 2.0 1.5 1.8 2.0<br />
Guinea 1,334 1,035 1,162 1,345 4,876 -22% 12% 16% 2.0 1.8 1.6 1.7<br />
Syri<strong>an</strong> Arab Rep. 1,211 1,002 1,259 1,310 4,782 -17% 26% 4% 1.8 1.7 1.8 1.7<br />
Algeria 957 848 903 1,069 3,777 -11% 6% 18% 1.5 1.4 1.3 1.4<br />
India 641 726 798 920 3,085 13% 10% 15% 1.0 1.2 1.1 1.2<br />
Stateless 661 537 672 736 2,606 -19% 25% 10% 1.0 0.9 0.9 0.9<br />
Sud<strong>an</strong> 588 547 682 657 2,474 -7% 25% -4% 0.9 0.9 1.0 0.8<br />
Bosnia <strong>an</strong>d Herzegovina 654 526 371 631 2,182 -20% -29% 70% 1.0 0.9 0.5 0.8<br />
Viet Nam 514 586 572 491 2,163 14% -2% -14% 0.8 1.0 0.8 0.6<br />
Zimbabwe 674 631 430 389 2,124 -6% -32% -10% 1.0 1.1 0.6 0.5<br />
Haiti 457 692 476 416 2,041 51% -31% -13% 0.7 1.2 0.7 0.5<br />
Azerbaij<strong>an</strong> 612 382 427 507 1,928 -38% 12% 19% 0.9 0.7 0.6 0.6<br />
Alb<strong>an</strong>ia 483 508 446 424 1,861 5% -12% -5% 0.7 0.9 0.6 0.5<br />
Mongolia 427 396 396 451 1,670 -7% 0% 14% 0.7 0.7 0.6 0.6<br />
Ethiopia 410 380 439 427 1,656 -7% 16% -3% 0.6 0.6 0.6 0.5<br />
Gh<strong>an</strong>a 398 465 356 366 1,585 17% -23% 3% 0.6 0.8 0.5 0.5<br />
Occupied Palestini<strong>an</strong> Territory 380 395 386 393 1,554 4% -2% 2% 0.6 0.7 0.5 0.5<br />
Côte d’Ivoire 385 391 398 371 1,545 2% 2% -7% 0.6 0.7 0.6 0.5<br />
Rw<strong>an</strong>da 436 311 358 410 1,515 -29% 15% 15% 0.7 0.5 0.5 0.5<br />
Cameroon 381 330 409 343 1,463 -13% 24% -16% 0.6 0.6 0.6 0.4<br />
Gambia 337 305 319 375 1,336 -9% 5% 18% 0.5 0.5 0.4 0.5<br />
Kyrgyzst<strong>an</strong> 87 161 444 622 1,314 85% 176% 40% 0.1 0.3 0.6 0.8<br />
Morocco 284 277 319 416 1,296 -2% 15% 30% 0.4 0.5 0.4 0.5<br />
Angola 375 285 300 322 1,282 -24% 5% 7% 0.6 0.5 0.4 0.4<br />
Other 8,399 7,622 7,946 8,448 32,415 -9% 4% 6% 12.8 13.0 11.1 10.8<br />
Total 65,621 58,663 71,613 78,002 273,899 -11% 22% 9% 100.0 100.0 100.0 100.0<br />
* Th<strong>is</strong> table excludes some 16,000 <strong>asylum</strong> applications lodged in Italy due to lack of breakdown by country of origin.<br />
30 Asylum Levels <strong>an</strong>d Trends in Industrialized Countries - 2011 Asylum Levels <strong>an</strong>d Trends in Industrialized Countries - 2011<br />
31
TABLE 12 Origin of <strong>asylum</strong> applic<strong>an</strong>ts in Europe by quarter | 2011<br />
TABLE 13<br />
Covering 38 Europe<strong>an</strong> countries which provided monthly data to UNHCR.<br />
Origin of <strong>asylum</strong> applic<strong>an</strong>ts in the Europe<strong>an</strong> Union (27) by quarter | 2010<br />
Covering 27 Europe<strong>an</strong> Union countries which provided monthly data to UNHCR.<br />
Origin<br />
No. of applications Ch<strong>an</strong>ge (%) Share (%)<br />
Q1 Q2 Q3 Q4 Total Q2-Q1 Q3-Q2 Q4-Q3 Q1 Q2 Q3 Q4<br />
Afgh<strong>an</strong><strong>is</strong>t<strong>an</strong> 6,640 7,935 9,997 8,745 33,317 20% 26% -13% 9.5 10.6 12.7 10.1<br />
Iraq 5,075 4,397 5,595 7,248 22,315 -13% 27% 30% 7.2 5.9 7.1 8.4<br />
Serbia (<strong>an</strong>d Kosovo: S/RES/1244 (1999)) 6,314 3,926 3,271 7,399 20,910 -38% -17% 126% 9.0 5.2 4.1 8.6<br />
Russi<strong>an</strong> Federation 3,536 3,268 4,499 4,364 15,667 -8% 38% -3% 5.0 4.4 5.7 5.0<br />
Pak<strong>is</strong>t<strong>an</strong> 2,845 3,256 4,483 4,628 15,212 14% 38% 3% 4.1 4.4 5.7 5.4<br />
Islamic Rep. of Ir<strong>an</strong> 3,255 2,981 3,837 4,912 14,985 -8% 29% 28% 4.6 4.0 4.9 5.7<br />
Somalia 2,742 3,786 3,951 4,299 14,778 38% 4% 9% 3.9 5.1 5.0 5.0<br />
Eritrea 2,069 3,107 2,363 2,200 9,739 50% -24% -7% 3.0 4.2 3.0 2.5<br />
Nigeria 1,868 3,051 2,277 2,210 9,406 63% -25% -3% 2.7 4.1 2.9 2.6<br />
Syri<strong>an</strong> Arab Rep. 1,343 1,526 2,443 2,533 7,845 14% 60% 4% 1.9 2.0 3.1 2.9<br />
Tun<strong>is</strong>ia 2,730 1,852 1,702 1,502 7,786 -32% -8% -12% 3.9 2.5 2.2 1.7<br />
Sri L<strong>an</strong>ka 1,926 1,648 1,591 1,752 6,917 -14% -3% 10% 2.7 2.2 2.0 2.0<br />
B<strong>an</strong>gladesh 1,515 2,144 1,595 1,651 6,905 42% -26% 4% 2.2 2.9 2.0 1.9<br />
Georgia 1,321 1,427 1,946 1,898 6,592 8% 36% -2% 1.9 1.9 2.5 2.2<br />
dem. Rep. of the Congo 1,455 1,453 1,494 1,663 6,065 -0% 3% 11% 2.1 1.9 1.9 1.9<br />
Armenia 1,277 1,603 1,585 1,572 6,037 26% -1% -1% 1.8 2.1 2.0 1.8<br />
Turkey 1,647 1,393 1,265 1,636 5,941 -15% -9% 29% 2.3 1.9 1.6 1.9<br />
China 1,462 1,407 1,561 1,477 5,907 -4% 11% -5% 2.1 1.9 2.0 1.7<br />
Guinea 1,516 1,321 1,437 1,438 5,712 -13% 9% 0% 2.2 1.8 1.8 1.7<br />
The former Yugoslav Rep.<br />
of Macedonia<br />
1,517 2,068 816 1,161 5,562 36% -61% 42% 2.2 2.8 1.0 1.3<br />
Algeria 992 1,084 1,337 1,371 4,784 9% 23% 3% 1.4 1.4 1.7 1.6<br />
Côte d’Ivoire 1,191 1,787 891 702 4,571 50% -50% -21% 1.7 2.4 1.1 0.8<br />
Libya 417 1,253 1,088 519 3,277 200% -13% -52% 0.6 1.7 1.4 0.6<br />
Sud<strong>an</strong> 631 778 806 726 2,941 23% 4% -10% 0.9 1.0 1.0 0.8<br />
Alb<strong>an</strong>ia 399 486 667 1,363 2,915 22% 37% 104% 0.6 0.6 0.8 1.6<br />
India 651 688 743 650 2,732 6% 8% -13% 0.9 0.9 0.9 0.8<br />
Stateless 681 723 721 582 2,707 6% -0% -19% 1.0 1.0 0.9 0.7<br />
Morocco 476 510 758 860 2,604 7% 49% 13% 0.7 0.7 1.0 1.0<br />
Gh<strong>an</strong>a 348 1,156 652 431 2,587 232% -44% -34% 0.5 1.5 0.8 0.5<br />
Bosnia <strong>an</strong>d Herzegovina 311 338 707 1,159 2,515 9% 109% 64% 0.4 0.5 0.9 1.3<br />
Azerbaij<strong>an</strong> 576 454 582 662 2,274 -21% 28% 14% 0.8 0.6 0.7 0.8<br />
Egypt 389 425 573 731 2,118 9% 35% 28% 0.6 0.6 0.7 0.8<br />
Haiti 573 594 454 427 2,048 4% -24% -6% 0.8 0.8 0.6 0.5<br />
Mali 221 822 658 336 2,037 272% -20% -49% 0.3 1.1 0.8 0.4<br />
Ethiopia 367 520 527 397 1,811 42% 1% -25% 0.5 0.7 0.7 0.5<br />
Senegal 428 359 369 515 1,671 -16% 3% 40% 0.6 0.5 0.5 0.6<br />
Cameroon 386 362 363 498 1,609 -6% 0% 37% 0.6 0.5 0.5 0.6<br />
Viet Nam 427 389 421 323 1,560 -9% 8% -23% 0.6 0.5 0.5 0.4<br />
Mongolia 337 356 394 472 1,559 6% 11% 20% 0.5 0.5 0.5 0.5<br />
Belarus 275 221 444 501 1,441 -20% 101% 13% 0.4 0.3 0.6 0.6<br />
Other * 8,303 8,163 8,230 9,103 33,799 -2% 1% 11% 11.8 10.9 10.4 10.5<br />
Total 70,432 75,017 79,093 86,616 311,158 7% 5% 10% 100.0 100.0 100.0 100.0<br />
No. of applications Ch<strong>an</strong>ge (%) Share (%)<br />
Origin<br />
Q1 Q2 Q3 Q4 Total Q2-Q1 Q3-Q2 Q4-Q3 Q1 Q2 Q3 Q4<br />
Serbia (<strong>an</strong>d Kosovo: S/RES/1244 (1999)) 5,697 4,189 7,200 10,343 27,429 -26% 72% 44% 9.8 8.1 11.5 15.3<br />
Afgh<strong>an</strong><strong>is</strong>t<strong>an</strong> 5,106 4,034 5,089 5,213 19,442 -21% 26% 2% 8.8 7.8 8.2 7.7<br />
Russi<strong>an</strong> Federation 3,941 3,629 4,418 4,278 16,266 -8% 22% -3% 6.8 7.0 7.1 6.3<br />
Iraq 3,689 3,164 3,851 3,744 14,448 -14% 22% -3% 6.4 6.1 6.2 5.5<br />
Somalia 3,495 3,141 4,222 2,986 13,844 -10% 34% -29% 6.0 6.1 6.8 4.4<br />
Islamic Rep. of Ir<strong>an</strong> 2,030 1,827 2,641 2,793 9,291 -10% 45% 6% 3.5 3.5 4.2 4.1<br />
Pak<strong>is</strong>t<strong>an</strong> 1,677 2,023 2,576 2,660 8,936 21% 27% 3% 2.9 3.9 4.1 3.9<br />
Georgia 1,857 1,655 1,616 1,513 6,641 -11% -2% -6% 3.2 3.2 2.6 2.2<br />
Nigeria 1,756 1,617 1,500 1,663 6,536 -8% -7% 11% 3.0 3.1 2.4 2.5<br />
The former Yugoslav Rep.<br />
of Macedonia<br />
910 465 1,727 2,609 5,711 -49% 271% 51% 1.6 0.9 2.8 3.9<br />
Sri L<strong>an</strong>ka 1,457 1,241 1,298 1,703 5,699 -15% 5% 31% 2.5 2.4 2.1 2.5<br />
B<strong>an</strong>gladesh 1,119 1,420 1,442 1,678 5,659 27% 2% 16% 1.9 2.7 2.3 2.5<br />
China 1,180 1,264 1,441 1,507 5,392 7% 14% 5% 2.0 2.4 2.3 2.2<br />
Turkey 1,221 1,230 1,406 1,488 5,345 1% 14% 6% 2.1 2.4 2.3 2.2<br />
dem. Rep. of the Congo 1,241 1,252 1,291 1,296 5,080 1% 3% 0% 2.1 2.4 2.1 1.9<br />
Armenia 1,311 848 1,271 1,535 4,965 -35% 50% 21% 2.3 1.6 2.0 2.3<br />
Guinea 1,252 976 1,081 1,246 4,555 -22% 11% 15% 2.2 1.9 1.7 1.8<br />
Eritrea 940 949 1,257 1,260 4,406 1% 32% 0% 1.6 1.8 2.0 1.9<br />
Syri<strong>an</strong> Arab Rep. 1,060 906 1,115 1,147 4,228 -15% 23% 3% 1.8 1.8 1.8 1.7<br />
Algeria 863 760 756 917 3,296 -12% -1% 21% 1.5 1.5 1.2 1.4<br />
India 629 712 772 899 3,012 13% 8% 16% 1.1 1.4 1.2 1.3<br />
Sud<strong>an</strong> 534 491 592 560 2,177 -8% 21% -5% 0.9 1.0 0.9 0.8<br />
Viet Nam 510 576 566 483 2,135 13% -2% -15% 0.9 1.1 0.9 0.7<br />
Stateless 515 441 532 641 2,129 -14% 21% 20% 0.9 0.9 0.9 0.9<br />
Zimbabwe 657 619 418 381 2,075 -6% -32% -9% 1.1 1.2 0.7 0.6<br />
Haiti 453 691 476 412 2,032 53% -31% -13% 0.8 1.3 0.8 0.6<br />
Bosnia <strong>an</strong>d Herzegovina 581 490 324 603 1,998 -16% -34% 86% 1.0 0.9 0.5 0.9<br />
Azerbaij<strong>an</strong> 591 363 414 482 1,850 -39% 14% 16% 1.0 0.7 0.7 0.7<br />
Alb<strong>an</strong>ia 473 502 432 413 1,820 6% -14% -4% 0.8 1.0 0.7 0.6<br />
Mongolia 389 363 373 434 1,559 -7% 3% 16% 0.7 0.7 0.6 0.6<br />
Rw<strong>an</strong>da 428 305 351 395 1,479 -29% 15% 13% 0.7 0.6 0.6 0.6<br />
Côte d’Ivoire 355 356 367 341 1,419 0% 3% -7% 0.6 0.7 0.6 0.5<br />
Gh<strong>an</strong>a 362 424 319 303 1,408 17% -25% -5% 0.6 0.8 0.5 0.4<br />
Cameroon 349 296 390 324 1,359 -15% 32% -17% 0.6 0.6 0.6 0.5<br />
Occupied Palestini<strong>an</strong> Territory 330 367 311 260 1,268 11% -15% -16% 0.6 0.7 0.5 0.4<br />
Angola 357 264 280 299 1,200 -26% 6% 7% 0.6 0.5 0.4 0.4<br />
Maurit<strong>an</strong>ia 314 278 289 315 1,196 -11% 4% 9% 0.5 0.5 0.5 0.5<br />
Senegal 257 291 288 305 1,141 13% -1% 6% 0.4 0.6 0.5 0.5<br />
Gambia 284 263 254 285 1,086 -7% -3% 12% 0.5 0.5 0.4 0.4<br />
Egypt 264 279 241 295 1,079 6% -14% 22% 0.5 0.5 0.4 0.4<br />
Other 7,434 6,706 7,157 7,720 29,017 -10% 7% 8% 12.8 13.0 11.5 11.4<br />
Total 57,868 51,667 62,344 67,729 239,608 -11% 21% 9% 100.0 100.0 100.0 100.0<br />
* Th<strong>is</strong> table excludes some 16,000 <strong>asylum</strong> applications lodged in Italy due to lack of breakdown by country of origin.<br />
32 Asylum Levels <strong>an</strong>d Trends in Industrialized Countries - 2011 Asylum Levels <strong>an</strong>d Trends in Industrialized Countries - 2011<br />
33
TABLE 14 Origin of <strong>asylum</strong> applic<strong>an</strong>ts in the Europe<strong>an</strong> Union (27) by quarter | 2011<br />
TABLE 15<br />
Covering 27 Europe<strong>an</strong> Union countries which provided monthly data to UNHCR.<br />
Origin of <strong>asylum</strong> applic<strong>an</strong>ts in C<strong>an</strong>ada <strong>an</strong>d the United States of America | 2010<br />
Origin<br />
No. of applications Ch<strong>an</strong>ge (%) Share (%)<br />
Q1 Q2 Q3 Q4 Total Q2-Q1 Q3-Q2 Q4-Q3 Q1 Q2 Q3 Q4<br />
Afgh<strong>an</strong><strong>is</strong>t<strong>an</strong> 5,547 6,200 7,514 6,898 26,159 12% 21% -8% 9.1 9.7 11.4 9.8<br />
Serbia (<strong>an</strong>d Kosovo: S/RES/1244 (1999)) 5,973 3,634 3,011 6,454 19,072 -39% -17% 114% 9.8 5.7 4.6 9.2<br />
Russi<strong>an</strong> Federation 3,376 3,149 4,314 4,206 15,045 -7% 37% -3% 5.6 4.9 6.5 6.0<br />
Pak<strong>is</strong>t<strong>an</strong> 2,726 2,980 4,183 4,497 14,386 9% 40% 8% 4.5 4.7 6.3 6.4<br />
Iraq 3,479 3,103 3,799 3,242 13,623 -11% 22% -15% 5.7 4.9 5.8 4.6<br />
Islamic Rep. of Ir<strong>an</strong> 2,463 2,214 2,932 3,180 10,789 -10% 32% 8% 4.1 3.5 4.4 4.5<br />
Somalia 2,128 2,820 2,558 3,150 10,656 33% -9% 23% 3.5 4.4 3.9 4.5<br />
Nigeria 1,506 2,754 1,870 1,694 7,824 83% -32% -9% 2.5 4.3 2.8 2.4<br />
B<strong>an</strong>gladesh 1,494 2,125 1,573 1,595 6,787 42% -26% 1% 2.5 3.3 2.4 2.3<br />
Syri<strong>an</strong> Arab Rep. 1,131 1,331 2,061 2,202 6,725 18% 55% 7% 1.9 2.1 3.1 3.1<br />
Sri L<strong>an</strong>ka 1,760 1,565 1,493 1,613 6,431 -11% -5% 8% 2.9 2.5 2.3 2.3<br />
Georgia 1,252 1,339 1,855 1,806 6,252 7% 39% -3% 2.1 2.1 2.8 2.6<br />
Armenia 1,252 1,580 1,546 1,551 5,929 26% -2% 0% 2.1 2.5 2.3 2.2<br />
dem. Rep. of the Congo 1,376 1,406 1,432 1,586 5,800 2% 2% 11% 2.3 2.2 2.2 2.3<br />
Turkey 1,508 1,263 1,130 1,475 5,376 -16% -11% 31% 2.5 2.0 1.7 2.1<br />
Guinea 1,411 1,243 1,330 1,356 5,340 -12% 7% 2% 2.3 2.0 2.0 1.9<br />
Tun<strong>is</strong>ia 2,464 1,027 1,063 694 5,248 -58% 4% -35% 4.1 1.6 1.6 1.0<br />
Eritrea 1,079 1,500 1,433 1,196 5,208 39% -4% -17% 1.8 2.4 2.2 1.7<br />
China 1,326 1,235 1,287 1,236 5,084 -7% 4% -4% 2.2 1.9 1.9 1.8<br />
The former Yugoslav Rep.<br />
of Macedonia<br />
1,341 1,716 700 942 4,699 28% -59% 35% 2.2 2.7 1.1 1.3<br />
Côte d’Ivoire 1,087 1,709 829 637 4,262 57% -51% -23% 1.8 2.7 1.3 0.9<br />
Algeria 866 907 1,134 1,155 4,062 5% 25% 2% 1.4 1.4 1.7 1.6<br />
Alb<strong>an</strong>ia 379 473 634 1,336 2,822 25% 34% 111% 0.6 0.7 1.0 1.9<br />
Libya 384 1,107 846 373 2,710 188% -24% -56% 0.6 1.7 1.3 0.5<br />
India 622 668 690 632 2,612 7% 3% -8% 1.0 1.0 1.0 0.9<br />
Sud<strong>an</strong> 533 684 713 628 2,558 28% 4% -12% 0.9 1.1 1.1 0.9<br />
Stateless 603 658 634 523 2,418 9% -4% -18% 1.0 1.0 1.0 0.7<br />
Gh<strong>an</strong>a 317 1,121 606 337 2,381 254% -46% -44% 0.5 1.8 0.9 0.5<br />
Bosnia <strong>an</strong>d Herzegovina 283 300 651 1,041 2,275 6% 117% 60% 0.5 0.5 1.0 1.5<br />
Azerbaij<strong>an</strong> 544 438 573 635 2,190 -19% 31% 11% 0.9 0.7 0.9 0.9<br />
Haiti 571 593 452 427 2,043 4% -24% -6% 0.9 0.9 0.7 0.6<br />
Egypt 347 394 545 708 1,994 14% 38% 30% 0.6 0.6 0.8 1.0<br />
Mali 211 812 640 317 1,980 285% -21% -50% 0.3 1.3 1.0 0.5<br />
Morocco 330 341 585 603 1,859 3% 72% 3% 0.5 0.5 0.9 0.9<br />
Viet Nam 419 381 415 312 1,527 -9% 9% -25% 0.7 0.6 0.6 0.4<br />
Senegal 389 319 329 464 1,501 -18% 3% 41% 0.6 0.5 0.5 0.7<br />
Cameroon 323 335 351 459 1,468 4% 5% 31% 0.5 0.5 0.5 0.7<br />
Mongolia 322 334 370 430 1,456 4% 11% 16% 0.5 0.5 0.6 0.6<br />
Comoros 407 404 341 238 1,390 -1% -16% -30% 0.7 0.6 0.5 0.3<br />
Maurit<strong>an</strong>ia 327 367 309 375 1,378 12% -16% 21% 0.5 0.6 0.5 0.5<br />
Other * 7,150 7,332 7,524 8,010 30,016 3% 3% 6% 11.7 11.5 11.4 11.4<br />
Total 61,006 63,861 66,255 70,213 261,335 5% 4% 6% 100.0 100.0 100.0 100.0<br />
* Th<strong>is</strong> table excludes some 16,000 <strong>asylum</strong> applications lodged in Italy due to lack of breakdown by country of origin.<br />
No. of applications Ch<strong>an</strong>ge (%) Share (%)<br />
Origin<br />
Q1 Q2 Q3 Q4 Total Q2-Q1 Q3-Q2 Q4-Q3 Q1 Q2 Q3 Q4<br />
China 3,235 3,672 3,739 3,786 14,432 14% 2% 1% 20.3 22.1 21.6 22.2<br />
Mexico 1,214 1,389 1,383 1,437 5,423 14% -0% 4% 7.6 8.4 8.0 8.4<br />
El Salvador 763 836 813 816 3,228 10% -3% 0% 4.8 5.0 4.7 4.8<br />
Guatemala 586 618 686 651 2,541 5% 11% -5% 3.7 3.7 4.0 3.8<br />
Hungary 813 478 361 698 2,350 -41% -24% 93% 5.1 2.9 2.1 4.1<br />
Haiti 749 510 408 468 2,135 -32% -20% 15% 4.7 3.1 2.4 2.7<br />
Colombia 575 497 494 415 1,981 -14% -1% -16% 3.6 3.0 2.9 2.4<br />
Sri L<strong>an</strong>ka 221 241 721 225 1,408 9% 199% -69% 1.4 1.4 4.2 1.3<br />
Honduras 354 348 346 336 1,384 -2% -1% -3% 2.2 2.1 2.0 2.0<br />
Ethiopia 336 343 368 331 1,378 2% 7% -10% 2.1 2.1 2.1 1.9<br />
India 321 279 357 356 1,313 -13% 28% -0% 2.0 1.7 2.1 2.1<br />
Russi<strong>an</strong> Federation 289 437 268 282 1,276 51% -39% 5% 1.8 2.6 1.6 1.6<br />
Nepal 284 286 313 277 1,160 1% 9% -12% 1.8 1.7 1.8 1.6<br />
Nigeria 247 237 286 296 1,066 -4% 21% 3% 1.5 1.4 1.7 1.7<br />
Pak<strong>is</strong>t<strong>an</strong> 227 231 260 325 1,043 2% 13% 25% 1.4 1.4 1.5 1.9<br />
Somalia 178 244 286 207 915 37% 17% -28% 1.1 1.5 1.7 1.2<br />
Venezuela (Bolivari<strong>an</strong> Republic of) 133 209 230 267 839 57% 10% 16% 0.8 1.3 1.3 1.6<br />
Islamic Rep. of Ir<strong>an</strong> 209 212 209 195 825 1% -1% -7% 1.3 1.3 1.2 1.1<br />
United States * 198 144 256 169 767 -27% 78% -34% 1.2 0.9 1.5 1.0<br />
Saint Vincent <strong>an</strong>d the Grenadines 217 140 188 147 692 -35% 34% -22% 1.4 0.8 1.1 0.9<br />
Egypt 151 151 174 178 654 0% 15% 2% 0.9 0.9 1.0 1.0<br />
Eritrea 154 137 138 202 631 -11% 1% 46% 1.0 0.8 0.8 1.2<br />
Jamaica 135 129 149 172 585 -4% 16% 15% 0.8 0.8 0.9 1.0<br />
Iraq 124 158 150 128 560 27% -5% -15% 0.8 0.9 0.9 0.7<br />
Cameroon 132 138 138 142 550 5% 0% 3% 0.8 0.8 0.8 0.8<br />
Afgh<strong>an</strong><strong>is</strong>t<strong>an</strong> 135 128 174 111 548 -5% 36% -36% 0.8 0.8 1.0 0.6<br />
Kenya 148 137 145 108 538 -7% 6% -26% 0.9 0.8 0.8 0.6<br />
Ecuador 116 114 120 146 496 -2% 5% 22% 0.7 0.7 0.7 0.9<br />
Saint Lucia 125 100 120 143 488 -20% 20% 19% 0.8 0.6 0.7 0.8<br />
Guinea 147 137 95 89 468 -7% -31% -6% 0.9 0.8 0.5 0.5<br />
Cuba 112 110 112 120 454 -2% 2% 7% 0.7 0.7 0.6 0.7<br />
dem. Rep. of the Congo 68 83 142 108 401 22% 71% -24% 0.4 0.5 0.8 0.6<br />
Turkey 84 90 88 109 371 7% -2% 24% 0.5 0.5 0.5 0.6<br />
Ukraine 71 124 72 103 370 75% -42% 43% 0.4 0.7 0.4 0.6<br />
Indonesia 84 96 83 89 352 14% -14% 7% 0.5 0.6 0.5 0.5<br />
Alb<strong>an</strong>ia 97 86 85 74 342 -11% -1% -13% 0.6 0.5 0.5 0.4<br />
Philippines 91 89 68 87 335 -2% -24% 28% 0.6 0.5 0.4 0.5<br />
Serbia (<strong>an</strong>d Kosovo: S/RES/1244 (1999)) 79 106 80 69 334 34% -25% -14% 0.5 0.6 0.5 0.4<br />
Brazil 72 110 69 75 326 53% -37% 9% 0.5 0.7 0.4 0.4<br />
Peru 74 67 87 78 306 -9% 30% -10% 0.5 0.4 0.5 0.5<br />
Other 5,850 6,664 6,764 6,863 26,141 14% 2% 1% 36.6 40.1 39.1 40.2<br />
Total 15,963 16,633 17,286 17,092 66,974 4% 4% -1% 100.0 100.0 100.0 100.0<br />
* Refers to applications lodged in C<strong>an</strong>ada.<br />
34 Asylum Levels <strong>an</strong>d Trends in Industrialized Countries - 2011 Asylum Levels <strong>an</strong>d Trends in Industrialized Countries - 2011<br />
35
TABLE 16 Origin of <strong>asylum</strong> applic<strong>an</strong>ts in C<strong>an</strong>ada <strong>an</strong>d the United States of America | 2011<br />
TABLE 17 Origin of <strong>asylum</strong> applic<strong>an</strong>ts in Australia <strong>an</strong>d New Zeal<strong>an</strong>d | 2010<br />
Origin<br />
No. of applications Ch<strong>an</strong>ge (%) Share (%)<br />
Q1 Q2 Q3 Q4 Total Q2-Q1 Q3-Q2 Q4-Q3 Q1 Q2 Q3 Q4<br />
China 3,905 4,376 4,607 4,415 17,303 12% 5% -4% 19.5 20.7 21.6 20.0<br />
Mexico 1,918 2,221 2,279 2,421 8,839 16% 3% 6% 9.6 10.5 10.7 11.0<br />
Hungary 707 893 1,009 1,843 4,452 26% 13% 83% 3.5 4.2 4.7 8.4<br />
El Salvador 1,135 1,149 1,083 1,073 4,440 1% -6% -1% 5.7 5.4 5.1 4.9<br />
Guatemala 811 851 929 1,027 3,618 5% 9% 11% 4.1 4.0 4.3 4.7<br />
India 824 773 848 763 3,208 -6% 10% -10% 4.1 3.7 4.0 3.5<br />
Haiti 583 500 369 415 1,867 -14% -26% 12% 2.9 2.4 1.7 1.9<br />
Honduras 409 509 473 469 1,860 24% -7% -1% 2.0 2.4 2.2 2.1<br />
Colombia 397 415 360 348 1,520 5% -13% -3% 2.0 2.0 1.7 1.6<br />
Pak<strong>is</strong>t<strong>an</strong> 337 328 412 409 1,486 -3% 26% -1% 1.7 1.6 1.9 1.9<br />
Nepal 338 330 397 365 1,430 -2% 20% -8% 1.7 1.6 1.9 1.7<br />
Ethiopia 358 288 340 332 1,318 -20% 18% -2% 1.8 1.4 1.6 1.5<br />
Russi<strong>an</strong> Federation 285 415 317 281 1,298 46% -24% -11% 1.4 2.0 1.5 1.3<br />
Egypt 251 292 340 397 1,280 16% 16% 17% 1.3 1.4 1.6 1.8<br />
Nigeria 231 231 232 248 942 0% 0% 7% 1.2 1.1 1.1 1.1<br />
Islamic Rep. of Ir<strong>an</strong> 196 194 255 264 909 -1% 31% 4% 1.0 0.9 1.2 1.2<br />
Sri L<strong>an</strong>ka 249 197 227 216 889 -21% 15% -5% 1.2 0.9 1.1 1.0<br />
Eritrea 297 251 194 124 866 -15% -23% -36% 1.5 1.2 0.9 0.6<br />
Venezuela (Bolivari<strong>an</strong> Rep. of) 223 218 211 210 862 -2% -3% -0% 1.1 1.0 1.0 1.0<br />
Namibia 325 274 134 102 835 -16% -51% -24% 1.6 1.3 0.6 0.5<br />
Ecuador 202 212 175 241 830 5% -17% 38% 1.0 1.0 0.8 1.1<br />
Jamaica 187 196 168 158 709 5% -14% -6% 0.9 0.9 0.8 0.7<br />
Somalia 173 149 196 170 688 -14% 32% -13% 0.9 0.7 0.9 0.8<br />
Saint Vincent <strong>an</strong>d the Grenadines 181 132 192 152 657 -27% 45% -21% 0.9 0.6 0.9 0.7<br />
Iraq 216 145 145 138 644 -33% 0% -5% 1.1 0.7 0.7 0.6<br />
Cameroon 172 154 152 144 622 -10% -1% -5% 0.9 0.7 0.7 0.7<br />
United States * 138 140 168 176 622 1% 20% 5% 0.7 0.7 0.8 0.8<br />
Afgh<strong>an</strong><strong>is</strong>t<strong>an</strong> 121 149 179 167 616 23% 20% -7% 0.6 0.7 0.8 0.8<br />
Côte d’Ivoire 131 214 143 92 580 63% -33% -36% 0.7 1.0 0.7 0.4<br />
Saint Lucia 170 117 131 160 578 -31% 12% 22% 0.9 0.6 0.6 0.7<br />
dem. Rep. of the Congo 138 117 138 98 491 -15% 18% -29% 0.7 0.6 0.6 0.4<br />
B<strong>an</strong>gladesh 123 112 141 92 468 -9% 26% -35% 0.6 0.5 0.7 0.4<br />
Syri<strong>an</strong> Arab Rep. 51 87 118 182 438 71% 36% 54% 0.3 0.4 0.6 0.8<br />
Kenya 104 107 107 109 427 3% 0% 2% 0.5 0.5 0.5 0.5<br />
Turkey 95 100 90 132 417 5% -10% 47% 0.5 0.5 0.4 0.6<br />
Cuba 118 112 93 94 417 -5% -17% 1% 0.6 0.5 0.4 0.4<br />
Brazil 113 111 98 83 405 -2% -12% -15% 0.6 0.5 0.5 0.4<br />
Alb<strong>an</strong>ia 95 96 103 109 403 1% 7% 6% 0.5 0.5 0.5 0.5<br />
Rom<strong>an</strong>ia 67 76 113 147 403 13% 49% 30% 0.3 0.4 0.5 0.7<br />
dem. People’s Rep. of Korea 90 94 95 117 396 4% 1% 23% 0.5 0.4 0.4 0.5<br />
Other 3,518 3,787 3,597 3,587 14,489 8% -5% -0% 17.6 17.9 16.8 16.3<br />
Total 19,982 21,112 21,358 22,070 84,522 6% 1% 3% 100.0 100.0 100.0 100.0<br />
* Refers to applications lodged in C<strong>an</strong>ada.<br />
Origin<br />
No. of applications Ch<strong>an</strong>ge (%) Share (%)<br />
Q1 Q2 Q3 Q4 Total Q2-Q1 Q3-Q2 Q4-Q3 Q1 Q2 Q3 Q4<br />
Afgh<strong>an</strong><strong>is</strong>t<strong>an</strong> 536 1,414 794 389 3,133 164% -44% -51% 21.9 36.7 23.7 11.7<br />
Islamic Rep. of Ir<strong>an</strong> 119 238 402 637 1,396 100% 69% 58% 4.9 6.2 12.0 19.1<br />
China 290 326 294 303 1,213 12% -10% 3% 11.8 8.4 8.8 9.1<br />
Stateless 54 269 309 403 1,035 398% 15% 30% 2.2 7.0 9.2 12.1<br />
Iraq 179 136 233 318 866 -24% 71% 36% 7.3 3.5 7.0 9.5<br />
Sri L<strong>an</strong>ka 163 315 168 173 819 93% -47% 3% 6.6 8.2 5.0 5.2<br />
Fiji 232 164 128 88 612 -29% -22% -31% 9.5 4.3 3.8 2.6<br />
Pak<strong>is</strong>t<strong>an</strong> 114 91 132 140 477 -20% 45% 6% 4.6 2.4 3.9 4.2<br />
India 76 106 123 108 413 39% 16% -12% 3.1 2.7 3.7 3.2<br />
Egypt 56 72 89 116 333 29% 24% 30% 2.3 1.9 2.7 3.5<br />
Zimbabwe 114 107 53 32 306 -6% -50% -40% 4.6 2.8 1.6 1.0<br />
Malaysia 65 64 79 47 255 -2% 23% -41% 2.6 1.7 2.4 1.4<br />
Leb<strong>an</strong>on 29 66 47 61 203 128% -29% 30% 1.2 1.7 1.4 1.8<br />
Indonesia 42 48 64 38 192 14% 33% -41% 1.7 1.2 1.9 1.1<br />
Nepal 41 30 40 57 168 -27% 33% 43% 1.7 0.8 1.2 1.7<br />
My<strong>an</strong>mar 36 47 42 27 152 31% -11% -36% 1.5 1.2 1.3 0.8<br />
Turkey 34 18 35 36 123 -47% 94% 3% 1.4 0.5 1.0 1.1<br />
B<strong>an</strong>gladesh 28 26 25 31 110 -7% -4% 24% 1.1 0.7 0.7 0.9<br />
Viet Nam 7 7 20 59 93 0% 186% 195% 0.3 0.2 0.6 1.8<br />
Rep. of Korea 17 33 21 16 87 94% -36% -24% 0.7 0.9 0.6 0.5<br />
Other 221 281 250 260 1,012 27% -11% 4% 9.0 7.3 7.5 7.8<br />
Total 2,453 3,858 3,348 3,339 12,998 57% -13% -0% 100.0 100.0 100.0 100.0<br />
TABLE 18 Origin of <strong>asylum</strong> applic<strong>an</strong>ts in Australia <strong>an</strong>d New Zeal<strong>an</strong>d | 2011<br />
Origin<br />
No. of applications Ch<strong>an</strong>ge (%) Share (%)<br />
Q1 Q2 Q3 Q4 Total Q2-Q1 Q3-Q2 Q4-Q3 Q1 Q2 Q3 Q4<br />
Islamic Rep. of Ir<strong>an</strong> 548 389 523 725 2,185 -29% 34% 39% 20.3 16.1 18.4 18.8<br />
Afgh<strong>an</strong><strong>is</strong>t<strong>an</strong> 221 316 312 883 1,732 43% -1% 183% 8.2 13.0 11.0 22.9<br />
China 309 239 318 342 1,208 -23% 33% 8% 11.5 9.9 11.2 8.9<br />
Pak<strong>is</strong>t<strong>an</strong> 157 204 190 288 839 30% -7% 52% 5.8 8.4 6.7 7.5<br />
India 132 194 222 218 766 47% 14% -2% 4.9 8.0 7.8 5.7<br />
Stateless 200 27 121 183 531 -87% 348% 51% 7.4 1.1 4.3 4.7<br />
Iraq 125 96 125 156 502 -23% 30% 25% 4.6 4.0 4.4 4.0<br />
Egypt 146 86 92 113 437 -41% 7% 23% 5.4 3.6 3.2 2.9<br />
Sri L<strong>an</strong>ka 63 132 45 149 389 110% -66% 231% 2.3 5.5 1.6 3.9<br />
Fiji 118 44 55 88 305 -63% 25% 60% 4.4 1.8 1.9 2.3<br />
Nepal 75 58 86 55 274 -23% 48% -36% 2.8 2.4 3.0 1.4<br />
Libya 10 52 118 24 204 420% 127% -80% 0.4 2.1 4.1 0.6<br />
Zimbabwe 71 39 46 27 183 -45% 18% -41% 2.6 1.6 1.6 0.7<br />
Malaysia 49 39 42 53 183 -20% 8% 26% 1.8 1.6 1.5 1.4<br />
Indonesia 48 50 40 38 176 4% -20% -5% 1.8 2.1 1.4 1.0<br />
Leb<strong>an</strong>on 37 31 39 53 160 -16% 26% 36% 1.4 1.3 1.4 1.4<br />
B<strong>an</strong>gladesh 35 19 33 48 135 -46% 74% 45% 1.3 0.8 1.2 1.2<br />
Viet Nam 36 30 42 24 132 -17% 40% -43% 1.3 1.2 1.5 0.6<br />
Syri<strong>an</strong> Arab Rep. 7 16 39 34 96 129% 144% -13% 0.3 0.7 1.4 0.9<br />
Turkey 30 24 22 19 95 -20% -8% -14% 1.1 1.0 0.8 0.5<br />
Other 281 337 335 333 1,286 20% -1% -1% 10.4 13.9 11.8 8.6<br />
Total 2,698 2,422 2,845 3,853 11,818 -10% 17% 35% 100.0 100.0 100.0 100.0<br />
36 Asylum Levels <strong>an</strong>d Trends in Industrialized Countries - 2011 Asylum Levels <strong>an</strong>d Trends in Industrialized Countries - 2011<br />
37
TABLE 19 Origin of <strong>asylum</strong> applic<strong>an</strong>ts in Jap<strong>an</strong> <strong>an</strong>d the Republic of Korea | 2010<br />
An aster<strong>is</strong>k (*) denotes between 1 <strong>an</strong>d 4 applications.<br />
TABLE 20 Origin of <strong>asylum</strong> applic<strong>an</strong>ts in Jap<strong>an</strong> <strong>an</strong>d the Republic of Korea | 2011<br />
An aster<strong>is</strong>k (*) denotes between 1 <strong>an</strong>d 4 applications<br />
Origin<br />
No. of applications Ch<strong>an</strong>ge (%) Share (%)<br />
Q1 Q2 Q3 Q4 Total Q2-Q1 Q3-Q2 Q4-Q3 Q1 Q2 Q3 Q4<br />
My<strong>an</strong>mar 79 93 93 114 379 18% 0% 23% 27.5 30.8 18.5 21.0<br />
Pak<strong>is</strong>t<strong>an</strong> 42 22 46 102 212 -48% 109% 122% 14.6 7.3 9.2 18.8<br />
Sri L<strong>an</strong>ka 30 34 48 65 177 13% 41% 35% 10.5 11.3 9.6 12.0<br />
Turkey 27 26 43 31 127 -4% 65% -28% 9.4 8.6 8.6 5.7<br />
Nepal 7 17 33 59 116 143% 94% 79% 2.4 5.6 6.6 10.9<br />
India 16 12 41 19 88 -25% 242% -54% 5.6 4.0 8.2 3.5<br />
Kyrgyzst<strong>an</strong> - - 60 17 77 .. .. -72% - - 12.0 3.1<br />
B<strong>an</strong>gladesh 10 20 16 22 68 100% -20% 38% 3.5 6.6 3.2 4.1<br />
Nigeria 12 13 17 11 53 8% 31% -35% 4.2 4.3 3.4 2.0<br />
Islamic Rep. of Ir<strong>an</strong> 10 8 11 12 41 -20% 38% 9% 3.5 2.6 2.2 2.2<br />
Ug<strong>an</strong>da * 8 11 11 33 167% 38% 0% 1.0 2.6 2.2 2.0<br />
Cameroon * 7 13 7 31 75% 86% -46% 1.4 2.3 2.6 1.3<br />
China 7 5 5 7 24 -29% 0% 40% 2.4 1.7 1.0 1.3<br />
Ethiopia * * 10 6 22 0% 233% -40% 1.0 1.0 2.0 1.1<br />
dem. Rep. of the Congo * * 9 7 21 -33% 350% -22% 1.0 0.7 1.8 1.3<br />
Afgh<strong>an</strong><strong>is</strong>t<strong>an</strong> * * 5 6 16 -75% 400% 20% 1.4 0.3 1.0 1.1<br />
Gh<strong>an</strong>a * * * 9 16 -33% 0% 350% 1.0 0.7 0.4 1.7<br />
Philippines 7 * * * 12 -86% 100% 0% 2.4 0.3 0.4 0.4<br />
Indonesia - 6 - * 9 .. -100% .. - 2.0 - 0.6<br />
Angola * * * - 8 0% 100% -100% 0.7 0.7 0.8 -<br />
Other 18 20 33 33 104 11% 65% 0% 6.3 6.6 6.6 6.1<br />
Total 287 302 502 543 1,634 5% 66% 8% 100.0 100.0 100.0 100.0<br />
Origin<br />
No. of applications Ch<strong>an</strong>ge (%) Share (%)<br />
Q1 Q2 Q3 Q4 Total Q2-Q1 Q3-Q2 Q4-Q3 Q1 Q2 Q3 Q4<br />
Pak<strong>is</strong>t<strong>an</strong> 120 127 153 204 604 6% 20% 33% 21.4 18.3 21.4 22.5<br />
My<strong>an</strong>mar 123 191 104 135 553 55% -46% 30% 21.9 27.5 14.5 14.9<br />
Sri L<strong>an</strong>ka 64 65 94 103 326 2% 45% 10% 11.4 9.4 13.1 11.4<br />
Nepal 37 78 70 79 264 111% -10% 13% 6.6 11.2 9.8 8.7<br />
Turkey 68 36 55 76 235 -47% 53% 38% 12.1 5.2 7.7 8.4<br />
B<strong>an</strong>gladesh 16 28 54 38 136 75% 93% -30% 2.8 4.0 7.6 4.2<br />
Ug<strong>an</strong>da 9 16 22 61 108 78% 38% 177% 1.6 2.3 3.1 6.7<br />
Nigeria 19 11 19 41 90 -42% 73% 116% 3.4 1.6 2.7 4.5<br />
India 6 11 27 22 66 83% 145% -19% 1.1 1.6 3.8 2.4<br />
Afgh<strong>an</strong><strong>is</strong>t<strong>an</strong> 13 15 26 10 64 15% 73% -62% 2.3 2.2 3.6 1.1<br />
Cameroon * 7 24 21 54 250% 243% -13% 0.4 1.0 3.4 2.3<br />
Islamic Rep. of Ir<strong>an</strong> 16 7 15 11 49 -56% 114% -27% 2.8 1.0 2.1 1.2<br />
Côte d’Ivoire * 27 * 9 41 575% -96% 800% 0.7 3.9 0.1 1.0<br />
Kyrgyzst<strong>an</strong> * 17 * 6 29 750% -76% 50% 0.4 2.4 0.6 0.7<br />
China 9 9 5 5 28 0% -44% 0% 1.6 1.3 0.7 0.6<br />
Liberia * 6 5 9 22 200% -17% 80% 0.4 0.9 0.7 1.0<br />
Ethiopia 8 * 6 * 17 -88% 500% -67% 1.4 0.1 0.8 0.2<br />
Philippines 8 * 5 * 16 -88% 400% -60% 1.4 0.1 0.7 0.2<br />
Gh<strong>an</strong>a * * * 8 15 -33% 0% 300% 0.5 0.3 0.3 0.9<br />
Guinea * * * 6 14 -67% 300% 50% 0.5 0.1 0.6 0.7<br />
Other 30 38 20 59 147 27% -47% 195% 5.3 5.5 2.8 6.5<br />
Total 562 694 715 907 2,878 23% 3% 27% 100.0 100.0 100.0 100.0<br />
38 Asylum Levels <strong>an</strong>d Trends in Industrialized Countries - 2011 Asylum Levels <strong>an</strong>d Trends in Industrialized Countries - 2011<br />
39
TABLE 21 Asylum applications lodged in 44 industrialized countries by origin | fourth quarter 2011<br />
Covering all 44 <strong>asylum</strong> countries which provided monthly data to UNHCR. See notes in Annex Table 1.<br />
Top-20 r<strong>an</strong>king of countries based on applications lodged in all countries. An aster<strong>is</strong>k (*) denotes between 1 <strong>an</strong>d 4 applications.<br />
TABLE 21<br />
Asylum applications lodged in 44 industrialized countries by origin | fourth quarter 2011 (ctnd)<br />
Covering all 44 <strong>asylum</strong> countries which provided monthly data to UNHCR. See notes in Annex Table 1.<br />
Top-20 r<strong>an</strong>king of countries based on applications lodged in all countries. An aster<strong>is</strong>k (*) denotes between 1 <strong>an</strong>d 4 applications.<br />
Origin Alb<strong>an</strong>ia Australia Austria Belgium<br />
Bosnia<br />
<strong>an</strong>d H. Bulgaria C<strong>an</strong>ada Croatia Cyprus Czech Rep. Denmark Estonia Finl<strong>an</strong>d Fr<strong>an</strong>ce Germ<strong>an</strong>y<br />
Afgh<strong>an</strong><strong>is</strong>t<strong>an</strong> - 882 1,183 612 - 16 102 186 9 16 226 - 48 162 1,671<br />
Iraq - 154 105 517 - 97 42 * * * 31 - 151 58 1,336<br />
Serbia (<strong>an</strong>d Kosovo:<br />
S/RES/1244 (1999))<br />
- - 120 470 * - 48 * - - 114 - 80 548 2,757<br />
China - 339 64 78 - * 490 - 8 * * - * 583 73<br />
Islamic Rep. of Ir<strong>an</strong> - 720 169 109 * 6 89 21 17 * 127 - 34 51 991<br />
Pak<strong>is</strong>t<strong>an</strong> - 284 283 265 - * 268 8 35 * 19 - * 435 1,142<br />
Russi<strong>an</strong> Federation - * 584 471 - * 118 7 7 6 103 - 70 1,119 475<br />
Somalia * * 187 156 * 12 125 32 - - 48 * 109 238 264<br />
Syri<strong>an</strong> Arab Rep. - 34 155 139 - 14 67 * 85 * 154 - 51 61 710<br />
Nigeria - 25 94 41 - * 190 * 5 * 21 - 22 212 183<br />
Mexico - - * - - - 164 - - - - - - - -<br />
Eritrea - - 10 10 - - 20 7 - - 5 - * 254 152<br />
Sri L<strong>an</strong>ka - 142 * 27 - - 156 - 22 - 9 - 5 756 142<br />
Georgia - 5 78 94 - * * - * * 8 - 27 515 169<br />
Turkey - 17 78 145 - * 109 * * * 9 - 13 547 397<br />
Hungary - - - - - - 1,837 - - - - - - - -<br />
B<strong>an</strong>gladesh - 42 32 218 - * 26 * 51 - 7 - * 769 42<br />
dem. Rep. of<br />
the Congo<br />
- * 15 338 - - 76 - - - 7 - 11 1,010 45<br />
India - 217 100 40 - - 223 - 22 * * - 5 5 190<br />
Armenia - * 67 102 - 5 11 - * * 19 * * 994 72<br />
Origin Greece Hungary Icel<strong>an</strong>d Irel<strong>an</strong>d Italy (1) Jap<strong>an</strong> (2) Latvia<br />
Afgh<strong>an</strong><strong>is</strong>t<strong>an</strong> 246 179 * 19 236 * * - 13 - - - 453 * 255<br />
Iraq 83 24 * * 79 * * - - 11 - * 314 * 60<br />
Serbia (<strong>an</strong>d Kosovo:<br />
S/RES/1244(1999))<br />
* 57 - * 44 - - - - 293 - - 37 - 68<br />
China 67 * - 10 5 * - * - - - - 67 * 21<br />
Islamic Rep. of Ir<strong>an</strong> 111 11 * * 45 11 * * - 15 - * 240 5 84<br />
Pak<strong>is</strong>t<strong>an</strong> 486 62 * 39 283 60 - - - - - - 46 * 16<br />
Russi<strong>an</strong> Federation 17 * * - - - * - 28 9 - - 173 - 101<br />
Somalia 34 55 * 6 37 - - - - - 43 - 238 - 536<br />
Syri<strong>an</strong> Arab Rep. 75 49 - 5 59 * 6 - - * 107 * 66 - 76<br />
Nigeria 95 6 * 37 538 20 - - * * * - 21 * 63<br />
Mexico - - - * * * - - - - - - - - -<br />
Eritrea * * - * 33 - - - - * * - 116 - 235<br />
Sri L<strong>an</strong>ka 22 - - - 11 36 - - - * - - 36 7 13<br />
Georgia 252 5 * * * - 19 * 83 - - * 44 - 7<br />
Turkey 8 8 - - 124 76 - - - 5 - - 17 * 9<br />
Hungary - - - - - - - - - - - - - * 6<br />
B<strong>an</strong>gladesh 94 * * 7 92 26 - - - - - - * 6 35<br />
dem. Rep. of<br />
the Congo<br />
- 5 - 21 7 * 18 - * - - - 8 - 12<br />
India 59 6 - * * 14 - - - - - - 6 * 6<br />
Armenia 15 * - * * - - * 10 - - - 112 - -<br />
Lithu<strong>an</strong>ia<br />
Malta<br />
Liechtenstein<br />
Luxembourg<br />
Montenegro<br />
Netherl<strong>an</strong>ds<br />
New<br />
Zeal<strong>an</strong>d<br />
Norway<br />
Origin Pol<strong>an</strong>d Portugal Rep. of Korea Rom<strong>an</strong>ia Serbia (3) Slovakia Slovenia Spain Sweden Switzerl<strong>an</strong>d<br />
TfYR<br />
Macedonia (4) Turkey<br />
United<br />
Kingdom<br />
United<br />
States (5)<br />
Afgh<strong>an</strong><strong>is</strong>t<strong>an</strong> - * 8 40 322 44 9 * 1,312 253 89 741 405 65<br />
Iraq * * * 11 - - * 8 346 94 - 3,848 85 96<br />
Serbia (<strong>an</strong>d Kosovo:<br />
S/RES/1244(1999))<br />
- - - - - - * - 1,935 873 - - 5 54<br />
China * - * 7 - * - - 27 203 - 16 230 3,925<br />
Islamic Rep. of Ir<strong>an</strong> * * - * * * * 15 293 101 * 1,512 925 175<br />
Pak<strong>is</strong>t<strong>an</strong> * 6 144 84 49 * * 30 54 26 20 11 1,225 141<br />
Russi<strong>an</strong> Federation 867 - * * - 7 - 13 228 47 - - 25 163<br />
Somalia - 15 - 21 144 22 11 8 1,473 153 36 245 175 45<br />
Syri<strong>an</strong> Arab Rep. - - - 12 * 5 7 15 222 250 - * 205 115<br />
Nigeria * 10 21 * * - * 78 77 439 - 7 250 58<br />
Mexico - - - - - - - - * * - - 5 2,257<br />
Eritrea - - - - - - - * 439 757 - 5 165 104<br />
Sri L<strong>an</strong>ka * * 67 - - - - 7 5 125 - * 565 60<br />
Georgia 371 * - * - 17 - * 96 81 - - 10 15<br />
Turkey * - - 5 * - 25 5 30 150 - - 55 23<br />
Hungary - - - - - - - - - 5 - - - 6<br />
B<strong>an</strong>gladesh - * 12 5 12 * - * 38 7 - - 220 66<br />
dem. Rep. of<br />
the Congo<br />
- * * - * * - 17 30 30 - 33 45 22<br />
India * - 8 9 7 - - 9 8 5 - - 165 540<br />
Armenia 59 - - * - * - 9 67 20 - - - 30<br />
1 Th<strong>is</strong> table excludes a signific<strong>an</strong>t number of <strong>asylum</strong> applications lodged in Italy due to lack of data.<br />
2 UNHCR estimates.<br />
3 Serbia (<strong>an</strong>d Kosovo: S/RES/1244 (1999)).<br />
4 The former Yugoslav Republic of Macedonia.<br />
5 Combination of number of cases (DHS) <strong>an</strong>d persons (EOIR).<br />
…/…<br />
40 Asylum Levels <strong>an</strong>d Trends in Industrialized Countries - 2011 Asylum Levels <strong>an</strong>d Trends in Industrialized Countries - 2011<br />
41
TABLE 22 Top-10 populations of origin of <strong>asylum</strong> applic<strong>an</strong>ts by country of <strong>asylum</strong> | 2010<br />
Covering 44 industrialized countries which provided monthly data to UNHCR. See notes in Annex Table 1.<br />
An aster<strong>is</strong>k (*) denotes between 1 <strong>an</strong>d 4 applications.<br />
TABLE 22<br />
Top-10 populations of origin of <strong>asylum</strong> applic<strong>an</strong>ts by country of <strong>asylum</strong> | 2010 (ctnd)<br />
Covering 44 industrialized countries which provided monthly data to UNHCR. See notes in Annex Table 1.<br />
An aster<strong>is</strong>k (*) denotes between 1 <strong>an</strong>d 4 applications.<br />
Alb<strong>an</strong>ia Australia Austria Belgium Bosnia <strong>an</strong>d Herzegovina<br />
Serbia (1) * Afgh<strong>an</strong><strong>is</strong>t<strong>an</strong> 3,129 Russi<strong>an</strong> Fed. 2,322 Serbia (1) 4,545 Afgh<strong>an</strong><strong>is</strong>t<strong>an</strong> 11<br />
Iraq * Islamic Rep. of Ir<strong>an</strong> 1,354 Afgh<strong>an</strong><strong>is</strong>t<strong>an</strong> 1,582 Iraq 1,637 Serbia (1) 10<br />
Islamic Rep. of Ir<strong>an</strong> * China 1,191 Serbia (1) 972 Guinea 1,455 Islamic Rep. of Ir<strong>an</strong> *<br />
TfYR Macedonia (2) * Stateless 1,035 Nigeria 573 Armenia 1,266 Iraq *<br />
Bosnia-Herzegovina * Iraq 856 India 433 Russi<strong>an</strong> Fed. 1,141 Cameroon *<br />
Egypt * Sri L<strong>an</strong>ka 796 Islamic Rep. of Ir<strong>an</strong> 387 Afgh<strong>an</strong><strong>is</strong>t<strong>an</strong> 1,124 Ethiopia *<br />
Tun<strong>is</strong>ia * Fiji 547 Georgia 370 Rw<strong>an</strong>da 1,065 Pak<strong>is</strong>t<strong>an</strong> *<br />
Libya * Pak<strong>is</strong>t<strong>an</strong> 470 Turkey 369 TfYR Macedonia (2) 980 Syri<strong>an</strong> Arab Rep. *<br />
Saudi Arabia * India 412 Iraq 336 dem. Rep. of Congo 813 Algeria *<br />
Egypt 328 Algeria 304 Madagascar 653 Eritrea *<br />
Bulgaria C<strong>an</strong>ada Croatia Cyprus Czech Republic<br />
Iraq 452 Hungary 2,321 Afgh<strong>an</strong><strong>is</strong>t<strong>an</strong> 107 Iraq 343 Ukraine 64<br />
Stateless 100 China 1,582 Occup. Palest. Territ. 48 India 318 Mongolia 44<br />
Armenia 62 Colombia 1,354 Islamic Rep. of Ir<strong>an</strong> 21 Viet Nam 227 My<strong>an</strong>mar 42<br />
Islamic Rep. of Ir<strong>an</strong> 61 Sri L<strong>an</strong>ka 1,203 Bosnia-Herzegovina 13 Egypt 211 Russi<strong>an</strong> Fed. 36<br />
Afgh<strong>an</strong><strong>is</strong>t<strong>an</strong> 58 Mexico 1,198 Western Sahara 13 Sri L<strong>an</strong>ka 187 Viet Nam 26<br />
Syri<strong>an</strong> Arab Rep. 52 Haiti 1,061 Somalia 11 Pak<strong>is</strong>t<strong>an</strong> 155 Belarus 26<br />
Algeria 35 Nigeria 860 Serbia (1) 11 B<strong>an</strong>gladesh 148 Nigeria 25<br />
Sud<strong>an</strong> 20 United States 767 Algeria 10 Nigeria 133 Stateless 21<br />
Pak<strong>is</strong>t<strong>an</strong> 17<br />
St Vincent &<br />
the Grenadines<br />
689 Iraq 9 China 123 Kyrgyzst<strong>an</strong> 18<br />
Georgia 14 India 593 Pak<strong>is</strong>t<strong>an</strong> 5 Nepal 121 Turkey 17<br />
Denmark Estonia Finl<strong>an</strong>d Fr<strong>an</strong>ce Germ<strong>an</strong>y<br />
Afgh<strong>an</strong><strong>is</strong>t<strong>an</strong> 1,476 Afgh<strong>an</strong><strong>is</strong>t<strong>an</strong> 9 Iraq 575 Serbia (1) 5,754 Serbia (1) 6,546<br />
Syri<strong>an</strong> Arab Rep. 821 Russi<strong>an</strong> Fed. 7 Somalia 571 Russi<strong>an</strong> Fed. 4,302 Afgh<strong>an</strong><strong>is</strong>t<strong>an</strong> 5,905<br />
Islamic Rep. of Ir<strong>an</strong> 597 Sri L<strong>an</strong>ka * Bulgaria 485 dem. Rep. of Congo 3,395 Iraq 5,555<br />
Serbia (1) 402 Nigeria * Russi<strong>an</strong> Fed. 436 B<strong>an</strong>gladesh 3,140 Islamic Rep. of Ir<strong>an</strong> 2,475<br />
Russi<strong>an</strong> Fed. 340 Belarus * Serbia (1) 325 Sri L<strong>an</strong>ka 2,827 TfYR Macedonia (2) 2,466<br />
Iraq 237 Stateless * Afgh<strong>an</strong><strong>is</strong>t<strong>an</strong> 265 Guinea 2,012 Somalia 2,235<br />
Somalia 110 Turkey * Islamic Rep. of Ir<strong>an</strong> 142 Haiti 1,992 Syri<strong>an</strong> Arab Rep. 1,490<br />
Occup. Palest. Territ. 106 Sud<strong>an</strong> * Turkey 117 China 1,933 Turkey 1,340<br />
Turkey 51 Armenia * Rom<strong>an</strong>ia 94 Armenia 1,766 Russi<strong>an</strong> Fed. 1,199<br />
India 48 Pak<strong>is</strong>t<strong>an</strong> * Nigeria 84 Turkey 1,402 Viet Nam 1,009<br />
Greece Hungary Icel<strong>an</strong>d Irel<strong>an</strong>d Italy<br />
Pak<strong>is</strong>t<strong>an</strong> 2,748 Afgh<strong>an</strong><strong>is</strong>t<strong>an</strong> 796 Afgh<strong>an</strong><strong>is</strong>t<strong>an</strong> 7 Nigeria 387 Nigeria 1,385<br />
Georgia 1,162 Serbia (1) 637 Islamic Rep. of Ir<strong>an</strong> 6 China 228 Pak<strong>is</strong>t<strong>an</strong> 929<br />
B<strong>an</strong>gladesh 987 Occup. Palest. Territ. 209 Iraq 5 Pak<strong>is</strong>t<strong>an</strong> 200 Afgh<strong>an</strong><strong>is</strong>t<strong>an</strong> 873<br />
Alb<strong>an</strong>ia 693 Turkey 95 Somalia 5 dem. Rep. of Congo 70 Turkey 854<br />
China 549 Georgia 76 TfYR Macedonia (2) * Afgh<strong>an</strong><strong>is</strong>t<strong>an</strong> 69 Bosnia-Herzegovina 816<br />
Afgh<strong>an</strong><strong>is</strong>t<strong>an</strong> 524 Islamic Rep. of Ir<strong>an</strong> 72 Spain * Gh<strong>an</strong>a 57 Serbia (1) 795<br />
Nigeria 393 Iraq 55 Nigeria * Rep. of Moldova 56 Iraq 380<br />
India 381 Somalia 53 Syri<strong>an</strong> Arab Rep. * Cameroon 56 Gh<strong>an</strong>a 278<br />
Senegal 381 Nigeria 42 Rep. of Moldova * Georgia 53 Islamic Rep. of Ir<strong>an</strong> 269<br />
Iraq 342 Viet Nam 42 Nepal * South Africa 53 Côte d’Ivoire 235<br />
Jap<strong>an</strong> Latvia Liechtenstein Lithu<strong>an</strong>ia Luxembourg<br />
My<strong>an</strong>mar 345 Afgh<strong>an</strong><strong>is</strong>t<strong>an</strong> 23 TfYR Macedonia (2) 38 Georgia 235 Serbia (1) 301<br />
Sri L<strong>an</strong>ka 173 Russi<strong>an</strong> Fed. 7 Russi<strong>an</strong> Fed. 32 Russi<strong>an</strong> Fed. 40 Iraq 79<br />
Turkey 127 Kyrgyzst<strong>an</strong> 7 Nigeria 11 Afgh<strong>an</strong><strong>is</strong>t<strong>an</strong> 26 Algeria 43<br />
Nepal 110 dem. Rep. of Congo * Serbia (1) 6 Armenia 21 Islamic Rep. of Ir<strong>an</strong> 31<br />
Pak<strong>is</strong>t<strong>an</strong> 83 Gh<strong>an</strong>a * Belarus * Viet Nam 10 Somalia 29<br />
India 82 Cameroon * Iraq * Belarus 9 Russi<strong>an</strong> Fed. 25<br />
Islamic Rep. of Ir<strong>an</strong> 35 Belarus * Somalia * Tajik<strong>is</strong>t<strong>an</strong> 5 Alb<strong>an</strong>ia 23<br />
Nigeria 34 Uzbek<strong>is</strong>t<strong>an</strong> * Uzbek<strong>is</strong>t<strong>an</strong> * Azerbaij<strong>an</strong> * Syri<strong>an</strong> Arab Rep. 19<br />
B<strong>an</strong>gladesh 27 Nepal * Egypt * Kyrgyzst<strong>an</strong> * Turkey 19<br />
Ug<strong>an</strong>da 21 Islamic Rep. of Ir<strong>an</strong> * Syri<strong>an</strong> Arab Rep. * Rep. of Moldova * Belarus 15<br />
Malta Montenegro Netherl<strong>an</strong>ds New Zeal<strong>an</strong>d Norway<br />
Somalia 34 Algeria * Somalia 3,372 Fiji 65 Eritrea 1,711<br />
Pak<strong>is</strong>t<strong>an</strong> 16 Russi<strong>an</strong> Fed. * Iraq 1,383 Islamic Rep. of Ir<strong>an</strong> 42 Somalia 1,397<br />
Syri<strong>an</strong> Arab Rep. 8 Turkey * Afgh<strong>an</strong><strong>is</strong>t<strong>an</strong> 1,364 Sri L<strong>an</strong>ka 23 Afgh<strong>an</strong><strong>is</strong>t<strong>an</strong> 979<br />
Nigeria 8 Croatia * Islamic Rep. of Ir<strong>an</strong> 785 China 22 Russi<strong>an</strong> Fed. 628<br />
Iraq 7 Armenia 611 South Africa 19 Ethiopia 505<br />
Ethiopia 7 Georgia 587 Saudi Arabia 15 Iraq 460<br />
Libya 7 Eritrea 392 Czech Rep. 14 Stateless 448<br />
Eritrea 6 TfYR Macedonia (2) 389 Iraq 10 Serbia (1) 444<br />
Sud<strong>an</strong> 6 China 302 Zimbabwe 8 Islamic Rep. of Ir<strong>an</strong> 429<br />
Morocco 5 Guinea 230 Pak<strong>is</strong>t<strong>an</strong> 7 Nigeria 354<br />
Pol<strong>an</strong>d Portugal Rep. of Korea Rom<strong>an</strong>ia Serbia (1)<br />
Russi<strong>an</strong> Fed. 4,796 Guinea 43 Pak<strong>is</strong>t<strong>an</strong> 129 Afgh<strong>an</strong><strong>is</strong>t<strong>an</strong> 120 Afgh<strong>an</strong><strong>is</strong>t<strong>an</strong> 425<br />
Georgia 1,083 Colombia 16 Kyrgyzst<strong>an</strong> 77 Rep. of Moldova 109 Occup. Palest. Territ. 138<br />
Armenia 107 Angola 12 B<strong>an</strong>gladesh 41 Iraq 75 Iraq 53<br />
Viet Nam 47 Guinea-B<strong>is</strong>sau 10 My<strong>an</strong>mar 34 Turkey 68 Somalia 42<br />
Belarus 46 dem. Rep. of Congo 9 Nigeria 19 China 67 Pak<strong>is</strong>t<strong>an</strong> 30<br />
Ukraine 45 Nigeria 7 Afgh<strong>an</strong><strong>is</strong>t<strong>an</strong> 15 Pak<strong>is</strong>t<strong>an</strong> 62 dem. Rep. of Congo 13<br />
Kyrgyzst<strong>an</strong> 37 Sierra Leone 7 Ug<strong>an</strong>da 12 Islamic Rep. of Ir<strong>an</strong> 35 Islamic Rep. of Ir<strong>an</strong> 12<br />
Iraq 27 Islamic Rep. of Ir<strong>an</strong> 6 Cameroon 11 Nigeria 22 Morocco 10<br />
Pak<strong>is</strong>t<strong>an</strong> 27 Russi<strong>an</strong> Fed. 5 dem. Rep. of Congo 9 My<strong>an</strong>mar 21 Tun<strong>is</strong>ia 10<br />
Afgh<strong>an</strong><strong>is</strong>t<strong>an</strong> 25 Georgia * China 7 Syri<strong>an</strong> Arab Rep. 19 Algeria 9<br />
Slovakia Slovenia Spain Sweden Switzerl<strong>an</strong>d<br />
Afgh<strong>an</strong><strong>is</strong>t<strong>an</strong> 76 Serbia (1) 28 Cuba 406 Serbia (1) 7,907 Sri L<strong>an</strong>ka 892<br />
Georgia 66 Turkey 27 Nigeria 237 Somalia 5,560 Afgh<strong>an</strong><strong>is</strong>t<strong>an</strong> 632<br />
Russi<strong>an</strong> Fed. 65 Bosnia-Herzegovina 24 Algeria 175 Afgh<strong>an</strong><strong>is</strong>t<strong>an</strong> 2,397 Georgia 531<br />
Rep. of Moldova 41 Afgh<strong>an</strong><strong>is</strong>t<strong>an</strong> 23 Guinea 166 Iraq 1,978 Iraq 501<br />
India 38 Nigeria 11 Cameroon 155 Eritrea 1,444 Turkey 462<br />
China 35 Occup. Palest. Territ. 10 Colombia 123 Islamic Rep. of Ir<strong>an</strong> 1,183 TfYR Macedonia (2) 403<br />
Pak<strong>is</strong>t<strong>an</strong> 34 Islamic Rep. of Ir<strong>an</strong> 9 Côte d’Ivoire 119 Stateless 1,026 Syri<strong>an</strong> Arab Rep. 387<br />
Viet Nam 32 Russi<strong>an</strong> Fed. 8 Morocco 116 Russi<strong>an</strong> Fed. 987 China 333<br />
Somalia 23 Somalia 8 Occup. Palest. Territ. 101 TfYR Macedonia (2) 908 Russi<strong>an</strong> Fed. 315<br />
Ukraine 21 Sud<strong>an</strong> 8 dem. Rep. of Congo 88 Mongolia 727 Algeria 313<br />
TfYR Macedonia (2) Turkey United Kingdom United States (3)<br />
Somalia 18 Somalia 448 Afgh<strong>an</strong><strong>is</strong>t<strong>an</strong> 1,835 China 12,850<br />
Eritrea 5 Kyrgyzst<strong>an</strong> 246 Sri L<strong>an</strong>ka 1,625 Mexico 4,225<br />
Serbia (1) * Uzbek<strong>is</strong>t<strong>an</strong> 101 China 1,215 El Salvador 2,703<br />
Bosnia-Herzegovina * dem. Rep. of Congo 66 Nigeria 1,100 Guatemala 2,235<br />
Iraq * Occup. Palest. Territ. 64 Eritrea 760 Ethiopia 1,163<br />
Russi<strong>an</strong> Fed. * Sud<strong>an</strong> 48 Somalia 675 Haiti 1,074<br />
Algeria * Pak<strong>is</strong>t<strong>an</strong> 42 Sud<strong>an</strong> 640 Nepal 1,063<br />
Islamic Rep. of Ir<strong>an</strong> * Syri<strong>an</strong> Arab Rep. 37 India 600 Honduras 1,036<br />
Morocco * Tajik<strong>is</strong>t<strong>an</strong> 37 B<strong>an</strong>gladesh 495 Russi<strong>an</strong> Fed. 817<br />
Syri<strong>an</strong> Arab Rep. * Ethiopia 36 Iraq 475 India 720<br />
1 Serbia (<strong>an</strong>d Kosovo: S/RES/1244 (1999)).<br />
2 The former Yugoslav Republic of Macedonia.<br />
3 Combination of cases (DHS) <strong>an</strong>d persons (EOIR).<br />
…/…<br />
42 Asylum Levels <strong>an</strong>d Trends in Industrialized Countries - 2011 Asylum Levels <strong>an</strong>d Trends in Industrialized Countries - 2011<br />
43
TABLE 23 Top-10 populations of origin of <strong>asylum</strong> applic<strong>an</strong>ts by country of <strong>asylum</strong> | 2011<br />
Covering 44 industrialized countries which provided monthly data to UNHCR.<br />
An aster<strong>is</strong>k (*) denotes between 1 <strong>an</strong>d 4 applications.<br />
TABLE 23<br />
Top-10 populations of origin of <strong>asylum</strong> applic<strong>an</strong>ts by country of <strong>asylum</strong> | 2011 (ctnd)<br />
Covering 44 industrialized countries which provided monthly data to UNHCR.<br />
An aster<strong>is</strong>k (*) denotes between 1 <strong>an</strong>d 4 applications.<br />
Alb<strong>an</strong>ia Australia Austria Belgium Bosnia <strong>an</strong>d Herzegovina<br />
Serbia (1) 8 Islamic Rep. of Ir<strong>an</strong> 2,156 Afgh<strong>an</strong><strong>is</strong>t<strong>an</strong> 3,623 Serbia (1) 3,067 Algeria 9<br />
Somalia * Afgh<strong>an</strong><strong>is</strong>t<strong>an</strong> 1,721 Russi<strong>an</strong> Fed. 2,319 Afgh<strong>an</strong><strong>is</strong>t<strong>an</strong> 2,773 Serbia (1) 8<br />
Iraq * China 1,188 Pak<strong>is</strong>t<strong>an</strong> 952 Guinea 2,046 Morocco 6<br />
China * Pak<strong>is</strong>t<strong>an</strong> 817 Somalia 611 Iraq 2,004 Pak<strong>is</strong>t<strong>an</strong> *<br />
Pak<strong>is</strong>t<strong>an</strong> * India 765 Serbia (1) 541 Russi<strong>an</strong> Fed. 1,747 Occup. Palest. Territ. *<br />
B<strong>an</strong>gladesh * Stateless 530 Iraq 484 Alb<strong>an</strong>ia 1,152 Islamic Rep. of Ir<strong>an</strong> *<br />
Algeria * Iraq 491 India 463 TfYR Macedonia (2) 1,117 Afgh<strong>an</strong><strong>is</strong>t<strong>an</strong> *<br />
Egypt 417 Islamic Rep. of Ir<strong>an</strong> 457 dem. Rep. of Congo 1,084 Cameroon *<br />
Sri L<strong>an</strong>ka 370 Algeria 446 Pak<strong>is</strong>t<strong>an</strong> 924 Tun<strong>is</strong>ia *<br />
Fiji 276 Syri<strong>an</strong> Arab Rep. 423 Armenia 556 Somalia *<br />
Bulgaria C<strong>an</strong>ada Croatia Cyprus Czech Republic<br />
Iraq 344 Hungary 4,409 Afgh<strong>an</strong><strong>is</strong>t<strong>an</strong> 487 Viet Nam 212 Ukraine 101<br />
Afgh<strong>an</strong><strong>is</strong>t<strong>an</strong> 92 China 1,853 Pak<strong>is</strong>t<strong>an</strong> 70 Syri<strong>an</strong> Arab Rep. 187 Belarus 38<br />
Syri<strong>an</strong> Arab Rep. 85 Colombia 892 Somalia 42 Egypt 184 Viet Nam 27<br />
Stateless 66 Namibia 831 Islamic Rep. of Ir<strong>an</strong> 40 B<strong>an</strong>gladesh 182 Afgh<strong>an</strong><strong>is</strong>t<strong>an</strong> 25<br />
Somalia 42 Pak<strong>is</strong>t<strong>an</strong> 828 Occup. Palest. Territ. 19 Pak<strong>is</strong>t<strong>an</strong> 148 Russi<strong>an</strong> Fed. 25<br />
Islamic Rep. of Ir<strong>an</strong> 37 India 751 Russi<strong>an</strong> Fed. 15 India 134 Uzbek<strong>is</strong>t<strong>an</strong> 24<br />
Armenia 37 Nigeria 685 Libya 14 Sri L<strong>an</strong>ka 114 My<strong>an</strong>mar 23<br />
Pak<strong>is</strong>t<strong>an</strong> 27<br />
St Vincent &<br />
the Grenadines<br />
654 Tun<strong>is</strong>ia 14 Nepal 102 Kyrgyzst<strong>an</strong> 21<br />
Algeria 23 Mexico 653 Morocco 13 Philippines 84 Cuba 20<br />
Morocco 20 Sri L<strong>an</strong>ka 629 Turkey 9 Islamic Rep. of Ir<strong>an</strong> 68 Turkey 17<br />
Denmark Estonia Finl<strong>an</strong>d Fr<strong>an</strong>ce Germ<strong>an</strong>y<br />
Afgh<strong>an</strong><strong>is</strong>t<strong>an</strong> 903 dem. Rep. of Congo 11 Iraq 588 Russi<strong>an</strong> Fed. 4,042 Afgh<strong>an</strong><strong>is</strong>t<strong>an</strong> 7,767<br />
Islamic Rep. of Ir<strong>an</strong> 461 Afgh<strong>an</strong><strong>is</strong>t<strong>an</strong> 8 Somalia 365 dem. Rep. of Congo 3,804 Serbia (1) 5,974<br />
Syri<strong>an</strong> Arab Rep. 428 Armenia 7 Russi<strong>an</strong> Fed. 294 Armenia 3,638 Iraq 5,831<br />
Serbia (1) 325 Georgia 6 Afgh<strong>an</strong><strong>is</strong>t<strong>an</strong> 292 B<strong>an</strong>gladesh 3,568 Islamic Rep. of Ir<strong>an</strong> 3,352<br />
Russi<strong>an</strong> Fed. 304 Russi<strong>an</strong> Fed. * Serbia (1) 160 Serbia (1) 3,458 Syri<strong>an</strong> Arab Rep. 2,634<br />
Iraq 115 Belarus * Islamic Rep. of Ir<strong>an</strong> 125 Sri L<strong>an</strong>ka 3,183 Pak<strong>is</strong>t<strong>an</strong> 2,539<br />
Somalia 107 Somalia * Syri<strong>an</strong> Arab Rep. 109 China 2,184 Russi<strong>an</strong> Fed. 1,689<br />
Algeria 103 Libya * Nigeria 105 Guinea 2,017 Turkey 1,578<br />
Occup. Palest. Territ. 68 Stateless * Belarus 83 Haiti 2,010 TfYR Macedonia (2) 1,131<br />
Libya 67 Cameroon * Turkey 74 Turkey 1,737 Somalia 984<br />
Greece Hungary Icel<strong>an</strong>d Irel<strong>an</strong>d Italy<br />
Pak<strong>is</strong>t<strong>an</strong> 2,309 Afgh<strong>an</strong><strong>is</strong>t<strong>an</strong> 649 Russi<strong>an</strong> Fed. 7 Nigeria 182 Unknown 16,008<br />
Georgia 1,121 Serbia (1) 238 Nigeria 6 Pak<strong>is</strong>t<strong>an</strong> 175 Tun<strong>is</strong>ia 3,531<br />
Afgh<strong>an</strong><strong>is</strong>t<strong>an</strong> 637 Pak<strong>is</strong>t<strong>an</strong> 121 Algeria 5 China 142 Nigeria 2,876<br />
B<strong>an</strong>gladesh 615 Syri<strong>an</strong> Arab Rep. 91 Iraq 5 dem. Rep. of Congo 70 Gh<strong>an</strong>a 1,263<br />
China 406 Somalia 61 Georgia * Afgh<strong>an</strong><strong>is</strong>t<strong>an</strong> 67 Pak<strong>is</strong>t<strong>an</strong> 1,150<br />
Senegal 375 Algeria 56 India * Zimbabwe 67 Mali 1,001<br />
Nigeria 362 Iraq 54 Ethiopia * Algeria 48 Côte d’Ivoire 935<br />
Syri<strong>an</strong> Arab Rep. 352 Occup. Palest. Territ. 36 Belarus * South Africa 45 Afgh<strong>an</strong><strong>is</strong>t<strong>an</strong> 880<br />
Egypt 306 Islamic Rep. of Ir<strong>an</strong> 33 Afgh<strong>an</strong><strong>is</strong>t<strong>an</strong> * Alb<strong>an</strong>ia 34 B<strong>an</strong>gladesh 734<br />
Alb<strong>an</strong>ia 276 Morocco 30 Islamic Rep. of Ir<strong>an</strong> * Rep. of Moldova 28 Somalia 513<br />
Jap<strong>an</strong> (3) Latvia Liechtenstein Lithu<strong>an</strong>ia Luxembourg<br />
My<strong>an</strong>mar 489 Georgia 176 Serbia (1) 31 Georgia 202 Serbia (1) 1,097<br />
Nepal 250 dem. Rep. of Congo 39 Russi<strong>an</strong> Fed. 14 Russi<strong>an</strong> Fed. 58 TfYR Macedonia (2) 446<br />
Turkey 235 Russi<strong>an</strong> Fed. 18 Islamic Rep. of Ir<strong>an</strong> * Afgh<strong>an</strong><strong>is</strong>t<strong>an</strong> 45 Montenegro 103<br />
Sri L<strong>an</strong>ka 226 Islamic Rep. of Ir<strong>an</strong> 16 Afgh<strong>an</strong><strong>is</strong>t<strong>an</strong> * Kyrgyzst<strong>an</strong> 30 Bosnia-Herzegovina 51<br />
Pak<strong>is</strong>t<strong>an</strong> 170 Syri<strong>an</strong> Arab Rep. 16 Nigeria * Armenia 28 Russi<strong>an</strong> Fed. 49<br />
B<strong>an</strong>gladesh 98 Cameroon 10 Kyrgyzst<strong>an</strong> * Belarus 12 Iraq 43<br />
Nigeria 51 Leb<strong>an</strong>on 10 Georgia * Uzbek<strong>is</strong>t<strong>an</strong> 7 Tun<strong>is</strong>ia 42<br />
India 51 Turkey 5 Stateless * Stateless * Islamic Rep. of Ir<strong>an</strong> 35<br />
Islamic Rep. of Ir<strong>an</strong> 48 Côte d’Ivoire 5 Turkmen<strong>is</strong>t<strong>an</strong> * Tajik<strong>is</strong>t<strong>an</strong> * Algeria 30<br />
Cameroon 48 Libya 5 Armenia * dem. Rep. of Congo * Alb<strong>an</strong>ia 27<br />
Malta Montenegro Netherl<strong>an</strong>ds New Zeal<strong>an</strong>d Norway<br />
Somalia 454 Morocco 84 Afgh<strong>an</strong><strong>is</strong>t<strong>an</strong> 1,885 Islamic Rep. of Ir<strong>an</strong> 29 Somalia 2,216<br />
Eritrea 306 Algeria 65 Iraq 1,435 Fiji 29 Eritrea 1,256<br />
Nigeria 246 Tun<strong>is</strong>ia 31 Somalia 1,415 Pak<strong>is</strong>t<strong>an</strong> 22 Afgh<strong>an</strong><strong>is</strong>t<strong>an</strong> 979<br />
Syri<strong>an</strong> Arab Rep. 122 Occup. Palest. Territ. 21 Islamic Rep. of Ir<strong>an</strong> 929 Bahrain 22 Russi<strong>an</strong> Fed. 365<br />
Ethiopia 113 Afgh<strong>an</strong><strong>is</strong>t<strong>an</strong> 8 Armenia 471 China 20 Iraq 357<br />
Côte d’Ivoire 110 Islamic Rep. of Ir<strong>an</strong> 7 Eritrea 458 Egypt 20 Islamic Rep. of Ir<strong>an</strong> 355<br />
Mali 92 Libya * Russi<strong>an</strong> Fed. 451 Sri L<strong>an</strong>ka 19 Ethiopia 293<br />
Gh<strong>an</strong>a 76 Pak<strong>is</strong>t<strong>an</strong> * China 276 South Africa 14 Stateless 262<br />
Libya 66 Nigeria * TfYR Macedonia (2) 266 Afgh<strong>an</strong><strong>is</strong>t<strong>an</strong> 11 Nigeria 240<br />
Sud<strong>an</strong> 58 Iraq * Belarus 256 Iraq 11 Serbia (1) 240<br />
Pol<strong>an</strong>d Portugal Rep. of Korea Rom<strong>an</strong>ia Serbia (1)<br />
Russi<strong>an</strong> Fed. 2,784 Guinea 46 Pak<strong>is</strong>t<strong>an</strong> 434 Algeria 456 Afgh<strong>an</strong><strong>is</strong>t<strong>an</strong> 1,757<br />
Georgia 1,240 Somalia 26 Sri L<strong>an</strong>ka 100 Morocco 219 Somalia 501<br />
Armenia 162 Nigeria 22 Ug<strong>an</strong>da 78 Tun<strong>is</strong>ia 218 Pak<strong>is</strong>t<strong>an</strong> 356<br />
Belarus 57 Côte d’Ivoire 18 My<strong>an</strong>mar 64 Pak<strong>is</strong>t<strong>an</strong> 144 Libya 145<br />
Ukraine 39 dem. Rep. of Congo 14 Afgh<strong>an</strong><strong>is</strong>t<strong>an</strong> 60 Afgh<strong>an</strong><strong>is</strong>t<strong>an</strong> 107 Occup. Palest. Territ. 129<br />
Kyrgyzst<strong>an</strong> 35 Colombia 13 Nigeria 39 Rep. of Moldova 61 Morocco 95<br />
Afgh<strong>an</strong><strong>is</strong>t<strong>an</strong> 29 Pak<strong>is</strong>t<strong>an</strong> 11 B<strong>an</strong>gladesh 38 Iraq 59 Tun<strong>is</strong>ia 77<br />
Viet Nam 25 Islamic Rep. of Ir<strong>an</strong> 11 Côte d’Ivoire 36 China 47 Algeria 65<br />
Iraq 20 Guinea-B<strong>is</strong>sau 11 Kyrgyzst<strong>an</strong> 28 Occup. Palest. Territ. 43 Islamic Rep. of Ir<strong>an</strong> 37<br />
Kazakhst<strong>an</strong> 17 Russi<strong>an</strong> Fed. 8 Liberia 20 Syri<strong>an</strong> Arab Rep. 36 Syri<strong>an</strong> Arab Rep. 33<br />
Slovakia Slovenia Spain Sweden Switzerl<strong>an</strong>d<br />
Somalia 76 Afgh<strong>an</strong><strong>is</strong>t<strong>an</strong> 57 Côte d’Ivoire 550 Afgh<strong>an</strong><strong>is</strong>t<strong>an</strong> 4,120 Eritrea 3,224<br />
Afgh<strong>an</strong><strong>is</strong>t<strong>an</strong> 73 Turkey 39 Cuba 440 Somalia 3,979 Tun<strong>is</strong>ia 2,324<br />
Georgia 57 Serbia (1) 35 Nigeria 259 Serbia (1) 3,915 Serbia (1) 1,539<br />
Russi<strong>an</strong> Fed. 35 Pak<strong>is</strong>t<strong>an</strong> 26 Guinea 150 Eritrea 1,649 Nigeria 1,303<br />
Rep. of Moldova 33 Tun<strong>is</strong>ia 24 Occup. Palest. Territ. 131 Iraq 1,634 Afgh<strong>an</strong><strong>is</strong>t<strong>an</strong> 1,006<br />
India 19 Somalia 17 Western Sahara 131 Islamic Rep. of Ir<strong>an</strong> 1,118 TfYR Macedonia (2) 838<br />
Viet Nam 17 Syri<strong>an</strong> Arab Rep. 10 Cameroon 129 Stateless 1,105 Syri<strong>an</strong> Arab Rep. 688<br />
Islamic Rep. of Ir<strong>an</strong> 13 Morocco 9 Algeria 122 Bosnia-Herzegovina 981 China 688<br />
China 12 Islamic Rep. of Ir<strong>an</strong> 8 Colombia 104 Russi<strong>an</strong> Fed. 930 Somalia 558<br />
Pak<strong>is</strong>t<strong>an</strong> 11 Algeria 8 Syri<strong>an</strong> Arab Rep. 97 TfYR Macedonia (2) 885 Turkey 508<br />
TfYR Macedonia (2) Turkey United Kingdom United States (4)<br />
Afgh<strong>an</strong><strong>is</strong>t<strong>an</strong> 427 Iraq 7,912 Pak<strong>is</strong>t<strong>an</strong> 3,945 China 15,450<br />
Pak<strong>is</strong>t<strong>an</strong> 172 Islamic Rep. of Ir<strong>an</strong> 3,411 Islamic Rep. of Ir<strong>an</strong> 3,045 Mexico 8,186<br />
Somalia 53 Afgh<strong>an</strong><strong>is</strong>t<strong>an</strong> 2,486 Sri L<strong>an</strong>ka 2,125 El Salvador 4,011<br />
Occup. Palest. Territ. 15 Somalia 744 Afgh<strong>an</strong><strong>is</strong>t<strong>an</strong> 1,525 Guatemala 3,363<br />
Iraq 13 Syri<strong>an</strong> Arab Rep. 188 Libya 1,185 India 2,457<br />
India 11 Kyrgyzst<strong>an</strong> 169 Nigeria 1,055 Honduras 1,528<br />
Islamic Rep. of Ir<strong>an</strong> 10 Occup. Palest. Territ. 157 China 920 Nepal 1,384<br />
Morocco 8 Uzbek<strong>is</strong>t<strong>an</strong> 147 Eritrea 835 Haiti 1,348<br />
Sud<strong>an</strong> 6 dem. Rep. of Congo 76 Sud<strong>an</strong> 790 Egypt 1,131<br />
Serbia (1) 5 Yemen 72 Zimbabwe 735 Ethiopia 1,056<br />
1 Serbia (<strong>an</strong>d Kosovo: S/RES/1244 (1999)).<br />
2 The former Yugoslav Republic of Macedonia.<br />
3 UNHCR estimates.<br />
4 Combination of cases (DHS) <strong>an</strong>d persons (EOIR).<br />
…/…<br />
44 Asylum Levels <strong>an</strong>d Trends in Industrialized Countries - 2011 Asylum Levels <strong>an</strong>d Trends in Industrialized Countries - 2011<br />
45
TABLE 24 Monthly <strong>asylum</strong> applications lodged in 44 industrialized countries | 2011<br />
Covering 44 countries which provided monthly data to UNHCR.<br />
Asylum<br />
country J<strong>an</strong>. Feb. Mar. Apr. May Jun. Jul. Aug. Sep. Oct. Nov. Dec.<br />
Ch<strong>an</strong>ge<br />
Nov-Dec<br />
Alb<strong>an</strong>ia 4 8 - - 1 - 1 2 - - - 1 ..<br />
Australia 1,059 715 849 848 947 537 543 1,000 1,226 1,170 1,349 1,270 -6%<br />
Austria 882 908 967 980 996 1,079 1,499 1,588 1,460 1,570 1,243 1,254 1%<br />
Belgium 1,934 1,931 2,395 2,105 1,876 1,738 1,848 2,339 2,629 2,718 2,272 2,199 -3%<br />
Bosnia <strong>an</strong>d H. 3 2 5 - - 7 5 10 3 3 3 3 0%<br />
Bulgaria 115 91 68 63 62 67 71 87 66 81 79 40 -49%<br />
C<strong>an</strong>ada 1,875 1,936 2,138 1,836 1,815 1,916 1,529 2,127 2,712 2,745 2,622 2,096 -20%<br />
Croatia 38 48 41 31 92 76 64 54 52 85 126 100 -21%<br />
Cyprus 184 147 127 124 163 149 130 121 195 178 166 81 -51%<br />
Czech Rep. 36 32 42 35 40 29 46 40 59 52 52 29 -44%<br />
denmark 365 277 317 286 285 254 256 275 342 402 353 399 13%<br />
Estonia 4 7 4 6 8 5 10 6 9 4 3 1 -67%<br />
Finl<strong>an</strong>d 258 210 244 200 225 237 238 279 327 309 284 274 -4%<br />
Fr<strong>an</strong>ce 4,153 4,323 4,910 4,778 4,618 4,103 4,202 3,680 4,183 4,583 3,921 4,459 14%<br />
Germ<strong>an</strong>y 3,901 3,370 3,625 3,031 3,501 3,255 3,556 4,065 4,190 4,184 4,889 4,174 -15%<br />
Greece 606 920 1,003 453 815 685 989 650 789 742 873 786 -10%<br />
Hungary 117 88 136 164 105 158 106 132 118 168 226 175 -23%<br />
Icel<strong>an</strong>d - 3 6 7 14 2 5 8 8 7 5 8 60%<br />
Irel<strong>an</strong>d 133 125 127 87 100 114 111 113 95 72 117 96 -18%<br />
Italy * 589 1,623 1,775 1,458 3,304 2,111 1,515 1,230 1,439 1,259 984 822 -16%<br />
Jap<strong>an</strong> 110 157 137 198 128 140 165 154 163 187 168 160 -5%<br />
Latvia 3 18 4 16 39 25 59 49 55 28 27 12 -56%<br />
Liechtenstein 9 4 14 9 3 6 1 19 2 3 3 1 -67%<br />
Lithu<strong>an</strong>ia 12 29 25 10 16 17 27 70 39 44 48 69 44%<br />
Luxembourg 116 147 237 147 134 114 158 221 312 219 179 178 -1%<br />
Malta 8 9 28 1,126 367 94 23 15 19 74 32 58 81%<br />
Montenegro 2 9 12 11 18 44 24 21 21 20 18 35 94%<br />
Netherl<strong>an</strong>ds 1,051 918 893 820 1,049 979 1,015 1,053 1,015 1,049 956 792 -17%<br />
New Zeal<strong>an</strong>d 23 25 27 28 42 20 25 20 31 26 27 11 -59%<br />
Norway 813 644 686 665 878 816 721 824 891 768 670 677 1%<br />
Pol<strong>an</strong>d 126 259 331 294 355 387 373 589 525 720 658 573 -13%<br />
Portugal 10 20 13 16 22 15 31 22 39 25 15 47 213%<br />
Rep. of Korea 60 42 56 83 74 71 72 92 69 148 109 135 24%<br />
Rom<strong>an</strong>ia 49 86 123 94 93 108 254 191 134 256 210 122 -42%<br />
Serbia (<strong>an</strong>d Kosovo:<br />
S/RES/1244 (1999))<br />
128 201 223 273 293 407 348 424 377 224 253 169 -33%<br />
- of which Kosovo 31 61 18 22 10 10 6 5 2 5 13 5 -62%<br />
Slovakia 33 43 29 22 37 39 43 41 37 61 39 23 -41%<br />
Slovenia 31 33 28 13 22 47 21 15 29 25 12 31 158%<br />
Spain 238 333 366 430 363 217 173 281 371 260 206 176 -15%<br />
Sweden 1,963 1,948 2,303 2,040 2,378 1,963 2,063 2,567 2,795 3,022 3,112 3,494 12%<br />
Switzerl<strong>an</strong>d 1,058 1,062 1,602 1,303 2,019 1,436 1,468 1,485 1,774 1,826 2,219 2,187 -1%<br />
The former Yugoslav<br />
Rep. of Macedonia<br />
64 37 47 78 77 62 40 80 93 38 42 82 95%<br />
Turkey 914 848 891 713 785 1,030 1,167 1,501 1,345 1,365 1,186 4,276 261%<br />
United Kingdom 2,045 1,890 2,140 1,940 2,005 2,155 2,285 2,000 2,160 2,115 2,540 2,135 -16%<br />
United States 5,546 5,002 6,753 5,672 6,362 7,329 6,011 6,875 6,026 6,170 6,200 6,073 -2%<br />
EU-“Old” (15) 18,244 18,943 21,315 18,771 21,671 19,019 19,939 20,363 22,146 22,529 21,944 21,285 -3%<br />
EU-“New” (12) 718 842 945 1,967 1,307 1,125 1,163 1,356 1,285 1,691 1,552 1,214 -22%<br />
EU-Total (27) 18,962 19,785 22,260 20,738 22,978 20,144 21,102 21,719 23,431 24,220 23,496 22,499 -4%<br />
Nordic countries (5) 3,399 3,082 3,556 3,198 3,780 3,272 3,283 3,953 4,363 4,508 4,424 4,852 10%<br />
Western Europe (19) 20,124 20,656 23,623 20,755 24,585 21,279 22,134 22,699 24,821 25,133 24,841 24,158 -3%<br />
Southern Europe (8) 2,553 3,908 4,203 4,320 5,820 4,301 4,029 3,822 4,197 3,903 3,462 6,247 80%<br />
Total Europe (38) 21,995 22,651 25,787 23,828 27,158 24,030 24,946 26,147 27,997 28,559 28,021 30,038 7%<br />
© 2012 United Nations High Comm<strong>is</strong>sioner for Refugees<br />
All rights reserved. Reproductions <strong>an</strong>d tr<strong>an</strong>slations are<br />
authorized, provided UNHCR <strong>is</strong> acknowledged as the source.<br />
For more information, please contact:<br />
Field Information <strong>an</strong>d Coordination Support Section<br />
div<strong>is</strong>ion of Programme Support <strong>an</strong>d M<strong>an</strong>agement<br />
Case Postale 2500<br />
1211 Geneva, Switzerl<strong>an</strong>d<br />
stats@<strong>unhcr</strong>.org<br />
Th<strong>is</strong> document along with further information on global<br />
d<strong>is</strong>placement <strong>is</strong> available on UNHCR’s Stat<strong>is</strong>tics website:<br />
http://www.<strong>unhcr</strong>.org/stat<strong>is</strong>tics<br />
<strong>an</strong>d<br />
UNHCR’s Stat<strong>is</strong>tical Online Population database:<br />
http://www.<strong>unhcr</strong>.org/stat<strong>is</strong>tics/populationdatabase<br />
Cover photo: An Itali<strong>an</strong> coastguard boat approaches<br />
the <strong>is</strong>l<strong>an</strong>d of Lampedusa to d<strong>is</strong>embark 142 persons, including<br />
some <strong>asylum</strong>-<strong>seeker</strong>s, mostly from West Africa. Their boat<br />
s<strong>an</strong>k on its way from North Africa to Lampedusa.<br />
© unhCR / F.NOY<br />
page design <strong>an</strong>d layout: julie schneider<br />
produced <strong>an</strong>d printed by <strong>unhcr</strong> (27 march 2012).<br />
C<strong>an</strong>ada/USA 7,421 6,938 8,891 7,508 8,177 9,245 7,540 9,002 8,738 8,915 8,822 8,169 -7%<br />
Australia/New Z. 1,082 740 876 876 989 557 568 1,020 1,257 1,196 1,376 1,281 -7%<br />
Jap<strong>an</strong>/Rep. of Korea 170 199 193 281 202 211 237 246 232 335 277 295 6%<br />
Total non-Europe (6) 8,673 7,877 9,960 8,665 9,368 10,013 8,345 10,268 10,227 10,446 10,475 9,745 -7%<br />
Total (44) 30,668 30,528 35,747 32,493 36,526 34,043 33,291 36,415 38,224 39,005 38,496 39,783 3%<br />
Notes<br />
* Th<strong>is</strong> table excludes some 16,000 <strong>asylum</strong> applications lodged in Italy in 2011 due to lack of detailed data.<br />
See notes Table 1.<br />
46 Asylum Levels <strong>an</strong>d Trends in Industrialized Countries - 2011 Asylum Levels <strong>an</strong>d Trends in Industrialized Countries - 2011<br />
47
With ever tighter border controls thous<strong>an</strong>ds of refugees c<strong>an</strong>not reach safety.<br />
1 refugee denied a safe haven<br />
<strong>is</strong> too m<strong>an</strong>y.<br />
© UNHCR / S. Rich<br />
www.<strong>unhcr</strong>.org