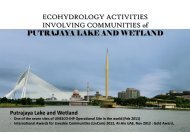
putrajaya lake
putrajaya lake
putrajaya lake

Create successful ePaper yourself
Turn your PDF publications into a flip-book with our unique Google optimized e-Paper software.
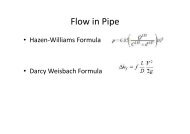
NATIONAL SEMINAR ON<br />
ECOSYSTEM MANAGEMENT FOR LAKES AND WETLANDS PUTRAJAYA 2013<br />
HYDRODYNAMIC AND ECOSYSTEM MODELLING<br />
OF PUTRAJAYA LAKE<br />
Dr. Zati Sharip<br />
Head Lake Research Unit<br />
Research Centre for Water Quality and Environment<br />
National Hydraulic Research Institute of Malaysia (NAHRIM)
Zati Sharip 1 , Normaliza Noordin 2 , Jarina M.Saman 2 ,<br />
Saim Suratman 1 , Ahmad Jamalluddin Shaaban 1 & Akashah Hj Majizat 2<br />
1<br />
National Hydraulic Research Institute of Malaysia (NAHRIM)<br />
2<br />
Lake and Wetland Unit, Putrajaya Corporation
Outlines<br />
• Introduction<br />
• Description of the Putrajaya Lake<br />
• Objectives<br />
• Materials and method<br />
• Data Collection<br />
• Model set up and simulation<br />
• Results<br />
• Summary
Malaysia’s administrative Centre<br />
Photo: Perbadanan Putrajaya<br />
PUTRAJAYA LAKE<br />
A scenic and self-sustaining ecosystem for<br />
recreation, sports and tourism
PUTRAJAYA LAKE AND WETLANDS<br />
• Part of Langat River<br />
Basin<br />
Langat River<br />
• Catchment area 51.0<br />
km 2<br />
• 56% discharges<br />
into wetlands<br />
• 44% flows directly<br />
into <strong>lake</strong>
THE PUTRAJAYA LAKE<br />
• Surface area of<br />
400 hectares<br />
• An average depth<br />
of 6.6 m<br />
• Mean hydraulic<br />
retention time of<br />
132 days<br />
Natural filtration system<br />
Source: Perbadanan Putrajaya
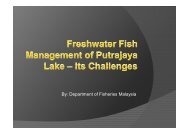
Challenges<br />
• Increasing development & land use<br />
changes<br />
• Vulnerable to pollution<br />
• The need to retain <strong>lake</strong> water quality at<br />
high standard<br />
‣ Integrated catchment management<br />
‣ Continuous environmental monitoring<br />
‣ Development of Ecosystem model
Objectives<br />
• To understand the ecohydrological<br />
dynamic for<br />
sustainable management of<br />
these urban water-bodies<br />
• To monitor the aquatic<br />
environment response to the<br />
increasing development and<br />
land-use changes, coupled<br />
with climate variations
Methodology<br />
Field Data:<br />
Meteorological, flow, Bathymetry<br />
Hydrodynamic model<br />
Ecosystem model<br />
Field data:<br />
Water quality, biological<br />
Calibration and verification<br />
Analysis
Data Collection<br />
Weather monitoring station<br />
Rainfall station<br />
Flow Measurement<br />
Water level Measurement<br />
Presint 13<br />
Presint 11<br />
Presint 1<br />
Presint 7<br />
Presint 2<br />
• Weather and rainfall<br />
monitoring<br />
Dam<br />
• Water level and flow<br />
measurement
Data Collection<br />
Biological Measurement<br />
WQ Measurement<br />
Diurnal WQ Measurement<br />
• Water quality measurement<br />
(monthly, bi-weekly, diurnal)<br />
Seri Wawasan<br />
Brudge<br />
Seri<br />
Bistari<br />
Bridge<br />
Photo: Perbadanan Putrajaya<br />
• Biological surveys<br />
Dam<br />
Photo: Perbadanan Putrajaya
Model set-up and assumptions<br />
• Lake shoreline and depth<br />
data - bathymetry survey<br />
• Complex morphology<br />
• Depth varies from ~ 3m<br />
(upstream) to ~14 m<br />
(downstream)<br />
0 305 610 m
Model set-up and assumptions<br />
• Grid size 100m x 100m<br />
• Inflow estimation based on<br />
designed flow ratio<br />
• Exclusion of groundwater<br />
exchange<br />
• Simulation period – dry<br />
season
Model Coupling<br />
Hydrodynamic Model<br />
Scalar transport<br />
Thermodynamics<br />
Boundary Conditions<br />
Initial Conditions<br />
Ecosystem Model<br />
Water Quality<br />
Biochemical<br />
parameters
Results<br />
Wind speed<br />
(m/s)<br />
Rainfall (mm)<br />
Air T (oC)<br />
6<br />
4<br />
2<br />
0<br />
07/05 17/05 27/05 06/06 16/06 26/06 06/07 16/07 26/07 05/08<br />
40<br />
20<br />
0<br />
07/05 17/05 27/05 06/06 16/06 26/06 06/07 16/07 26/07 05/08<br />
40<br />
30<br />
20<br />
07/05 17/05 27/05 06/06 16/06 26/06 06/07 16/07 26/07 05/08<br />
• Low wind<br />
speed<br />
• Low <strong>lake</strong><br />
inflow<br />
• High solar<br />
radiation<br />
Humidity (%)<br />
100<br />
50<br />
0<br />
07/05 17/05 27/05 06/06 16/06 26/06 06/07 16/07 26/07 05/08<br />
30<br />
Solar radiation<br />
(MJ/m2)<br />
20<br />
10<br />
0<br />
07/05 17/05 27/05 06/06 16/06 26/06 06/07 16/07 26/07 05/08
Diurnal variation<br />
a) Seri Bistari Bridge<br />
(a)<br />
T (oC)<br />
32<br />
31<br />
30<br />
0.3 m<br />
2.1 m<br />
4.4 m<br />
DO (mg/L)<br />
8<br />
6<br />
4<br />
0.3 m 2.1 m 4.4.m<br />
12:00 00:00 12:00<br />
2<br />
12:00 00:00 12:00<br />
b) Seri Wawasan Bridge<br />
(b)<br />
T (oC)<br />
32<br />
31<br />
30<br />
0.3 m<br />
2.2 m<br />
4.6 m<br />
12:00 00:00 12:00<br />
DO (mg/L)<br />
8<br />
6<br />
4<br />
2<br />
0.3 m 2.2 m 4.6 m<br />
12:00 00:00 12:00<br />
32<br />
0.3 m<br />
5.5 m<br />
8<br />
0.3 m 5.5 m 11.0 m<br />
c) Dam<br />
(c)<br />
T (oC)<br />
31<br />
30<br />
11.0 m<br />
DO (mg/L)<br />
6<br />
4<br />
12:00 00:00 12:00<br />
2<br />
12:00 00:00 12:00
Results<br />
• Water quality levels comply with the Class IIB<br />
requirement<br />
• Some parameters exceed the Putrajaya Lake and<br />
Wetlands Water Quality Standards<br />
• chlorophyll, total coliform and ammoniacal-N<br />
• TSI – Mesotrophic; TP
Results<br />
T (deg C)<br />
T (deg C)<br />
32<br />
31<br />
30<br />
04:48 09:36 14:24 19:12 00:00 04:48 09:36<br />
32<br />
31<br />
30<br />
04:48 09:36 14:24 19:12 00:00 04:48 09:36<br />
Reasonably matched<br />
between simulated and<br />
observed variables<br />
•Temperature<br />
•DO<br />
T (deg C)<br />
32<br />
31<br />
30<br />
04:48 09:36 14:24 19:12 00:00 04:48 09:36
Results<br />
Dissolved oxygen<br />
Phytoplankton<br />
Distribution of water quality during initial condition
Results<br />
High-wind event<br />
• South-west<br />
Simulated velocity under different wind condition
Results<br />
• Convective motion<br />
• Differential<br />
cooling<br />
Low-wind event<br />
Simulated velocity under different wind condition
Results<br />
High-wind event<br />
Low-wind event<br />
Simulated DO and phytoplankton under different wind condition
Summary<br />
• Coupled hydrodynamic and ecosystem modeling<br />
• Guide intensive and coordinated data collection<br />
program<br />
• Provide understanding on the eco-hydrological<br />
dynamic in <strong>lake</strong>s<br />
• Useful to monitor the aquatic environment<br />
response to the increasing development and landuse<br />
changes, coupled with climate variations
Way forward<br />
‣ Long-term simulation & validation<br />
‣ Continuous & intensive data<br />
‣ Model simulation to predict pollution scenarios<br />
and recommend mitigation program
Thank you<br />
For further details:<br />
Dr. Zati Sharip<br />
Lake Research Unit<br />
Research Centre for Water Quality and Env.<br />
National Hydraulic Research Institute of Malaysia<br />
Lot 5377, Jalan Putra Permai<br />
43300 Seri Kembangan, Selangor<br />
Email: zati@nahrim.gov.my<br />
Hj. Akashah Majizat<br />
Lake and Wetland Unit<br />
Putrajaya Corporation,<br />
24 Lebuh Perdana, Presint 3,<br />
62675 Putrajaya, Malaysia<br />
Email: akashah@ppj.gov.my