census
census
census

Create successful ePaper yourself
Turn your PDF publications into a flip-book with our unique Google optimized e-Paper software.
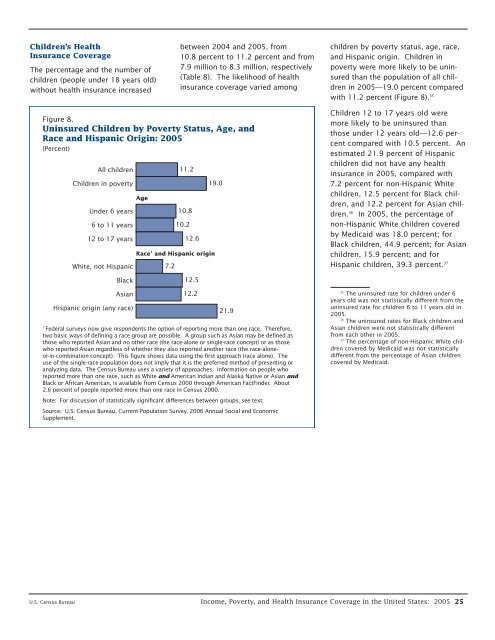
Children’s Health<br />
Insurance Coverage<br />
The percentage and the number of<br />
children (people under 18 years old)<br />
without health insurance increased<br />
between 2004 and 2005, from<br />
10.8 percent to 11.2 percent and from<br />
7.9 million to 8.3 million, respectively<br />
(Table 8). The likelihood of health<br />
insurance coverage varied among<br />
children by poverty status, age, race,<br />
and Hispanic origin. Children in<br />
poverty were more likely to be uninsured<br />
than the population of all children<br />
in 2005—19.0 percent compared<br />
with 11.2 percent (Figure 8). 35<br />
Figure 8.<br />
Uninsured Children by Poverty Status, Age, and<br />
Race and Hispanic Origin: 2005<br />
(Percent)<br />
All children<br />
Children in poverty<br />
Under 6 years<br />
6 to 11 years<br />
12 to 17 years<br />
White, not Hispanic<br />
Age<br />
7.2<br />
11.2<br />
10.8<br />
10.2<br />
12.6<br />
Race 1 and Hispanic origin<br />
19.0<br />
Children 12 to 17 years old were<br />
more likely to be uninsured than<br />
those under 12 years old—12.6 percent<br />
compared with 10.5 percent. An<br />
estimated 21.9 percent of Hispanic<br />
children did not have any health<br />
insurance in 2005, compared with<br />
7.2 percent for non-Hispanic White<br />
children, 12.5 percent for Black children,<br />
and 12.2 percent for Asian children.<br />
36 In 2005, the percentage of<br />
non-Hispanic White children covered<br />
by Medicaid was 18.0 percent; for<br />
Black children, 44.9 percent; for Asian<br />
children, 15.9 percent; and for<br />
Hispanic children, 39.3 percent. 37<br />
Black<br />
12.5<br />
Asian<br />
Hispanic origin (any race)<br />
12.2<br />
21.9<br />
1 Federal surveys now give respondents the option of reporting more than one race. Therefore,<br />
two basic ways of defining a race group are possible. A group such as Asian may be defined as<br />
those who reported Asian and no other race (the race-alone or single-race concept) or as those<br />
who reported Asian regardless of whether they also reported another race (the race-aloneor-in-combination<br />
concept). This figure shows data using the first approach (race alone). The<br />
use of the single-race population does not imply that it is the preferred method of presenting or<br />
analyzing data. The Census Bureau uses a variety of approaches. Information on people who<br />
reported more than one race, such as White and American Indian and Alaska Native or Asian and<br />
Black or African American, is available from Census 2000 through American FactFinder. About<br />
2.6 percent of people reported more than one race in Census 2000.<br />
Note: For discussion of statistically significant differences between groups, see text.<br />
Source: U.S. Census Bureau, Current Population Survey, 2006 Annual Social and Economic<br />
Supplement.<br />
35<br />
The uninsured rate for children under 6<br />
years old was not statistically different from the<br />
uninsured rate for children 6 to 11 years old in<br />
2005.<br />
36<br />
The uninsured rates for Black children and<br />
Asian children were not statistically different<br />
from each other in 2005.<br />
37<br />
The percentage of non-Hispanic White children<br />
covered by Medicaid was not statistically<br />
different from the percentage of Asian children<br />
covered by Medicaid.<br />
U.S. Census Bureau Income, Poverty, and Health Insurance Coverage in the United States: 2005 25